Alsatian vs Czechoslovakian Unemployment Among Seniors over 65 years
COMPARE
Alsatian
Czechoslovakian
Unemployment Among Seniors over 65 years
Unemployment Among Seniors over 65 years Comparison
Alsatians
Czechoslovakians
5.2%
UNEMPLOYMENT AMONG SENIORS OVER 65 YEARS
11.4/ 100
METRIC RATING
209th/ 347
METRIC RANK
5.0%
UNEMPLOYMENT AMONG SENIORS OVER 65 YEARS
96.7/ 100
METRIC RATING
98th/ 347
METRIC RANK
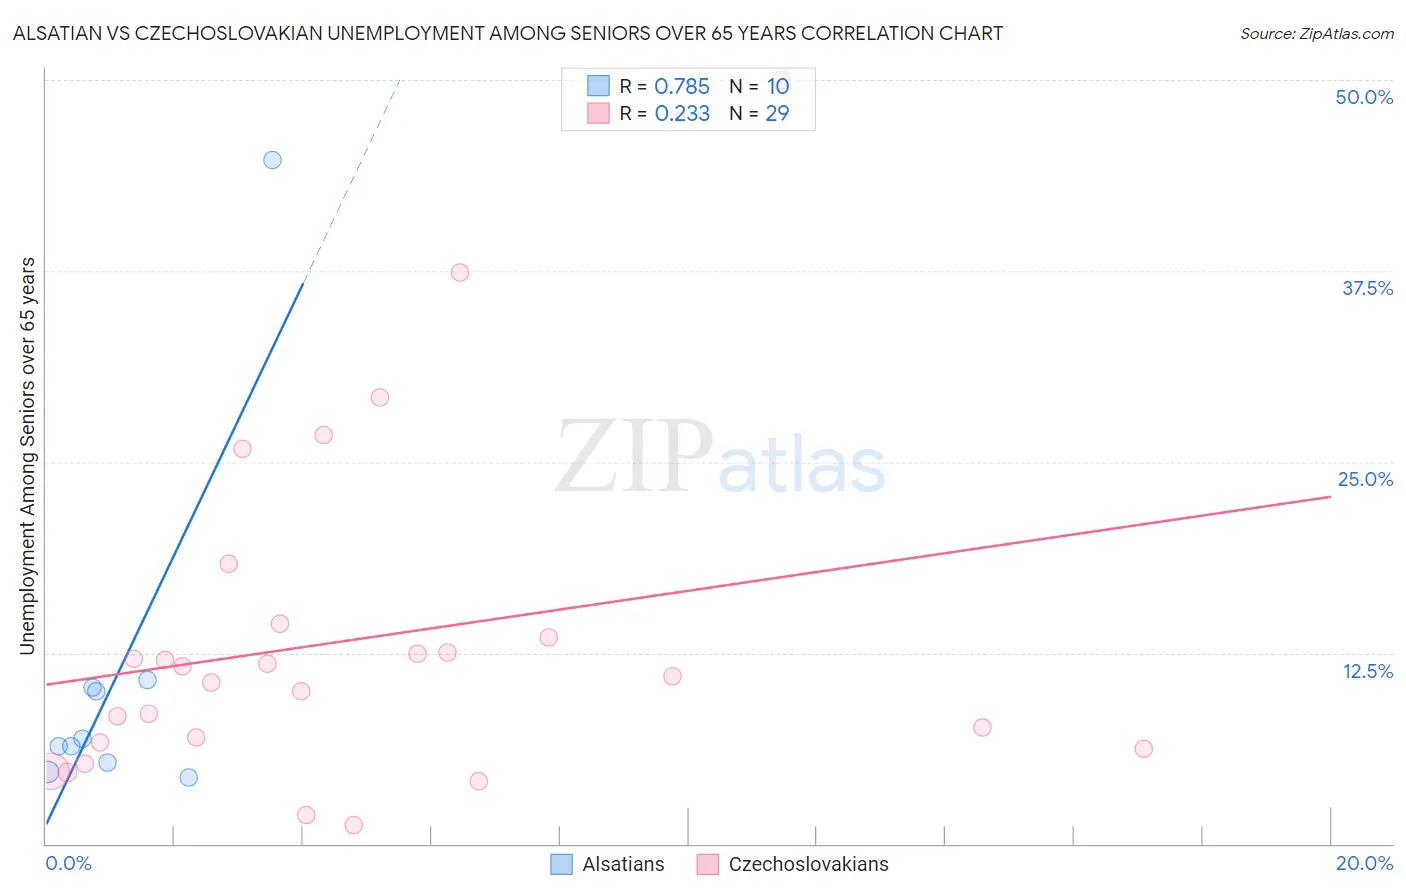
Alsatian vs Czechoslovakian Unemployment Among Seniors over 65 years Correlation Chart
The statistical analysis conducted on geographies consisting of 80,027,766 people shows a strong positive correlation between the proportion of Alsatians and unemployment rate amomg seniors over the age of 65 in the United States with a correlation coefficient (R) of 0.785 and weighted average of 5.2%. Similarly, the statistical analysis conducted on geographies consisting of 328,703,757 people shows a weak positive correlation between the proportion of Czechoslovakians and unemployment rate amomg seniors over the age of 65 in the United States with a correlation coefficient (R) of 0.233 and weighted average of 5.0%, a difference of 4.5%.
Unemployment Among Seniors over 65 years Correlation Summary
| Measurement | Alsatian | Czechoslovakian |
| Minimum | 4.3% | 1.2% |
| Maximum | 44.8% | 50.0% |
| Range | 40.5% | 48.8% |
| Mean | 11.0% | 13.3% |
| Median | 6.6% | 11.0% |
| Interquartile 25% (IQ1) | 5.3% | 6.4% |
| Interquartile 75% (IQ3) | 10.3% | 14.0% |
| Interquartile Range (IQR) | 5.0% | 7.5% |
| Standard Deviation (Sample) | 12.1% | 11.0% |
| Standard Deviation (Population) | 11.5% | 10.8% |
Similar Demographics by Unemployment Among Seniors over 65 years
Demographics Similar to Alsatians by Unemployment Among Seniors over 65 years
In terms of unemployment among seniors over 65 years, the demographic groups most similar to Alsatians are Immigrants from Uzbekistan (5.2%, a difference of 0.050%), African (5.2%, a difference of 0.080%), Uruguayan (5.2%, a difference of 0.090%), Immigrants from Honduras (5.2%, a difference of 0.090%), and Immigrants from Philippines (5.2%, a difference of 0.14%).
| Demographics | Rating | Rank | Unemployment Among Seniors over 65 years |
| Immigrants | Northern Africa | 17.7 /100 | #202 | Poor 5.2% |
| Sub-Saharan Africans | 17.1 /100 | #203 | Poor 5.2% |
| Immigrants | China | 16.9 /100 | #204 | Poor 5.2% |
| South American Indians | 15.3 /100 | #205 | Poor 5.2% |
| German Russians | 14.7 /100 | #206 | Poor 5.2% |
| Immigrants | Philippines | 13.2 /100 | #207 | Poor 5.2% |
| Uruguayans | 12.6 /100 | #208 | Poor 5.2% |
| Alsatians | 11.4 /100 | #209 | Poor 5.2% |
| Immigrants | Uzbekistan | 10.7 /100 | #210 | Poor 5.2% |
| Africans | 10.4 /100 | #211 | Poor 5.2% |
| Immigrants | Honduras | 10.2 /100 | #212 | Poor 5.2% |
| Immigrants | Uruguay | 9.3 /100 | #213 | Tragic 5.2% |
| Albanians | 9.1 /100 | #214 | Tragic 5.2% |
| Immigrants | Fiji | 8.6 /100 | #215 | Tragic 5.2% |
| Cajuns | 8.5 /100 | #216 | Tragic 5.2% |
Demographics Similar to Czechoslovakians by Unemployment Among Seniors over 65 years
In terms of unemployment among seniors over 65 years, the demographic groups most similar to Czechoslovakians are Assyrian/Chaldean/Syriac (5.0%, a difference of 0.010%), Immigrants from Singapore (5.0%, a difference of 0.010%), Immigrants from Oceania (5.0%, a difference of 0.010%), Burmese (5.0%, a difference of 0.030%), and South African (5.0%, a difference of 0.050%).
| Demographics | Rating | Rank | Unemployment Among Seniors over 65 years |
| Immigrants | Bolivia | 97.3 /100 | #91 | Exceptional 5.0% |
| Immigrants | Bulgaria | 97.3 /100 | #92 | Exceptional 5.0% |
| Austrians | 97.3 /100 | #93 | Exceptional 5.0% |
| Burmese | 96.8 /100 | #94 | Exceptional 5.0% |
| Assyrians/Chaldeans/Syriacs | 96.8 /100 | #95 | Exceptional 5.0% |
| Immigrants | Singapore | 96.8 /100 | #96 | Exceptional 5.0% |
| Immigrants | Oceania | 96.8 /100 | #97 | Exceptional 5.0% |
| Czechoslovakians | 96.7 /100 | #98 | Exceptional 5.0% |
| South Africans | 96.5 /100 | #99 | Exceptional 5.0% |
| Romanians | 95.5 /100 | #100 | Exceptional 5.0% |
| Yugoslavians | 95.4 /100 | #101 | Exceptional 5.0% |
| Immigrants | Thailand | 95.4 /100 | #102 | Exceptional 5.0% |
| Immigrants | Lithuania | 95.1 /100 | #103 | Exceptional 5.0% |
| Immigrants | Scotland | 95.0 /100 | #104 | Exceptional 5.0% |
| Okinawans | 94.7 /100 | #105 | Exceptional 5.0% |