Aleut vs Immigrants from Scotland Male Unemployment
COMPARE
Aleut
Immigrants from Scotland
Male Unemployment
Male Unemployment Comparison
Aleuts
Immigrants from Scotland
6.8%
MALE UNEMPLOYMENT
0.0/ 100
METRIC RATING
308th/ 347
METRIC RANK
4.9%
MALE UNEMPLOYMENT
98.9/ 100
METRIC RATING
48th/ 347
METRIC RANK
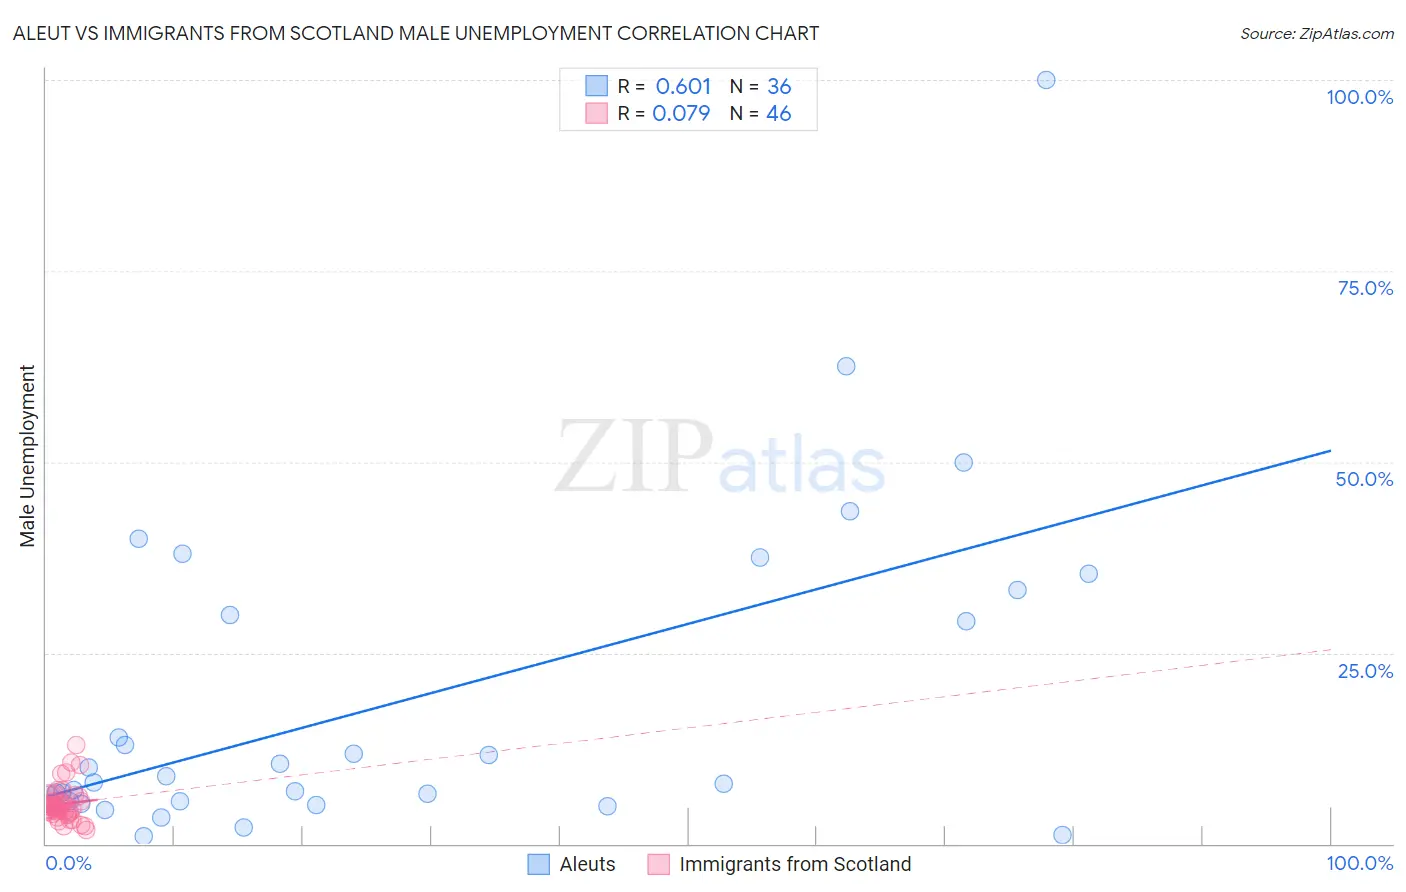
Aleut vs Immigrants from Scotland Male Unemployment Correlation Chart
The statistical analysis conducted on geographies consisting of 61,714,697 people shows a significant positive correlation between the proportion of Aleuts and unemployment rate among males in the United States with a correlation coefficient (R) of 0.601 and weighted average of 6.8%. Similarly, the statistical analysis conducted on geographies consisting of 195,967,214 people shows a slight positive correlation between the proportion of Immigrants from Scotland and unemployment rate among males in the United States with a correlation coefficient (R) of 0.079 and weighted average of 4.9%, a difference of 38.0%.
Male Unemployment Correlation Summary
| Measurement | Aleut | Immigrants from Scotland |
| Minimum | 1.0% | 1.8% |
| Maximum | 100.0% | 13.0% |
| Range | 99.0% | 11.2% |
| Mean | 18.7% | 5.2% |
| Median | 8.4% | 4.9% |
| Interquartile 25% (IQ1) | 5.6% | 4.1% |
| Interquartile 75% (IQ3) | 31.7% | 5.5% |
| Interquartile Range (IQR) | 26.1% | 1.4% |
| Standard Deviation (Sample) | 21.2% | 2.2% |
| Standard Deviation (Population) | 20.9% | 2.2% |
Similar Demographics by Male Unemployment
Demographics Similar to Aleuts by Male Unemployment
In terms of male unemployment, the demographic groups most similar to Aleuts are Barbadian (6.9%, a difference of 0.41%), Black/African American (6.9%, a difference of 1.1%), Immigrants from Armenia (6.9%, a difference of 1.4%), Lumbee (6.9%, a difference of 1.6%), and Immigrants from Jamaica (6.7%, a difference of 1.9%).
| Demographics | Rating | Rank | Male Unemployment |
| Immigrants | Belize | 0.0 /100 | #301 | Tragic 6.6% |
| Ute | 0.0 /100 | #302 | Tragic 6.6% |
| Immigrants | West Indies | 0.0 /100 | #303 | Tragic 6.7% |
| West Indians | 0.0 /100 | #304 | Tragic 6.7% |
| Trinidadians and Tobagonians | 0.0 /100 | #305 | Tragic 6.7% |
| Immigrants | Trinidad and Tobago | 0.0 /100 | #306 | Tragic 6.7% |
| Immigrants | Jamaica | 0.0 /100 | #307 | Tragic 6.7% |
| Aleuts | 0.0 /100 | #308 | Tragic 6.8% |
| Barbadians | 0.0 /100 | #309 | Tragic 6.9% |
| Blacks/African Americans | 0.0 /100 | #310 | Tragic 6.9% |
| Immigrants | Armenia | 0.0 /100 | #311 | Tragic 6.9% |
| Lumbee | 0.0 /100 | #312 | Tragic 6.9% |
| Immigrants | Dominica | 0.0 /100 | #313 | Tragic 7.0% |
| Immigrants | Barbados | 0.0 /100 | #314 | Tragic 7.1% |
| Houma | 0.0 /100 | #315 | Tragic 7.1% |
Demographics Similar to Immigrants from Scotland by Male Unemployment
In terms of male unemployment, the demographic groups most similar to Immigrants from Scotland are Polish (4.9%, a difference of 0.010%), Austrian (4.9%, a difference of 0.020%), Croatian (4.9%, a difference of 0.020%), Slovene (5.0%, a difference of 0.060%), and Irish (5.0%, a difference of 0.080%).
| Demographics | Rating | Rank | Male Unemployment |
| Chinese | 99.3 /100 | #41 | Exceptional 4.9% |
| Immigrants | Belgium | 99.2 /100 | #42 | Exceptional 4.9% |
| Immigrants | Japan | 99.2 /100 | #43 | Exceptional 4.9% |
| Immigrants | Korea | 99.1 /100 | #44 | Exceptional 4.9% |
| Immigrants | Zimbabwe | 99.0 /100 | #45 | Exceptional 4.9% |
| Bhutanese | 98.9 /100 | #46 | Exceptional 4.9% |
| Austrians | 98.9 /100 | #47 | Exceptional 4.9% |
| Immigrants | Scotland | 98.9 /100 | #48 | Exceptional 4.9% |
| Poles | 98.9 /100 | #49 | Exceptional 4.9% |
| Croatians | 98.9 /100 | #50 | Exceptional 4.9% |
| Slovenes | 98.8 /100 | #51 | Exceptional 5.0% |
| Irish | 98.8 /100 | #52 | Exceptional 5.0% |
| Jordanians | 98.8 /100 | #53 | Exceptional 5.0% |
| Yugoslavians | 98.7 /100 | #54 | Exceptional 5.0% |
| Czechoslovakians | 98.7 /100 | #55 | Exceptional 5.0% |