Aleut vs Immigrants from Panama Seniors Poverty Over the Age of 75
COMPARE
Aleut
Immigrants from Panama
Seniors Poverty Over the Age of 75
Seniors Poverty Over the Age of 75 Comparison
Aleuts
Immigrants from Panama
11.5%
SENIORS POVERTY OVER THE AGE OF 75
94.1/ 100
METRIC RATING
90th/ 347
METRIC RANK
13.9%
SENIORS POVERTY OVER THE AGE OF 75
0.1/ 100
METRIC RATING
258th/ 347
METRIC RANK
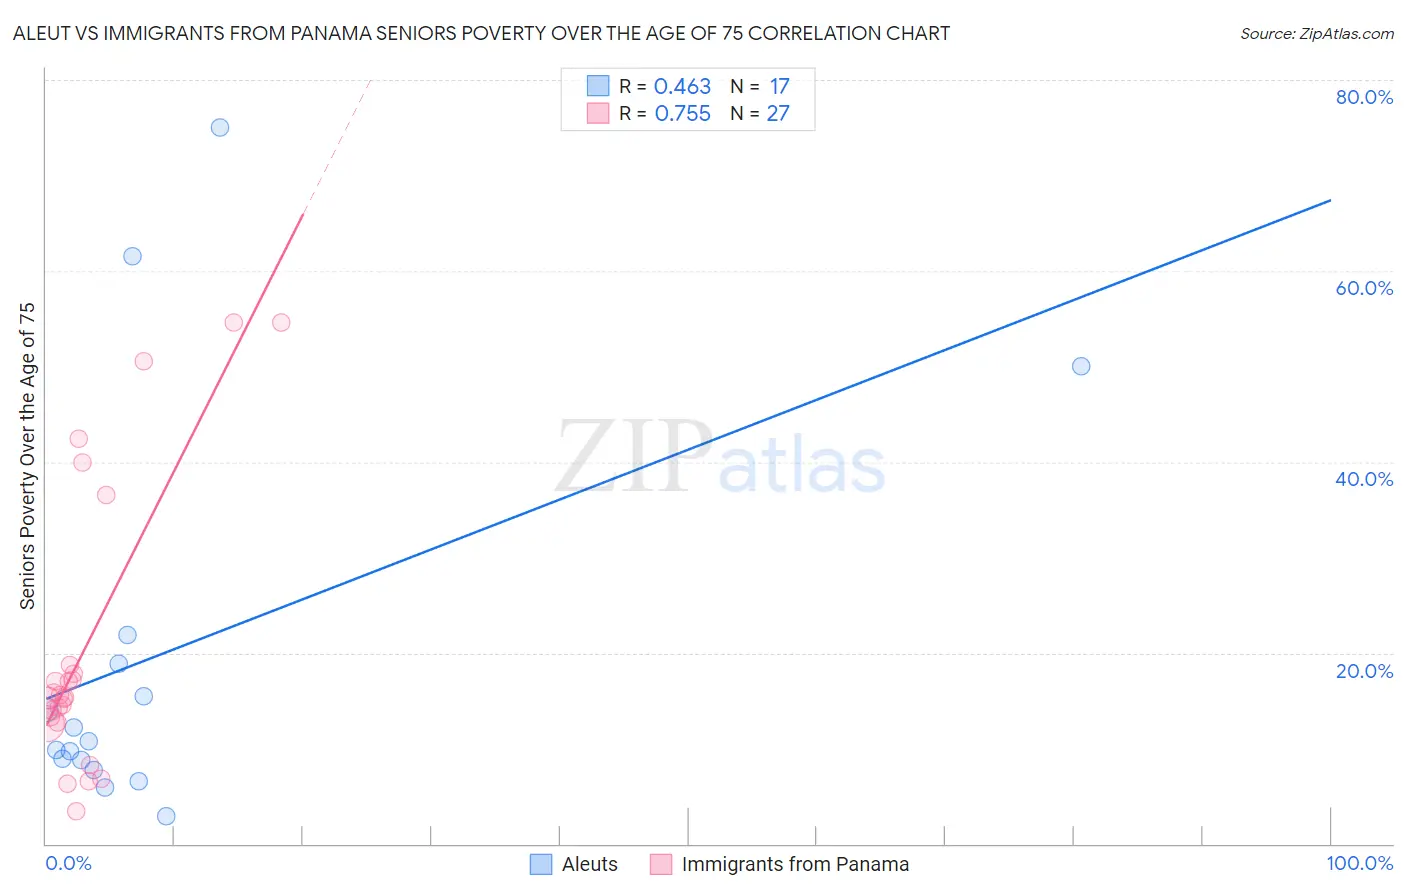
Aleut vs Immigrants from Panama Seniors Poverty Over the Age of 75 Correlation Chart
The statistical analysis conducted on geographies consisting of 61,466,787 people shows a moderate positive correlation between the proportion of Aleuts and poverty level among seniors over the age of 75 in the United States with a correlation coefficient (R) of 0.463 and weighted average of 11.5%. Similarly, the statistical analysis conducted on geographies consisting of 220,155,866 people shows a strong positive correlation between the proportion of Immigrants from Panama and poverty level among seniors over the age of 75 in the United States with a correlation coefficient (R) of 0.755 and weighted average of 13.9%, a difference of 21.1%.
Seniors Poverty Over the Age of 75 Correlation Summary
| Measurement | Aleut | Immigrants from Panama |
| Minimum | 2.9% | 3.4% |
| Maximum | 75.0% | 54.5% |
| Range | 72.1% | 51.2% |
| Mean | 20.0% | 20.6% |
| Median | 10.7% | 15.3% |
| Interquartile 25% (IQ1) | 8.3% | 12.7% |
| Interquartile 75% (IQ3) | 20.4% | 18.8% |
| Interquartile Range (IQR) | 12.1% | 6.1% |
| Standard Deviation (Sample) | 21.1% | 15.0% |
| Standard Deviation (Population) | 20.5% | 14.7% |
Similar Demographics by Seniors Poverty Over the Age of 75
Demographics Similar to Aleuts by Seniors Poverty Over the Age of 75
In terms of seniors poverty over the age of 75, the demographic groups most similar to Aleuts are Immigrants from Germany (11.5%, a difference of 0.020%), Kenyan (11.5%, a difference of 0.080%), Immigrants from Sri Lanka (11.5%, a difference of 0.11%), Immigrants from Croatia (11.5%, a difference of 0.15%), and Korean (11.5%, a difference of 0.16%).
| Demographics | Rating | Rank | Seniors Poverty Over the Age of 75 |
| Immigrants | South Africa | 94.9 /100 | #83 | Exceptional 11.5% |
| Immigrants | Iraq | 94.9 /100 | #84 | Exceptional 11.5% |
| Immigrants | Bulgaria | 94.7 /100 | #85 | Exceptional 11.5% |
| Australians | 94.6 /100 | #86 | Exceptional 11.5% |
| Koreans | 94.5 /100 | #87 | Exceptional 11.5% |
| Immigrants | Croatia | 94.5 /100 | #88 | Exceptional 11.5% |
| Immigrants | Sri Lanka | 94.4 /100 | #89 | Exceptional 11.5% |
| Aleuts | 94.1 /100 | #90 | Exceptional 11.5% |
| Immigrants | Germany | 94.1 /100 | #91 | Exceptional 11.5% |
| Kenyans | 93.9 /100 | #92 | Exceptional 11.5% |
| Immigrants | Poland | 92.9 /100 | #93 | Exceptional 11.6% |
| Creek | 92.7 /100 | #94 | Exceptional 11.6% |
| Immigrants | Bosnia and Herzegovina | 92.6 /100 | #95 | Exceptional 11.6% |
| Immigrants | Sweden | 92.6 /100 | #96 | Exceptional 11.6% |
| Romanians | 92.3 /100 | #97 | Exceptional 11.6% |
Demographics Similar to Immigrants from Panama by Seniors Poverty Over the Age of 75
In terms of seniors poverty over the age of 75, the demographic groups most similar to Immigrants from Panama are Immigrants from Portugal (13.9%, a difference of 0.040%), Immigrants from Western Africa (13.9%, a difference of 0.090%), Immigrants (13.9%, a difference of 0.10%), Ghanaian (14.0%, a difference of 0.21%), and Cajun (14.0%, a difference of 0.44%).
| Demographics | Rating | Rank | Seniors Poverty Over the Age of 75 |
| Immigrants | Peru | 0.3 /100 | #251 | Tragic 13.7% |
| Immigrants | Argentina | 0.3 /100 | #252 | Tragic 13.7% |
| Immigrants | Spain | 0.2 /100 | #253 | Tragic 13.7% |
| Blackfeet | 0.2 /100 | #254 | Tragic 13.7% |
| Immigrants | Belarus | 0.2 /100 | #255 | Tragic 13.8% |
| Inupiat | 0.1 /100 | #256 | Tragic 13.8% |
| Immigrants | Western Africa | 0.1 /100 | #257 | Tragic 13.9% |
| Immigrants | Panama | 0.1 /100 | #258 | Tragic 13.9% |
| Immigrants | Portugal | 0.1 /100 | #259 | Tragic 13.9% |
| Immigrants | Immigrants | 0.1 /100 | #260 | Tragic 13.9% |
| Ghanaians | 0.1 /100 | #261 | Tragic 14.0% |
| Cajuns | 0.1 /100 | #262 | Tragic 14.0% |
| Iroquois | 0.1 /100 | #263 | Tragic 14.0% |
| South Americans | 0.0 /100 | #264 | Tragic 14.1% |
| Salvadorans | 0.0 /100 | #265 | Tragic 14.2% |