Aleut vs Yuman Cognitive Disability
COMPARE
Aleut
Yuman
Cognitive Disability
Cognitive Disability Comparison
Aleuts
Yuman
17.0%
COGNITIVE DISABILITY
89.9/ 100
METRIC RATING
141st/ 347
METRIC RANK
18.1%
COGNITIVE DISABILITY
0.2/ 100
METRIC RATING
276th/ 347
METRIC RANK
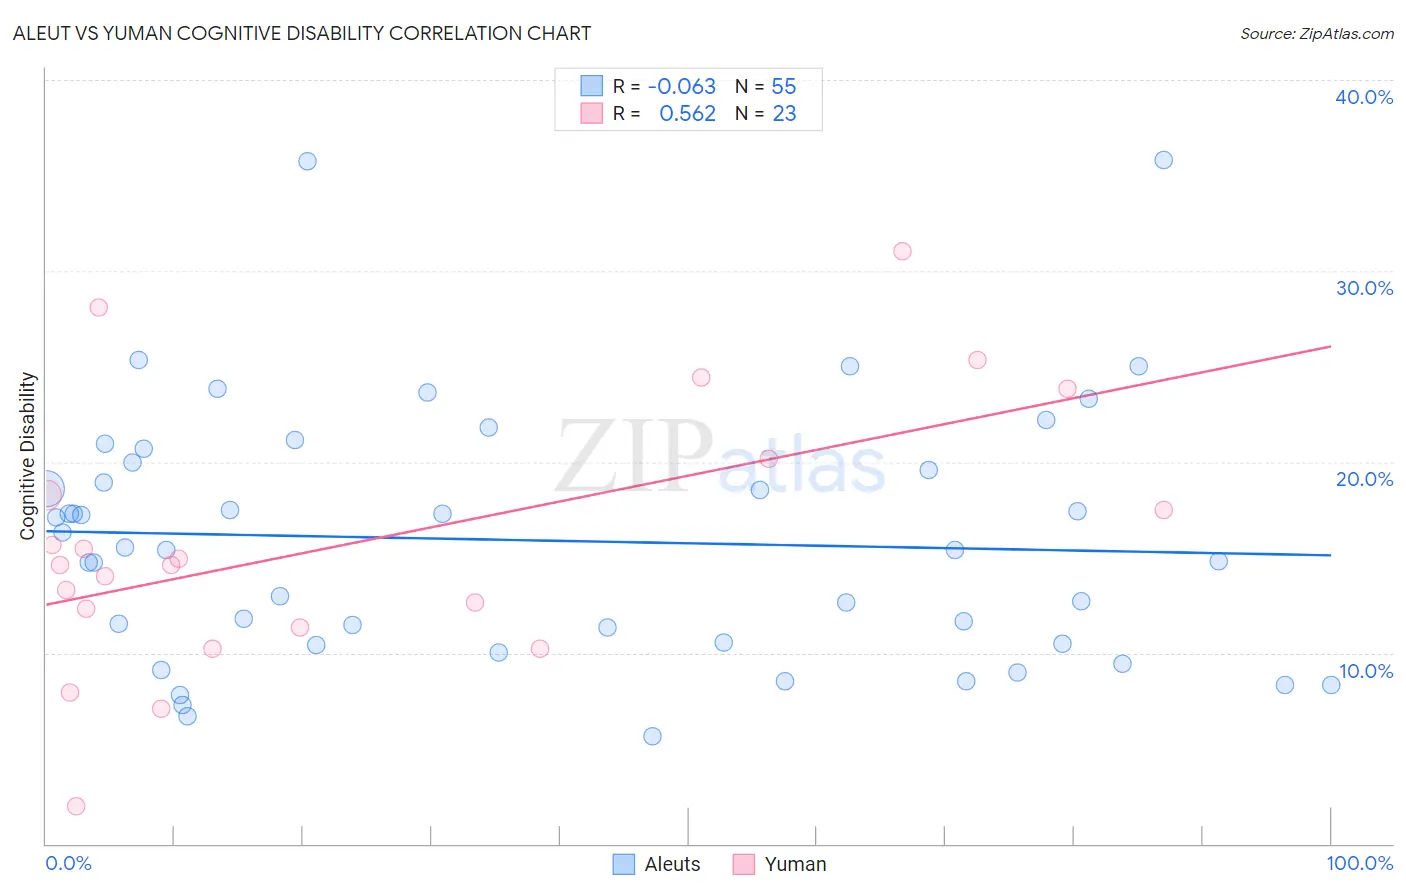
Aleut vs Yuman Cognitive Disability Correlation Chart
The statistical analysis conducted on geographies consisting of 61,782,027 people shows a slight negative correlation between the proportion of Aleuts and percentage of population with cognitive disability in the United States with a correlation coefficient (R) of -0.063 and weighted average of 17.0%. Similarly, the statistical analysis conducted on geographies consisting of 40,663,643 people shows a substantial positive correlation between the proportion of Yuman and percentage of population with cognitive disability in the United States with a correlation coefficient (R) of 0.562 and weighted average of 18.1%, a difference of 6.2%.
Cognitive Disability Correlation Summary
| Measurement | Aleut | Yuman |
| Minimum | 5.7% | 1.9% |
| Maximum | 35.8% | 31.0% |
| Range | 30.2% | 29.1% |
| Mean | 15.9% | 15.9% |
| Median | 15.4% | 14.6% |
| Interquartile 25% (IQ1) | 10.5% | 11.3% |
| Interquartile 75% (IQ3) | 20.0% | 20.2% |
| Interquartile Range (IQR) | 9.5% | 8.9% |
| Standard Deviation (Sample) | 6.6% | 7.0% |
| Standard Deviation (Population) | 6.6% | 6.9% |
Similar Demographics by Cognitive Disability
Demographics Similar to Aleuts by Cognitive Disability
In terms of cognitive disability, the demographic groups most similar to Aleuts are French (17.0%, a difference of 0.0%), Chilean (17.0%, a difference of 0.0%), Carpatho Rusyn (17.0%, a difference of 0.020%), British (17.0%, a difference of 0.050%), and Immigrants from Brazil (17.0%, a difference of 0.050%).
| Demographics | Rating | Rank | Cognitive Disability |
| Immigrants | Chile | 91.7 /100 | #134 | Exceptional 17.0% |
| Lebanese | 91.3 /100 | #135 | Exceptional 17.0% |
| Israelis | 91.0 /100 | #136 | Exceptional 17.0% |
| Immigrants | Norway | 90.9 /100 | #137 | Exceptional 17.0% |
| Welsh | 90.8 /100 | #138 | Exceptional 17.0% |
| French | 90.0 /100 | #139 | Excellent 17.0% |
| Chileans | 89.9 /100 | #140 | Excellent 17.0% |
| Aleuts | 89.9 /100 | #141 | Excellent 17.0% |
| Carpatho Rusyns | 89.6 /100 | #142 | Excellent 17.0% |
| British | 89.3 /100 | #143 | Excellent 17.0% |
| Immigrants | Brazil | 89.3 /100 | #144 | Excellent 17.0% |
| Immigrants | South Eastern Asia | 88.7 /100 | #145 | Excellent 17.0% |
| Costa Ricans | 88.0 /100 | #146 | Excellent 17.0% |
| Scotch-Irish | 85.9 /100 | #147 | Excellent 17.1% |
| French Canadians | 85.7 /100 | #148 | Excellent 17.1% |
Demographics Similar to Yuman by Cognitive Disability
In terms of cognitive disability, the demographic groups most similar to Yuman are Immigrants from Kuwait (18.1%, a difference of 0.0%), Immigrants from Micronesia (18.1%, a difference of 0.010%), Immigrants from Laos (18.1%, a difference of 0.040%), Chippewa (18.1%, a difference of 0.060%), and West Indian (18.1%, a difference of 0.070%).
| Demographics | Rating | Rank | Cognitive Disability |
| Hondurans | 0.3 /100 | #269 | Tragic 18.0% |
| Immigrants | Bahamas | 0.3 /100 | #270 | Tragic 18.0% |
| Potawatomi | 0.2 /100 | #271 | Tragic 18.0% |
| Immigrants | Honduras | 0.2 /100 | #272 | Tragic 18.0% |
| Immigrants | Nepal | 0.2 /100 | #273 | Tragic 18.0% |
| Immigrants | Nigeria | 0.2 /100 | #274 | Tragic 18.0% |
| Immigrants | Laos | 0.2 /100 | #275 | Tragic 18.1% |
| Yuman | 0.2 /100 | #276 | Tragic 18.1% |
| Immigrants | Kuwait | 0.2 /100 | #277 | Tragic 18.1% |
| Immigrants | Micronesia | 0.2 /100 | #278 | Tragic 18.1% |
| Chippewa | 0.1 /100 | #279 | Tragic 18.1% |
| West Indians | 0.1 /100 | #280 | Tragic 18.1% |
| Yakama | 0.1 /100 | #281 | Tragic 18.1% |
| Immigrants | Cambodia | 0.1 /100 | #282 | Tragic 18.1% |
| Nigerians | 0.1 /100 | #283 | Tragic 18.1% |