Malaysian vs Afghan Cognitive Disability
COMPARE
Malaysian
Afghan
Cognitive Disability
Cognitive Disability Comparison
Malaysians
Afghans
17.9%
COGNITIVE DISABILITY
0.6/ 100
METRIC RATING
251st/ 347
METRIC RANK
17.3%
COGNITIVE DISABILITY
38.2/ 100
METRIC RATING
185th/ 347
METRIC RANK
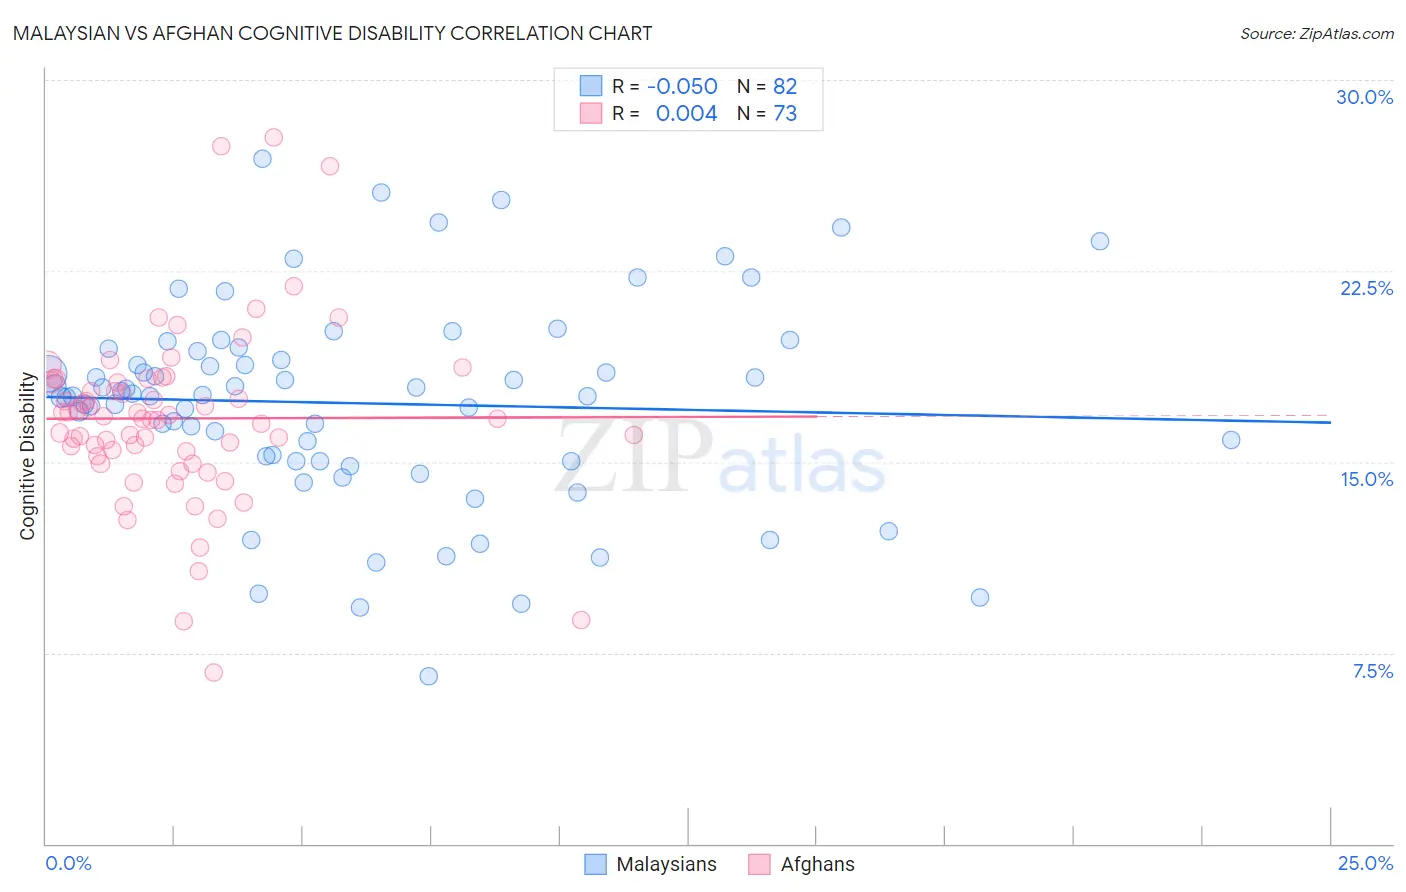
Malaysian vs Afghan Cognitive Disability Correlation Chart
The statistical analysis conducted on geographies consisting of 226,070,316 people shows a slight negative correlation between the proportion of Malaysians and percentage of population with cognitive disability in the United States with a correlation coefficient (R) of -0.050 and weighted average of 17.9%. Similarly, the statistical analysis conducted on geographies consisting of 148,870,382 people shows no correlation between the proportion of Afghans and percentage of population with cognitive disability in the United States with a correlation coefficient (R) of 0.004 and weighted average of 17.3%, a difference of 3.2%.
Cognitive Disability Correlation Summary
| Measurement | Malaysian | Afghan |
| Minimum | 6.6% | 6.7% |
| Maximum | 26.9% | 27.8% |
| Range | 20.3% | 21.0% |
| Mean | 17.3% | 16.7% |
| Median | 17.6% | 16.7% |
| Interquartile 25% (IQ1) | 15.0% | 15.3% |
| Interquartile 75% (IQ3) | 19.3% | 18.2% |
| Interquartile Range (IQR) | 4.3% | 2.9% |
| Standard Deviation (Sample) | 4.0% | 3.5% |
| Standard Deviation (Population) | 3.9% | 3.5% |
Similar Demographics by Cognitive Disability
Demographics Similar to Malaysians by Cognitive Disability
In terms of cognitive disability, the demographic groups most similar to Malaysians are Cree (17.9%, a difference of 0.010%), Immigrants from Ethiopia (17.9%, a difference of 0.010%), Immigrants from Grenada (17.9%, a difference of 0.010%), Hopi (17.9%, a difference of 0.030%), and Hispanic or Latino (17.9%, a difference of 0.030%).
| Demographics | Rating | Rank | Cognitive Disability |
| Jamaicans | 0.9 /100 | #244 | Tragic 17.9% |
| Trinidadians and Tobagonians | 0.8 /100 | #245 | Tragic 17.9% |
| Immigrants | Thailand | 0.8 /100 | #246 | Tragic 17.9% |
| Samoans | 0.7 /100 | #247 | Tragic 17.9% |
| French American Indians | 0.7 /100 | #248 | Tragic 17.9% |
| Cree | 0.7 /100 | #249 | Tragic 17.9% |
| Immigrants | Ethiopia | 0.7 /100 | #250 | Tragic 17.9% |
| Malaysians | 0.6 /100 | #251 | Tragic 17.9% |
| Immigrants | Grenada | 0.6 /100 | #252 | Tragic 17.9% |
| Hopi | 0.6 /100 | #253 | Tragic 17.9% |
| Hispanics or Latinos | 0.6 /100 | #254 | Tragic 17.9% |
| Immigrants | Azores | 0.6 /100 | #255 | Tragic 17.9% |
| Bahamians | 0.6 /100 | #256 | Tragic 17.9% |
| Mexican American Indians | 0.6 /100 | #257 | Tragic 17.9% |
| Immigrants | Armenia | 0.6 /100 | #258 | Tragic 17.9% |
Demographics Similar to Afghans by Cognitive Disability
In terms of cognitive disability, the demographic groups most similar to Afghans are Crow (17.3%, a difference of 0.030%), Spaniard (17.3%, a difference of 0.060%), Cambodian (17.3%, a difference of 0.070%), Immigrants from Guyana (17.3%, a difference of 0.14%), and Arab (17.3%, a difference of 0.14%).
| Demographics | Rating | Rank | Cognitive Disability |
| Spanish | 48.9 /100 | #178 | Average 17.3% |
| Sioux | 48.6 /100 | #179 | Average 17.3% |
| Pakistanis | 43.9 /100 | #180 | Average 17.3% |
| Immigrants | Guyana | 42.9 /100 | #181 | Average 17.3% |
| Arabs | 42.8 /100 | #182 | Average 17.3% |
| Spaniards | 40.3 /100 | #183 | Average 17.3% |
| Crow | 39.1 /100 | #184 | Fair 17.3% |
| Afghans | 38.2 /100 | #185 | Fair 17.3% |
| Cambodians | 35.9 /100 | #186 | Fair 17.3% |
| Immigrants | Fiji | 33.7 /100 | #187 | Fair 17.4% |
| Immigrants | France | 29.8 /100 | #188 | Fair 17.4% |
| Immigrants | Western Asia | 29.5 /100 | #189 | Fair 17.4% |
| Immigrants | Spain | 27.7 /100 | #190 | Fair 17.4% |
| Immigrants | Nonimmigrants | 27.4 /100 | #191 | Fair 17.4% |
| Immigrants | Haiti | 27.1 /100 | #192 | Fair 17.4% |