Aleut vs Immigrants from Zimbabwe Cognitive Disability
COMPARE
Aleut
Immigrants from Zimbabwe
Cognitive Disability
Cognitive Disability Comparison
Aleuts
Immigrants from Zimbabwe
17.0%
COGNITIVE DISABILITY
89.9/ 100
METRIC RATING
141st/ 347
METRIC RANK
17.5%
COGNITIVE DISABILITY
11.0/ 100
METRIC RATING
204th/ 347
METRIC RANK
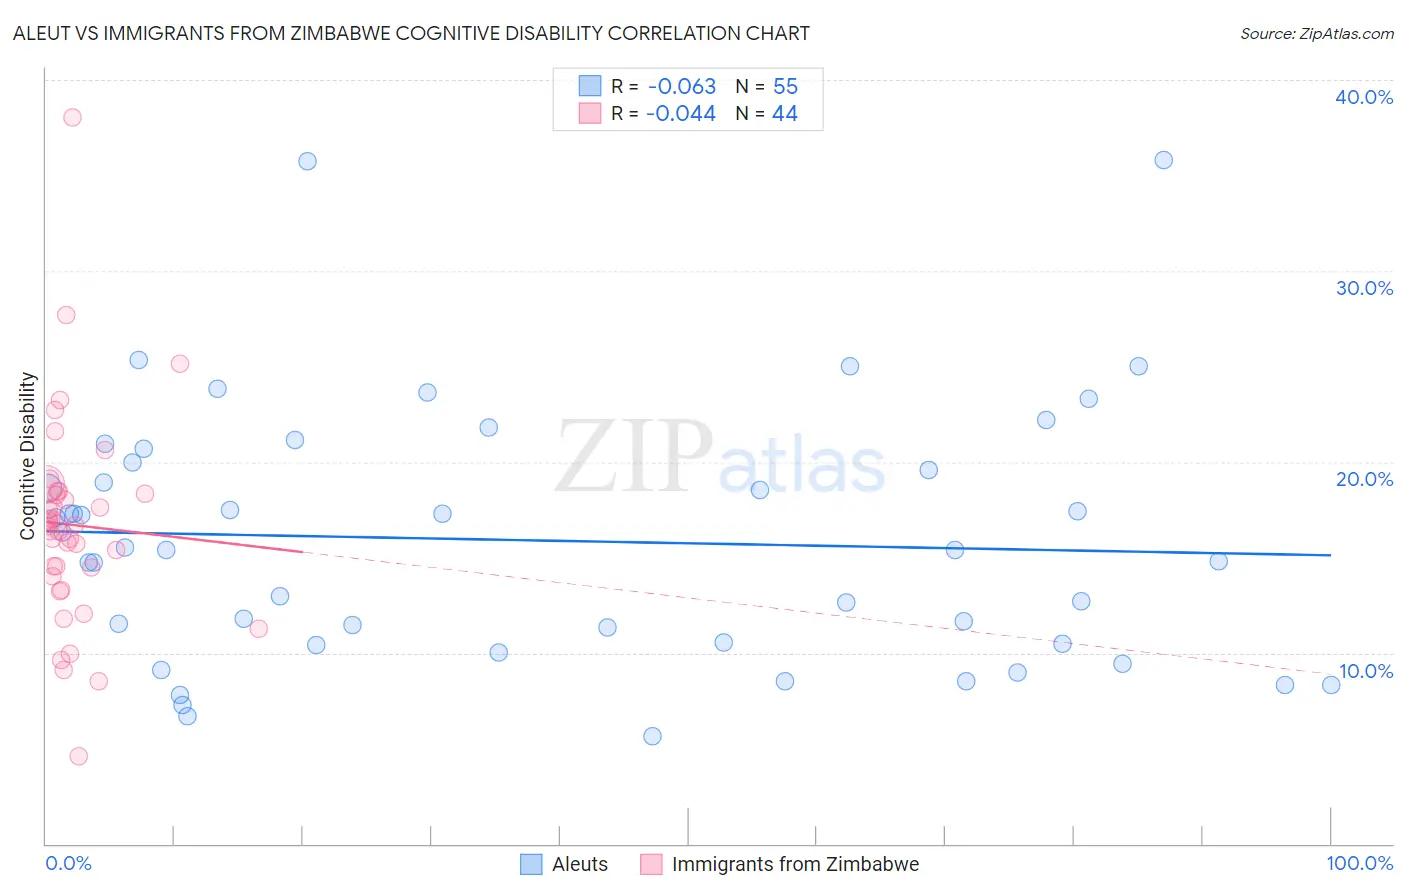
Aleut vs Immigrants from Zimbabwe Cognitive Disability Correlation Chart
The statistical analysis conducted on geographies consisting of 61,782,027 people shows a slight negative correlation between the proportion of Aleuts and percentage of population with cognitive disability in the United States with a correlation coefficient (R) of -0.063 and weighted average of 17.0%. Similarly, the statistical analysis conducted on geographies consisting of 117,811,650 people shows no correlation between the proportion of Immigrants from Zimbabwe and percentage of population with cognitive disability in the United States with a correlation coefficient (R) of -0.044 and weighted average of 17.5%, a difference of 3.1%.
Cognitive Disability Correlation Summary
| Measurement | Aleut | Immigrants from Zimbabwe |
| Minimum | 5.7% | 4.6% |
| Maximum | 35.8% | 38.0% |
| Range | 30.2% | 33.5% |
| Mean | 15.9% | 16.7% |
| Median | 15.4% | 16.7% |
| Interquartile 25% (IQ1) | 10.5% | 14.2% |
| Interquartile 75% (IQ3) | 20.0% | 18.4% |
| Interquartile Range (IQR) | 9.5% | 4.2% |
| Standard Deviation (Sample) | 6.6% | 5.5% |
| Standard Deviation (Population) | 6.6% | 5.4% |
Similar Demographics by Cognitive Disability
Demographics Similar to Aleuts by Cognitive Disability
In terms of cognitive disability, the demographic groups most similar to Aleuts are French (17.0%, a difference of 0.0%), Chilean (17.0%, a difference of 0.0%), Carpatho Rusyn (17.0%, a difference of 0.020%), British (17.0%, a difference of 0.050%), and Immigrants from Brazil (17.0%, a difference of 0.050%).
| Demographics | Rating | Rank | Cognitive Disability |
| Immigrants | Chile | 91.7 /100 | #134 | Exceptional 17.0% |
| Lebanese | 91.3 /100 | #135 | Exceptional 17.0% |
| Israelis | 91.0 /100 | #136 | Exceptional 17.0% |
| Immigrants | Norway | 90.9 /100 | #137 | Exceptional 17.0% |
| Welsh | 90.8 /100 | #138 | Exceptional 17.0% |
| French | 90.0 /100 | #139 | Excellent 17.0% |
| Chileans | 89.9 /100 | #140 | Excellent 17.0% |
| Aleuts | 89.9 /100 | #141 | Excellent 17.0% |
| Carpatho Rusyns | 89.6 /100 | #142 | Excellent 17.0% |
| British | 89.3 /100 | #143 | Excellent 17.0% |
| Immigrants | Brazil | 89.3 /100 | #144 | Excellent 17.0% |
| Immigrants | South Eastern Asia | 88.7 /100 | #145 | Excellent 17.0% |
| Costa Ricans | 88.0 /100 | #146 | Excellent 17.0% |
| Scotch-Irish | 85.9 /100 | #147 | Excellent 17.1% |
| French Canadians | 85.7 /100 | #148 | Excellent 17.1% |
Demographics Similar to Immigrants from Zimbabwe by Cognitive Disability
In terms of cognitive disability, the demographic groups most similar to Immigrants from Zimbabwe are Immigrants from Caribbean (17.5%, a difference of 0.0%), Puget Sound Salish (17.5%, a difference of 0.010%), Alaska Native (17.5%, a difference of 0.040%), Immigrants from Morocco (17.5%, a difference of 0.070%), and Immigrants from Latin America (17.6%, a difference of 0.10%).
| Demographics | Rating | Rank | Cognitive Disability |
| Immigrants | Afghanistan | 16.7 /100 | #197 | Poor 17.5% |
| Immigrants | Panama | 14.8 /100 | #198 | Poor 17.5% |
| Immigrants | Singapore | 14.3 /100 | #199 | Poor 17.5% |
| Haitians | 14.1 /100 | #200 | Poor 17.5% |
| South American Indians | 13.0 /100 | #201 | Poor 17.5% |
| Immigrants | Morocco | 12.0 /100 | #202 | Poor 17.5% |
| Immigrants | Caribbean | 11.0 /100 | #203 | Poor 17.5% |
| Immigrants | Zimbabwe | 11.0 /100 | #204 | Poor 17.5% |
| Puget Sound Salish | 10.9 /100 | #205 | Poor 17.5% |
| Alaska Natives | 10.4 /100 | #206 | Poor 17.5% |
| Immigrants | Latin America | 9.7 /100 | #207 | Tragic 17.6% |
| Immigrants | Cameroon | 9.3 /100 | #208 | Tragic 17.6% |
| Immigrants | Trinidad and Tobago | 8.7 /100 | #209 | Tragic 17.6% |
| Immigrants | Jamaica | 8.5 /100 | #210 | Tragic 17.6% |
| Taiwanese | 7.7 /100 | #211 | Tragic 17.6% |