Aleut vs Immigrants from Afghanistan Cognitive Disability
COMPARE
Aleut
Immigrants from Afghanistan
Cognitive Disability
Cognitive Disability Comparison
Aleuts
Immigrants from Afghanistan
17.0%
COGNITIVE DISABILITY
89.9/ 100
METRIC RATING
141st/ 347
METRIC RANK
17.5%
COGNITIVE DISABILITY
16.7/ 100
METRIC RATING
197th/ 347
METRIC RANK
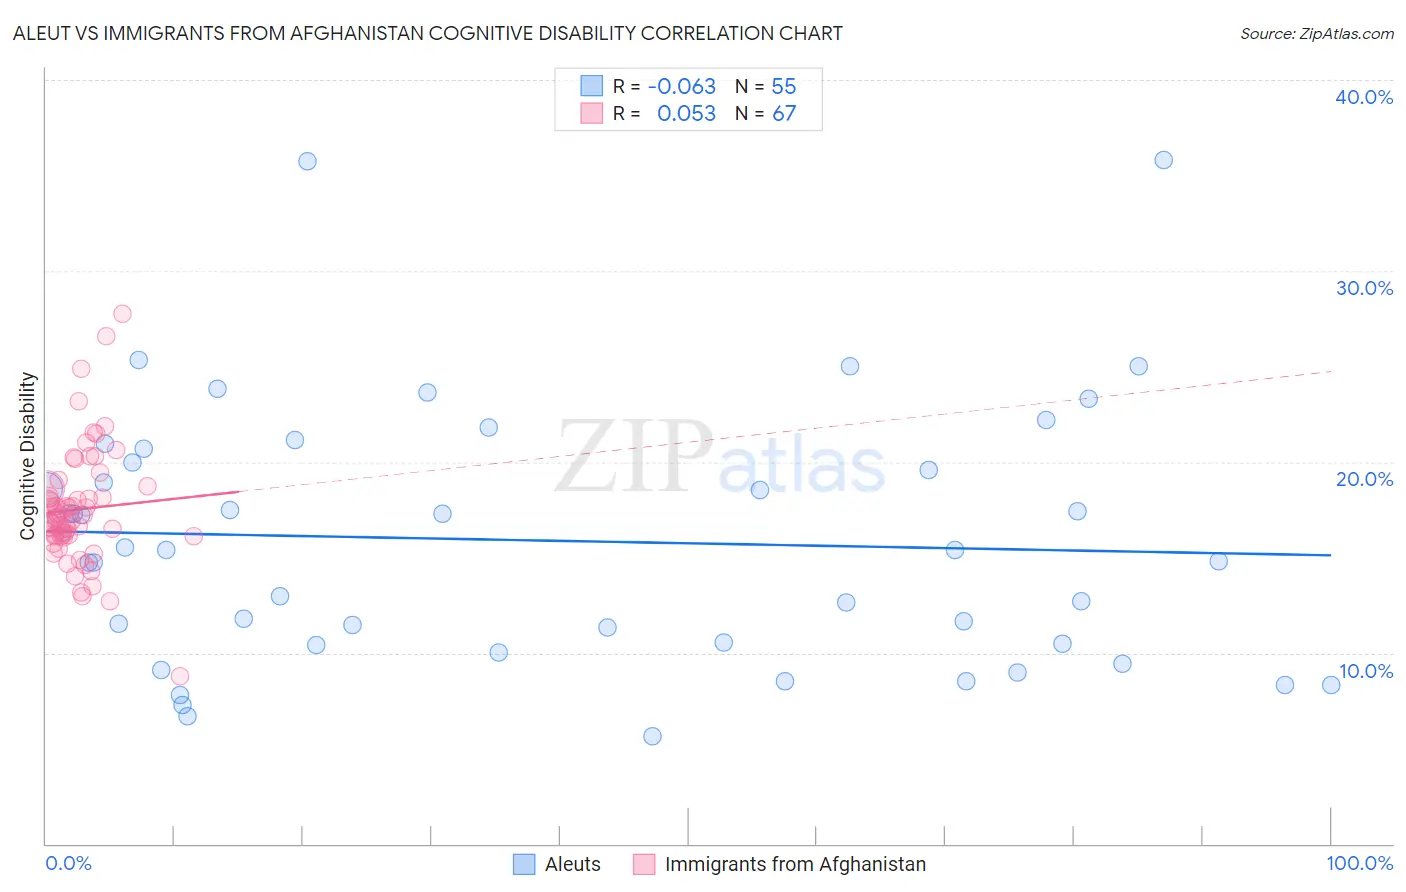
Aleut vs Immigrants from Afghanistan Cognitive Disability Correlation Chart
The statistical analysis conducted on geographies consisting of 61,782,027 people shows a slight negative correlation between the proportion of Aleuts and percentage of population with cognitive disability in the United States with a correlation coefficient (R) of -0.063 and weighted average of 17.0%. Similarly, the statistical analysis conducted on geographies consisting of 147,641,735 people shows a slight positive correlation between the proportion of Immigrants from Afghanistan and percentage of population with cognitive disability in the United States with a correlation coefficient (R) of 0.053 and weighted average of 17.5%, a difference of 2.7%.
Cognitive Disability Correlation Summary
| Measurement | Aleut | Immigrants from Afghanistan |
| Minimum | 5.7% | 8.8% |
| Maximum | 35.8% | 27.8% |
| Range | 30.2% | 19.0% |
| Mean | 15.9% | 17.5% |
| Median | 15.4% | 16.9% |
| Interquartile 25% (IQ1) | 10.5% | 16.1% |
| Interquartile 75% (IQ3) | 20.0% | 18.6% |
| Interquartile Range (IQR) | 9.5% | 2.5% |
| Standard Deviation (Sample) | 6.6% | 3.1% |
| Standard Deviation (Population) | 6.6% | 3.1% |
Similar Demographics by Cognitive Disability
Demographics Similar to Aleuts by Cognitive Disability
In terms of cognitive disability, the demographic groups most similar to Aleuts are French (17.0%, a difference of 0.0%), Chilean (17.0%, a difference of 0.0%), Carpatho Rusyn (17.0%, a difference of 0.020%), British (17.0%, a difference of 0.050%), and Immigrants from Brazil (17.0%, a difference of 0.050%).
| Demographics | Rating | Rank | Cognitive Disability |
| Immigrants | Chile | 91.7 /100 | #134 | Exceptional 17.0% |
| Lebanese | 91.3 /100 | #135 | Exceptional 17.0% |
| Israelis | 91.0 /100 | #136 | Exceptional 17.0% |
| Immigrants | Norway | 90.9 /100 | #137 | Exceptional 17.0% |
| Welsh | 90.8 /100 | #138 | Exceptional 17.0% |
| French | 90.0 /100 | #139 | Excellent 17.0% |
| Chileans | 89.9 /100 | #140 | Excellent 17.0% |
| Aleuts | 89.9 /100 | #141 | Excellent 17.0% |
| Carpatho Rusyns | 89.6 /100 | #142 | Excellent 17.0% |
| British | 89.3 /100 | #143 | Excellent 17.0% |
| Immigrants | Brazil | 89.3 /100 | #144 | Excellent 17.0% |
| Immigrants | South Eastern Asia | 88.7 /100 | #145 | Excellent 17.0% |
| Costa Ricans | 88.0 /100 | #146 | Excellent 17.0% |
| Scotch-Irish | 85.9 /100 | #147 | Excellent 17.1% |
| French Canadians | 85.7 /100 | #148 | Excellent 17.1% |
Demographics Similar to Immigrants from Afghanistan by Cognitive Disability
In terms of cognitive disability, the demographic groups most similar to Immigrants from Afghanistan are Guyanese (17.5%, a difference of 0.040%), Immigrants from Panama (17.5%, a difference of 0.10%), Immigrants from Singapore (17.5%, a difference of 0.13%), Haitian (17.5%, a difference of 0.14%), and New Zealander (17.4%, a difference of 0.20%).
| Demographics | Rating | Rank | Cognitive Disability |
| Immigrants | Spain | 27.7 /100 | #190 | Fair 17.4% |
| Immigrants | Nonimmigrants | 27.4 /100 | #191 | Fair 17.4% |
| Immigrants | Haiti | 27.1 /100 | #192 | Fair 17.4% |
| Delaware | 25.6 /100 | #193 | Fair 17.4% |
| Immigrants | Bosnia and Herzegovina | 22.0 /100 | #194 | Fair 17.4% |
| New Zealanders | 21.1 /100 | #195 | Fair 17.4% |
| Guyanese | 17.5 /100 | #196 | Poor 17.5% |
| Immigrants | Afghanistan | 16.7 /100 | #197 | Poor 17.5% |
| Immigrants | Panama | 14.8 /100 | #198 | Poor 17.5% |
| Immigrants | Singapore | 14.3 /100 | #199 | Poor 17.5% |
| Haitians | 14.1 /100 | #200 | Poor 17.5% |
| South American Indians | 13.0 /100 | #201 | Poor 17.5% |
| Immigrants | Morocco | 12.0 /100 | #202 | Poor 17.5% |
| Immigrants | Caribbean | 11.0 /100 | #203 | Poor 17.5% |
| Immigrants | Zimbabwe | 11.0 /100 | #204 | Poor 17.5% |