Aleut vs Immigrants from Morocco Cognitive Disability
COMPARE
Aleut
Immigrants from Morocco
Cognitive Disability
Cognitive Disability Comparison
Aleuts
Immigrants from Morocco
17.0%
COGNITIVE DISABILITY
89.9/ 100
METRIC RATING
141st/ 347
METRIC RANK
17.5%
COGNITIVE DISABILITY
12.0/ 100
METRIC RATING
202nd/ 347
METRIC RANK
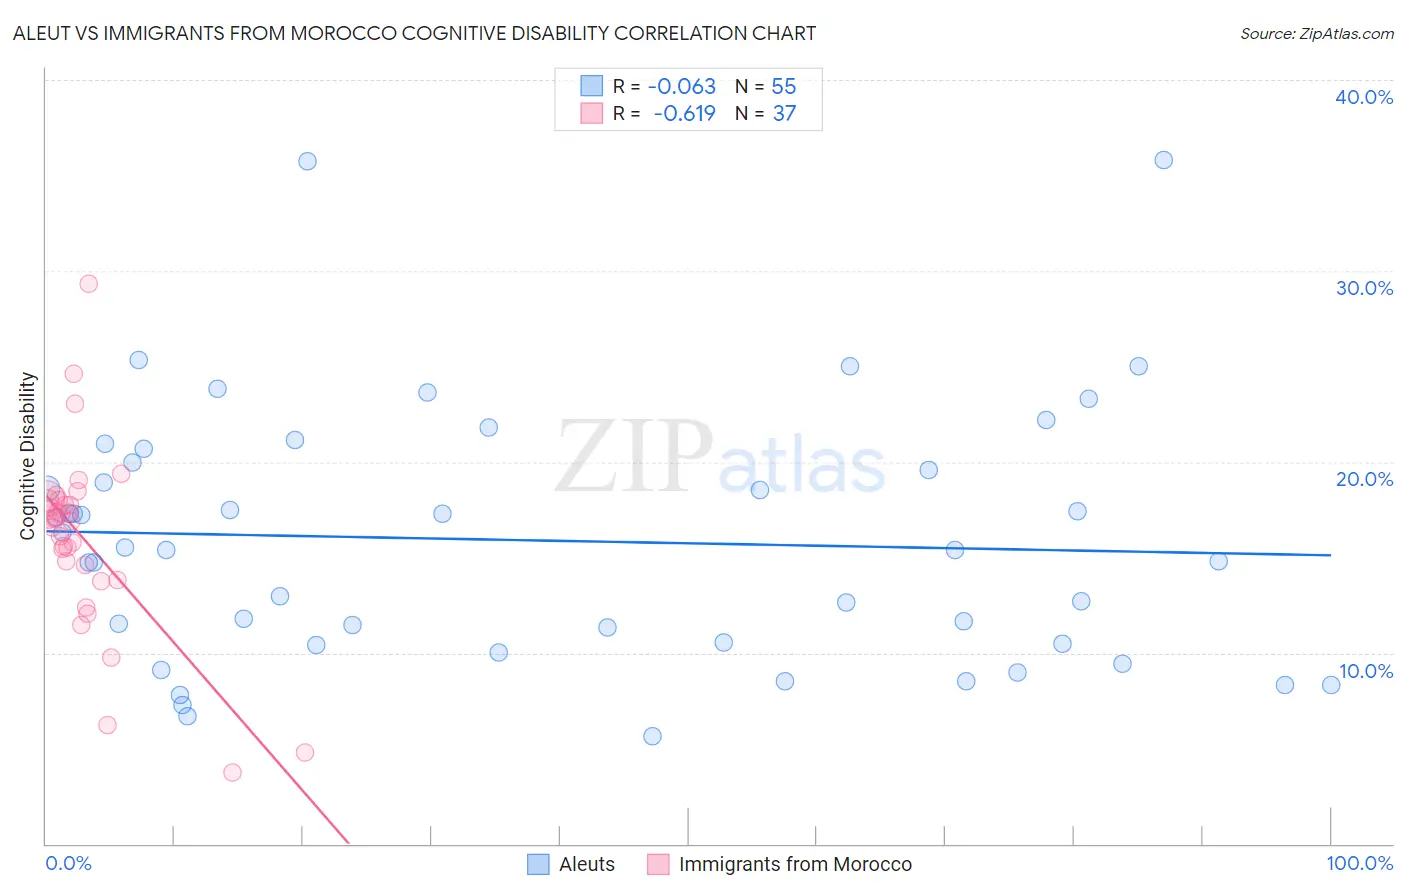
Aleut vs Immigrants from Morocco Cognitive Disability Correlation Chart
The statistical analysis conducted on geographies consisting of 61,782,027 people shows a slight negative correlation between the proportion of Aleuts and percentage of population with cognitive disability in the United States with a correlation coefficient (R) of -0.063 and weighted average of 17.0%. Similarly, the statistical analysis conducted on geographies consisting of 178,912,345 people shows a significant negative correlation between the proportion of Immigrants from Morocco and percentage of population with cognitive disability in the United States with a correlation coefficient (R) of -0.619 and weighted average of 17.5%, a difference of 3.0%.
Cognitive Disability Correlation Summary
| Measurement | Aleut | Immigrants from Morocco |
| Minimum | 5.7% | 3.7% |
| Maximum | 35.8% | 29.3% |
| Range | 30.2% | 25.6% |
| Mean | 15.9% | 16.0% |
| Median | 15.4% | 17.0% |
| Interquartile 25% (IQ1) | 10.5% | 14.2% |
| Interquartile 75% (IQ3) | 20.0% | 18.0% |
| Interquartile Range (IQR) | 9.5% | 3.8% |
| Standard Deviation (Sample) | 6.6% | 4.8% |
| Standard Deviation (Population) | 6.6% | 4.8% |
Similar Demographics by Cognitive Disability
Demographics Similar to Aleuts by Cognitive Disability
In terms of cognitive disability, the demographic groups most similar to Aleuts are French (17.0%, a difference of 0.0%), Chilean (17.0%, a difference of 0.0%), Carpatho Rusyn (17.0%, a difference of 0.020%), British (17.0%, a difference of 0.050%), and Immigrants from Brazil (17.0%, a difference of 0.050%).
| Demographics | Rating | Rank | Cognitive Disability |
| Immigrants | Chile | 91.7 /100 | #134 | Exceptional 17.0% |
| Lebanese | 91.3 /100 | #135 | Exceptional 17.0% |
| Israelis | 91.0 /100 | #136 | Exceptional 17.0% |
| Immigrants | Norway | 90.9 /100 | #137 | Exceptional 17.0% |
| Welsh | 90.8 /100 | #138 | Exceptional 17.0% |
| French | 90.0 /100 | #139 | Excellent 17.0% |
| Chileans | 89.9 /100 | #140 | Excellent 17.0% |
| Aleuts | 89.9 /100 | #141 | Excellent 17.0% |
| Carpatho Rusyns | 89.6 /100 | #142 | Excellent 17.0% |
| British | 89.3 /100 | #143 | Excellent 17.0% |
| Immigrants | Brazil | 89.3 /100 | #144 | Excellent 17.0% |
| Immigrants | South Eastern Asia | 88.7 /100 | #145 | Excellent 17.0% |
| Costa Ricans | 88.0 /100 | #146 | Excellent 17.0% |
| Scotch-Irish | 85.9 /100 | #147 | Excellent 17.1% |
| French Canadians | 85.7 /100 | #148 | Excellent 17.1% |
Demographics Similar to Immigrants from Morocco by Cognitive Disability
In terms of cognitive disability, the demographic groups most similar to Immigrants from Morocco are South American Indian (17.5%, a difference of 0.060%), Immigrants from Caribbean (17.5%, a difference of 0.070%), Immigrants from Zimbabwe (17.5%, a difference of 0.070%), Puget Sound Salish (17.5%, a difference of 0.080%), and Alaska Native (17.5%, a difference of 0.12%).
| Demographics | Rating | Rank | Cognitive Disability |
| New Zealanders | 21.1 /100 | #195 | Fair 17.4% |
| Guyanese | 17.5 /100 | #196 | Poor 17.5% |
| Immigrants | Afghanistan | 16.7 /100 | #197 | Poor 17.5% |
| Immigrants | Panama | 14.8 /100 | #198 | Poor 17.5% |
| Immigrants | Singapore | 14.3 /100 | #199 | Poor 17.5% |
| Haitians | 14.1 /100 | #200 | Poor 17.5% |
| South American Indians | 13.0 /100 | #201 | Poor 17.5% |
| Immigrants | Morocco | 12.0 /100 | #202 | Poor 17.5% |
| Immigrants | Caribbean | 11.0 /100 | #203 | Poor 17.5% |
| Immigrants | Zimbabwe | 11.0 /100 | #204 | Poor 17.5% |
| Puget Sound Salish | 10.9 /100 | #205 | Poor 17.5% |
| Alaska Natives | 10.4 /100 | #206 | Poor 17.5% |
| Immigrants | Latin America | 9.7 /100 | #207 | Tragic 17.6% |
| Immigrants | Cameroon | 9.3 /100 | #208 | Tragic 17.6% |
| Immigrants | Trinidad and Tobago | 8.7 /100 | #209 | Tragic 17.6% |