Albanian vs Immigrants from Laos Child Poverty Under the Age of 5
COMPARE
Albanian
Immigrants from Laos
Child Poverty Under the Age of 5
Child Poverty Under the Age of 5 Comparison
Albanians
Immigrants from Laos
16.0%
CHILD POVERTY UNDER THE AGE OF 5
93.8/ 100
METRIC RATING
115th/ 347
METRIC RANK
19.4%
CHILD POVERTY UNDER THE AGE OF 5
0.8/ 100
METRIC RATING
235th/ 347
METRIC RANK
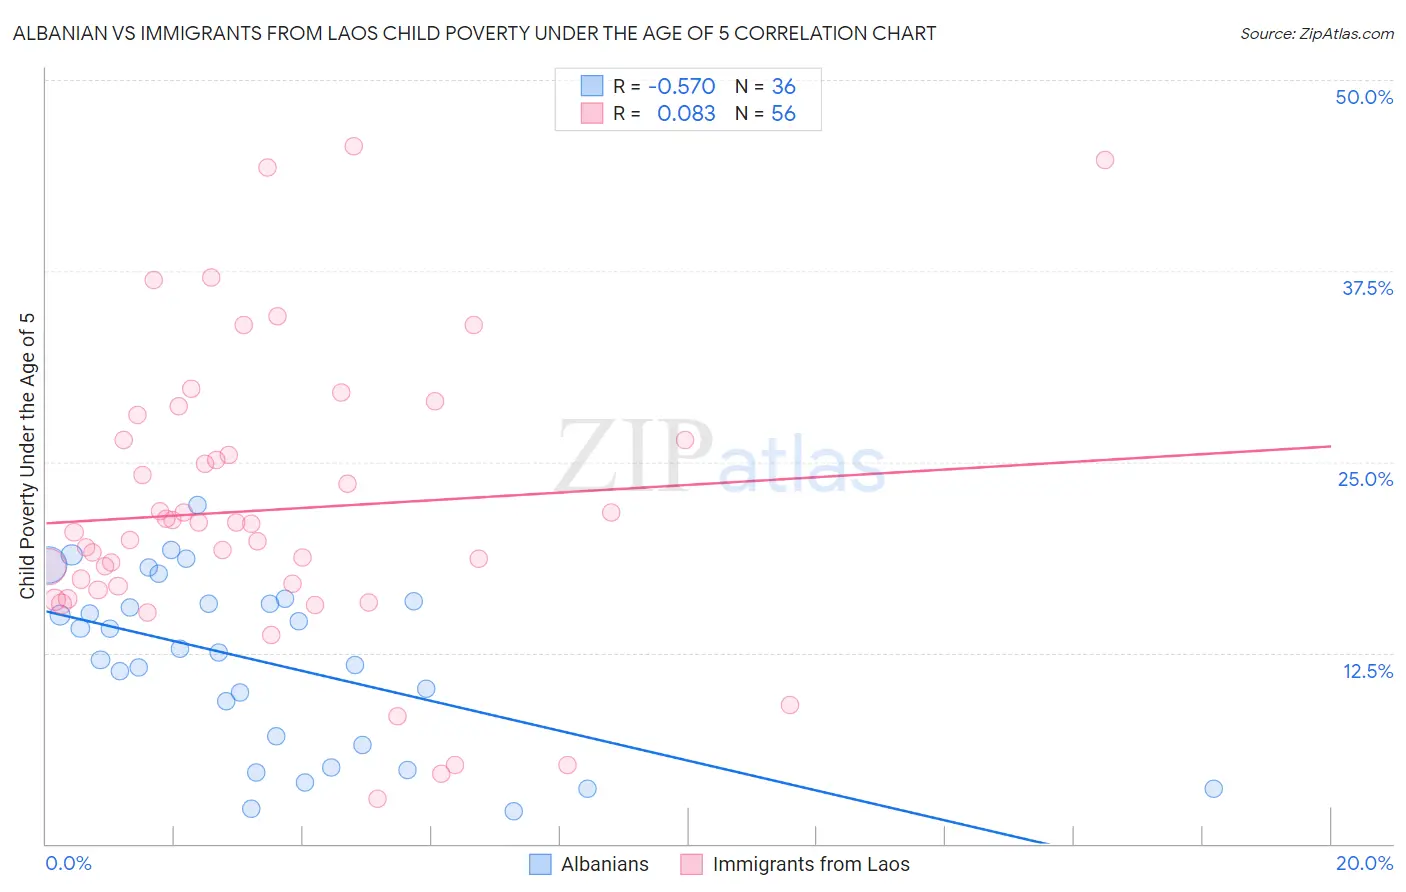
Albanian vs Immigrants from Laos Child Poverty Under the Age of 5 Correlation Chart
The statistical analysis conducted on geographies consisting of 186,792,170 people shows a substantial negative correlation between the proportion of Albanians and poverty level among children under the age of 5 in the United States with a correlation coefficient (R) of -0.570 and weighted average of 16.0%. Similarly, the statistical analysis conducted on geographies consisting of 197,804,154 people shows a slight positive correlation between the proportion of Immigrants from Laos and poverty level among children under the age of 5 in the United States with a correlation coefficient (R) of 0.083 and weighted average of 19.4%, a difference of 21.1%.
Child Poverty Under the Age of 5 Correlation Summary
| Measurement | Albanian | Immigrants from Laos |
| Minimum | 2.1% | 2.9% |
| Maximum | 22.2% | 45.7% |
| Range | 20.1% | 42.8% |
| Mean | 11.9% | 21.9% |
| Median | 12.6% | 20.7% |
| Interquartile 25% (IQ1) | 6.8% | 16.8% |
| Interquartile 75% (IQ3) | 15.8% | 26.4% |
| Interquartile Range (IQR) | 9.0% | 9.7% |
| Standard Deviation (Sample) | 5.6% | 9.4% |
| Standard Deviation (Population) | 5.5% | 9.3% |
Similar Demographics by Child Poverty Under the Age of 5
Demographics Similar to Albanians by Child Poverty Under the Age of 5
In terms of child poverty under the age of 5, the demographic groups most similar to Albanians are Immigrants from Kuwait (16.0%, a difference of 0.020%), Puget Sound Salish (16.0%, a difference of 0.11%), Peruvian (16.0%, a difference of 0.12%), Pakistani (16.0%, a difference of 0.17%), and Immigrants from Austria (16.0%, a difference of 0.17%).
| Demographics | Rating | Rank | Child Poverty Under the Age of 5 |
| Immigrants | Brazil | 94.4 /100 | #108 | Exceptional 16.0% |
| Northern Europeans | 94.3 /100 | #109 | Exceptional 16.0% |
| Romanians | 94.3 /100 | #110 | Exceptional 16.0% |
| Pakistanis | 94.2 /100 | #111 | Exceptional 16.0% |
| Peruvians | 94.1 /100 | #112 | Exceptional 16.0% |
| Puget Sound Salish | 94.1 /100 | #113 | Exceptional 16.0% |
| Immigrants | Kuwait | 93.9 /100 | #114 | Exceptional 16.0% |
| Albanians | 93.8 /100 | #115 | Exceptional 16.0% |
| Immigrants | Austria | 93.5 /100 | #116 | Exceptional 16.0% |
| Basques | 93.4 /100 | #117 | Exceptional 16.0% |
| Immigrants | Denmark | 93.4 /100 | #118 | Exceptional 16.0% |
| Immigrants | Jordan | 93.2 /100 | #119 | Exceptional 16.1% |
| Immigrants | Peru | 92.6 /100 | #120 | Exceptional 16.1% |
| Mongolians | 92.5 /100 | #121 | Exceptional 16.1% |
| Immigrants | Southern Europe | 92.0 /100 | #122 | Exceptional 16.1% |
Demographics Similar to Immigrants from Laos by Child Poverty Under the Age of 5
In terms of child poverty under the age of 5, the demographic groups most similar to Immigrants from Laos are Immigrants from Trinidad and Tobago (19.4%, a difference of 0.0%), Immigrants from Micronesia (19.4%, a difference of 0.21%), Sudanese (19.3%, a difference of 0.33%), Trinidadian and Tobagonian (19.3%, a difference of 0.39%), and Immigrants from Cabo Verde (19.5%, a difference of 0.56%).
| Demographics | Rating | Rank | Child Poverty Under the Age of 5 |
| Immigrants | Sudan | 1.3 /100 | #228 | Tragic 19.2% |
| Ghanaians | 1.2 /100 | #229 | Tragic 19.2% |
| Ecuadorians | 1.2 /100 | #230 | Tragic 19.2% |
| Bermudans | 1.2 /100 | #231 | Tragic 19.2% |
| Trinidadians and Tobagonians | 0.9 /100 | #232 | Tragic 19.3% |
| Sudanese | 0.9 /100 | #233 | Tragic 19.3% |
| Immigrants | Micronesia | 0.9 /100 | #234 | Tragic 19.4% |
| Immigrants | Laos | 0.8 /100 | #235 | Tragic 19.4% |
| Immigrants | Trinidad and Tobago | 0.8 /100 | #236 | Tragic 19.4% |
| Immigrants | Cabo Verde | 0.6 /100 | #237 | Tragic 19.5% |
| Salvadorans | 0.6 /100 | #238 | Tragic 19.5% |
| Vietnamese | 0.6 /100 | #239 | Tragic 19.5% |
| Immigrants | Ecuador | 0.5 /100 | #240 | Tragic 19.6% |
| Alaska Natives | 0.5 /100 | #241 | Tragic 19.6% |
| Immigrants | Guyana | 0.5 /100 | #242 | Tragic 19.6% |