Hopi vs Immigrants from Laos Vision Disability
COMPARE
Hopi
Immigrants from Laos
Vision Disability
Vision Disability Comparison
Hopi
Immigrants from Laos
2.9%
VISION DISABILITY
0.0/ 100
METRIC RATING
324th/ 347
METRIC RANK
2.4%
VISION DISABILITY
0.4/ 100
METRIC RATING
251st/ 347
METRIC RANK
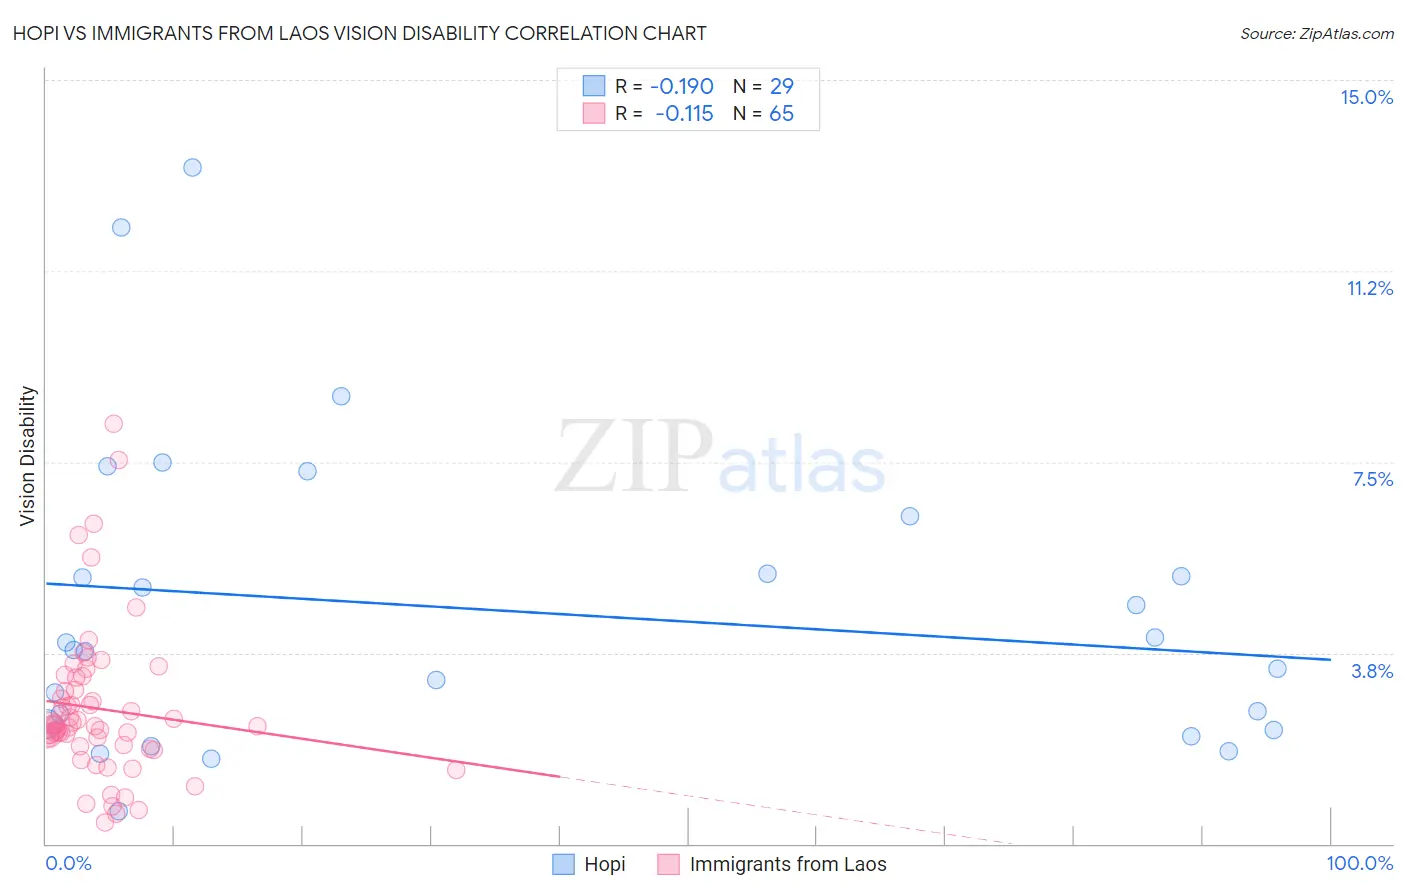
Hopi vs Immigrants from Laos Vision Disability Correlation Chart
The statistical analysis conducted on geographies consisting of 74,725,197 people shows a poor negative correlation between the proportion of Hopi and percentage of population with vision disability in the United States with a correlation coefficient (R) of -0.190 and weighted average of 2.9%. Similarly, the statistical analysis conducted on geographies consisting of 201,435,761 people shows a poor negative correlation between the proportion of Immigrants from Laos and percentage of population with vision disability in the United States with a correlation coefficient (R) of -0.115 and weighted average of 2.4%, a difference of 23.8%.
Vision Disability Correlation Summary
| Measurement | Hopi | Immigrants from Laos |
| Minimum | 0.64% | 0.41% |
| Maximum | 13.3% | 8.3% |
| Range | 12.6% | 7.8% |
| Mean | 4.6% | 2.7% |
| Median | 3.8% | 2.3% |
| Interquartile 25% (IQ1) | 2.3% | 1.9% |
| Interquartile 75% (IQ3) | 5.9% | 3.1% |
| Interquartile Range (IQR) | 3.6% | 1.2% |
| Standard Deviation (Sample) | 3.0% | 1.5% |
| Standard Deviation (Population) | 3.0% | 1.5% |
Similar Demographics by Vision Disability
Demographics Similar to Hopi by Vision Disability
In terms of vision disability, the demographic groups most similar to Hopi are Cherokee (2.9%, a difference of 0.010%), Spanish American (2.9%, a difference of 1.2%), Paiute (2.9%, a difference of 2.0%), Tlingit-Haida (2.9%, a difference of 2.0%), and Native/Alaskan (3.0%, a difference of 2.0%).
| Demographics | Rating | Rank | Vision Disability |
| Yup'ik | 0.0 /100 | #317 | Tragic 2.7% |
| Alaska Natives | 0.0 /100 | #318 | Tragic 2.7% |
| Tohono O'odham | 0.0 /100 | #319 | Tragic 2.8% |
| Blacks/African Americans | 0.0 /100 | #320 | Tragic 2.8% |
| Comanche | 0.0 /100 | #321 | Tragic 2.8% |
| Paiute | 0.0 /100 | #322 | Tragic 2.9% |
| Tlingit-Haida | 0.0 /100 | #323 | Tragic 2.9% |
| Hopi | 0.0 /100 | #324 | Tragic 2.9% |
| Cherokee | 0.0 /100 | #325 | Tragic 2.9% |
| Spanish Americans | 0.0 /100 | #326 | Tragic 2.9% |
| Natives/Alaskans | 0.0 /100 | #327 | Tragic 3.0% |
| Yuman | 0.0 /100 | #328 | Tragic 3.0% |
| Apache | 0.0 /100 | #329 | Tragic 3.0% |
| Colville | 0.0 /100 | #330 | Tragic 3.0% |
| Central American Indians | 0.0 /100 | #331 | Tragic 3.0% |
Demographics Similar to Immigrants from Laos by Vision Disability
In terms of vision disability, the demographic groups most similar to Immigrants from Laos are Bangladeshi (2.3%, a difference of 0.11%), Liberian (2.3%, a difference of 0.19%), Subsaharan African (2.3%, a difference of 0.21%), Guatemalan (2.3%, a difference of 0.23%), and French (2.3%, a difference of 0.27%).
| Demographics | Rating | Rank | Vision Disability |
| Immigrants | West Indies | 0.6 /100 | #244 | Tragic 2.3% |
| Alsatians | 0.6 /100 | #245 | Tragic 2.3% |
| French | 0.5 /100 | #246 | Tragic 2.3% |
| Guatemalans | 0.5 /100 | #247 | Tragic 2.3% |
| Sub-Saharan Africans | 0.5 /100 | #248 | Tragic 2.3% |
| Liberians | 0.5 /100 | #249 | Tragic 2.3% |
| Bangladeshis | 0.5 /100 | #250 | Tragic 2.3% |
| Immigrants | Laos | 0.4 /100 | #251 | Tragic 2.4% |
| Immigrants | Micronesia | 0.3 /100 | #252 | Tragic 2.4% |
| Japanese | 0.3 /100 | #253 | Tragic 2.4% |
| Haitians | 0.3 /100 | #254 | Tragic 2.4% |
| Immigrants | Guatemala | 0.3 /100 | #255 | Tragic 2.4% |
| Immigrants | Haiti | 0.2 /100 | #256 | Tragic 2.4% |
| West Indians | 0.2 /100 | #257 | Tragic 2.4% |
| British West Indians | 0.2 /100 | #258 | Tragic 2.4% |