Albanian vs Immigrants from Eastern Asia Doctorate Degree
COMPARE
Albanian
Immigrants from Eastern Asia
Doctorate Degree
Doctorate Degree Comparison
Albanians
Immigrants from Eastern Asia
1.9%
DOCTORATE DEGREE
74.8/ 100
METRIC RATING
151st/ 347
METRIC RANK
3.0%
DOCTORATE DEGREE
100.0/ 100
METRIC RATING
10th/ 347
METRIC RANK
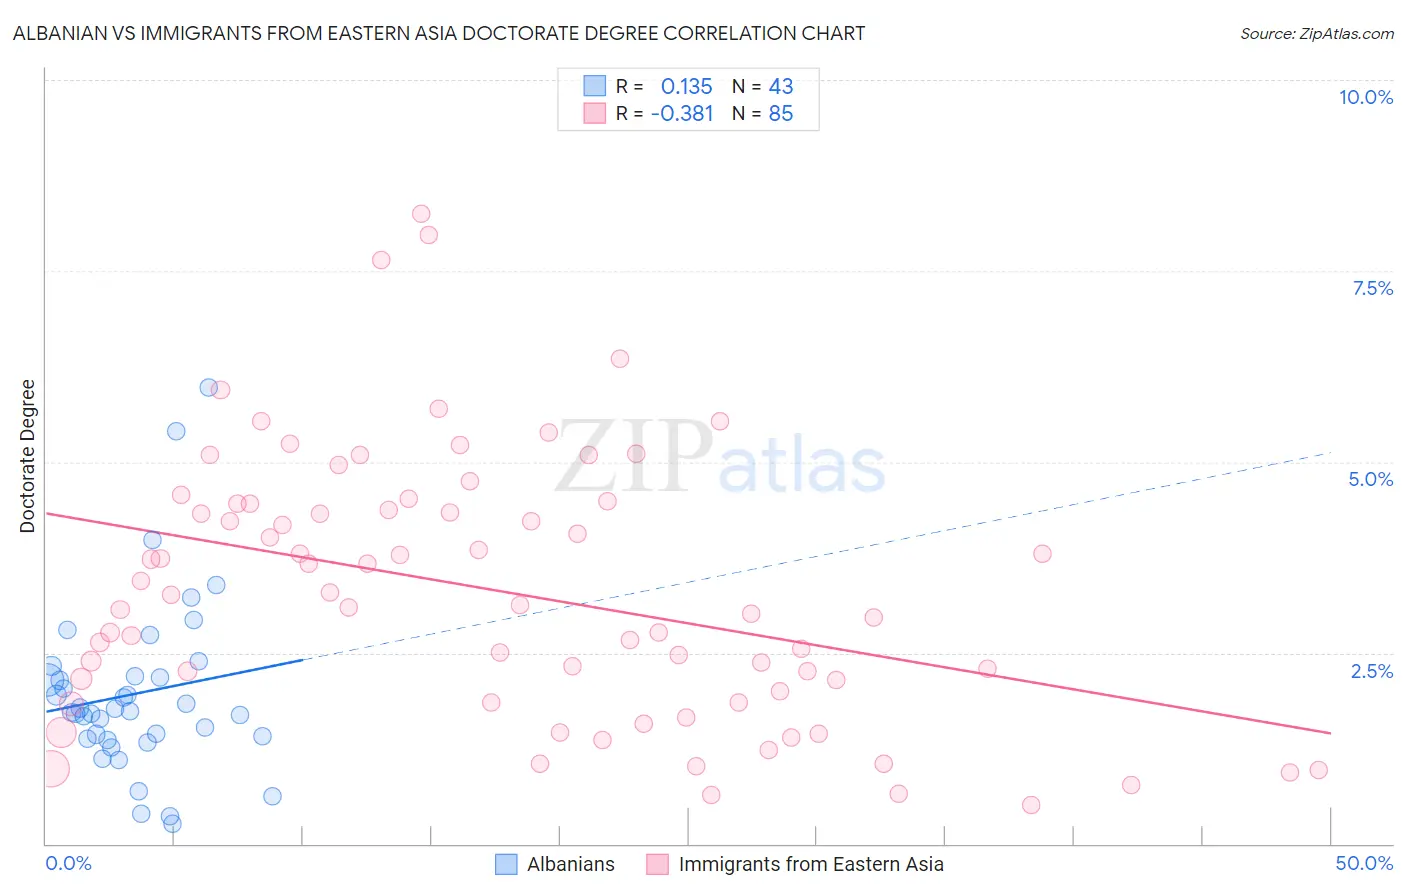
Albanian vs Immigrants from Eastern Asia Doctorate Degree Correlation Chart
The statistical analysis conducted on geographies consisting of 192,567,939 people shows a poor positive correlation between the proportion of Albanians and percentage of population with at least doctorate degree education in the United States with a correlation coefficient (R) of 0.135 and weighted average of 1.9%. Similarly, the statistical analysis conducted on geographies consisting of 492,135,301 people shows a mild negative correlation between the proportion of Immigrants from Eastern Asia and percentage of population with at least doctorate degree education in the United States with a correlation coefficient (R) of -0.381 and weighted average of 3.0%, a difference of 55.0%.
Doctorate Degree Correlation Summary
| Measurement | Albanian | Immigrants from Eastern Asia |
| Minimum | 0.26% | 0.51% |
| Maximum | 6.0% | 8.3% |
| Range | 5.7% | 7.7% |
| Mean | 2.0% | 3.3% |
| Median | 1.7% | 3.1% |
| Interquartile 25% (IQ1) | 1.4% | 1.9% |
| Interquartile 75% (IQ3) | 2.2% | 4.4% |
| Interquartile Range (IQR) | 0.81% | 2.5% |
| Standard Deviation (Sample) | 1.1% | 1.7% |
| Standard Deviation (Population) | 1.1% | 1.7% |
Similar Demographics by Doctorate Degree
Demographics Similar to Albanians by Doctorate Degree
In terms of doctorate degree, the demographic groups most similar to Albanians are Immigrants from Kenya (1.9%, a difference of 0.10%), Immigrants from Oceania (1.9%, a difference of 0.15%), English (1.9%, a difference of 0.19%), Immigrants from Albania (1.9%, a difference of 0.37%), and Polish (1.9%, a difference of 0.39%).
| Demographics | Rating | Rank | Doctorate Degree |
| Immigrants | Moldova | 84.3 /100 | #144 | Excellent 2.0% |
| Kenyans | 83.6 /100 | #145 | Excellent 1.9% |
| Immigrants | Syria | 83.6 /100 | #146 | Excellent 1.9% |
| Immigrants | Senegal | 82.5 /100 | #147 | Excellent 1.9% |
| Luxembourgers | 81.1 /100 | #148 | Excellent 1.9% |
| Basques | 76.9 /100 | #149 | Good 1.9% |
| English | 75.9 /100 | #150 | Good 1.9% |
| Albanians | 74.8 /100 | #151 | Good 1.9% |
| Immigrants | Kenya | 74.3 /100 | #152 | Good 1.9% |
| Immigrants | Oceania | 74.0 /100 | #153 | Good 1.9% |
| Immigrants | Albania | 72.8 /100 | #154 | Good 1.9% |
| Poles | 72.7 /100 | #155 | Good 1.9% |
| Slavs | 72.4 /100 | #156 | Good 1.9% |
| Danes | 71.9 /100 | #157 | Good 1.9% |
| Hungarians | 71.7 /100 | #158 | Good 1.9% |
Demographics Similar to Immigrants from Eastern Asia by Doctorate Degree
In terms of doctorate degree, the demographic groups most similar to Immigrants from Eastern Asia are Indian (Asian) (2.9%, a difference of 1.8%), Immigrants from Iran (3.0%, a difference of 2.1%), Immigrants from Belgium (2.9%, a difference of 2.5%), Immigrants from Israel (3.0%, a difference of 2.8%), and Immigrants from Sweden (2.9%, a difference of 3.5%).
| Demographics | Rating | Rank | Doctorate Degree |
| Okinawans | 100.0 /100 | #3 | Exceptional 3.3% |
| Immigrants | Taiwan | 100.0 /100 | #4 | Exceptional 3.2% |
| Iranians | 100.0 /100 | #5 | Exceptional 3.1% |
| Immigrants | Switzerland | 100.0 /100 | #6 | Exceptional 3.1% |
| Immigrants | China | 100.0 /100 | #7 | Exceptional 3.1% |
| Immigrants | Israel | 100.0 /100 | #8 | Exceptional 3.0% |
| Immigrants | Iran | 100.0 /100 | #9 | Exceptional 3.0% |
| Immigrants | Eastern Asia | 100.0 /100 | #10 | Exceptional 3.0% |
| Indians (Asian) | 100.0 /100 | #11 | Exceptional 2.9% |
| Immigrants | Belgium | 100.0 /100 | #12 | Exceptional 2.9% |
| Immigrants | Sweden | 100.0 /100 | #13 | Exceptional 2.9% |
| Immigrants | France | 100.0 /100 | #14 | Exceptional 2.9% |
| Immigrants | India | 100.0 /100 | #15 | Exceptional 2.8% |
| Eastern Europeans | 100.0 /100 | #16 | Exceptional 2.8% |
| Immigrants | Australia | 100.0 /100 | #17 | Exceptional 2.8% |