Albanian vs Bhutanese Disability Age Under 5
COMPARE
Albanian
Bhutanese
Disability Age Under 5
Disability Age Under 5 Comparison
Albanians
Bhutanese
1.1%
DISABILITY AGE UNDER 5
97.2/ 100
METRIC RATING
91st/ 347
METRIC RANK
1.2%
DISABILITY AGE UNDER 5
92.5/ 100
METRIC RATING
119th/ 347
METRIC RANK
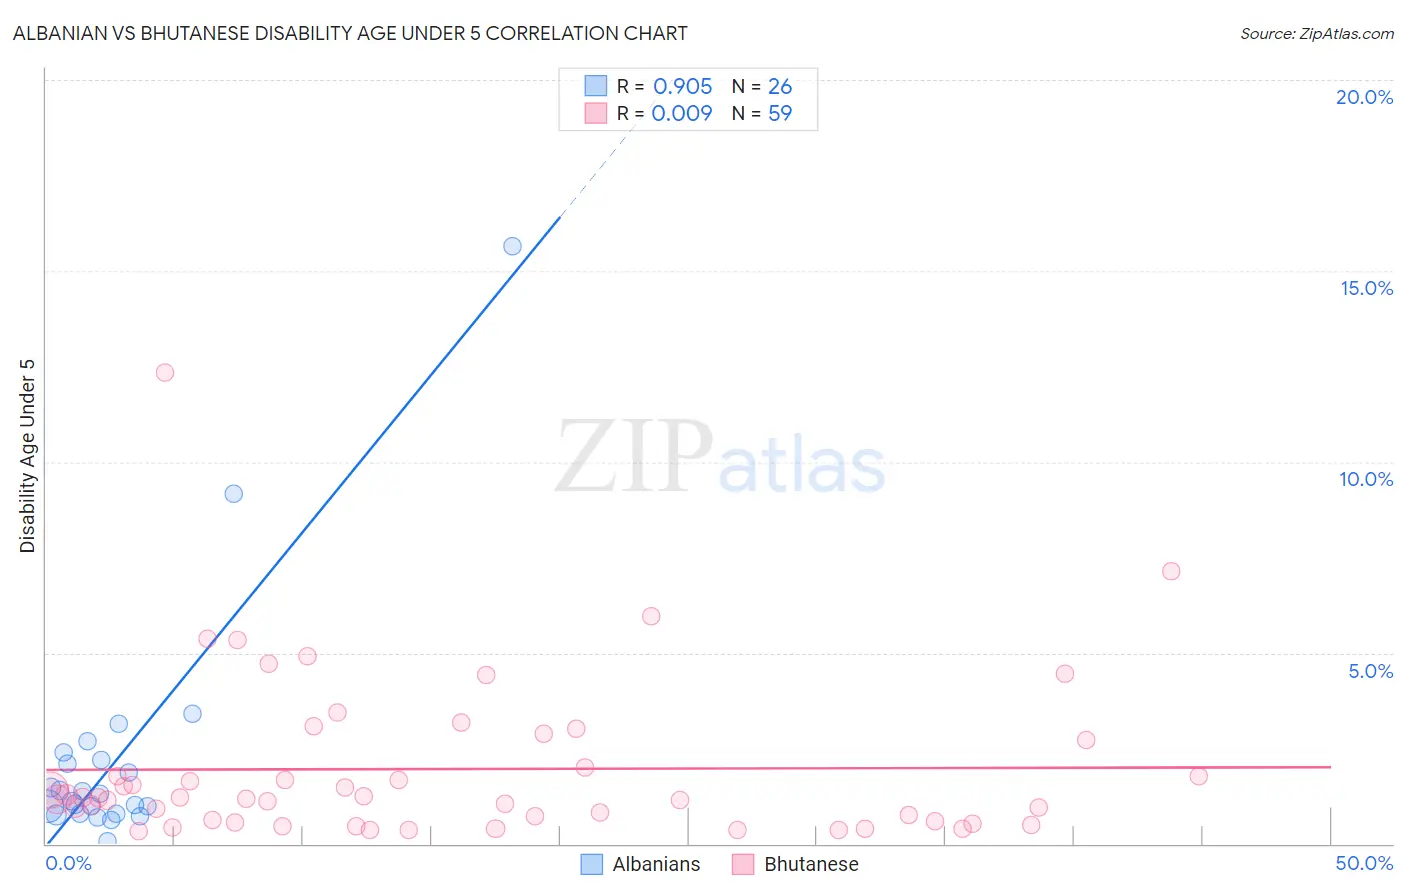
Albanian vs Bhutanese Disability Age Under 5 Correlation Chart
The statistical analysis conducted on geographies consisting of 123,207,813 people shows a near-perfect positive correlation between the proportion of Albanians and percentage of population with a disability under the age of 5 in the United States with a correlation coefficient (R) of 0.905 and weighted average of 1.1%. Similarly, the statistical analysis conducted on geographies consisting of 235,474,976 people shows no correlation between the proportion of Bhutanese and percentage of population with a disability under the age of 5 in the United States with a correlation coefficient (R) of 0.009 and weighted average of 1.2%, a difference of 2.5%.
Disability Age Under 5 Correlation Summary
| Measurement | Albanian | Bhutanese |
| Minimum | 0.063% | 0.32% |
| Maximum | 15.7% | 12.3% |
| Range | 15.6% | 12.0% |
| Mean | 2.3% | 2.0% |
| Median | 1.2% | 1.2% |
| Interquartile 25% (IQ1) | 0.78% | 0.60% |
| Interquartile 75% (IQ3) | 2.2% | 2.7% |
| Interquartile Range (IQR) | 1.4% | 2.1% |
| Standard Deviation (Sample) | 3.2% | 2.1% |
| Standard Deviation (Population) | 3.2% | 2.1% |
Similar Demographics by Disability Age Under 5
Demographics Similar to Albanians by Disability Age Under 5
In terms of disability age under 5, the demographic groups most similar to Albanians are Chinese (1.1%, a difference of 0.040%), Ethiopian (1.1%, a difference of 0.070%), Immigrants from Cuba (1.1%, a difference of 0.17%), Spanish American (1.1%, a difference of 0.20%), and Sri Lankan (1.1%, a difference of 0.26%).
| Demographics | Rating | Rank | Disability Age Under 5 |
| Immigrants | Zaire | 97.8 /100 | #84 | Exceptional 1.1% |
| Sudanese | 97.7 /100 | #85 | Exceptional 1.1% |
| Okinawans | 97.6 /100 | #86 | Exceptional 1.1% |
| Ugandans | 97.5 /100 | #87 | Exceptional 1.1% |
| Immigrants | Dominican Republic | 97.5 /100 | #88 | Exceptional 1.1% |
| Ethiopians | 97.2 /100 | #89 | Exceptional 1.1% |
| Chinese | 97.2 /100 | #90 | Exceptional 1.1% |
| Albanians | 97.2 /100 | #91 | Exceptional 1.1% |
| Immigrants | Cuba | 97.0 /100 | #92 | Exceptional 1.1% |
| Spanish Americans | 96.9 /100 | #93 | Exceptional 1.1% |
| Sri Lankans | 96.8 /100 | #94 | Exceptional 1.1% |
| Immigrants | Moldova | 96.8 /100 | #95 | Exceptional 1.1% |
| Mongolians | 96.6 /100 | #96 | Exceptional 1.1% |
| Immigrants | Iraq | 96.5 /100 | #97 | Exceptional 1.1% |
| Immigrants | South Eastern Asia | 96.5 /100 | #98 | Exceptional 1.1% |
Demographics Similar to Bhutanese by Disability Age Under 5
In terms of disability age under 5, the demographic groups most similar to Bhutanese are Immigrants from Eritrea (1.2%, a difference of 0.070%), Immigrants from Venezuela (1.2%, a difference of 0.34%), Immigrants from Senegal (1.2%, a difference of 0.35%), Immigrants from Philippines (1.2%, a difference of 0.37%), and Immigrants from Northern Africa (1.2%, a difference of 0.50%).
| Demographics | Rating | Rank | Disability Age Under 5 |
| Immigrants | Australia | 94.4 /100 | #112 | Exceptional 1.2% |
| Immigrants | Oceania | 94.2 /100 | #113 | Exceptional 1.2% |
| Belizeans | 93.9 /100 | #114 | Exceptional 1.2% |
| Immigrants | Caribbean | 93.8 /100 | #115 | Exceptional 1.2% |
| Immigrants | Northern Africa | 93.8 /100 | #116 | Exceptional 1.2% |
| Immigrants | Philippines | 93.5 /100 | #117 | Exceptional 1.2% |
| Immigrants | Venezuela | 93.4 /100 | #118 | Exceptional 1.2% |
| Bhutanese | 92.5 /100 | #119 | Exceptional 1.2% |
| Immigrants | Eritrea | 92.3 /100 | #120 | Exceptional 1.2% |
| Immigrants | Senegal | 91.4 /100 | #121 | Exceptional 1.2% |
| Aleuts | 90.7 /100 | #122 | Exceptional 1.2% |
| Zimbabweans | 90.6 /100 | #123 | Exceptional 1.2% |
| Immigrants | Cambodia | 90.5 /100 | #124 | Exceptional 1.2% |
| Japanese | 90.3 /100 | #125 | Exceptional 1.2% |
| Central Americans | 89.7 /100 | #126 | Excellent 1.2% |