Albanian vs Australian Disability Age Under 5
COMPARE
Albanian
Australian
Disability Age Under 5
Disability Age Under 5 Comparison
Albanians
Australians
1.1%
DISABILITY AGE UNDER 5
97.2/ 100
METRIC RATING
91st/ 347
METRIC RANK
1.4%
DISABILITY AGE UNDER 5
0.7/ 100
METRIC RATING
253rd/ 347
METRIC RANK
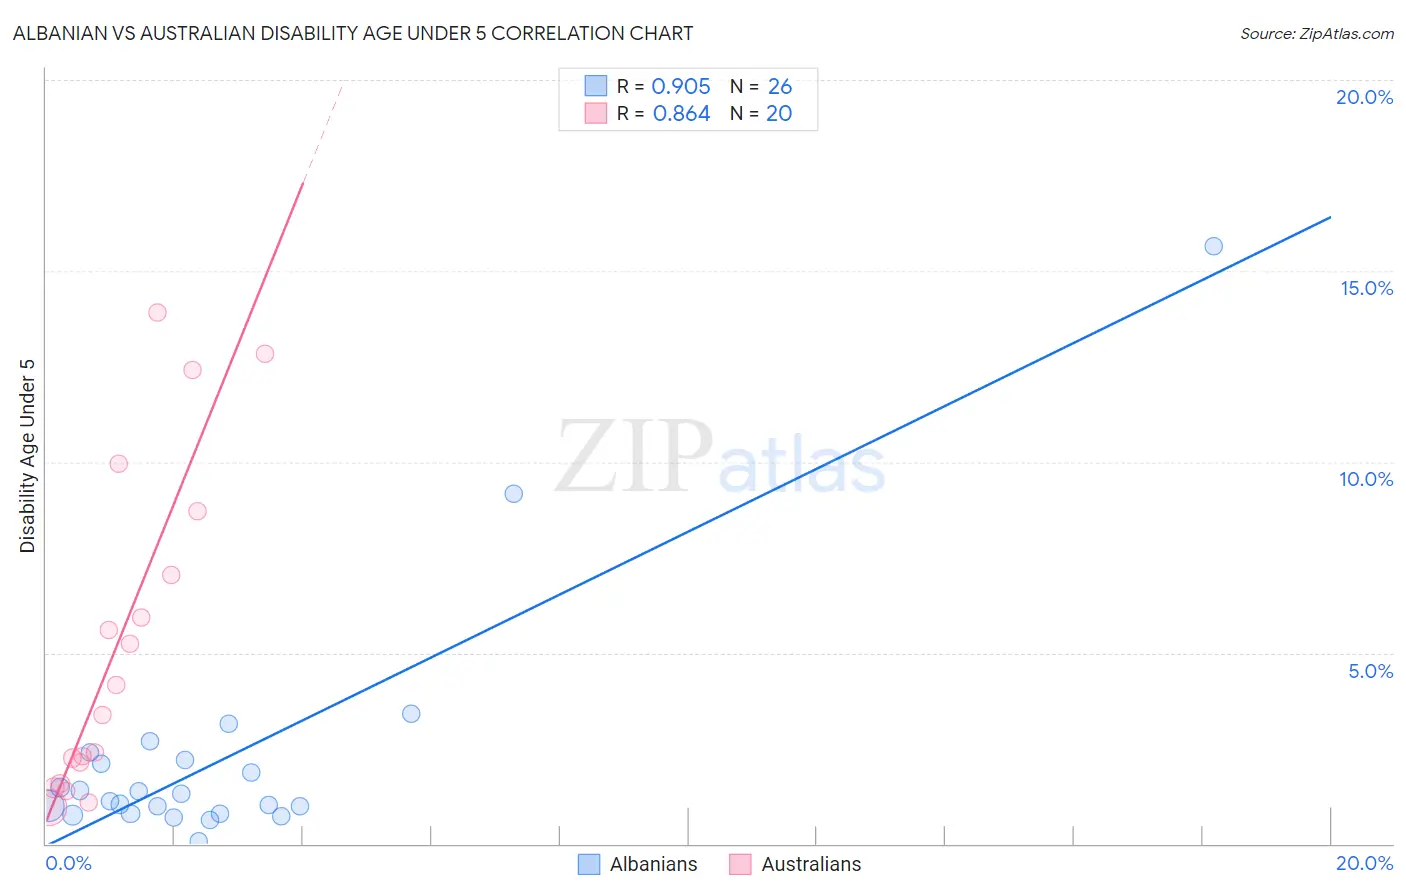
Albanian vs Australian Disability Age Under 5 Correlation Chart
The statistical analysis conducted on geographies consisting of 123,207,813 people shows a near-perfect positive correlation between the proportion of Albanians and percentage of population with a disability under the age of 5 in the United States with a correlation coefficient (R) of 0.905 and weighted average of 1.1%. Similarly, the statistical analysis conducted on geographies consisting of 142,562,504 people shows a very strong positive correlation between the proportion of Australians and percentage of population with a disability under the age of 5 in the United States with a correlation coefficient (R) of 0.864 and weighted average of 1.4%, a difference of 20.9%.
Disability Age Under 5 Correlation Summary
| Measurement | Albanian | Australian |
| Minimum | 0.063% | 0.96% |
| Maximum | 15.7% | 13.9% |
| Range | 15.6% | 13.0% |
| Mean | 2.3% | 5.2% |
| Median | 1.2% | 3.8% |
| Interquartile 25% (IQ1) | 0.78% | 1.9% |
| Interquartile 75% (IQ3) | 2.2% | 7.9% |
| Interquartile Range (IQR) | 1.4% | 6.0% |
| Standard Deviation (Sample) | 3.2% | 4.2% |
| Standard Deviation (Population) | 3.2% | 4.1% |
Similar Demographics by Disability Age Under 5
Demographics Similar to Albanians by Disability Age Under 5
In terms of disability age under 5, the demographic groups most similar to Albanians are Chinese (1.1%, a difference of 0.040%), Ethiopian (1.1%, a difference of 0.070%), Immigrants from Cuba (1.1%, a difference of 0.17%), Spanish American (1.1%, a difference of 0.20%), and Sri Lankan (1.1%, a difference of 0.26%).
| Demographics | Rating | Rank | Disability Age Under 5 |
| Immigrants | Zaire | 97.8 /100 | #84 | Exceptional 1.1% |
| Sudanese | 97.7 /100 | #85 | Exceptional 1.1% |
| Okinawans | 97.6 /100 | #86 | Exceptional 1.1% |
| Ugandans | 97.5 /100 | #87 | Exceptional 1.1% |
| Immigrants | Dominican Republic | 97.5 /100 | #88 | Exceptional 1.1% |
| Ethiopians | 97.2 /100 | #89 | Exceptional 1.1% |
| Chinese | 97.2 /100 | #90 | Exceptional 1.1% |
| Albanians | 97.2 /100 | #91 | Exceptional 1.1% |
| Immigrants | Cuba | 97.0 /100 | #92 | Exceptional 1.1% |
| Spanish Americans | 96.9 /100 | #93 | Exceptional 1.1% |
| Sri Lankans | 96.8 /100 | #94 | Exceptional 1.1% |
| Immigrants | Moldova | 96.8 /100 | #95 | Exceptional 1.1% |
| Mongolians | 96.6 /100 | #96 | Exceptional 1.1% |
| Immigrants | Iraq | 96.5 /100 | #97 | Exceptional 1.1% |
| Immigrants | South Eastern Asia | 96.5 /100 | #98 | Exceptional 1.1% |
Demographics Similar to Australians by Disability Age Under 5
In terms of disability age under 5, the demographic groups most similar to Australians are Immigrants from Brazil (1.4%, a difference of 0.080%), Immigrants from Liberia (1.4%, a difference of 0.14%), Immigrants from Western Europe (1.4%, a difference of 0.56%), Immigrants from Scotland (1.4%, a difference of 0.67%), and Immigrants from Hungary (1.4%, a difference of 0.72%).
| Demographics | Rating | Rank | Disability Age Under 5 |
| Russians | 1.0 /100 | #246 | Tragic 1.4% |
| Immigrants | England | 1.0 /100 | #247 | Tragic 1.4% |
| Eastern Europeans | 1.0 /100 | #248 | Tragic 1.4% |
| Bermudans | 1.0 /100 | #249 | Tragic 1.4% |
| Africans | 1.0 /100 | #250 | Tragic 1.4% |
| Immigrants | Hungary | 1.0 /100 | #251 | Tragic 1.4% |
| Immigrants | Scotland | 0.9 /100 | #252 | Tragic 1.4% |
| Australians | 0.7 /100 | #253 | Tragic 1.4% |
| Immigrants | Brazil | 0.7 /100 | #254 | Tragic 1.4% |
| Immigrants | Liberia | 0.6 /100 | #255 | Tragic 1.4% |
| Immigrants | Western Europe | 0.5 /100 | #256 | Tragic 1.4% |
| Slovenes | 0.3 /100 | #257 | Tragic 1.4% |
| Costa Ricans | 0.3 /100 | #258 | Tragic 1.4% |
| Immigrants | Southern Europe | 0.3 /100 | #259 | Tragic 1.4% |
| Slavs | 0.3 /100 | #260 | Tragic 1.4% |