Albanian vs Immigrants from Oceania Disability Age Under 5
COMPARE
Albanian
Immigrants from Oceania
Disability Age Under 5
Disability Age Under 5 Comparison
Albanians
Immigrants from Oceania
1.1%
DISABILITY AGE UNDER 5
97.2/ 100
METRIC RATING
91st/ 347
METRIC RANK
1.2%
DISABILITY AGE UNDER 5
94.2/ 100
METRIC RATING
113th/ 347
METRIC RANK
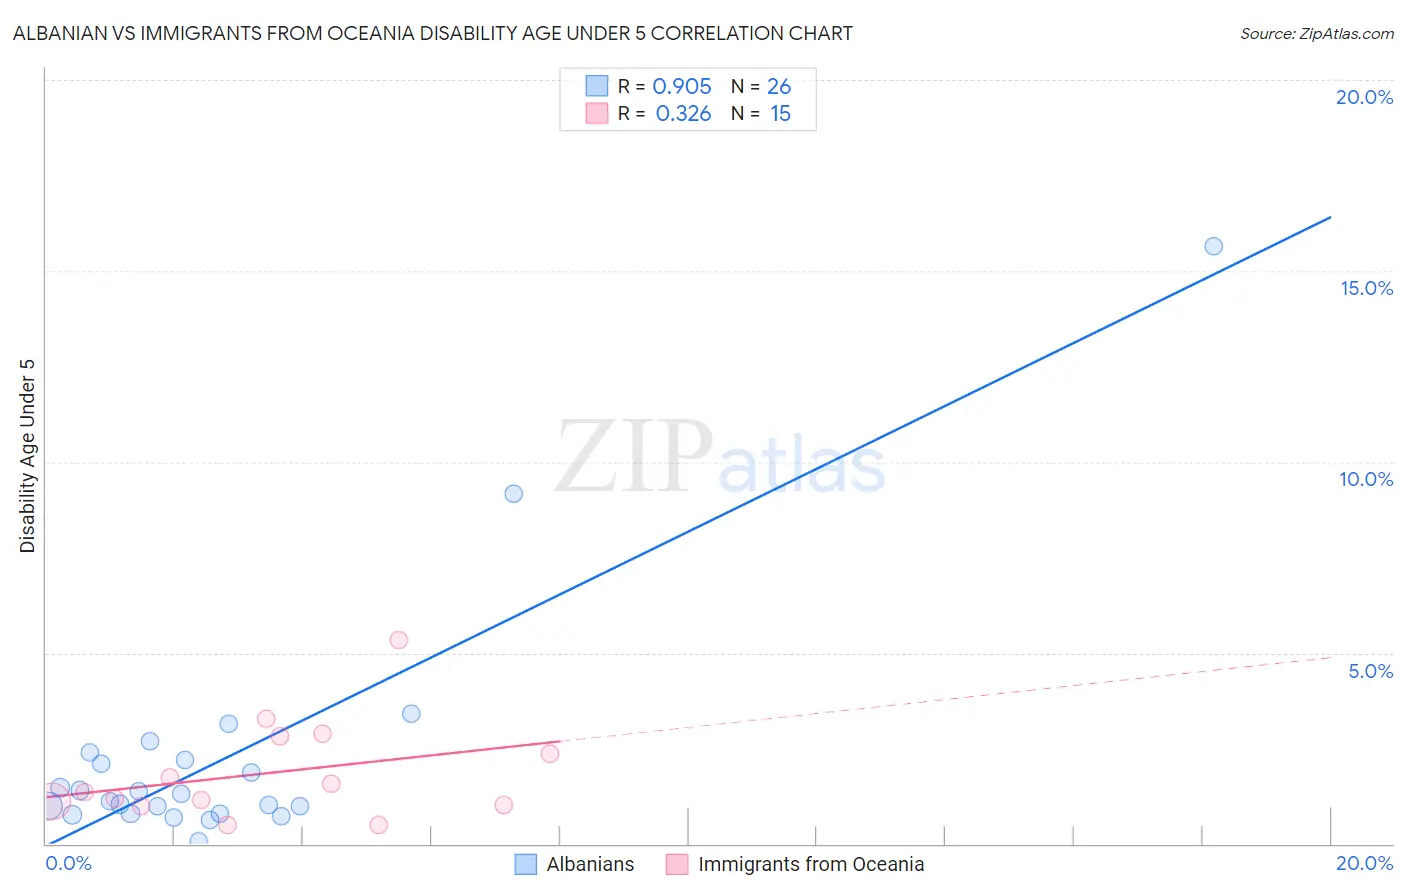
Albanian vs Immigrants from Oceania Disability Age Under 5 Correlation Chart
The statistical analysis conducted on geographies consisting of 123,207,813 people shows a near-perfect positive correlation between the proportion of Albanians and percentage of population with a disability under the age of 5 in the United States with a correlation coefficient (R) of 0.905 and weighted average of 1.1%. Similarly, the statistical analysis conducted on geographies consisting of 180,365,611 people shows a mild positive correlation between the proportion of Immigrants from Oceania and percentage of population with a disability under the age of 5 in the United States with a correlation coefficient (R) of 0.326 and weighted average of 1.2%, a difference of 1.8%.
Disability Age Under 5 Correlation Summary
| Measurement | Albanian | Immigrants from Oceania |
| Minimum | 0.063% | 0.49% |
| Maximum | 15.7% | 5.3% |
| Range | 15.6% | 4.9% |
| Mean | 2.3% | 1.9% |
| Median | 1.2% | 1.3% |
| Interquartile 25% (IQ1) | 0.78% | 1.0% |
| Interquartile 75% (IQ3) | 2.2% | 2.8% |
| Interquartile Range (IQR) | 1.4% | 1.8% |
| Standard Deviation (Sample) | 3.2% | 1.3% |
| Standard Deviation (Population) | 3.2% | 1.2% |
Similar Demographics by Disability Age Under 5
Demographics Similar to Albanians by Disability Age Under 5
In terms of disability age under 5, the demographic groups most similar to Albanians are Chinese (1.1%, a difference of 0.040%), Ethiopian (1.1%, a difference of 0.070%), Immigrants from Cuba (1.1%, a difference of 0.17%), Spanish American (1.1%, a difference of 0.20%), and Sri Lankan (1.1%, a difference of 0.26%).
| Demographics | Rating | Rank | Disability Age Under 5 |
| Immigrants | Zaire | 97.8 /100 | #84 | Exceptional 1.1% |
| Sudanese | 97.7 /100 | #85 | Exceptional 1.1% |
| Okinawans | 97.6 /100 | #86 | Exceptional 1.1% |
| Ugandans | 97.5 /100 | #87 | Exceptional 1.1% |
| Immigrants | Dominican Republic | 97.5 /100 | #88 | Exceptional 1.1% |
| Ethiopians | 97.2 /100 | #89 | Exceptional 1.1% |
| Chinese | 97.2 /100 | #90 | Exceptional 1.1% |
| Albanians | 97.2 /100 | #91 | Exceptional 1.1% |
| Immigrants | Cuba | 97.0 /100 | #92 | Exceptional 1.1% |
| Spanish Americans | 96.9 /100 | #93 | Exceptional 1.1% |
| Sri Lankans | 96.8 /100 | #94 | Exceptional 1.1% |
| Immigrants | Moldova | 96.8 /100 | #95 | Exceptional 1.1% |
| Mongolians | 96.6 /100 | #96 | Exceptional 1.1% |
| Immigrants | Iraq | 96.5 /100 | #97 | Exceptional 1.1% |
| Immigrants | South Eastern Asia | 96.5 /100 | #98 | Exceptional 1.1% |
Demographics Similar to Immigrants from Oceania by Disability Age Under 5
In terms of disability age under 5, the demographic groups most similar to Immigrants from Oceania are Immigrants from Australia (1.2%, a difference of 0.060%), Belizean (1.2%, a difference of 0.15%), Immigrants from Caribbean (1.2%, a difference of 0.16%), Senegalese (1.2%, a difference of 0.17%), and Immigrants from Northern Africa (1.2%, a difference of 0.18%).
| Demographics | Rating | Rank | Disability Age Under 5 |
| Cambodians | 95.4 /100 | #106 | Exceptional 1.2% |
| Immigrants | West Indies | 95.3 /100 | #107 | Exceptional 1.2% |
| Iraqis | 95.1 /100 | #108 | Exceptional 1.2% |
| Immigrants | Panama | 95.0 /100 | #109 | Exceptional 1.2% |
| Immigrants | Lebanon | 95.0 /100 | #110 | Exceptional 1.2% |
| Senegalese | 94.6 /100 | #111 | Exceptional 1.2% |
| Immigrants | Australia | 94.4 /100 | #112 | Exceptional 1.2% |
| Immigrants | Oceania | 94.2 /100 | #113 | Exceptional 1.2% |
| Belizeans | 93.9 /100 | #114 | Exceptional 1.2% |
| Immigrants | Caribbean | 93.8 /100 | #115 | Exceptional 1.2% |
| Immigrants | Northern Africa | 93.8 /100 | #116 | Exceptional 1.2% |
| Immigrants | Philippines | 93.5 /100 | #117 | Exceptional 1.2% |
| Immigrants | Venezuela | 93.4 /100 | #118 | Exceptional 1.2% |
| Bhutanese | 92.5 /100 | #119 | Exceptional 1.2% |
| Immigrants | Eritrea | 92.3 /100 | #120 | Exceptional 1.2% |