Albanian vs Cree 9th Grade
COMPARE
Albanian
Cree
9th Grade
9th Grade Comparison
Albanians
Cree
95.1%
9TH GRADE
76.1/ 100
METRIC RATING
153rd/ 347
METRIC RANK
95.4%
9TH GRADE
95.5/ 100
METRIC RATING
121st/ 347
METRIC RANK
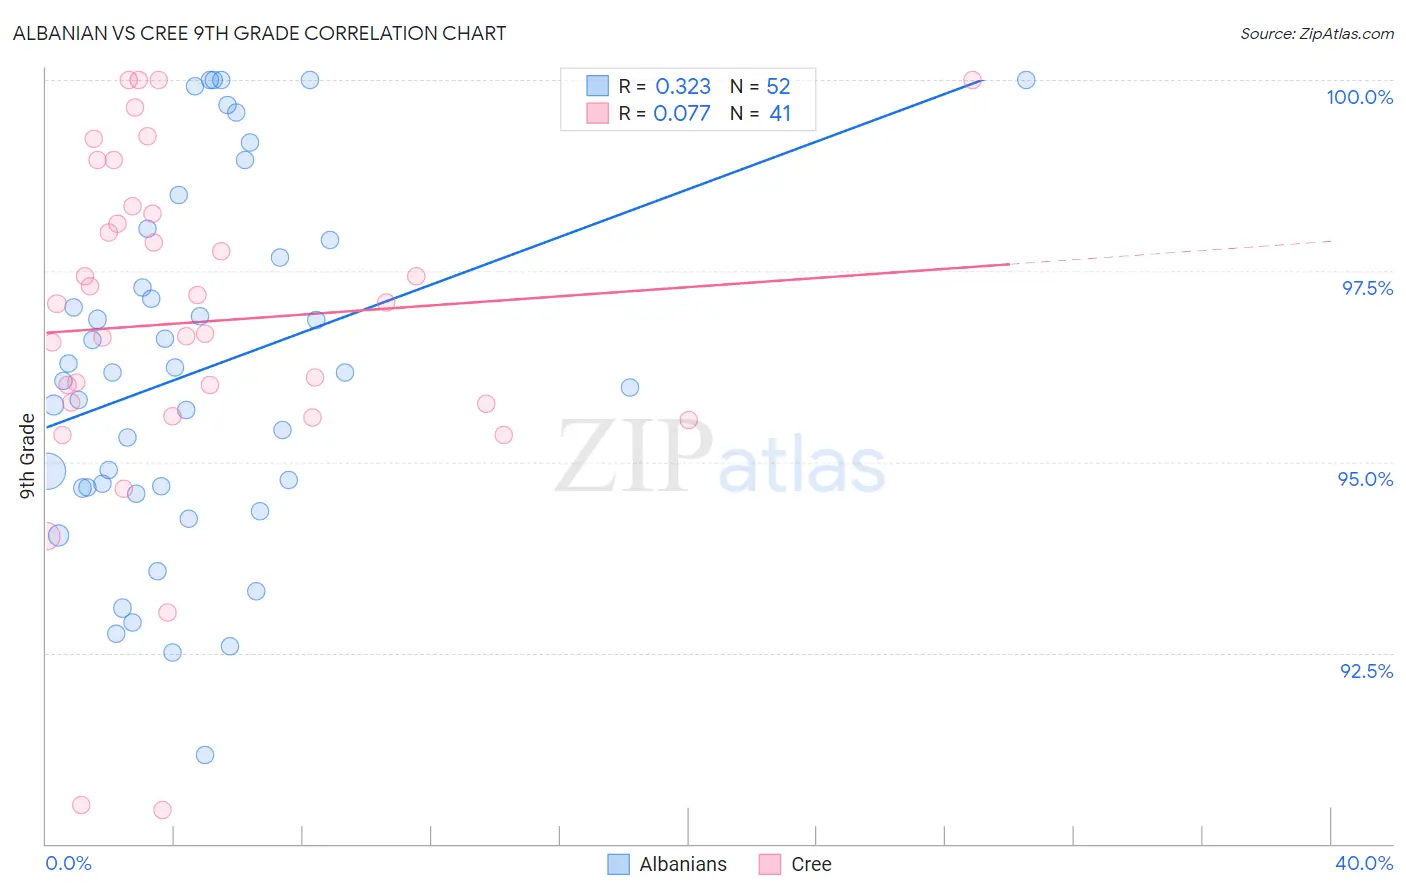
Albanian vs Cree 9th Grade Correlation Chart
The statistical analysis conducted on geographies consisting of 193,265,850 people shows a mild positive correlation between the proportion of Albanians and percentage of population with at least 9th grade education in the United States with a correlation coefficient (R) of 0.323 and weighted average of 95.1%. Similarly, the statistical analysis conducted on geographies consisting of 76,211,744 people shows a slight positive correlation between the proportion of Cree and percentage of population with at least 9th grade education in the United States with a correlation coefficient (R) of 0.077 and weighted average of 95.4%, a difference of 0.35%.
9th Grade Correlation Summary
| Measurement | Albanian | Cree |
| Minimum | 91.2% | 90.4% |
| Maximum | 100.0% | 100.0% |
| Range | 8.8% | 9.6% |
| Mean | 96.2% | 96.8% |
| Median | 96.1% | 97.1% |
| Interquartile 25% (IQ1) | 94.7% | 95.7% |
| Interquartile 75% (IQ3) | 97.8% | 98.3% |
| Interquartile Range (IQR) | 3.1% | 2.6% |
| Standard Deviation (Sample) | 2.3% | 2.2% |
| Standard Deviation (Population) | 2.3% | 2.2% |
Similar Demographics by 9th Grade
Demographics Similar to Albanians by 9th Grade
In terms of 9th grade, the demographic groups most similar to Albanians are Cajun (95.1%, a difference of 0.010%), Ugandan (95.1%, a difference of 0.010%), Arab (95.1%, a difference of 0.010%), Immigrants from Kazakhstan (95.1%, a difference of 0.010%), and Kenyan (95.1%, a difference of 0.030%).
| Demographics | Rating | Rank | 9th Grade |
| Immigrants | Sri Lanka | 82.1 /100 | #146 | Excellent 95.1% |
| Choctaw | 81.9 /100 | #147 | Excellent 95.1% |
| Immigrants | Jordan | 81.2 /100 | #148 | Excellent 95.1% |
| Immigrants | Korea | 79.6 /100 | #149 | Good 95.1% |
| Kenyans | 79.1 /100 | #150 | Good 95.1% |
| Cajuns | 77.3 /100 | #151 | Good 95.1% |
| Ugandans | 77.0 /100 | #152 | Good 95.1% |
| Albanians | 76.1 /100 | #153 | Good 95.1% |
| Arabs | 74.9 /100 | #154 | Good 95.1% |
| Immigrants | Kazakhstan | 74.7 /100 | #155 | Good 95.1% |
| Immigrants | Kenya | 73.1 /100 | #156 | Good 95.0% |
| Mongolians | 73.0 /100 | #157 | Good 95.0% |
| Egyptians | 70.1 /100 | #158 | Good 95.0% |
| Immigrants | Ukraine | 67.4 /100 | #159 | Good 95.0% |
| Immigrants | Italy | 66.6 /100 | #160 | Good 95.0% |
Demographics Similar to Cree by 9th Grade
In terms of 9th grade, the demographic groups most similar to Cree are Immigrants from Romania (95.4%, a difference of 0.0%), Immigrants from Turkey (95.4%, a difference of 0.0%), Soviet Union (95.4%, a difference of 0.0%), Cambodian (95.4%, a difference of 0.0%), and Immigrants from Kuwait (95.4%, a difference of 0.0%).
| Demographics | Rating | Rank | 9th Grade |
| German Russians | 96.1 /100 | #114 | Exceptional 95.4% |
| Burmese | 96.0 /100 | #115 | Exceptional 95.4% |
| Immigrants | Europe | 95.7 /100 | #116 | Exceptional 95.4% |
| Immigrants | Romania | 95.6 /100 | #117 | Exceptional 95.4% |
| Immigrants | Turkey | 95.6 /100 | #118 | Exceptional 95.4% |
| Soviet Union | 95.6 /100 | #119 | Exceptional 95.4% |
| Cambodians | 95.6 /100 | #120 | Exceptional 95.4% |
| Cree | 95.5 /100 | #121 | Exceptional 95.4% |
| Immigrants | Kuwait | 95.5 /100 | #122 | Exceptional 95.4% |
| Kiowa | 95.3 /100 | #123 | Exceptional 95.4% |
| Shoshone | 95.3 /100 | #124 | Exceptional 95.4% |
| Immigrants | South Central Asia | 95.1 /100 | #125 | Exceptional 95.4% |
| Immigrants | Serbia | 94.4 /100 | #126 | Exceptional 95.4% |
| Palestinians | 94.3 /100 | #127 | Exceptional 95.4% |
| Immigrants | Hungary | 94.2 /100 | #128 | Exceptional 95.4% |