Albanian vs Bermudan Householder Income Under 25 years
COMPARE
Albanian
Bermudan
Householder Income Under 25 years
Householder Income Under 25 years Comparison
Albanians
Bermudans
$53,794
HOUSEHOLDER INCOME UNDER 25 YEARS
98.1/ 100
METRIC RATING
106th/ 347
METRIC RANK
$47,359
HOUSEHOLDER INCOME UNDER 25 YEARS
0.0/ 100
METRIC RATING
312th/ 347
METRIC RANK
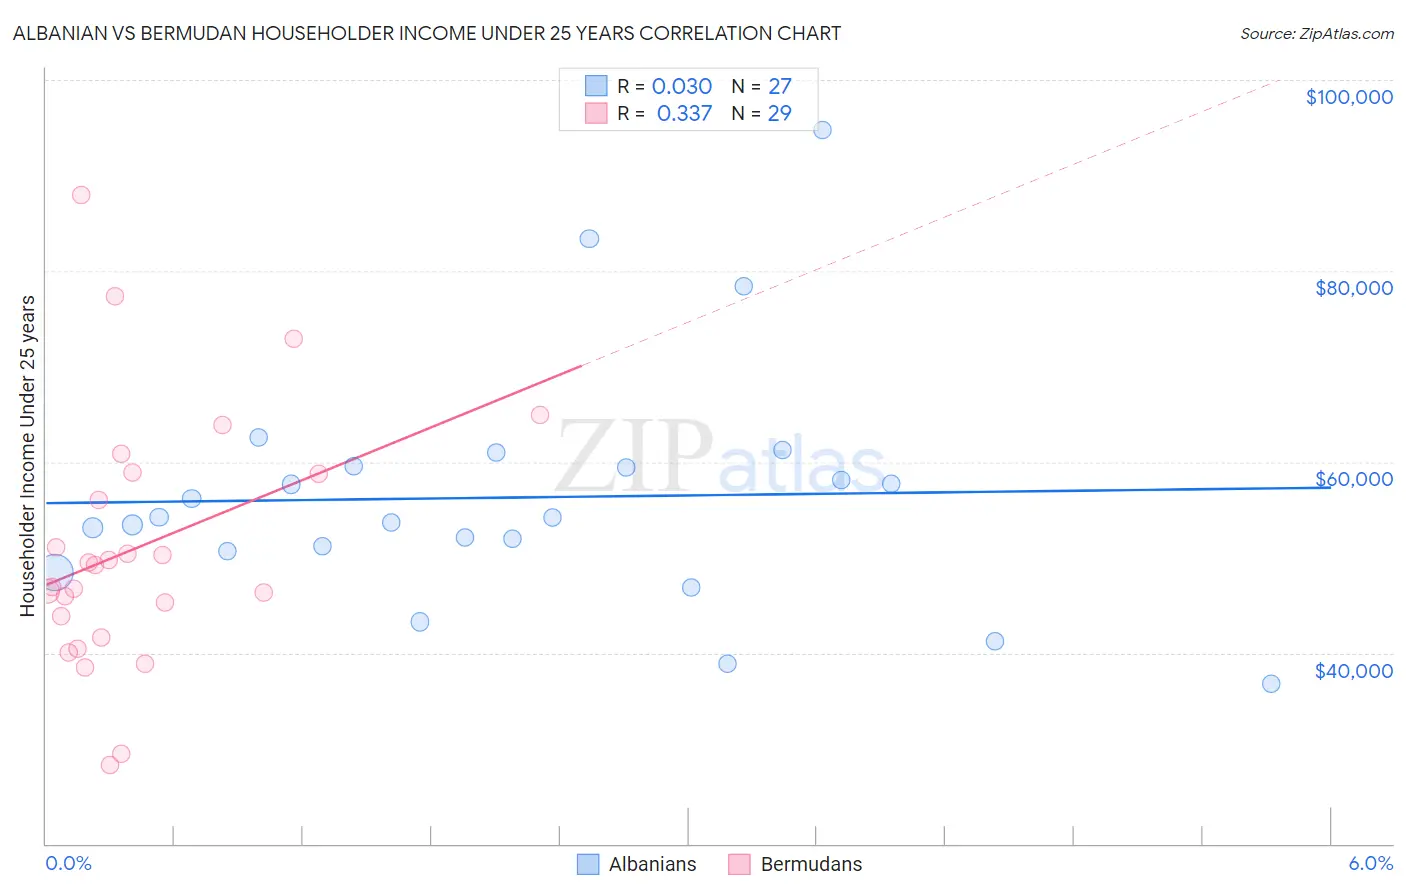
Albanian vs Bermudan Householder Income Under 25 years Correlation Chart
The statistical analysis conducted on geographies consisting of 168,875,521 people shows no correlation between the proportion of Albanians and household income with householder under the age of 25 in the United States with a correlation coefficient (R) of 0.030 and weighted average of $53,794. Similarly, the statistical analysis conducted on geographies consisting of 52,946,816 people shows a mild positive correlation between the proportion of Bermudans and household income with householder under the age of 25 in the United States with a correlation coefficient (R) of 0.337 and weighted average of $47,359, a difference of 13.6%.
Householder Income Under 25 years Correlation Summary
| Measurement | Albanian | Bermudan |
| Minimum | $36,785 | $28,306 |
| Maximum | $94,768 | $87,995 |
| Range | $57,984 | $59,689 |
| Mean | $56,271 | $51,037 |
| Median | $54,178 | $49,161 |
| Interquartile 25% (IQ1) | $50,650 | $42,763 |
| Interquartile 75% (IQ3) | $59,543 | $58,788 |
| Interquartile Range (IQR) | $8,893 | $16,024 |
| Standard Deviation (Sample) | $12,666 | $13,290 |
| Standard Deviation (Population) | $12,429 | $13,059 |
Similar Demographics by Householder Income Under 25 years
Demographics Similar to Albanians by Householder Income Under 25 years
In terms of householder income under 25 years, the demographic groups most similar to Albanians are Immigrants from France ($53,805, a difference of 0.020%), Ethiopian ($53,818, a difference of 0.050%), Ukrainian ($53,843, a difference of 0.090%), Australian ($53,739, a difference of 0.10%), and Maltese ($53,735, a difference of 0.11%).
| Demographics | Rating | Rank | Householder Income Under 25 years |
| Alaska Natives | 98.8 /100 | #99 | Exceptional $54,000 |
| Immigrants | Kazakhstan | 98.8 /100 | #100 | Exceptional $53,990 |
| South Americans | 98.6 /100 | #101 | Exceptional $53,939 |
| Ecuadorians | 98.5 /100 | #102 | Exceptional $53,911 |
| Ukrainians | 98.3 /100 | #103 | Exceptional $53,843 |
| Ethiopians | 98.2 /100 | #104 | Exceptional $53,818 |
| Immigrants | France | 98.1 /100 | #105 | Exceptional $53,805 |
| Albanians | 98.1 /100 | #106 | Exceptional $53,794 |
| Australians | 97.8 /100 | #107 | Exceptional $53,739 |
| Maltese | 97.8 /100 | #108 | Exceptional $53,735 |
| Immigrants | Ecuador | 97.7 /100 | #109 | Exceptional $53,722 |
| Greeks | 97.7 /100 | #110 | Exceptional $53,715 |
| Immigrants | Colombia | 97.7 /100 | #111 | Exceptional $53,714 |
| Immigrants | Oceania | 97.5 /100 | #112 | Exceptional $53,680 |
| Romanians | 97.2 /100 | #113 | Exceptional $53,632 |
Demographics Similar to Bermudans by Householder Income Under 25 years
In terms of householder income under 25 years, the demographic groups most similar to Bermudans are Ottawa ($47,366, a difference of 0.010%), Iroquois ($47,380, a difference of 0.040%), U.S. Virgin Islander ($47,448, a difference of 0.19%), Comanche ($47,518, a difference of 0.34%), and Delaware ($47,159, a difference of 0.43%).
| Demographics | Rating | Rank | Householder Income Under 25 years |
| Cherokee | 0.0 /100 | #305 | Tragic $47,848 |
| Natives/Alaskans | 0.0 /100 | #306 | Tragic $47,704 |
| Bangladeshis | 0.0 /100 | #307 | Tragic $47,589 |
| Comanche | 0.0 /100 | #308 | Tragic $47,518 |
| U.S. Virgin Islanders | 0.0 /100 | #309 | Tragic $47,448 |
| Iroquois | 0.0 /100 | #310 | Tragic $47,380 |
| Ottawa | 0.0 /100 | #311 | Tragic $47,366 |
| Bermudans | 0.0 /100 | #312 | Tragic $47,359 |
| Delaware | 0.0 /100 | #313 | Tragic $47,159 |
| Chippewa | 0.0 /100 | #314 | Tragic $47,015 |
| Crow | 0.0 /100 | #315 | Tragic $47,012 |
| Sudanese | 0.0 /100 | #316 | Tragic $46,982 |
| Hopi | 0.0 /100 | #317 | Tragic $46,978 |
| Spanish Americans | 0.0 /100 | #318 | Tragic $46,913 |
| Africans | 0.0 /100 | #319 | Tragic $46,838 |