Houma vs Bangladeshi Hearing Disability
COMPARE
Houma
Bangladeshi
Hearing Disability
Hearing Disability Comparison
Houma
Bangladeshis
4.2%
HEARING DISABILITY
0.0/ 100
METRIC RATING
332nd/ 347
METRIC RANK
3.2%
HEARING DISABILITY
8.1/ 100
METRIC RATING
215th/ 347
METRIC RANK
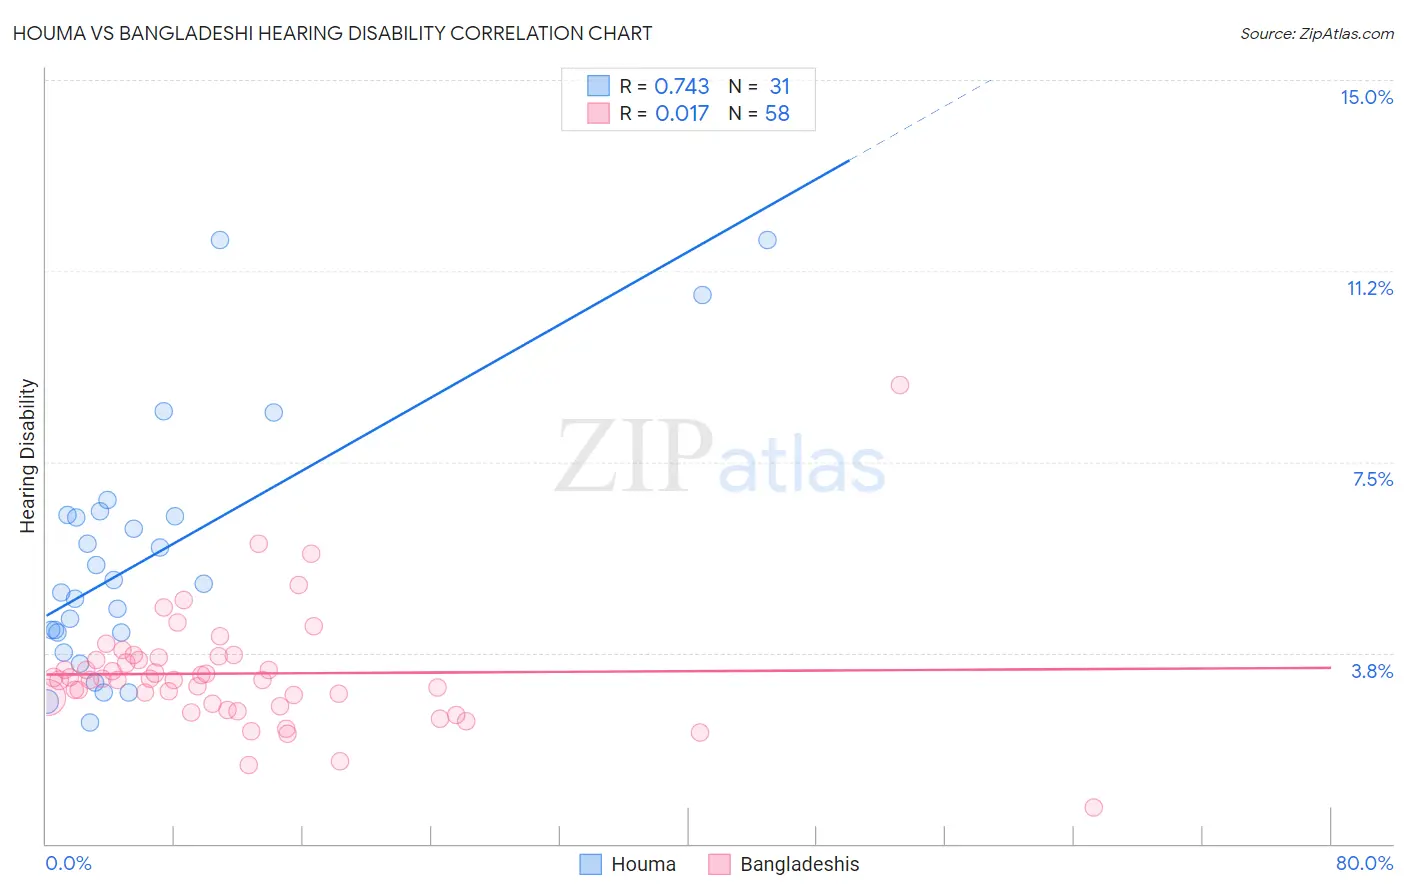
Houma vs Bangladeshi Hearing Disability Correlation Chart
The statistical analysis conducted on geographies consisting of 36,798,453 people shows a strong positive correlation between the proportion of Houma and percentage of population with hearing disability in the United States with a correlation coefficient (R) of 0.743 and weighted average of 4.2%. Similarly, the statistical analysis conducted on geographies consisting of 141,366,446 people shows no correlation between the proportion of Bangladeshis and percentage of population with hearing disability in the United States with a correlation coefficient (R) of 0.017 and weighted average of 3.2%, a difference of 33.7%.
Hearing Disability Correlation Summary
| Measurement | Houma | Bangladeshi |
| Minimum | 2.4% | 0.71% |
| Maximum | 11.9% | 9.0% |
| Range | 9.5% | 8.3% |
| Mean | 5.6% | 3.3% |
| Median | 5.1% | 3.2% |
| Interquartile 25% (IQ1) | 4.1% | 2.8% |
| Interquartile 75% (IQ3) | 6.5% | 3.7% |
| Interquartile Range (IQR) | 2.3% | 0.90% |
| Standard Deviation (Sample) | 2.5% | 1.2% |
| Standard Deviation (Population) | 2.4% | 1.2% |
Similar Demographics by Hearing Disability
Demographics Similar to Houma by Hearing Disability
In terms of hearing disability, the demographic groups most similar to Houma are Dutch West Indian (4.3%, a difference of 0.59%), Cherokee (4.2%, a difference of 0.68%), Native/Alaskan (4.2%, a difference of 0.83%), Aleut (4.3%, a difference of 1.1%), and Crow (4.2%, a difference of 1.6%).
| Demographics | Rating | Rank | Hearing Disability |
| Lumbee | 0.0 /100 | #325 | Tragic 4.1% |
| Potawatomi | 0.0 /100 | #326 | Tragic 4.1% |
| Arapaho | 0.0 /100 | #327 | Tragic 4.1% |
| Tohono O'odham | 0.0 /100 | #328 | Tragic 4.2% |
| Crow | 0.0 /100 | #329 | Tragic 4.2% |
| Natives/Alaskans | 0.0 /100 | #330 | Tragic 4.2% |
| Cherokee | 0.0 /100 | #331 | Tragic 4.2% |
| Houma | 0.0 /100 | #332 | Tragic 4.2% |
| Dutch West Indians | 0.0 /100 | #333 | Tragic 4.3% |
| Aleuts | 0.0 /100 | #334 | Tragic 4.3% |
| Kiowa | 0.0 /100 | #335 | Tragic 4.3% |
| Creek | 0.0 /100 | #336 | Tragic 4.4% |
| Chickasaw | 0.0 /100 | #337 | Tragic 4.5% |
| Alaska Natives | 0.0 /100 | #338 | Tragic 4.5% |
| Choctaw | 0.0 /100 | #339 | Tragic 4.5% |
Demographics Similar to Bangladeshis by Hearing Disability
In terms of hearing disability, the demographic groups most similar to Bangladeshis are Australian (3.2%, a difference of 0.010%), Immigrants from Norway (3.2%, a difference of 0.24%), Russian (3.2%, a difference of 0.32%), Immigrants from Northern Europe (3.2%, a difference of 0.35%), and New Zealander (3.2%, a difference of 0.41%).
| Demographics | Rating | Rank | Hearing Disability |
| Immigrants | Latvia | 12.7 /100 | #208 | Poor 3.1% |
| Immigrants | Hungary | 12.5 /100 | #209 | Poor 3.1% |
| Cape Verdeans | 12.2 /100 | #210 | Poor 3.1% |
| Romanians | 12.1 /100 | #211 | Poor 3.1% |
| Pakistanis | 11.1 /100 | #212 | Poor 3.1% |
| Immigrants | Iraq | 10.5 /100 | #213 | Poor 3.1% |
| Australians | 8.1 /100 | #214 | Tragic 3.2% |
| Bangladeshis | 8.1 /100 | #215 | Tragic 3.2% |
| Immigrants | Norway | 7.3 /100 | #216 | Tragic 3.2% |
| Russians | 7.1 /100 | #217 | Tragic 3.2% |
| Immigrants | Northern Europe | 7.0 /100 | #218 | Tragic 3.2% |
| New Zealanders | 6.8 /100 | #219 | Tragic 3.2% |
| Malaysians | 6.6 /100 | #220 | Tragic 3.2% |
| Immigrants | Laos | 6.6 /100 | #221 | Tragic 3.2% |
| Immigrants | Oceania | 6.5 /100 | #222 | Tragic 3.2% |