Albanian vs Alsatian Disability Age Over 75
COMPARE
Albanian
Alsatian
Disability Age Over 75
Disability Age Over 75 Comparison
Albanians
Alsatians
46.3%
DISABILITY AGE OVER 75
98.1/ 100
METRIC RATING
94th/ 347
METRIC RANK
47.3%
DISABILITY AGE OVER 75
51.9/ 100
METRIC RATING
173rd/ 347
METRIC RANK
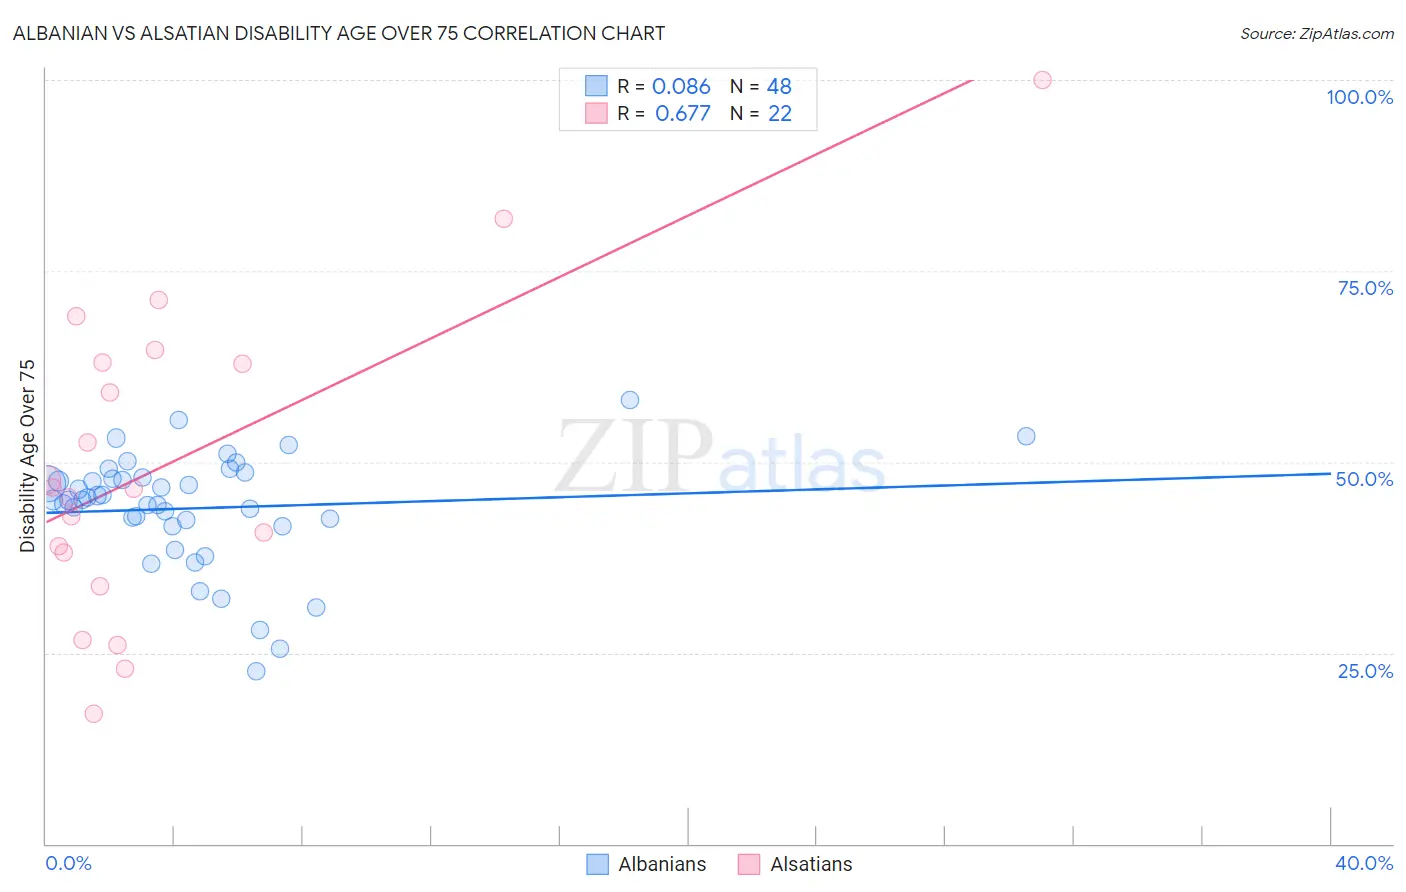
Albanian vs Alsatian Disability Age Over 75 Correlation Chart
The statistical analysis conducted on geographies consisting of 193,034,133 people shows a slight positive correlation between the proportion of Albanians and percentage of population with a disability over the age of 75 in the United States with a correlation coefficient (R) of 0.086 and weighted average of 46.3%. Similarly, the statistical analysis conducted on geographies consisting of 82,676,036 people shows a significant positive correlation between the proportion of Alsatians and percentage of population with a disability over the age of 75 in the United States with a correlation coefficient (R) of 0.677 and weighted average of 47.3%, a difference of 2.2%.
Disability Age Over 75 Correlation Summary
| Measurement | Albanian | Alsatian |
| Minimum | 22.6% | 17.1% |
| Maximum | 58.2% | 100.0% |
| Range | 35.6% | 82.9% |
| Mean | 43.9% | 49.9% |
| Median | 45.0% | 46.6% |
| Interquartile 25% (IQ1) | 42.0% | 38.2% |
| Interquartile 75% (IQ3) | 47.9% | 63.0% |
| Interquartile Range (IQR) | 5.9% | 24.8% |
| Standard Deviation (Sample) | 7.4% | 20.2% |
| Standard Deviation (Population) | 7.3% | 19.8% |
Similar Demographics by Disability Age Over 75
Demographics Similar to Albanians by Disability Age Over 75
In terms of disability age over 75, the demographic groups most similar to Albanians are Ugandan (46.3%, a difference of 0.030%), Immigrants from Brazil (46.3%, a difference of 0.030%), Immigrants from China (46.3%, a difference of 0.030%), German (46.3%, a difference of 0.040%), and Finnish (46.3%, a difference of 0.050%).
| Demographics | Rating | Rank | Disability Age Over 75 |
| Danes | 98.6 /100 | #87 | Exceptional 46.2% |
| Uruguayans | 98.4 /100 | #88 | Exceptional 46.2% |
| Immigrants | Saudi Arabia | 98.4 /100 | #89 | Exceptional 46.3% |
| Northern Europeans | 98.3 /100 | #90 | Exceptional 46.3% |
| Immigrants | Egypt | 98.3 /100 | #91 | Exceptional 46.3% |
| Germans | 98.2 /100 | #92 | Exceptional 46.3% |
| Ugandans | 98.2 /100 | #93 | Exceptional 46.3% |
| Albanians | 98.1 /100 | #94 | Exceptional 46.3% |
| Immigrants | Brazil | 98.0 /100 | #95 | Exceptional 46.3% |
| Immigrants | China | 98.0 /100 | #96 | Exceptional 46.3% |
| Finns | 97.9 /100 | #97 | Exceptional 46.3% |
| Immigrants | Japan | 97.8 /100 | #98 | Exceptional 46.3% |
| Palestinians | 97.7 /100 | #99 | Exceptional 46.3% |
| Immigrants | Eastern Europe | 97.7 /100 | #100 | Exceptional 46.3% |
| Mongolians | 97.7 /100 | #101 | Exceptional 46.3% |
Demographics Similar to Alsatians by Disability Age Over 75
In terms of disability age over 75, the demographic groups most similar to Alsatians are Scotch-Irish (47.3%, a difference of 0.010%), Immigrants from Africa (47.3%, a difference of 0.040%), White/Caucasian (47.3%, a difference of 0.040%), Immigrants from Haiti (47.3%, a difference of 0.050%), and German Russian (47.3%, a difference of 0.10%).
| Demographics | Rating | Rank | Disability Age Over 75 |
| Immigrants | Sierra Leone | 64.4 /100 | #166 | Good 47.2% |
| Moroccans | 62.9 /100 | #167 | Good 47.2% |
| Kenyans | 58.8 /100 | #168 | Average 47.2% |
| Celtics | 58.7 /100 | #169 | Average 47.2% |
| German Russians | 56.2 /100 | #170 | Average 47.3% |
| Immigrants | Africa | 53.6 /100 | #171 | Average 47.3% |
| Scotch-Irish | 52.5 /100 | #172 | Average 47.3% |
| Alsatians | 51.9 /100 | #173 | Average 47.3% |
| Whites/Caucasians | 50.0 /100 | #174 | Average 47.3% |
| Immigrants | Haiti | 49.7 /100 | #175 | Average 47.3% |
| Ecuadorians | 46.7 /100 | #176 | Average 47.4% |
| Haitians | 44.6 /100 | #177 | Average 47.4% |
| Cubans | 42.1 /100 | #178 | Average 47.4% |
| Sierra Leoneans | 41.7 /100 | #179 | Average 47.4% |
| Immigrants | Ecuador | 41.7 /100 | #180 | Average 47.4% |