Immigrants from West Indies vs Immigrants from Eastern Asia Disability Age 65 to 74
COMPARE
Immigrants from West Indies
Immigrants from Eastern Asia
Disability Age 65 to 74
Disability Age 65 to 74 Comparison
Immigrants from West Indies
Immigrants from Eastern Asia
23.9%
DISABILITY AGE 65 TO 74
15.9/ 100
METRIC RATING
211th/ 347
METRIC RANK
20.3%
DISABILITY AGE 65 TO 74
100.0/ 100
METRIC RATING
10th/ 347
METRIC RANK
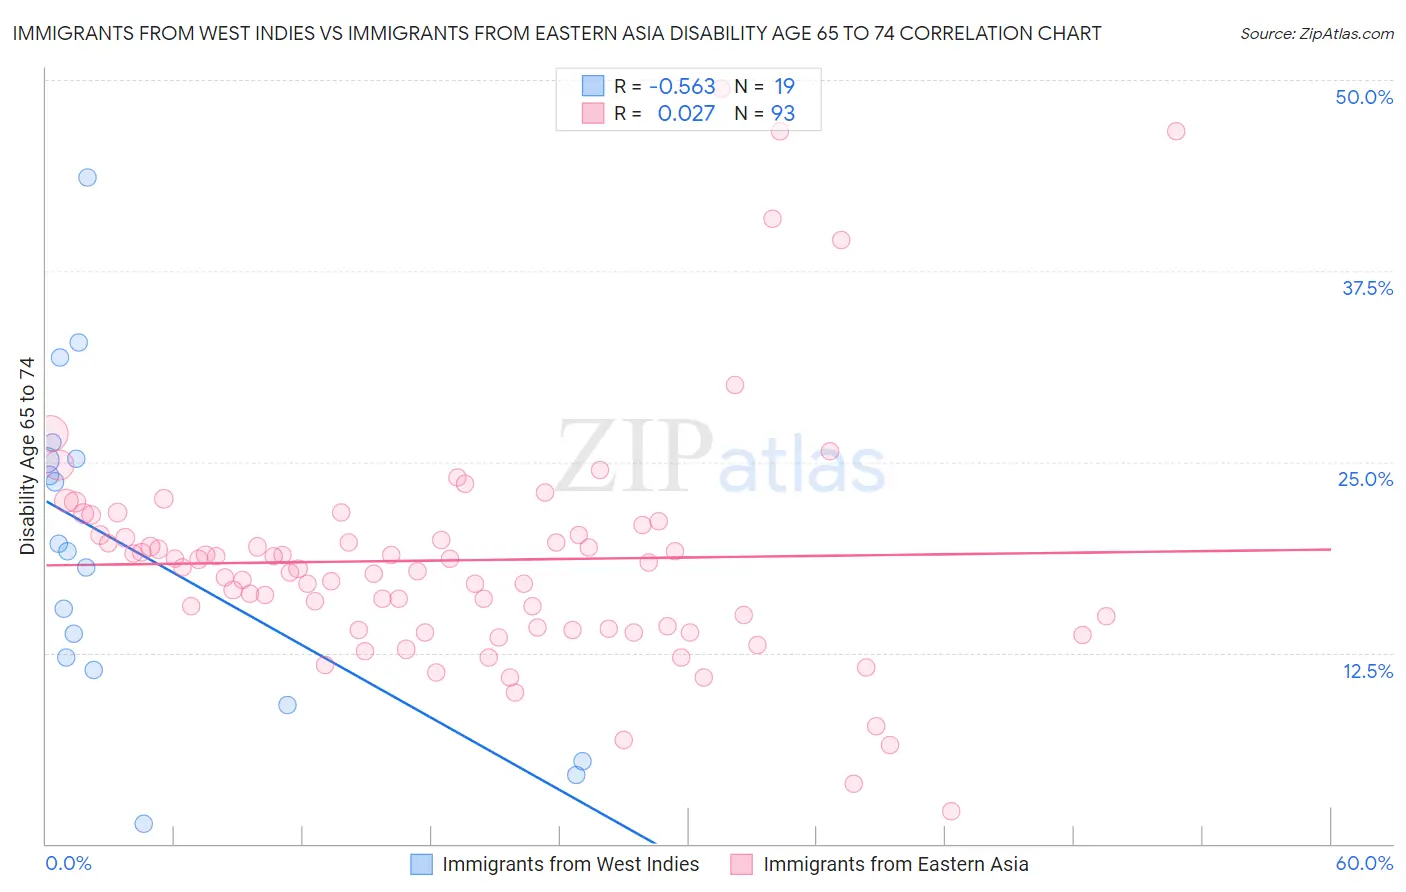
Immigrants from West Indies vs Immigrants from Eastern Asia Disability Age 65 to 74 Correlation Chart
The statistical analysis conducted on geographies consisting of 72,453,318 people shows a substantial negative correlation between the proportion of Immigrants from West Indies and percentage of population with a disability between the ages 65 and 75 in the United States with a correlation coefficient (R) of -0.563 and weighted average of 23.9%. Similarly, the statistical analysis conducted on geographies consisting of 498,306,983 people shows no correlation between the proportion of Immigrants from Eastern Asia and percentage of population with a disability between the ages 65 and 75 in the United States with a correlation coefficient (R) of 0.027 and weighted average of 20.3%, a difference of 17.8%.
Disability Age 65 to 74 Correlation Summary
| Measurement | Immigrants from West Indies | Immigrants from Eastern Asia |
| Minimum | 1.3% | 2.2% |
| Maximum | 43.6% | 49.4% |
| Range | 42.3% | 47.2% |
| Mean | 19.1% | 18.6% |
| Median | 19.1% | 18.0% |
| Interquartile 25% (IQ1) | 11.4% | 14.0% |
| Interquartile 75% (IQ3) | 25.2% | 20.2% |
| Interquartile Range (IQR) | 13.9% | 6.1% |
| Standard Deviation (Sample) | 10.8% | 7.9% |
| Standard Deviation (Population) | 10.5% | 7.8% |
Similar Demographics by Disability Age 65 to 74
Demographics Similar to Immigrants from West Indies by Disability Age 65 to 74
In terms of disability age 65 to 74, the demographic groups most similar to Immigrants from West Indies are French (23.9%, a difference of 0.020%), Trinidadian and Tobagonian (23.9%, a difference of 0.050%), Nicaraguan (23.9%, a difference of 0.19%), Immigrants from Oceania (24.0%, a difference of 0.26%), and Pennsylvania German (24.0%, a difference of 0.31%).
| Demographics | Rating | Rank | Disability Age 65 to 74 |
| Immigrants | Grenada | 22.1 /100 | #204 | Fair 23.8% |
| Tongans | 20.8 /100 | #205 | Fair 23.8% |
| Immigrants | Jamaica | 20.7 /100 | #206 | Fair 23.8% |
| Immigrants | Sudan | 20.1 /100 | #207 | Fair 23.8% |
| Immigrants | Barbados | 19.6 /100 | #208 | Poor 23.8% |
| Immigrants | Kenya | 19.6 /100 | #209 | Poor 23.8% |
| Trinidadians and Tobagonians | 16.4 /100 | #210 | Poor 23.9% |
| Immigrants | West Indies | 15.9 /100 | #211 | Poor 23.9% |
| French | 15.7 /100 | #212 | Poor 23.9% |
| Nicaraguans | 14.3 /100 | #213 | Poor 23.9% |
| Immigrants | Oceania | 13.6 /100 | #214 | Poor 24.0% |
| Pennsylvania Germans | 13.3 /100 | #215 | Poor 24.0% |
| Jamaicans | 12.2 /100 | #216 | Poor 24.0% |
| Immigrants | Portugal | 11.7 /100 | #217 | Poor 24.0% |
| Immigrants | Nigeria | 11.7 /100 | #218 | Poor 24.0% |
Demographics Similar to Immigrants from Eastern Asia by Disability Age 65 to 74
In terms of disability age 65 to 74, the demographic groups most similar to Immigrants from Eastern Asia are Immigrants from China (20.3%, a difference of 0.070%), Immigrants from Ireland (20.3%, a difference of 0.16%), Immigrants from Korea (20.4%, a difference of 0.37%), Immigrants from Singapore (20.4%, a difference of 0.76%), and Thai (20.1%, a difference of 1.0%).
| Demographics | Rating | Rank | Disability Age 65 to 74 |
| Immigrants | India | 100.0 /100 | #3 | Exceptional 19.7% |
| Immigrants | Hong Kong | 100.0 /100 | #4 | Exceptional 19.9% |
| Immigrants | Israel | 100.0 /100 | #5 | Exceptional 19.9% |
| Iranians | 100.0 /100 | #6 | Exceptional 19.9% |
| Cypriots | 100.0 /100 | #7 | Exceptional 20.1% |
| Thais | 100.0 /100 | #8 | Exceptional 20.1% |
| Immigrants | China | 100.0 /100 | #9 | Exceptional 20.3% |
| Immigrants | Eastern Asia | 100.0 /100 | #10 | Exceptional 20.3% |
| Immigrants | Ireland | 100.0 /100 | #11 | Exceptional 20.3% |
| Immigrants | Korea | 100.0 /100 | #12 | Exceptional 20.4% |
| Immigrants | Singapore | 100.0 /100 | #13 | Exceptional 20.4% |
| Indians (Asian) | 100.0 /100 | #14 | Exceptional 20.5% |
| Paraguayans | 100.0 /100 | #15 | Exceptional 20.5% |
| Immigrants | Lithuania | 100.0 /100 | #16 | Exceptional 20.5% |
| Immigrants | South Central Asia | 100.0 /100 | #17 | Exceptional 20.6% |