Alaskan Athabascan vs Bhutanese Female Poverty Among 18-24 Year Olds
COMPARE
Alaskan Athabascan
Bhutanese
Female Poverty Among 18-24 Year Olds
Female Poverty Among 18-24 Year Olds Comparison
Alaskan Athabascans
Bhutanese
22.5%
FEMALE POVERTY AMONG 18-24 YEAR OLDS
0.0/ 100
METRIC RATING
292nd/ 347
METRIC RANK
18.2%
FEMALE POVERTY AMONG 18-24 YEAR OLDS
100.0/ 100
METRIC RATING
49th/ 347
METRIC RANK
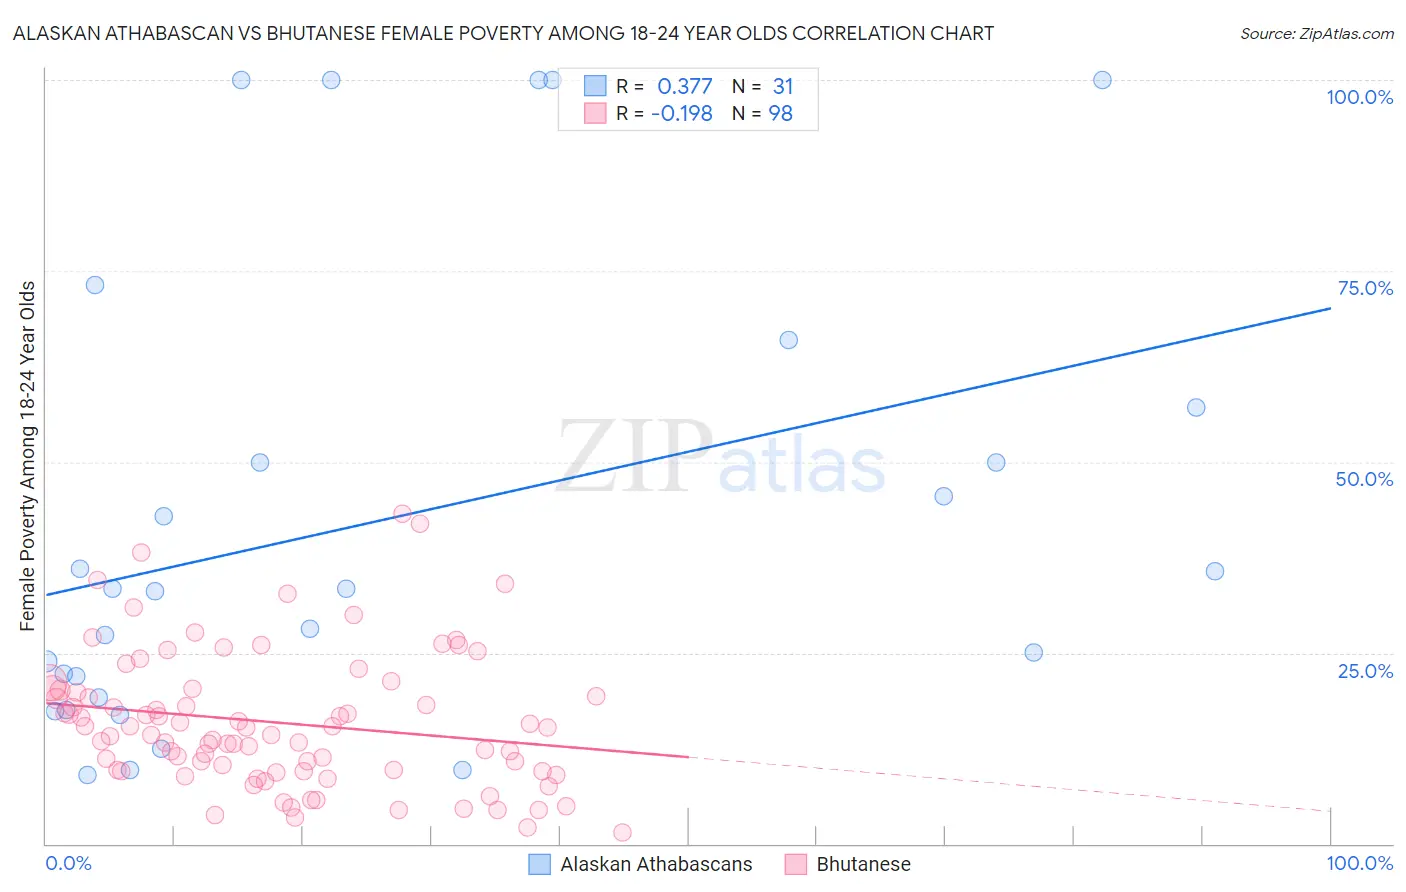
Alaskan Athabascan vs Bhutanese Female Poverty Among 18-24 Year Olds Correlation Chart
The statistical analysis conducted on geographies consisting of 45,408,377 people shows a mild positive correlation between the proportion of Alaskan Athabascans and poverty level among females between the ages 18 and 24 in the United States with a correlation coefficient (R) of 0.377 and weighted average of 22.5%. Similarly, the statistical analysis conducted on geographies consisting of 442,016,061 people shows a poor negative correlation between the proportion of Bhutanese and poverty level among females between the ages 18 and 24 in the United States with a correlation coefficient (R) of -0.198 and weighted average of 18.2%, a difference of 23.5%.
Female Poverty Among 18-24 Year Olds Correlation Summary
| Measurement | Alaskan Athabascan | Bhutanese |
| Minimum | 9.0% | 1.5% |
| Maximum | 100.0% | 43.1% |
| Range | 91.0% | 41.7% |
| Mean | 42.5% | 15.9% |
| Median | 33.3% | 14.7% |
| Interquartile 25% (IQ1) | 19.2% | 9.6% |
| Interquartile 75% (IQ3) | 57.1% | 20.1% |
| Interquartile Range (IQR) | 37.9% | 10.5% |
| Standard Deviation (Sample) | 30.1% | 8.8% |
| Standard Deviation (Population) | 29.7% | 8.7% |
Similar Demographics by Female Poverty Among 18-24 Year Olds
Demographics Similar to Alaskan Athabascans by Female Poverty Among 18-24 Year Olds
In terms of female poverty among 18-24 year olds, the demographic groups most similar to Alaskan Athabascans are U.S. Virgin Islander (22.5%, a difference of 0.030%), Bangladeshi (22.5%, a difference of 0.050%), Indonesian (22.5%, a difference of 0.070%), Shoshone (22.5%, a difference of 0.19%), and Menominee (22.5%, a difference of 0.30%).
| Demographics | Rating | Rank | Female Poverty Among 18-24 Year Olds |
| Ottawa | 0.0 /100 | #285 | Tragic 22.0% |
| Ugandans | 0.0 /100 | #286 | Tragic 22.1% |
| Immigrants | Middle Africa | 0.0 /100 | #287 | Tragic 22.1% |
| Dominicans | 0.0 /100 | #288 | Tragic 22.3% |
| French American Indians | 0.0 /100 | #289 | Tragic 22.3% |
| Immigrants | Senegal | 0.0 /100 | #290 | Tragic 22.4% |
| Bangladeshis | 0.0 /100 | #291 | Tragic 22.5% |
| Alaskan Athabascans | 0.0 /100 | #292 | Tragic 22.5% |
| U.S. Virgin Islanders | 0.0 /100 | #293 | Tragic 22.5% |
| Indonesians | 0.0 /100 | #294 | Tragic 22.5% |
| Shoshone | 0.0 /100 | #295 | Tragic 22.5% |
| Menominee | 0.0 /100 | #296 | Tragic 22.5% |
| Inupiat | 0.0 /100 | #297 | Tragic 22.6% |
| Central American Indians | 0.0 /100 | #298 | Tragic 22.6% |
| Cherokee | 0.0 /100 | #299 | Tragic 22.7% |
Demographics Similar to Bhutanese by Female Poverty Among 18-24 Year Olds
In terms of female poverty among 18-24 year olds, the demographic groups most similar to Bhutanese are Sri Lankan (18.2%, a difference of 0.030%), Asian (18.2%, a difference of 0.080%), Samoan (18.2%, a difference of 0.11%), Immigrants from Southern Europe (18.2%, a difference of 0.16%), and Immigrants from Eastern Europe (18.2%, a difference of 0.28%).
| Demographics | Rating | Rank | Female Poverty Among 18-24 Year Olds |
| Bulgarians | 100.0 /100 | #42 | Exceptional 18.1% |
| Macedonians | 100.0 /100 | #43 | Exceptional 18.1% |
| Nicaraguans | 100.0 /100 | #44 | Exceptional 18.1% |
| Spanish American Indians | 100.0 /100 | #45 | Exceptional 18.1% |
| Immigrants | Southern Europe | 100.0 /100 | #46 | Exceptional 18.2% |
| Asians | 100.0 /100 | #47 | Exceptional 18.2% |
| Sri Lankans | 100.0 /100 | #48 | Exceptional 18.2% |
| Bhutanese | 100.0 /100 | #49 | Exceptional 18.2% |
| Samoans | 100.0 /100 | #50 | Exceptional 18.2% |
| Immigrants | Eastern Europe | 99.9 /100 | #51 | Exceptional 18.2% |
| Immigrants | Ireland | 99.9 /100 | #52 | Exceptional 18.3% |
| Italians | 99.9 /100 | #53 | Exceptional 18.3% |
| Immigrants | Egypt | 99.9 /100 | #54 | Exceptional 18.4% |
| Albanians | 99.9 /100 | #55 | Exceptional 18.4% |
| Argentineans | 99.9 /100 | #56 | Exceptional 18.4% |