Ecuadorian vs Immigrants from Peru Disability Age 5 to 17
COMPARE
Ecuadorian
Immigrants from Peru
Disability Age 5 to 17
Disability Age 5 to 17 Comparison
Ecuadorians
Immigrants from Peru
5.5%
DISABILITY AGE 5 TO 17
79.7/ 100
METRIC RATING
153rd/ 347
METRIC RANK
5.3%
DISABILITY AGE 5 TO 17
99.1/ 100
METRIC RATING
93rd/ 347
METRIC RANK
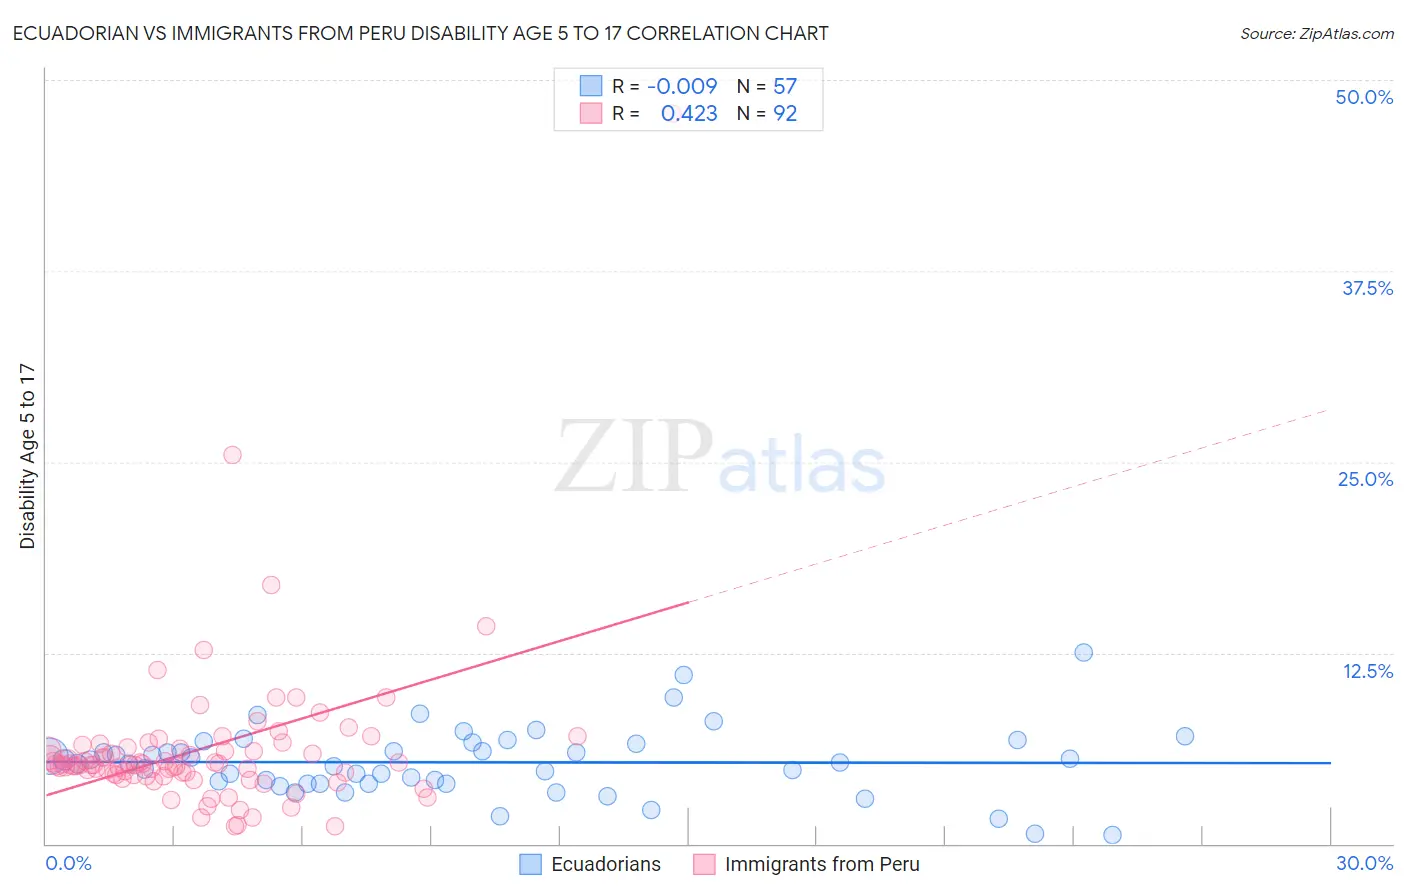
Ecuadorian vs Immigrants from Peru Disability Age 5 to 17 Correlation Chart
The statistical analysis conducted on geographies consisting of 315,899,023 people shows no correlation between the proportion of Ecuadorians and percentage of population with a disability between the ages 5 and 17 in the United States with a correlation coefficient (R) of -0.009 and weighted average of 5.5%. Similarly, the statistical analysis conducted on geographies consisting of 326,866,883 people shows a moderate positive correlation between the proportion of Immigrants from Peru and percentage of population with a disability between the ages 5 and 17 in the United States with a correlation coefficient (R) of 0.423 and weighted average of 5.3%, a difference of 4.4%.
Disability Age 5 to 17 Correlation Summary
| Measurement | Ecuadorian | Immigrants from Peru |
| Minimum | 0.57% | 1.2% |
| Maximum | 12.5% | 47.8% |
| Range | 11.9% | 46.7% |
| Mean | 5.3% | 6.2% |
| Median | 5.4% | 5.1% |
| Interquartile 25% (IQ1) | 3.9% | 4.5% |
| Interquartile 75% (IQ3) | 6.6% | 6.3% |
| Interquartile Range (IQR) | 2.7% | 1.8% |
| Standard Deviation (Sample) | 2.2% | 5.5% |
| Standard Deviation (Population) | 2.2% | 5.4% |
Similar Demographics by Disability Age 5 to 17
Demographics Similar to Ecuadorians by Disability Age 5 to 17
In terms of disability age 5 to 17, the demographic groups most similar to Ecuadorians are Ute (5.5%, a difference of 0.070%), Australian (5.5%, a difference of 0.070%), Estonian (5.5%, a difference of 0.080%), Immigrants from Ecuador (5.5%, a difference of 0.11%), and Hawaiian (5.5%, a difference of 0.13%).
| Demographics | Rating | Rank | Disability Age 5 to 17 |
| Albanians | 83.7 /100 | #146 | Excellent 5.5% |
| Immigrants | Albania | 83.1 /100 | #147 | Excellent 5.5% |
| Samoans | 81.9 /100 | #148 | Excellent 5.5% |
| Central Americans | 81.6 /100 | #149 | Excellent 5.5% |
| Guatemalans | 81.5 /100 | #150 | Excellent 5.5% |
| Estonians | 80.8 /100 | #151 | Excellent 5.5% |
| Ute | 80.6 /100 | #152 | Excellent 5.5% |
| Ecuadorians | 79.7 /100 | #153 | Good 5.5% |
| Australians | 78.8 /100 | #154 | Good 5.5% |
| Immigrants | Ecuador | 78.3 /100 | #155 | Good 5.5% |
| Hawaiians | 78.0 /100 | #156 | Good 5.5% |
| Immigrants | Costa Rica | 77.9 /100 | #157 | Good 5.5% |
| Immigrants | Nepal | 77.1 /100 | #158 | Good 5.5% |
| Immigrants | Zimbabwe | 75.3 /100 | #159 | Good 5.5% |
| South Africans | 73.3 /100 | #160 | Good 5.5% |
Demographics Similar to Immigrants from Peru by Disability Age 5 to 17
In terms of disability age 5 to 17, the demographic groups most similar to Immigrants from Peru are Immigrants from Jordan (5.3%, a difference of 0.070%), Luxembourger (5.3%, a difference of 0.080%), Mongolian (5.3%, a difference of 0.090%), Immigrants from Grenada (5.3%, a difference of 0.090%), and Immigrants from El Salvador (5.3%, a difference of 0.25%).
| Demographics | Rating | Rank | Disability Age 5 to 17 |
| Immigrants | St. Vincent and the Grenadines | 99.4 /100 | #86 | Exceptional 5.2% |
| Eastern Europeans | 99.4 /100 | #87 | Exceptional 5.2% |
| Immigrants | Croatia | 99.4 /100 | #88 | Exceptional 5.2% |
| Immigrants | Spain | 99.4 /100 | #89 | Exceptional 5.2% |
| Immigrants | Kuwait | 99.4 /100 | #90 | Exceptional 5.3% |
| Mongolians | 99.2 /100 | #91 | Exceptional 5.3% |
| Luxembourgers | 99.2 /100 | #92 | Exceptional 5.3% |
| Immigrants | Peru | 99.1 /100 | #93 | Exceptional 5.3% |
| Immigrants | Jordan | 99.1 /100 | #94 | Exceptional 5.3% |
| Immigrants | Grenada | 99.1 /100 | #95 | Exceptional 5.3% |
| Immigrants | El Salvador | 99.0 /100 | #96 | Exceptional 5.3% |
| Immigrants | Europe | 99.0 /100 | #97 | Exceptional 5.3% |
| Immigrants | Austria | 98.9 /100 | #98 | Exceptional 5.3% |
| Cambodians | 98.8 /100 | #99 | Exceptional 5.3% |
| Nepalese | 98.7 /100 | #100 | Exceptional 5.3% |