Afghan vs Immigrants from Africa Disability

COMPARE

Afghan
Race
Ancestry
AfghanAfricanAlaska NativeAlaskan AthabascanAlbanianAleutAlsatianAmericanApacheArabArapahoArgentineanArmenianAssyrian/Chaldean/SyriacAustralianAustrianBahamianBangladeshiBarbadianBasqueBelgianBelizeanBermudanBhutaneseBlackfeetBolivianBrazilianBritishBritish West IndianBulgarianBurmeseCajunCambodianCanadianCape VerdeanCarpatho RusynCelticCentral AmericanCentral American IndianCherokeeCheyenneChickasawChileanChineseChippewaChoctawColombianColvilleComancheCosta RicanCreeCreekCroatianCrowCubanCypriotCzechCzechoslovakianDanishDelawareDominicanDutchDutch West IndianEastern EuropeanEcuadorianEgyptianEnglishEstonianEthiopianEuropeanFijianFilipinoFinnishFrenchFrench American IndianFrench CanadianGermanGerman RussianGhanaianGreekGuamanian/ChamorroGuatemalanGuyaneseHaitianHmongHonduranHopiHoumaHungarianIcelanderIndian (Asian)IndonesianInupiatIranianIraqiIrishIroquoisIsraeliItalianJamaicanJapaneseJordanianKenyanKiowaKoreanLaotianLatvianLebaneseLiberianLithuanianLumbeeLuxembourgerMacedonianMalaysianMalteseMarshalleseMenomineeMexicanMexican American IndianMongolianMoroccanNative HawaiianNavajoNepaleseNew ZealanderNicaraguanNigerianNorthern EuropeanNorwegianOkinawanOsageOttawaPaiutePakistaniPalestinianPanamanianParaguayanPennsylvania GermanPeruvianPimaPolishPortuguesePotawatomiPuebloPuerto RicanPuget Sound SalishRomanianRussianSalvadoranSamoanScandinavianScotch-IrishScottishSeminoleSenegaleseSerbianShoshoneSierra LeoneanSiouxSlavicSlovakSloveneSomaliSouth AfricanSouth AmericanSouth American IndianSoviet UnionSpaniardSpanishSpanish AmericanSpanish American IndianSri LankanSubsaharan AfricanSudaneseSwedishSwissSyrianTaiwaneseThaiTlingit-HaidaTohono O'OdhamTonganTrinidadian and TobagonianTsimshianTurkishU.S. Virgin IslanderUgandanUkrainianUruguayanUteVenezuelanVietnameseWelshWest IndianYakamaYaquiYugoslavianYumanYup'ikZimbabwean
Immigration
NonimmigrantsImmigrantsAfghanistanAlbaniaArgentinaArmeniaAsiaAustraliaAustriaBahamasBangladeshBarbadosBelarusBelgiumBelizeBoliviaBosnia and HerzegovinaBrazilBulgariaBurma/MyanmarCabo VerdeCambodiaCameroonCanadaCaribbeanCentral AmericaChileChinaColombiaCongoCosta RicaCroatiaCubaCzechoslovakiaDenmarkDominicaDominican RepublicEastern AfricaEastern AsiaEastern EuropeEcuadorEgyptEl SalvadorEnglandEritreaEthiopiaEuropeFijiFranceGermanyGhanaGreeceGrenadaGuatemalaGuyanaHaitiHondurasHong KongHungaryIndiaIndonesiaIranIraqIrelandIsraelItalyJamaicaJapanJordanKazakhstanKenyaKoreaKuwaitLaosLatin AmericaLatviaLebanonLiberiaLithuaniaMalaysiaMexicoMicronesiaMiddle AfricaMoldovaMoroccoNepalNetherlandsNicaraguaNigeriaNorth AmericaNorth MacedoniaNorthern AfricaNorthern EuropeNorwayOceaniaPakistanPanamaPeruPhilippinesPolandPortugalRomaniaRussiaSaudi ArabiaScotlandSenegalSerbiaSierra LeoneSingaporeSomaliaSouth AfricaSouth AmericaSouth Central AsiaSouth Eastern AsiaSouthern EuropeSpainSri LankaSt. Vincent and the GrenadinesSudanSwedenSwitzerlandSyriaTaiwanThailandTrinidad and TobagoTurkeyUgandaUkraineUruguayUzbekistanVenezuelaVietnamWest IndiesWestern AfricaWestern AsiaWestern EuropeYemenZaireZimbabweAzores
Immigrants from Africa
Race
Ancestry
AfricanAlaska NativeAlaskan AthabascanAlbanianAleutAlsatianAmericanApacheArabArapahoArgentineanArmenianAssyrian/Chaldean/SyriacAustralianAustrianBahamianBangladeshiBarbadianBasqueBelgianBelizeanBermudanBhutaneseBlackfeetBolivianBrazilianBritishBritish West IndianBulgarianBurmeseCajunCambodianCanadianCape VerdeanCarpatho RusynCelticCentral AmericanCentral American IndianCherokeeCheyenneChickasawChileanChineseChippewaChoctawColombianColvilleComancheCosta RicanCreeCreekCroatianCrowCubanCypriotCzechCzechoslovakianDanishDelawareDominicanDutchDutch West IndianEastern EuropeanEcuadorianEgyptianEnglishEstonianEthiopianEuropeanFijianFilipinoFinnishFrenchFrench American IndianFrench CanadianGermanGerman RussianGhanaianGreekGuamanian/ChamorroGuatemalanGuyaneseHaitianHmongHonduranHopiHoumaHungarianIcelanderIndian (Asian)IndonesianInupiatIranianIraqiIrishIroquoisIsraeliItalianJamaicanJapaneseJordanianKenyanKiowaKoreanLaotianLatvianLebaneseLiberianLithuanianLumbeeLuxembourgerMacedonianMalaysianMalteseMarshalleseMenomineeMexicanMexican American IndianMongolianMoroccanNative HawaiianNavajoNepaleseNew ZealanderNicaraguanNigerianNorthern EuropeanNorwegianOkinawanOsageOttawaPaiutePakistaniPalestinianPanamanianParaguayanPennsylvania GermanPeruvianPimaPolishPortuguesePotawatomiPuebloPuerto RicanPuget Sound SalishRomanianRussianSalvadoranSamoanScandinavianScotch-IrishScottishSeminoleSenegaleseSerbianShoshoneSierra LeoneanSiouxSlavicSlovakSloveneSomaliSouth AfricanSouth AmericanSouth American IndianSoviet UnionSpaniardSpanishSpanish AmericanSpanish American IndianSri LankanSubsaharan AfricanSudaneseSwedishSwissSyrianTaiwaneseThaiTlingit-HaidaTohono O'OdhamTonganTrinidadian and TobagonianTsimshianTurkishU.S. Virgin IslanderUgandanUkrainianUruguayanUteVenezuelanVietnameseWelshWest IndianYakamaYaquiYugoslavianYumanYup'ikZimbabwean
Immigration
NonimmigrantsImmigrantsAfghanistanAfricaAlbaniaArgentinaArmeniaAsiaAustraliaAustriaBahamasBangladeshBarbadosBelarusBelgiumBelizeBoliviaBosnia and HerzegovinaBrazilBulgariaBurma/MyanmarCabo VerdeCambodiaCameroonCanadaCaribbeanCentral AmericaChileChinaColombiaCongoCosta RicaCroatiaCubaCzechoslovakiaDenmarkDominicaDominican RepublicEastern AfricaEastern AsiaEastern EuropeEcuadorEgyptEl SalvadorEnglandEritreaEthiopiaEuropeFijiFranceGermanyGhanaGreeceGrenadaGuatemalaGuyanaHaitiHondurasHong KongHungaryIndiaIndonesiaIranIraqIrelandIsraelItalyJamaicaJapanJordanKazakhstanKenyaKoreaKuwaitLaosLatin AmericaLatviaLebanonLiberiaLithuaniaMalaysiaMexicoMicronesiaMiddle AfricaMoldovaMoroccoNepalNetherlandsNicaraguaNigeriaNorth AmericaNorth MacedoniaNorthern AfricaNorthern EuropeNorwayOceaniaPakistanPanamaPeruPhilippinesPolandPortugalRomaniaRussiaSaudi ArabiaScotlandSenegalSerbiaSierra LeoneSingaporeSomaliaSouth AfricaSouth AmericaSouth Central AsiaSouth Eastern AsiaSouthern EuropeSpainSri LankaSt. Vincent and the GrenadinesSudanSwedenSwitzerlandSyriaTaiwanThailandTrinidad and TobagoTurkeyUgandaUkraineUruguayUzbekistanVenezuelaVietnamWest IndiesWestern AfricaWestern AsiaWestern EuropeYemenZaireZimbabweAzores
Disability
Income
Poverty
Unemployment
Labor Participation
Family Structure
Vehicle Availability
Education Level
Disability

Disability Comparison

Afghans

Immigrants from Africa

Exceptional
Excellent
10.8%
DISABILITY
99.9/ 100
METRIC RATING
38th/ 347
METRIC RANK
11.4%
DISABILITY
89.3/ 100
METRIC RATING
132nd/ 347
METRIC RANK

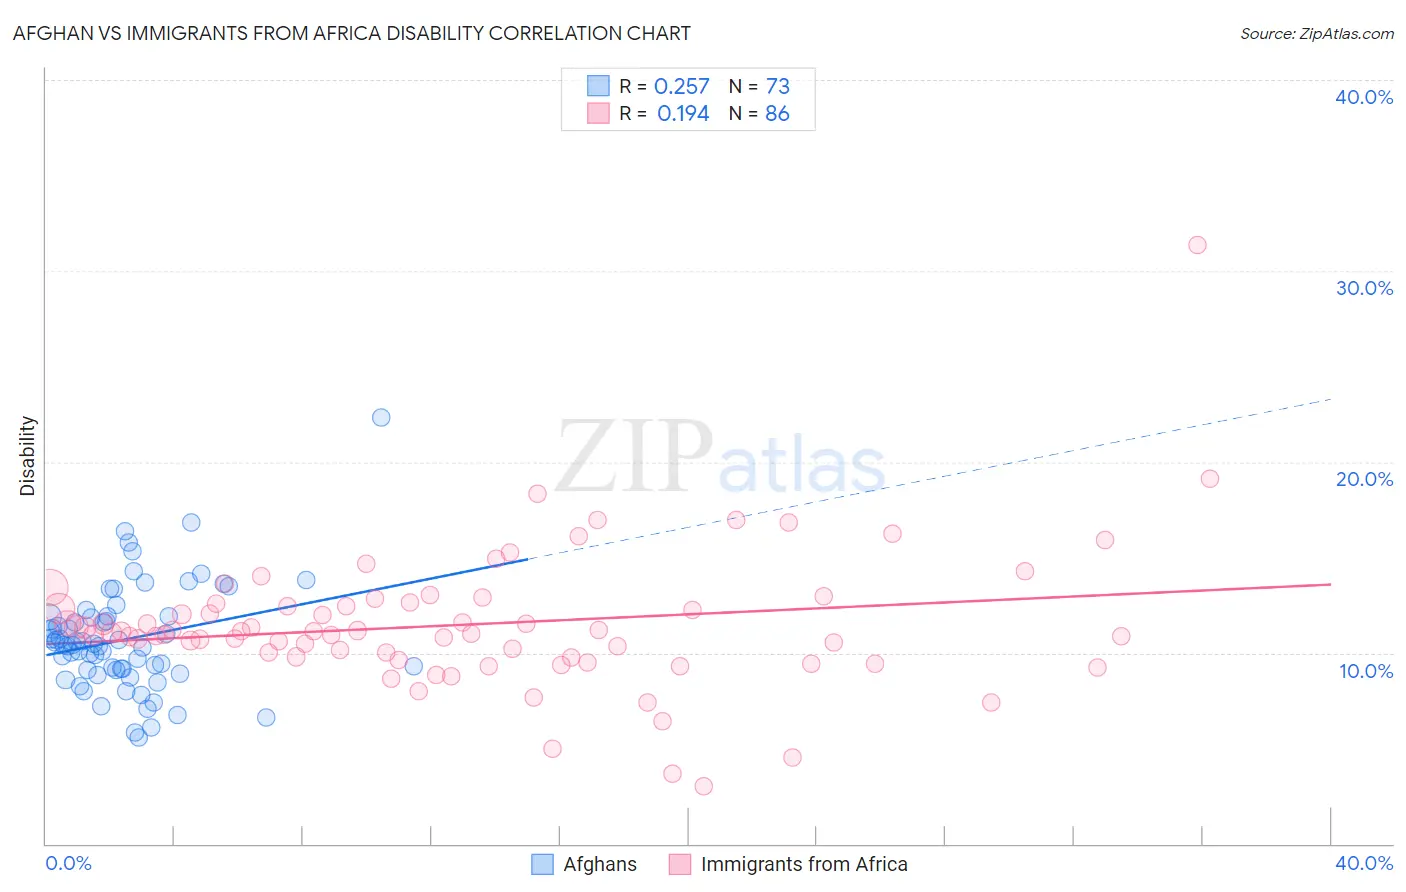
Afghan vs Immigrants from Africa Disability Correlation Chart

The statistical analysis conducted on geographies consisting of 148,869,641 people shows a weak positive correlation between the proportion of Afghans and percentage of population with a disability in the United States with a correlation coefficient (R) of 0.257 and weighted average of 10.8%. Similarly, the statistical analysis conducted on geographies consisting of 469,357,699 people shows a poor positive correlation between the proportion of Immigrants from Africa and percentage of population with a disability in the United States with a correlation coefficient (R) of 0.194 and weighted average of 11.4%, a difference of 6.2%.
Afghan vs Immigrants from Africa Disability

Disability Correlation Summary

MeasurementAfghanImmigrants from Africa
Minimum5.6%3.0%
Maximum22.3%31.3%
Range16.8%28.3%
Mean10.7%11.5%
Median10.4%11.1%
Interquartile 25% (IQ1)9.1%9.8%
Interquartile 75% (IQ3)11.9%12.6%
Interquartile Range (IQR)2.8%2.8%
Standard Deviation (Sample)2.8%3.6%
Standard Deviation (Population)2.8%3.6%

Similar Demographics by Disability

Demographics Similar to Afghans by Disability

In terms of disability, the demographic groups most similar to Afghans are Cambodian (10.8%, a difference of 0.10%), Mongolian (10.8%, a difference of 0.10%), Immigrants from Australia (10.8%, a difference of 0.15%), Immigrants from Nepal (10.8%, a difference of 0.25%), and Israeli (10.8%, a difference of 0.29%).
DemographicsRating | RankDisability
Immigrants | Egypt
100.0
/100
|
#31
Exceptional
10.6%
Paraguayans
100.0
/100
|
#32
Exceptional
10.6%
Immigrants | Kuwait
100.0
/100
|
#33
Exceptional
10.7%
Immigrants | Ethiopia
100.0
/100
|
#34
Exceptional
10.7%
Immigrants | Indonesia
100.0
/100
|
#35
Exceptional
10.7%
Ethiopians
100.0
/100
|
#36
Exceptional
10.7%
Turks
100.0
/100
|
#37
Exceptional
10.7%
Afghans
99.9
/100
|
#38
Exceptional
10.8%
Cambodians
99.9
/100
|
#39
Exceptional
10.8%
Mongolians
99.9
/100
|
#40
Exceptional
10.8%
Immigrants | Australia
99.9
/100
|
#41
Exceptional
10.8%
Immigrants | Nepal
99.9
/100
|
#42
Exceptional
10.8%
Israelis
99.9
/100
|
#43
Exceptional
10.8%
Immigrants | Japan
99.9
/100
|
#44
Exceptional
10.8%
Immigrants | Peru
99.9
/100
|
#45
Exceptional
10.8%

Demographics Similar to Immigrants from Africa by Disability

In terms of disability, the demographic groups most similar to Immigrants from Africa are Arab (11.4%, a difference of 0.030%), Immigrants from Croatia (11.4%, a difference of 0.060%), Latvian (11.4%, a difference of 0.070%), Immigrants from Guyana (11.4%, a difference of 0.11%), and Macedonian (11.4%, a difference of 0.12%).
DemographicsRating | RankDisability
Costa Ricans
91.9
/100
|
#125
Exceptional
11.4%
Immigrants | Latvia
90.9
/100
|
#126
Exceptional
11.4%
Immigrants | Italy
90.4
/100
|
#127
Exceptional
11.4%
Immigrants | Europe
90.4
/100
|
#128
Exceptional
11.4%
Macedonians
90.3
/100
|
#129
Exceptional
11.4%
Latvians
89.8
/100
|
#130
Excellent
11.4%
Immigrants | Croatia
89.8
/100
|
#131
Excellent
11.4%
Immigrants | Africa
89.3
/100
|
#132
Excellent
11.4%
Arabs
89.1
/100
|
#133
Excellent
11.4%
Immigrants | Guyana
88.3
/100
|
#134
Excellent
11.4%
Ugandans
87.9
/100
|
#135
Excellent
11.4%
Immigrants | St. Vincent and the Grenadines
87.8
/100
|
#136
Excellent
11.4%
Kenyans
87.1
/100
|
#137
Excellent
11.5%
New Zealanders
87.0
/100
|
#138
Excellent
11.5%
Ghanaians
87.0
/100
|
#139
Excellent
11.5%