Zip Codes with the Highest Percentage of Population Employed in Professional & Scientific Services in San Leandro, CA
RELATED REPORTS & OPTIONS
Professional & Scientific Services
San Leandro
Compare Zip Codes
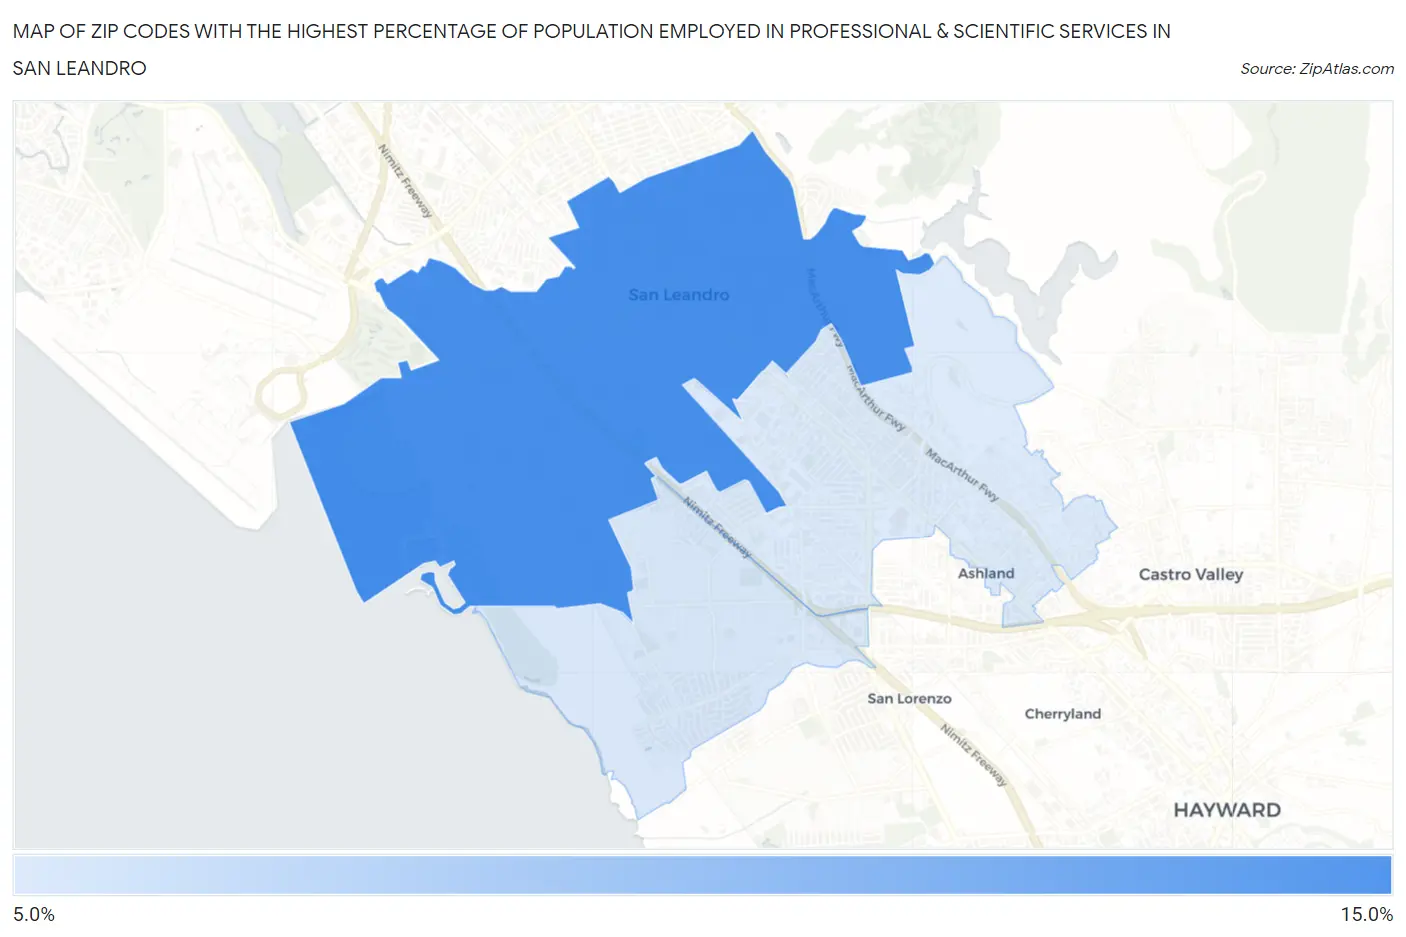
Map of Zip Codes with the Highest Percentage of Population Employed in Professional & Scientific Services in San Leandro
6.8%
11.2%
Zip Codes with the Highest Percentage of Population Employed in Professional & Scientific Services in San Leandro, CA
| Zip Code | % Employed | vs State | vs National | |
| 1. | 94577 | 11.2% | 9.4%(+1.73)#457 | 7.8%(+3.32)#3,717 |
| 2. | 94579 | 6.9% | 9.4%(-2.49)#797 | 7.8%(-0.903)#8,266 |
| 3. | 94578 | 6.8% | 9.4%(-2.65)#814 | 7.8%(-1.06)#8,503 |
1
Common Questions
What are the Top Zip Codes with the Highest Percentage of Population Employed in Professional & Scientific Services in San Leandro, CA?
Top Zip Codes with the Highest Percentage of Population Employed in Professional & Scientific Services in San Leandro, CA are:
What zip code has the Highest Percentage of Population Employed in Professional & Scientific Services in San Leandro, CA?
94577 has the Highest Percentage of Population Employed in Professional & Scientific Services in San Leandro, CA with 11.2%.
What is the Percentage of Population Employed in Professional & Scientific Services in San Leandro, CA?
Percentage of Population Employed in Professional & Scientific Services in San Leandro is 9.1%.
What is the Percentage of Population Employed in Professional & Scientific Services in California?
Percentage of Population Employed in Professional & Scientific Services in California is 9.4%.
What is the Percentage of Population Employed in Professional & Scientific Services in the United States?
Percentage of Population Employed in Professional & Scientific Services in the United States is 7.8%.