Mansfield, TX Map & Demographics
Mansfield Map
Mansfield Overview
$44,700
PER CAPITA INCOME
$128,746
AVG FAMILY INCOME
$112,465
AVG HOUSEHOLD INCOME
20.7%
WAGE / INCOME GAP [ % ]
79.3¢/ $1
WAGE / INCOME GAP [ $ ]
$8,154
FAMILY INCOME DEFICIT
0.38
INEQUALITY / GINI INDEX
73,680
TOTAL POPULATION
35,799
MALE POPULATION
37,881
FEMALE POPULATION
94.50
MALES / 100 FEMALES
105.82
FEMALES / 100 MALES
37.3
MEDIAN AGE
3.5
AVG FAMILY SIZE
3.1
AVG HOUSEHOLD SIZE
39,816
LABOR FORCE [ PEOPLE ]
71.2%
PERCENT IN LABOR FORCE
3.7%
UNEMPLOYMENT RATE
Mansfield Zip Codes
Income in Mansfield
Income Overview in Mansfield
Per Capita Income in Mansfield is $44,700, while median incomes of families and households are $128,746 and $112,465 respectively.
| Characteristic | Number | Measure |
| Per Capita Income | 73,680 | $44,700 |
| Median Family Income | 18,812 | $128,746 |
| Mean Family Income | 18,812 | $148,121 |
| Median Household Income | 23,905 | $112,465 |
| Mean Household Income | 23,905 | $135,542 |
| Income Deficit | 18,812 | $8,154 |
| Wage / Income Gap (%) | 73,680 | 20.68% |
| Wage / Income Gap ($) | 73,680 | 79.32¢ per $1 |
| Gini / Inequality Index | 73,680 | 0.38 |
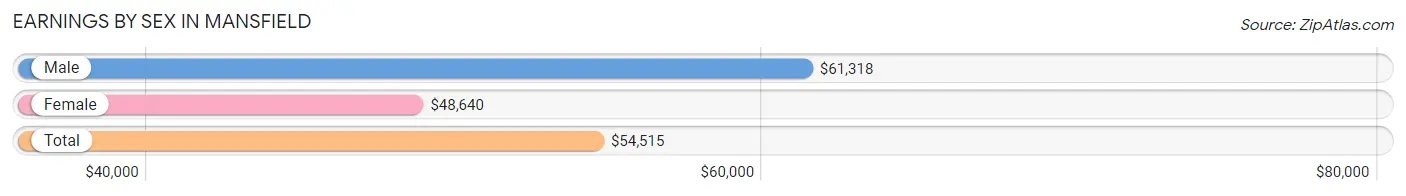
Earnings by Sex in Mansfield
Average Earnings in Mansfield are $54,515, $61,318 for men and $48,640 for women, a difference of 20.7%.
| Sex | Number | Average Earnings |
| Male | 21,376 (52.2%) | $61,318 |
| Female | 19,594 (47.8%) | $48,640 |
| Total | 40,970 (100.0%) | $54,515 |
Earnings by Sex by Income Bracket in Mansfield
The most common earnings brackets in Mansfield are $100,000+ for men (5,901 | 27.6%) and $100,000+ for women (3,035 | 15.5%).
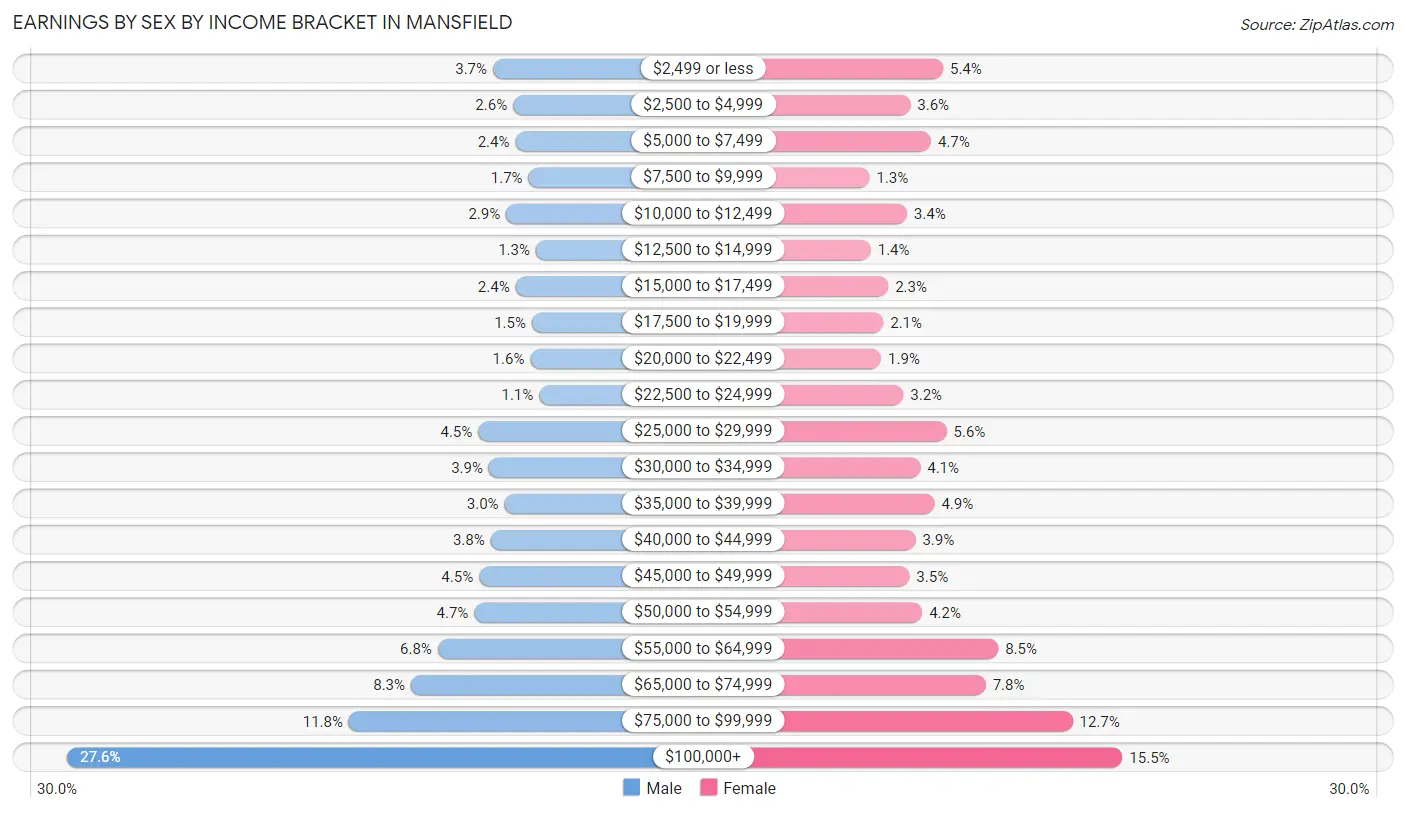
| Income | Male | Female |
| $2,499 or less | 787 (3.7%) | 1,060 (5.4%) |
| $2,500 to $4,999 | 546 (2.5%) | 700 (3.6%) |
| $5,000 to $7,499 | 518 (2.4%) | 927 (4.7%) |
| $7,500 to $9,999 | 359 (1.7%) | 250 (1.3%) |
| $10,000 to $12,499 | 629 (2.9%) | 663 (3.4%) |
| $12,500 to $14,999 | 271 (1.3%) | 264 (1.3%) |
| $15,000 to $17,499 | 515 (2.4%) | 457 (2.3%) |
| $17,500 to $19,999 | 318 (1.5%) | 402 (2.1%) |
| $20,000 to $22,499 | 337 (1.6%) | 378 (1.9%) |
| $22,500 to $24,999 | 230 (1.1%) | 623 (3.2%) |
| $25,000 to $29,999 | 963 (4.5%) | 1,099 (5.6%) |
| $30,000 to $34,999 | 835 (3.9%) | 810 (4.1%) |
| $35,000 to $39,999 | 648 (3.0%) | 966 (4.9%) |
| $40,000 to $44,999 | 815 (3.8%) | 757 (3.9%) |
| $45,000 to $49,999 | 954 (4.5%) | 689 (3.5%) |
| $50,000 to $54,999 | 1,011 (4.7%) | 830 (4.2%) |
| $55,000 to $64,999 | 1,449 (6.8%) | 1,668 (8.5%) |
| $65,000 to $74,999 | 1,772 (8.3%) | 1,530 (7.8%) |
| $75,000 to $99,999 | 2,518 (11.8%) | 2,486 (12.7%) |
| $100,000+ | 5,901 (27.6%) | 3,035 (15.5%) |
| Total | 21,376 (100.0%) | 19,594 (100.0%) |
Earnings by Sex by Educational Attainment in Mansfield
Average earnings in Mansfield are $71,152 for men and $56,083 for women, a difference of 21.2%. Men with an educational attainment of graduate degree enjoy the highest average annual earnings of $90,997, while those with less than high school education earn the least with $47,857. Women with an educational attainment of graduate degree earn the most with the average annual earnings of $79,718, while those with less than high school education have the smallest earnings of $16,929.
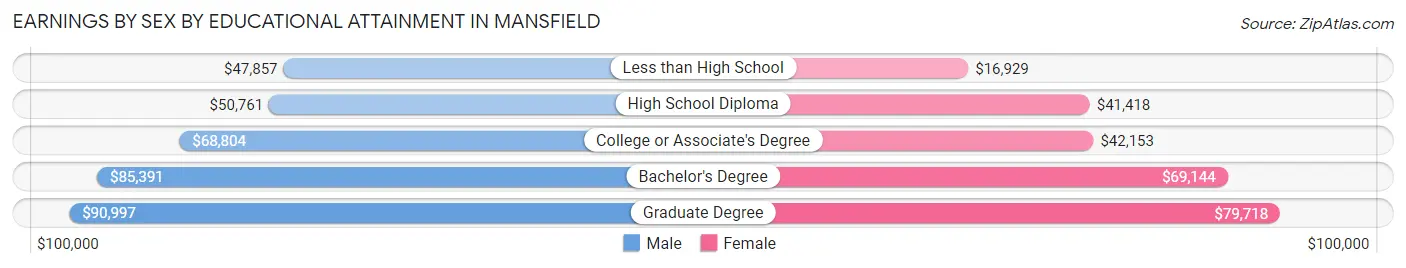
| Educational Attainment | Male Income | Female Income |
| Less than High School | $47,857 | $16,929 |
| High School Diploma | $50,761 | $41,418 |
| College or Associate's Degree | $68,804 | $42,153 |
| Bachelor's Degree | $85,391 | $69,144 |
| Graduate Degree | $90,997 | $79,718 |
| Total | $71,152 | $56,083 |
Family Income in Mansfield
Family Income Brackets in Mansfield
According to the Mansfield family income data, there are 4,741 families falling into the $100,000 to $149,999 income range, which is the most common income bracket and makes up 25.2% of all families. Conversely, the $10,000 to $14,999 income bracket is the least frequent group with only 75 families (0.4%) belonging to this category.
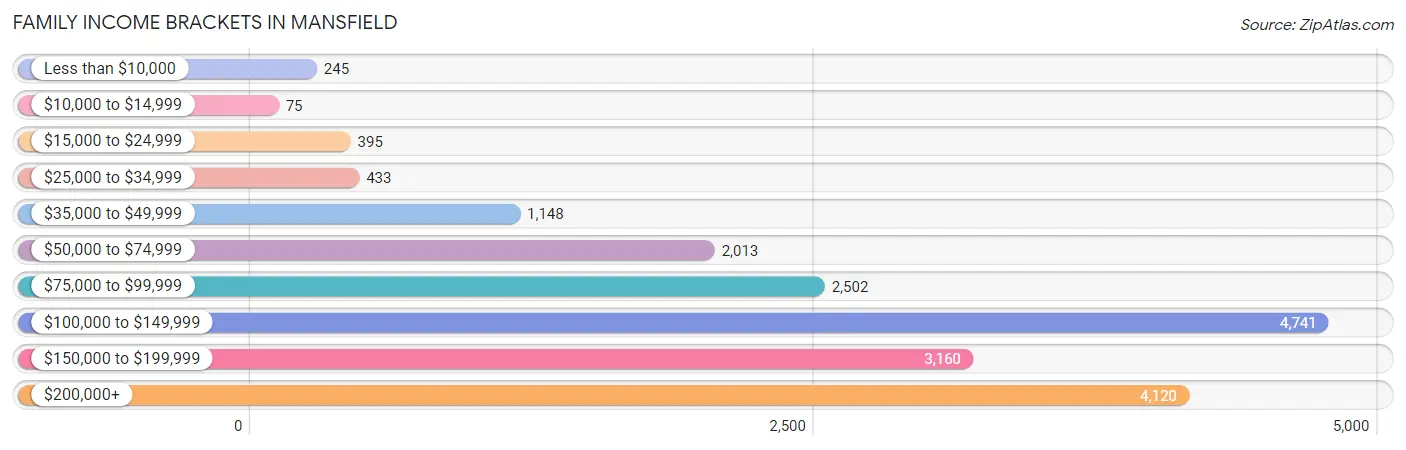
| Income Bracket | # Families | % Families |
| Less than $10,000 | 245 | 1.3% |
| $10,000 to $14,999 | 75 | 0.4% |
| $15,000 to $24,999 | 395 | 2.1% |
| $25,000 to $34,999 | 433 | 2.3% |
| $35,000 to $49,999 | 1,148 | 6.1% |
| $50,000 to $74,999 | 2,013 | 10.7% |
| $75,000 to $99,999 | 2,502 | 13.3% |
| $100,000 to $149,999 | 4,741 | 25.2% |
| $150,000 to $199,999 | 3,160 | 16.8% |
| $200,000+ | 4,120 | 21.9% |
Family Income by Famaliy Size in Mansfield
5-person families (1,861 | 9.9%) account for the highest median family income in Mansfield with $170,354 per family, while 2-person families (6,714 | 35.7%) have the highest median income of $53,952 per family member.
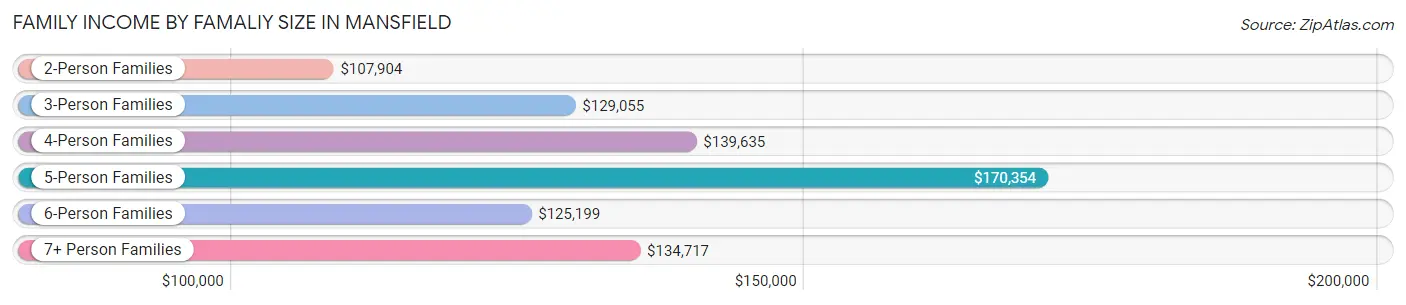
| Income Bracket | # Families | Median Income |
| 2-Person Families | 6,714 (35.7%) | $107,904 |
| 3-Person Families | 4,631 (24.6%) | $129,055 |
| 4-Person Families | 4,288 (22.8%) | $139,635 |
| 5-Person Families | 1,861 (9.9%) | $170,354 |
| 6-Person Families | 713 (3.8%) | $125,199 |
| 7+ Person Families | 605 (3.2%) | $134,717 |
| Total | 18,812 (100.0%) | $128,746 |
Family Income by Number of Earners in Mansfield
The median family income in Mansfield is $128,746, with families comprising 3+ earners (3,305) having the highest median family income of $172,923, while families with no earners (1,555) have the lowest median family income of $62,207, accounting for 17.6% and 8.3% of families, respectively.
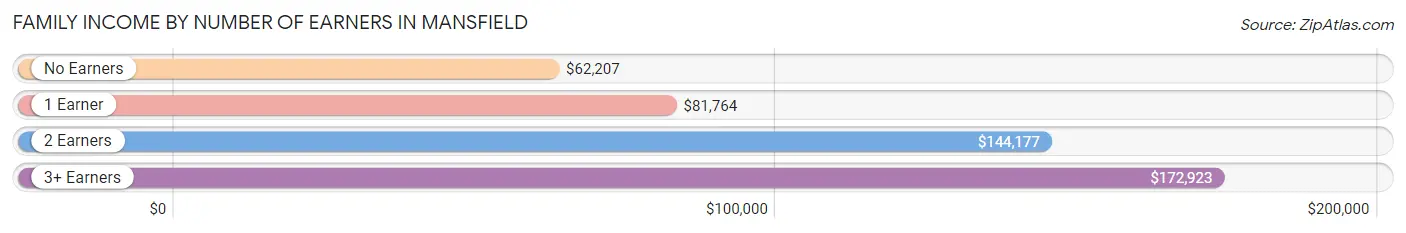
| Number of Earners | # Families | Median Income |
| No Earners | 1,555 (8.3%) | $62,207 |
| 1 Earner | 5,115 (27.2%) | $81,764 |
| 2 Earners | 8,837 (47.0%) | $144,177 |
| 3+ Earners | 3,305 (17.6%) | $172,923 |
| Total | 18,812 (100.0%) | $128,746 |
Household Income in Mansfield
Household Income Brackets in Mansfield
With 5,474 households falling in the category, the $100,000 to $149,999 income range is the most frequent in Mansfield, accounting for 22.9% of all households. In contrast, only 430 households (1.8%) fall into the $15,000 to $24,999 income bracket, making it the least populous group.
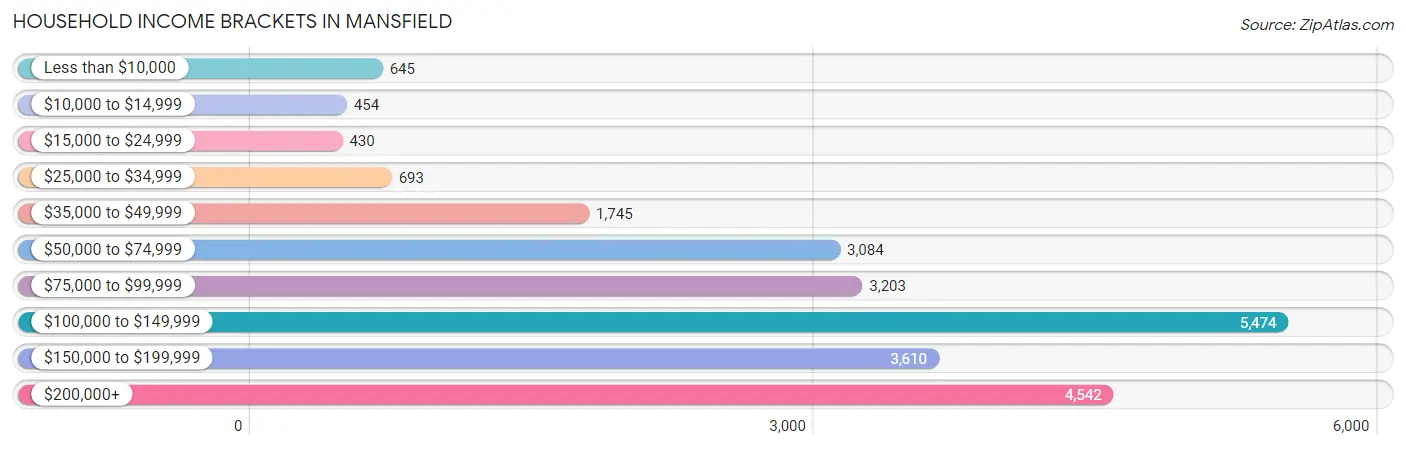
| Income Bracket | # Households | % Households |
| Less than $10,000 | 645 | 2.7% |
| $10,000 to $14,999 | 454 | 1.9% |
| $15,000 to $24,999 | 430 | 1.8% |
| $25,000 to $34,999 | 693 | 2.9% |
| $35,000 to $49,999 | 1,745 | 7.3% |
| $50,000 to $74,999 | 3,084 | 12.9% |
| $75,000 to $99,999 | 3,203 | 13.4% |
| $100,000 to $149,999 | 5,474 | 22.9% |
| $150,000 to $199,999 | 3,610 | 15.1% |
| $200,000+ | 4,542 | 19.0% |
Household Income by Householder Age in Mansfield
The median household income in Mansfield is $112,465, with the highest median household income of $132,829 found in the 45 to 64 years age bracket for the primary householder. A total of 10,208 households (42.7%) fall into this category. Meanwhile, the 15 to 24 years age bracket for the primary householder has the lowest median household income of $45,871, with 642 households (2.7%) in this group.
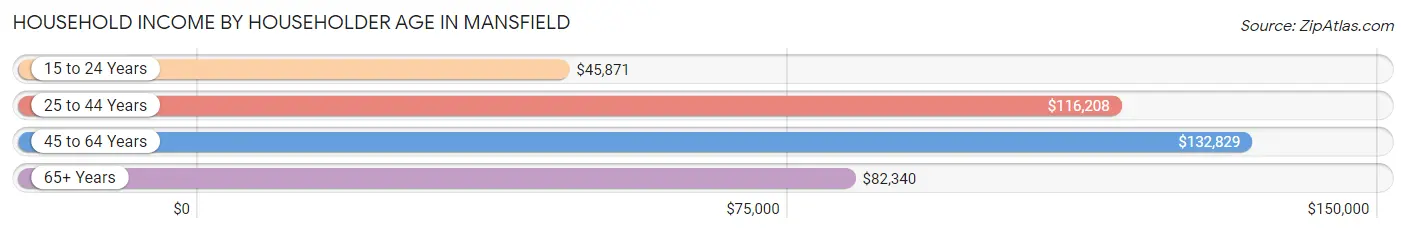
| Income Bracket | # Households | Median Income |
| 15 to 24 Years | 642 (2.7%) | $45,871 |
| 25 to 44 Years | 8,337 (34.9%) | $116,208 |
| 45 to 64 Years | 10,208 (42.7%) | $132,829 |
| 65+ Years | 4,718 (19.7%) | $82,340 |
| Total | 23,905 (100.0%) | $112,465 |
Poverty in Mansfield
Income Below Poverty by Sex and Age in Mansfield
With 4.1% poverty level for males and 6.4% for females among the residents of Mansfield, 15 year old males and under 5 year old females are the most vulnerable to poverty, with 49 males (11.3%) and 319 females (17.1%) in their respective age groups living below the poverty level.
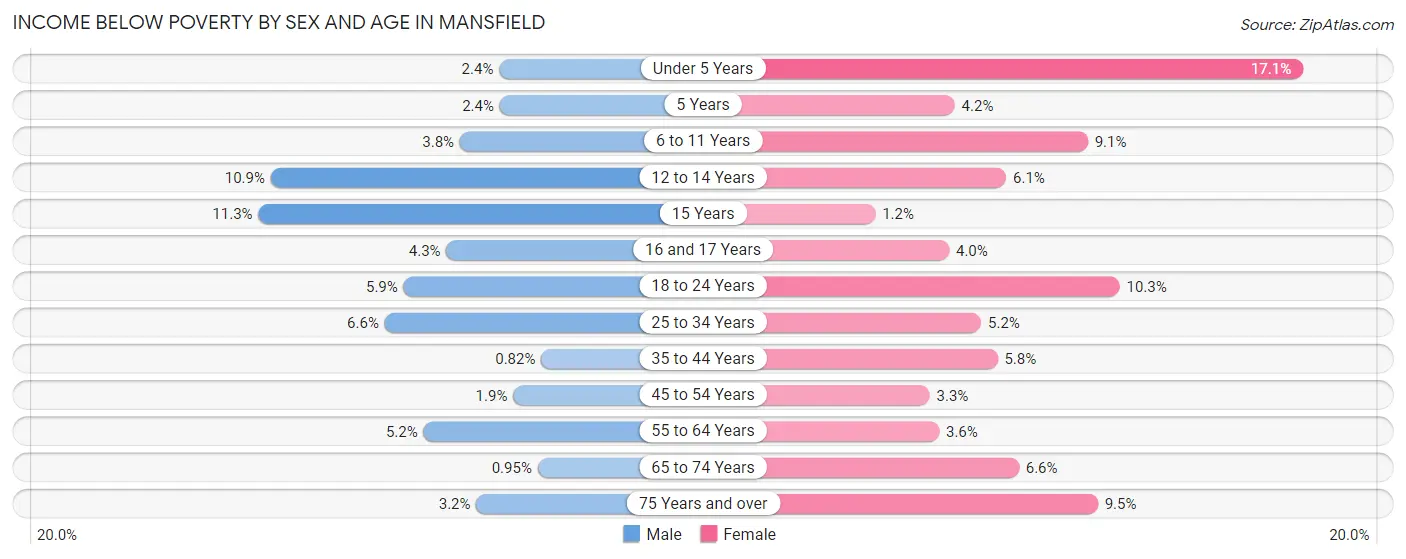
| Age Bracket | Male | Female |
| Under 5 Years | 45 (2.4%) | 319 (17.1%) |
| 5 Years | 13 (2.4%) | 21 (4.2%) |
| 6 to 11 Years | 132 (3.8%) | 346 (9.1%) |
| 12 to 14 Years | 261 (10.9%) | 127 (6.1%) |
| 15 Years | 49 (11.3%) | 8 (1.2%) |
| 16 and 17 Years | 57 (4.3%) | 60 (4.0%) |
| 18 to 24 Years | 198 (5.9%) | 305 (10.3%) |
| 25 to 34 Years | 271 (6.6%) | 201 (5.2%) |
| 35 to 44 Years | 40 (0.8%) | 343 (5.8%) |
| 45 to 54 Years | 94 (1.9%) | 184 (3.3%) |
| 55 to 64 Years | 218 (5.2%) | 158 (3.6%) |
| 65 to 74 Years | 22 (0.9%) | 166 (6.6%) |
| 75 Years and over | 52 (3.2%) | 180 (9.5%) |
| Total | 1,452 (4.1%) | 2,418 (6.4%) |
Income Above Poverty by Sex and Age in Mansfield
According to the poverty statistics in Mansfield, males aged 35 to 44 years and females aged 15 years are the age groups that are most secure financially, with 99.2% of males and 98.8% of females in these age groups living above the poverty line.
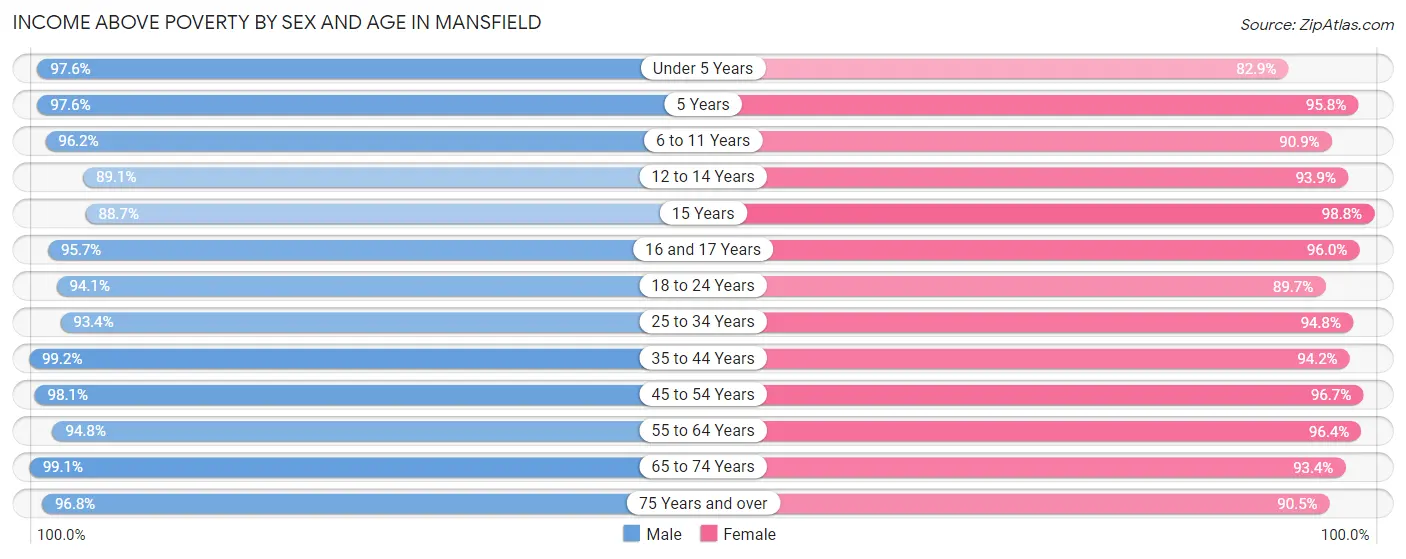
| Age Bracket | Male | Female |
| Under 5 Years | 1,846 (97.6%) | 1,544 (82.9%) |
| 5 Years | 537 (97.6%) | 480 (95.8%) |
| 6 to 11 Years | 3,304 (96.2%) | 3,445 (90.9%) |
| 12 to 14 Years | 2,142 (89.1%) | 1,956 (93.9%) |
| 15 Years | 384 (88.7%) | 638 (98.8%) |
| 16 and 17 Years | 1,257 (95.7%) | 1,447 (96.0%) |
| 18 to 24 Years | 3,143 (94.1%) | 2,652 (89.7%) |
| 25 to 34 Years | 3,819 (93.4%) | 3,689 (94.8%) |
| 35 to 44 Years | 4,833 (99.2%) | 5,592 (94.2%) |
| 45 to 54 Years | 4,965 (98.1%) | 5,460 (96.7%) |
| 55 to 64 Years | 3,982 (94.8%) | 4,213 (96.4%) |
| 65 to 74 Years | 2,303 (99.1%) | 2,360 (93.4%) |
| 75 Years and over | 1,557 (96.8%) | 1,715 (90.5%) |
| Total | 34,072 (95.9%) | 35,191 (93.6%) |
Income Below Poverty Among Married-Couple Families in Mansfield
The poverty statistics for married-couple families in Mansfield show that 1.1% or 173 of the total 15,002 families live below the poverty line. Families with 3 or 4 children have the highest poverty rate of 7.7%, comprising of 111 families. On the other hand, families with 5 or more children have the lowest poverty rate of 0.0%, which includes 0 families.
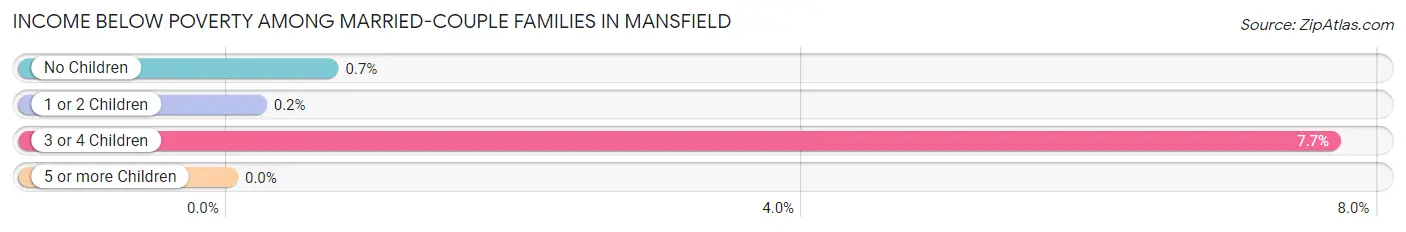
| Children | Above Poverty | Below Poverty |
| No Children | 7,131 (99.3%) | 50 (0.7%) |
| 1 or 2 Children | 6,133 (99.8%) | 12 (0.2%) |
| 3 or 4 Children | 1,335 (92.3%) | 111 (7.7%) |
| 5 or more Children | 230 (100.0%) | 0 (0.0%) |
| Total | 14,829 (98.9%) | 173 (1.1%) |
Income Below Poverty Among Single-Parent Households in Mansfield
According to the poverty data in Mansfield, 15.2% or 152 single-father households and 15.0% or 421 single-mother households are living below the poverty line. Among single-father households, those with 3 or 4 children have the highest poverty rate, with 25 households (37.9%) experiencing poverty. Likewise, among single-mother households, those with 3 or 4 children have the highest poverty rate, with 192 households (63.6%) falling below the poverty line.
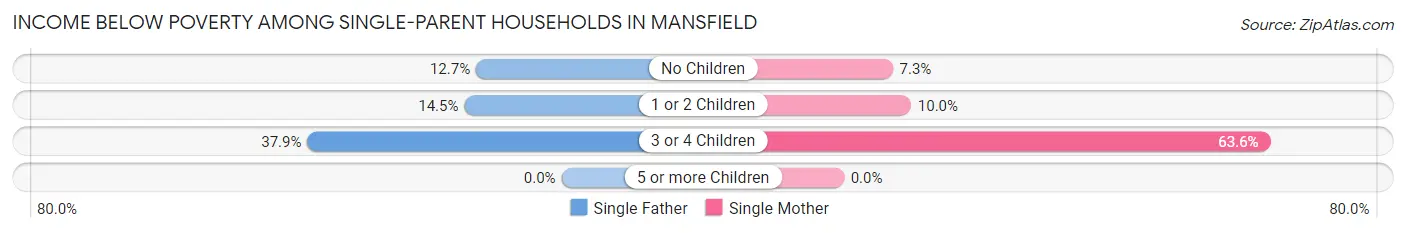
| Children | Single Father | Single Mother |
| No Children | 40 (12.7%) | 60 (7.3%) |
| 1 or 2 Children | 87 (14.5%) | 169 (10.0%) |
| 3 or 4 Children | 25 (37.9%) | 192 (63.6%) |
| 5 or more Children | 0 (0.0%) | 0 (0.0%) |
| Total | 152 (15.2%) | 421 (15.0%) |
Income Below Poverty Among Married-Couple vs Single-Parent Households in Mansfield
The poverty data for Mansfield shows that 173 of the married-couple family households (1.1%) and 573 of the single-parent households (15.0%) are living below the poverty level. Within the married-couple family households, those with 3 or 4 children have the highest poverty rate, with 111 households (7.7%) falling below the poverty line. Among the single-parent households, those with 3 or 4 children have the highest poverty rate, with 217 household (59.0%) living below poverty.
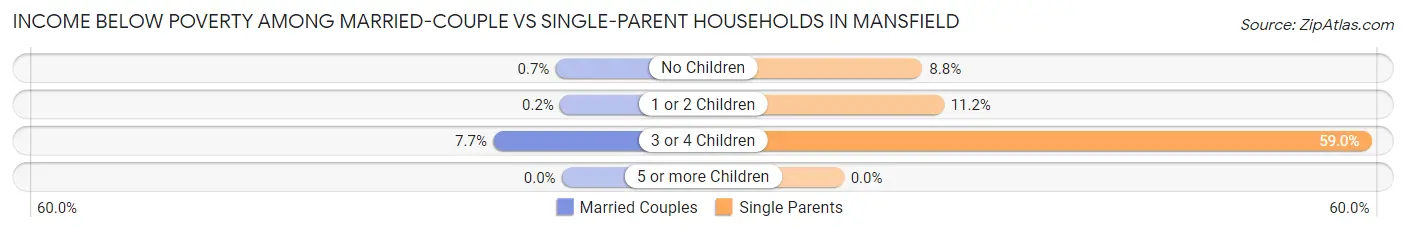
| Children | Married-Couple Families | Single-Parent Households |
| No Children | 50 (0.7%) | 100 (8.8%) |
| 1 or 2 Children | 12 (0.2%) | 256 (11.2%) |
| 3 or 4 Children | 111 (7.7%) | 217 (59.0%) |
| 5 or more Children | 0 (0.0%) | 0 (0.0%) |
| Total | 173 (1.1%) | 573 (15.0%) |
Race in Mansfield
The most populous races in Mansfield are White / Caucasian (43,622 | 59.2%), Black / African American (17,190 | 23.3%), and Hispanic or Latino (12,400 | 16.8%).
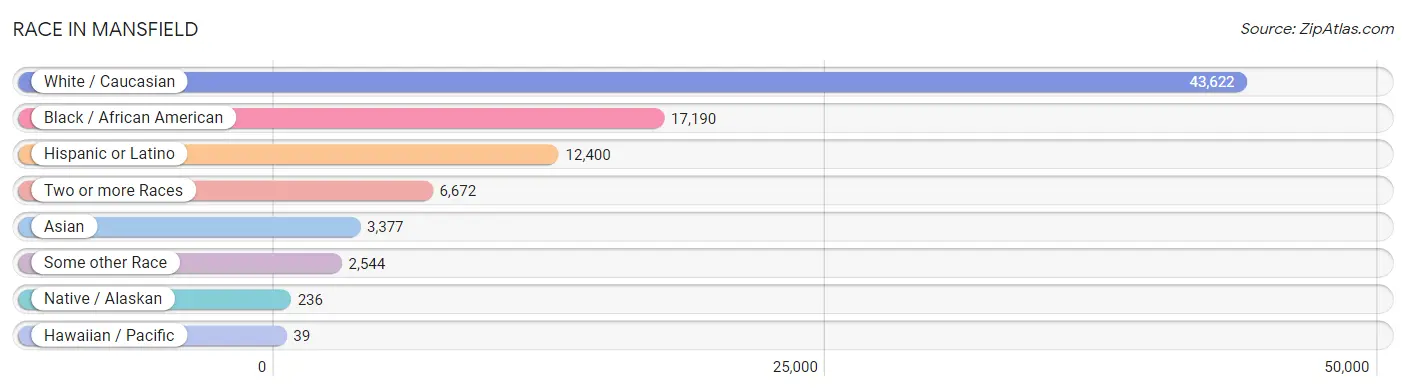
| Race | # Population | % Population |
| Asian | 3,377 | 4.6% |
| Black / African American | 17,190 | 23.3% |
| Hawaiian / Pacific | 39 | 0.1% |
| Hispanic or Latino | 12,400 | 16.8% |
| Native / Alaskan | 236 | 0.3% |
| White / Caucasian | 43,622 | 59.2% |
| Two or more Races | 6,672 | 9.1% |
| Some other Race | 2,544 | 3.5% |
| Total | 73,680 | 100.0% |
Ancestry in Mansfield
The most populous ancestries reported in Mansfield are Mexican (9,371 | 12.7%), English (7,130 | 9.7%), German (6,350 | 8.6%), American (5,583 | 7.6%), and Irish (5,439 | 7.4%), together accounting for 46.0% of all Mansfield residents.
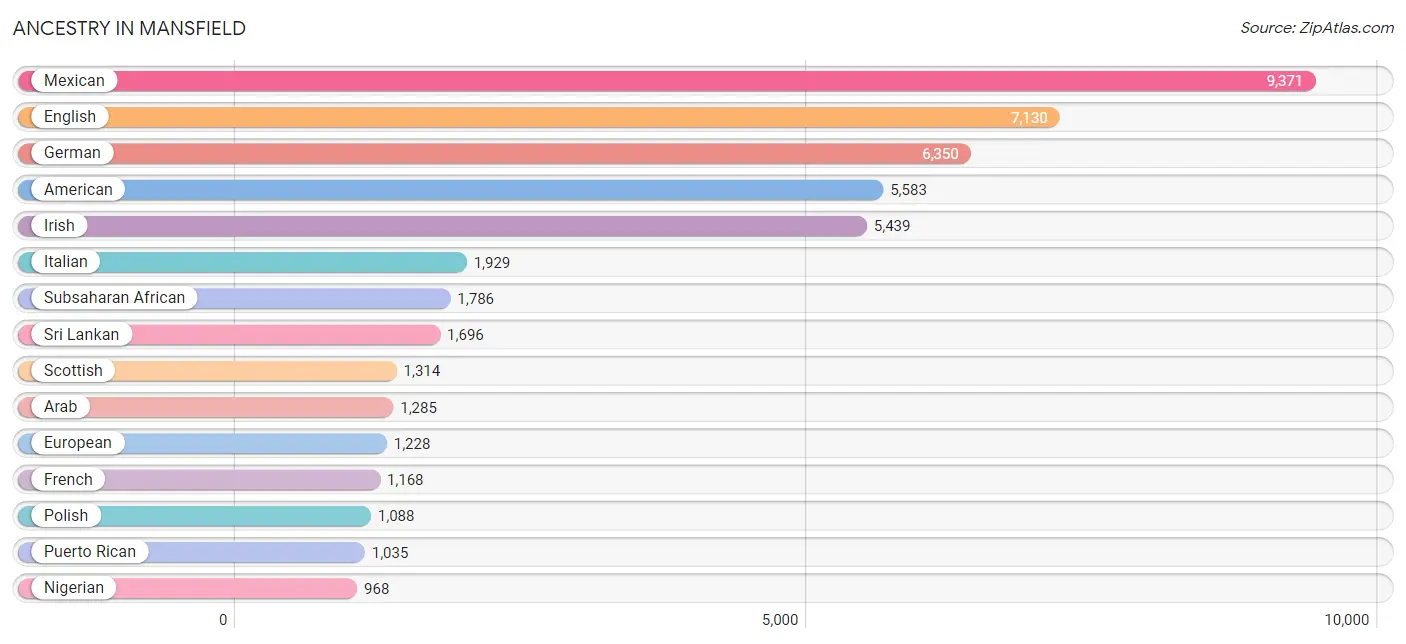
| Ancestry | # Population | % Population |
| Afghan | 136 | 0.2% |
| African | 448 | 0.6% |
| American | 5,583 | 7.6% |
| Apache | 3 | 0.0% |
| Arab | 1,285 | 1.7% |
| Armenian | 5 | 0.0% |
| Austrian | 73 | 0.1% |
| Bahamian | 9 | 0.0% |
| Barbadian | 14 | 0.0% |
| Bhutanese | 252 | 0.3% |
| Blackfeet | 99 | 0.1% |
| Brazilian | 139 | 0.2% |
| British | 407 | 0.5% |
| Burmese | 334 | 0.4% |
| Canadian | 68 | 0.1% |
| Cape Verdean | 25 | 0.0% |
| Central American | 626 | 0.9% |
| Cherokee | 443 | 0.6% |
| Chilean | 43 | 0.1% |
| Choctaw | 80 | 0.1% |
| Colombian | 335 | 0.4% |
| Comanche | 10 | 0.0% |
| Croatian | 40 | 0.1% |
| Cuban | 45 | 0.1% |
| Czech | 338 | 0.5% |
| Czechoslovakian | 95 | 0.1% |
| Danish | 117 | 0.2% |
| Dominican | 57 | 0.1% |
| Dutch | 522 | 0.7% |
| Dutch West Indian | 36 | 0.1% |
| Eastern European | 67 | 0.1% |
| Ecuadorian | 81 | 0.1% |
| Egyptian | 96 | 0.1% |
| English | 7,130 | 9.7% |
| Ethiopian | 24 | 0.0% |
| European | 1,228 | 1.7% |
| Finnish | 220 | 0.3% |
| French | 1,168 | 1.6% |
| French American Indian | 158 | 0.2% |
| French Canadian | 175 | 0.2% |
| German | 6,350 | 8.6% |
| German Russian | 328 | 0.4% |
| Ghanaian | 68 | 0.1% |
| Greek | 102 | 0.1% |
| Guatemalan | 64 | 0.1% |
| Haitian | 142 | 0.2% |
| Honduran | 69 | 0.1% |
| Hungarian | 66 | 0.1% |
| Indian (Asian) | 388 | 0.5% |
| Iranian | 410 | 0.6% |
| Iraqi | 67 | 0.1% |
| Irish | 5,439 | 7.4% |
| Italian | 1,929 | 2.6% |
| Jamaican | 240 | 0.3% |
| Japanese | 57 | 0.1% |
| Jordanian | 370 | 0.5% |
| Kenyan | 192 | 0.3% |
| Korean | 506 | 0.7% |
| Laotian | 81 | 0.1% |
| Latvian | 56 | 0.1% |
| Lebanese | 149 | 0.2% |
| Malaysian | 82 | 0.1% |
| Maltese | 41 | 0.1% |
| Mexican | 9,371 | 12.7% |
| Mexican American Indian | 45 | 0.1% |
| Mongolian | 30 | 0.0% |
| Native Hawaiian | 58 | 0.1% |
| Nicaraguan | 48 | 0.1% |
| Nigerian | 968 | 1.3% |
| Northern European | 104 | 0.1% |
| Norwegian | 493 | 0.7% |
| Pakistani | 33 | 0.0% |
| Palestinian | 453 | 0.6% |
| Peruvian | 143 | 0.2% |
| Polish | 1,088 | 1.5% |
| Portuguese | 156 | 0.2% |
| Puerto Rican | 1,035 | 1.4% |
| Puget Sound Salish | 7 | 0.0% |
| Romanian | 26 | 0.0% |
| Russian | 427 | 0.6% |
| Salvadoran | 445 | 0.6% |
| Samoan | 39 | 0.1% |
| Scandinavian | 115 | 0.2% |
| Scotch-Irish | 815 | 1.1% |
| Scottish | 1,314 | 1.8% |
| Slovak | 37 | 0.1% |
| South American | 670 | 0.9% |
| South American Indian | 57 | 0.1% |
| Spaniard | 99 | 0.1% |
| Spanish | 159 | 0.2% |
| Sri Lankan | 1,696 | 2.3% |
| Subsaharan African | 1,786 | 2.4% |
| Swedish | 245 | 0.3% |
| Swiss | 99 | 0.1% |
| Syrian | 18 | 0.0% |
| Thai | 769 | 1.0% |
| Trinidadian and Tobagonian | 97 | 0.1% |
| Turkish | 45 | 0.1% |
| U.S. Virgin Islander | 25 | 0.0% |
| Ukrainian | 80 | 0.1% |
| Uruguayan | 30 | 0.0% |
| Venezuelan | 38 | 0.1% |
| Vietnamese | 21 | 0.0% |
| Welsh | 517 | 0.7% |
| West Indian | 29 | 0.0% | View All 105 Rows |
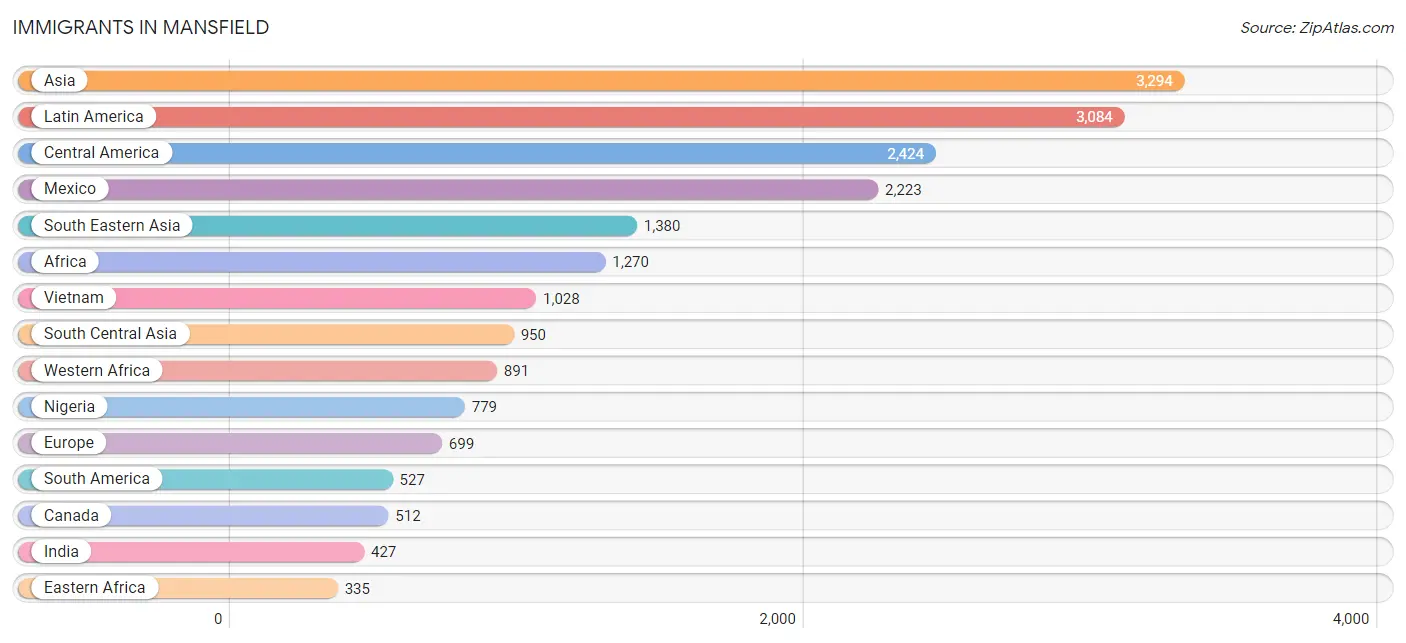
Immigrants in Mansfield
The most numerous immigrant groups reported in Mansfield came from Asia (3,294 | 4.5%), Latin America (3,084 | 4.2%), Central America (2,424 | 3.3%), Mexico (2,223 | 3.0%), and South Eastern Asia (1,380 | 1.9%), together accounting for 16.8% of all Mansfield residents.
| Immigration Origin | # Population | % Population |
| Afghanistan | 136 | 0.2% |
| Africa | 1,270 | 1.7% |
| Armenia | 5 | 0.0% |
| Asia | 3,294 | 4.5% |
| Bangladesh | 93 | 0.1% |
| Brazil | 126 | 0.2% |
| Cambodia | 15 | 0.0% |
| Canada | 512 | 0.7% |
| Caribbean | 133 | 0.2% |
| Central America | 2,424 | 3.3% |
| Chile | 43 | 0.1% |
| China | 125 | 0.2% |
| Colombia | 280 | 0.4% |
| Czechoslovakia | 4 | 0.0% |
| Eastern Africa | 335 | 0.4% |
| Eastern Asia | 306 | 0.4% |
| Eastern Europe | 201 | 0.3% |
| Egypt | 44 | 0.1% |
| El Salvador | 103 | 0.1% |
| England | 74 | 0.1% |
| Ethiopia | 24 | 0.0% |
| Europe | 699 | 0.9% |
| France | 24 | 0.0% |
| Germany | 168 | 0.2% |
| Ghana | 112 | 0.2% |
| Greece | 13 | 0.0% |
| Grenada | 24 | 0.0% |
| Guatemala | 32 | 0.0% |
| Honduras | 66 | 0.1% |
| Hong Kong | 20 | 0.0% |
| Hungary | 7 | 0.0% |
| India | 427 | 0.6% |
| Indonesia | 48 | 0.1% |
| Iran | 241 | 0.3% |
| Iraq | 33 | 0.0% |
| Ireland | 17 | 0.0% |
| Israel | 7 | 0.0% |
| Jamaica | 83 | 0.1% |
| Japan | 110 | 0.2% |
| Jordan | 84 | 0.1% |
| Kenya | 265 | 0.4% |
| Korea | 71 | 0.1% |
| Kuwait | 96 | 0.1% |
| Laos | 45 | 0.1% |
| Latin America | 3,084 | 4.2% |
| Malaysia | 63 | 0.1% |
| Mexico | 2,223 | 3.0% |
| Nepal | 7 | 0.0% |
| Nigeria | 779 | 1.1% |
| North Macedonia | 7 | 0.0% |
| Northern Africa | 44 | 0.1% |
| Northern Europe | 251 | 0.3% |
| Pakistan | 46 | 0.1% |
| Peru | 10 | 0.0% |
| Philippines | 171 | 0.2% |
| Russia | 90 | 0.1% |
| Saudi Arabia | 31 | 0.0% |
| Scotland | 15 | 0.0% |
| South America | 527 | 0.7% |
| South Central Asia | 950 | 1.3% |
| South Eastern Asia | 1,380 | 1.9% |
| Southern Europe | 55 | 0.1% |
| Spain | 42 | 0.1% |
| Taiwan | 14 | 0.0% |
| Thailand | 10 | 0.0% |
| Turkey | 45 | 0.1% |
| Ukraine | 79 | 0.1% |
| Uruguay | 30 | 0.0% |
| Venezuela | 38 | 0.1% |
| Vietnam | 1,028 | 1.4% |
| Western Africa | 891 | 1.2% |
| Western Asia | 301 | 0.4% |
| Western Europe | 192 | 0.3% | View All 73 Rows |
Sex and Age in Mansfield
Sex and Age in Mansfield
The most populous age groups in Mansfield are 10 to 14 Years (3,953 | 11.0%) for men and 10 to 14 Years (3,651 | 9.6%) for women.
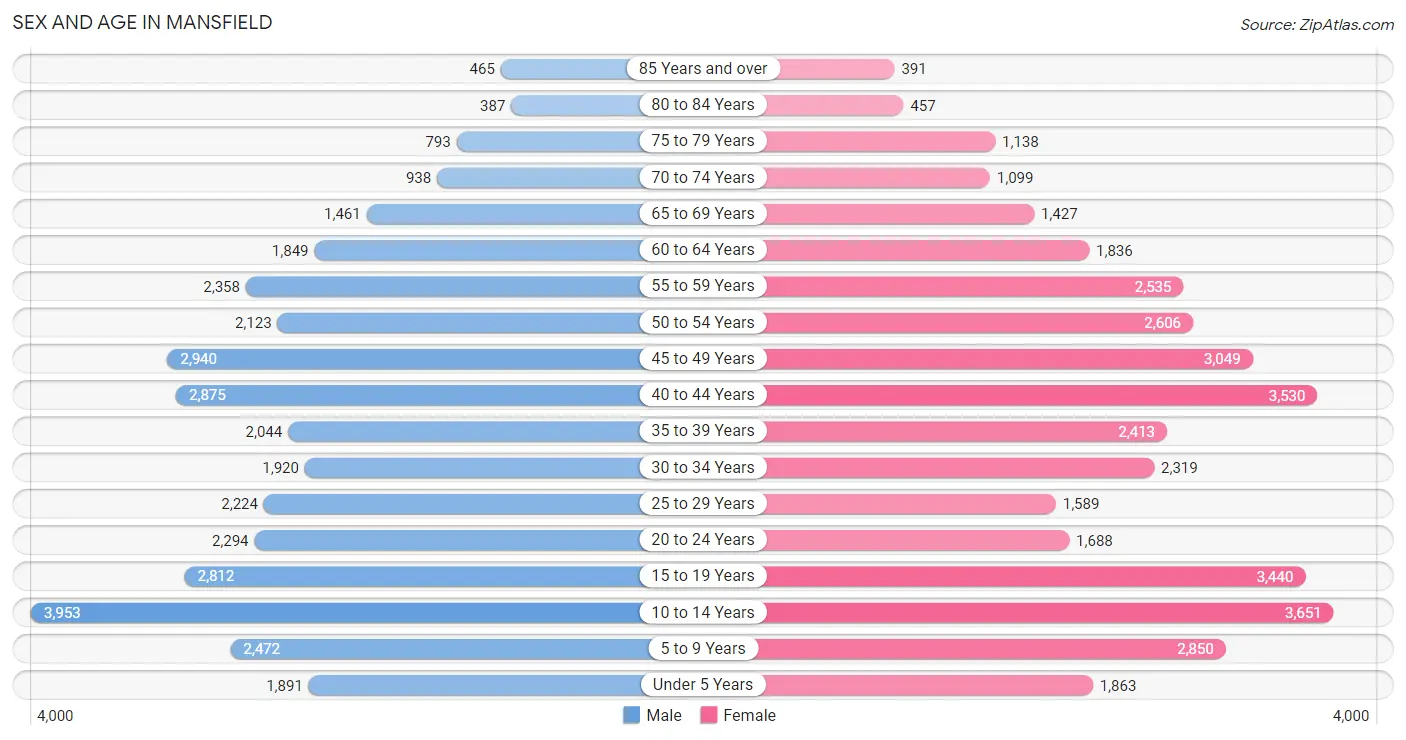
| Age Bracket | Male | Female |
| Under 5 Years | 1,891 (5.3%) | 1,863 (4.9%) |
| 5 to 9 Years | 2,472 (6.9%) | 2,850 (7.5%) |
| 10 to 14 Years | 3,953 (11.0%) | 3,651 (9.6%) |
| 15 to 19 Years | 2,812 (7.9%) | 3,440 (9.1%) |
| 20 to 24 Years | 2,294 (6.4%) | 1,688 (4.5%) |
| 25 to 29 Years | 2,224 (6.2%) | 1,589 (4.2%) |
| 30 to 34 Years | 1,920 (5.4%) | 2,319 (6.1%) |
| 35 to 39 Years | 2,044 (5.7%) | 2,413 (6.4%) |
| 40 to 44 Years | 2,875 (8.0%) | 3,530 (9.3%) |
| 45 to 49 Years | 2,940 (8.2%) | 3,049 (8.1%) |
| 50 to 54 Years | 2,123 (5.9%) | 2,606 (6.9%) |
| 55 to 59 Years | 2,358 (6.6%) | 2,535 (6.7%) |
| 60 to 64 Years | 1,849 (5.2%) | 1,836 (4.9%) |
| 65 to 69 Years | 1,461 (4.1%) | 1,427 (3.8%) |
| 70 to 74 Years | 938 (2.6%) | 1,099 (2.9%) |
| 75 to 79 Years | 793 (2.2%) | 1,138 (3.0%) |
| 80 to 84 Years | 387 (1.1%) | 457 (1.2%) |
| 85 Years and over | 465 (1.3%) | 391 (1.0%) |
| Total | 35,799 (100.0%) | 37,881 (100.0%) |
Families and Households in Mansfield
Median Family Size in Mansfield
The median family size in Mansfield is 3.48 persons per family, with married-couple families (15,002 | 79.7%) accounting for the largest median family size of 3.55 persons per family. On the other hand, single male/father families (997 | 5.3%) represent the smallest median family size with 3.06 persons per family.
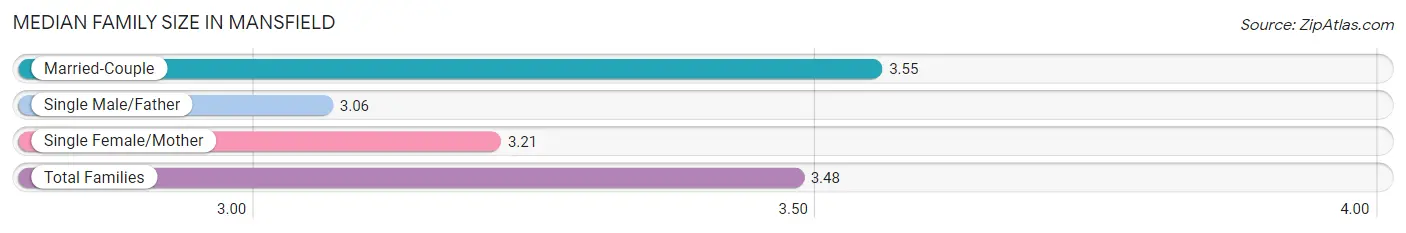
| Family Type | # Families | Family Size |
| Married-Couple | 15,002 (79.7%) | 3.55 |
| Single Male/Father | 997 (5.3%) | 3.06 |
| Single Female/Mother | 2,813 (14.9%) | 3.21 |
| Total Families | 18,812 (100.0%) | 3.48 |
Median Household Size in Mansfield
The median household size in Mansfield is 3.07 persons per household, with married-couple households (15,002 | 62.8%) accounting for the largest median household size of 3.6 persons per household. non-family households (5,093 | 21.3%) represent the smallest median household size with 1.20 persons per household.
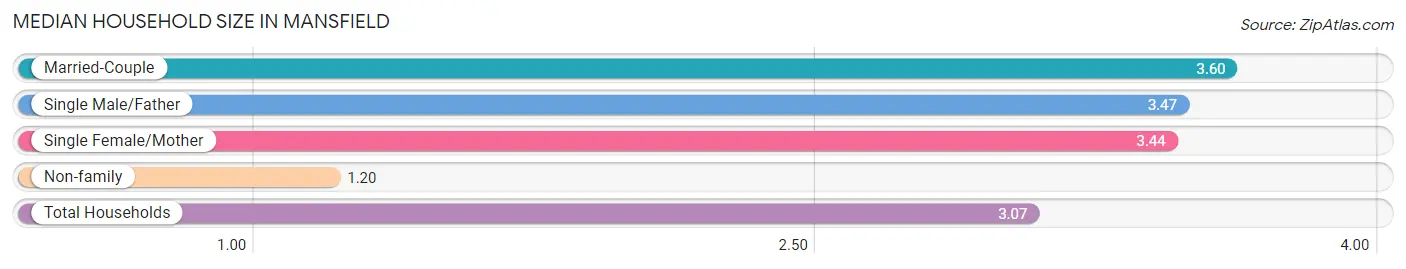
| Household Type | # Households | Household Size |
| Married-Couple | 15,002 (62.8%) | 3.60 |
| Single Male/Father | 997 (4.2%) | 3.47 |
| Single Female/Mother | 2,813 (11.8%) | 3.44 |
| Non-family | 5,093 (21.3%) | 1.20 |
| Total Households | 23,905 (100.0%) | 3.07 |
Household Size by Marriage Status in Mansfield
Out of a total of 23,905 households in Mansfield, 18,812 (78.7%) are family households, while 5,093 (21.3%) are nonfamily households. The most numerous type of family households are 2-person households, comprising 6,114, and the most common type of nonfamily households are 1-person households, comprising 4,357.
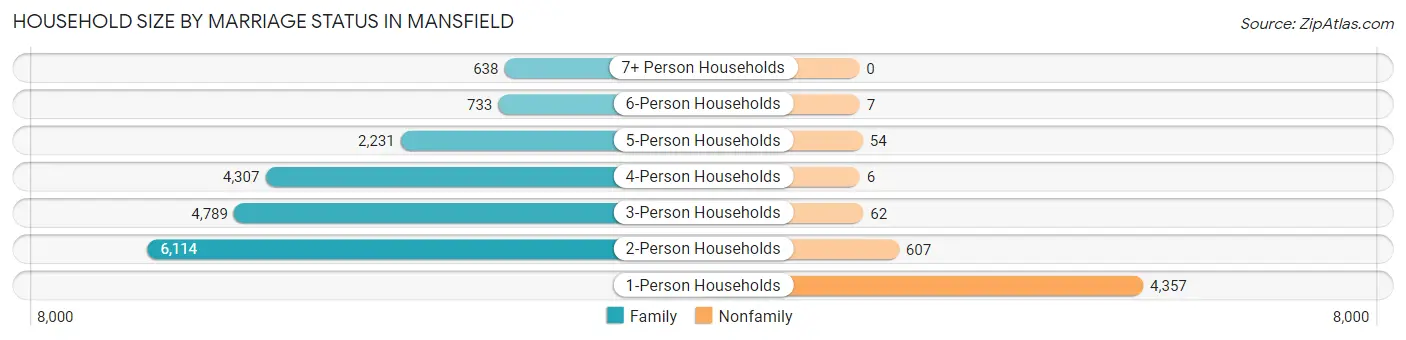
| Household Size | Family Households | Nonfamily Households |
| 1-Person Households | - | 4,357 (18.2%) |
| 2-Person Households | 6,114 (25.6%) | 607 (2.5%) |
| 3-Person Households | 4,789 (20.0%) | 62 (0.3%) |
| 4-Person Households | 4,307 (18.0%) | 6 (0.0%) |
| 5-Person Households | 2,231 (9.3%) | 54 (0.2%) |
| 6-Person Households | 733 (3.1%) | 7 (0.0%) |
| 7+ Person Households | 638 (2.7%) | 0 (0.0%) |
| Total | 18,812 (78.7%) | 5,093 (21.3%) |
Female Fertility in Mansfield
Fertility by Age in Mansfield
Average fertility rate in Mansfield is 30.0 births per 1,000 women. Women in the age bracket of 20 to 34 years have the highest fertility rate with 58.0 births per 1,000 women. Women in the age bracket of 20 to 34 years acount for 58.9% of all women with births.
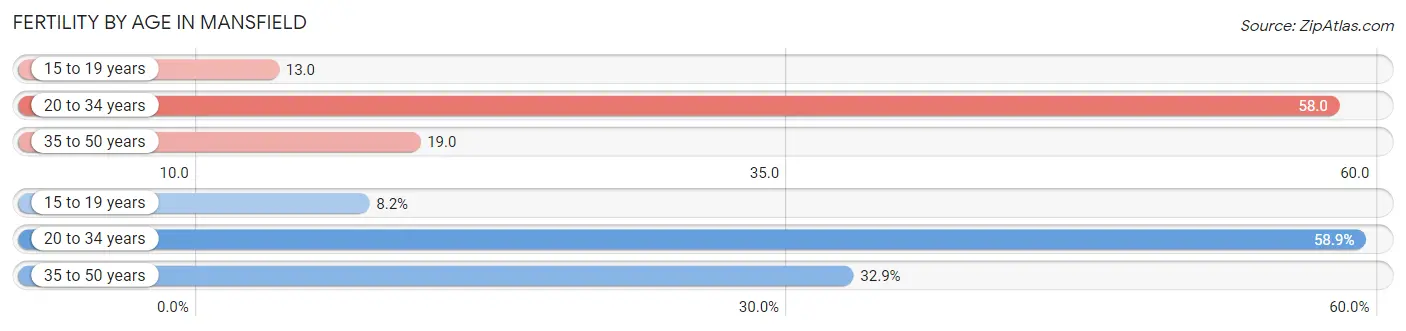
| Age Bracket | Women with Births | Births / 1,000 Women |
| 15 to 19 years | 45 (8.2%) | 13.0 |
| 20 to 34 years | 323 (58.9%) | 58.0 |
| 35 to 50 years | 180 (32.9%) | 19.0 |
| Total | 548 (100.0%) | 30.0 |
Fertility by Age by Marriage Status in Mansfield
97.6% of women with births (548) in Mansfield are married. The highest percentage of unmarried women with births falls into 35 to 50 years age bracket with 4.4% of them unmarried at the time of birth, while the lowest percentage of unmarried women with births belong to 15 to 19 years age bracket with 0.0% of them unmarried.
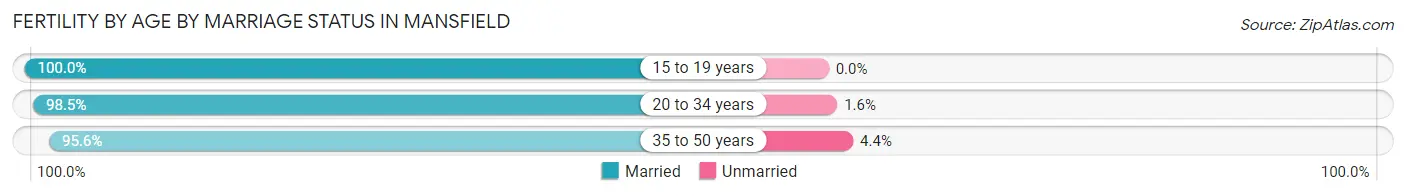
| Age Bracket | Married | Unmarried |
| 15 to 19 years | 45 (100.0%) | 0 (0.0%) |
| 20 to 34 years | 318 (98.5%) | 5 (1.5%) |
| 35 to 50 years | 172 (95.6%) | 8 (4.4%) |
| Total | 535 (97.6%) | 13 (2.4%) |
Fertility by Education in Mansfield
Average fertility rate in Mansfield is 30.0 births per 1,000 women. Women with the education attainment of high school diploma have the highest fertility rate of 65.0 births per 1,000 women, while women with the education attainment of less than high school have the lowest fertility at 3.0 births per 1,000 women. Women with the education attainment of high school diploma represent 29.6% of all women with births.
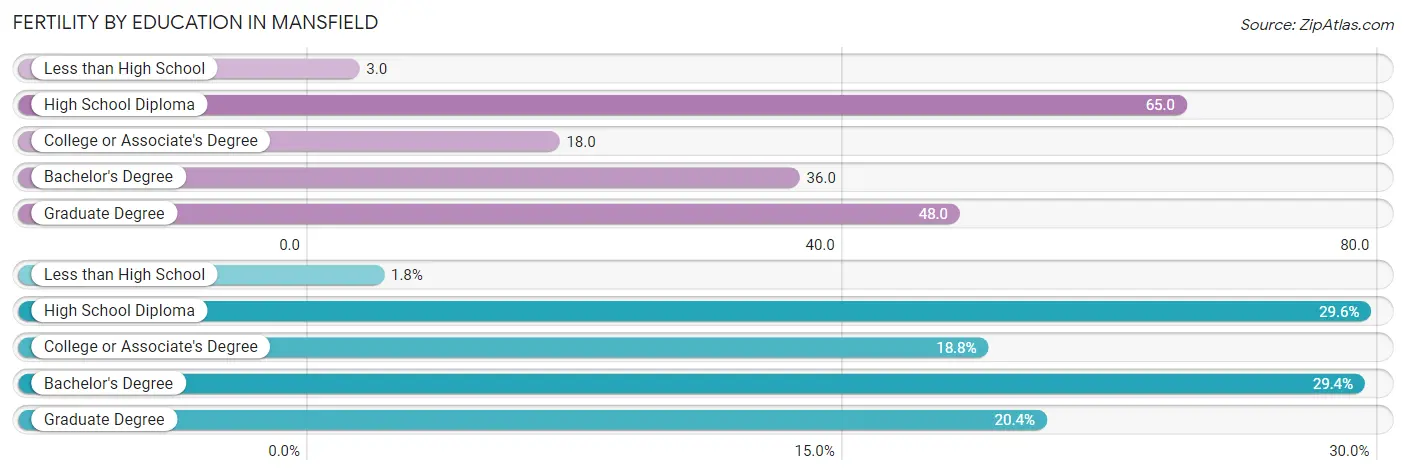
| Educational Attainment | Women with Births | Births / 1,000 Women |
| Less than High School | 10 (1.8%) | 3.0 |
| High School Diploma | 162 (29.6%) | 65.0 |
| College or Associate's Degree | 103 (18.8%) | 18.0 |
| Bachelor's Degree | 161 (29.4%) | 36.0 |
| Graduate Degree | 112 (20.4%) | 48.0 |
| Total | 548 (100.0%) | 30.0 |
Fertility by Education by Marriage Status in Mansfield
2.4% of women with births in Mansfield are unmarried. Women with the educational attainment of less than high school are most likely to be married with 100.0% of them married at childbirth, while women with the educational attainment of high school diploma are least likely to be married with 4.9% of them unmarried at childbirth.
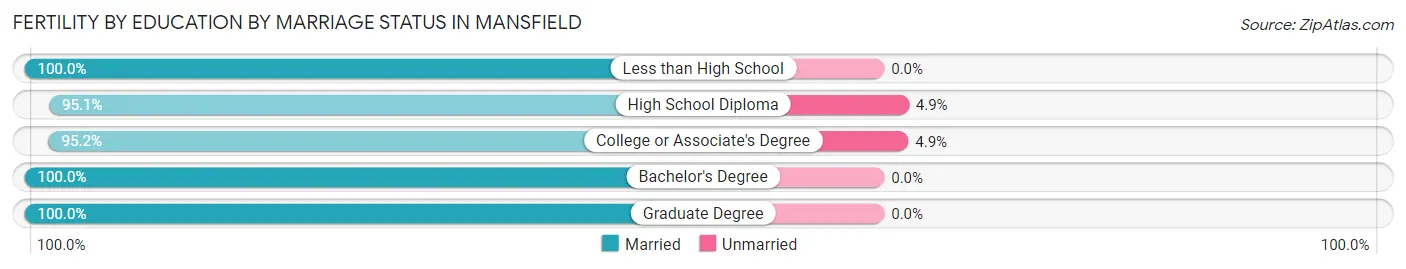
| Educational Attainment | Married | Unmarried |
| Less than High School | 10 (100.0%) | 0 (0.0%) |
| High School Diploma | 154 (95.1%) | 8 (4.9%) |
| College or Associate's Degree | 98 (95.2%) | 5 (4.9%) |
| Bachelor's Degree | 161 (100.0%) | 0 (0.0%) |
| Graduate Degree | 112 (100.0%) | 0 (0.0%) |
| Total | 535 (97.6%) | 13 (2.4%) |
Employment Characteristics in Mansfield
Employment by Class of Employer in Mansfield
Among the 37,941 employed individuals in Mansfield, private company employees (26,901 | 70.9%), not-for-profit organizations (2,705 | 7.1%), and local government employees (2,621 | 6.9%) make up the most common classes of employment.
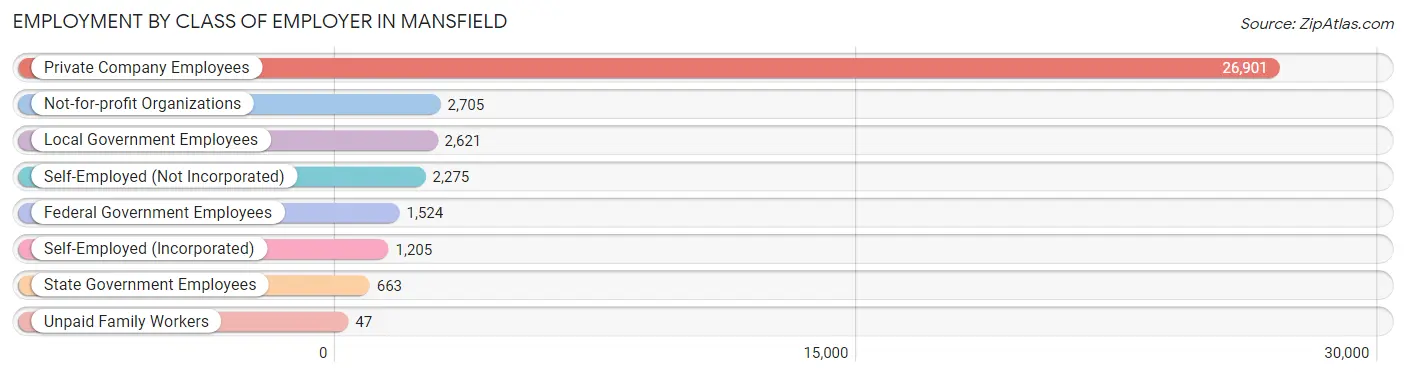
| Employer Class | # Employees | % Employees |
| Private Company Employees | 26,901 | 70.9% |
| Self-Employed (Incorporated) | 1,205 | 3.2% |
| Self-Employed (Not Incorporated) | 2,275 | 6.0% |
| Not-for-profit Organizations | 2,705 | 7.1% |
| Local Government Employees | 2,621 | 6.9% |
| State Government Employees | 663 | 1.8% |
| Federal Government Employees | 1,524 | 4.0% |
| Unpaid Family Workers | 47 | 0.1% |
| Total | 37,941 | 100.0% |
Employment Status by Age in Mansfield
According to the labor force statistics for Mansfield, out of the total population over 16 years of age (55,921), 71.2% or 39,816 individuals are in the labor force, with 3.7% or 1,473 of them unemployed. The age group with the highest labor force participation rate is 30 to 34 years, with 89.5% or 3,794 individuals in the labor force. Within the labor force, the 75 years and over age range has the highest percentage of unemployed individuals, with 12.7% or 60 of them being unemployed.
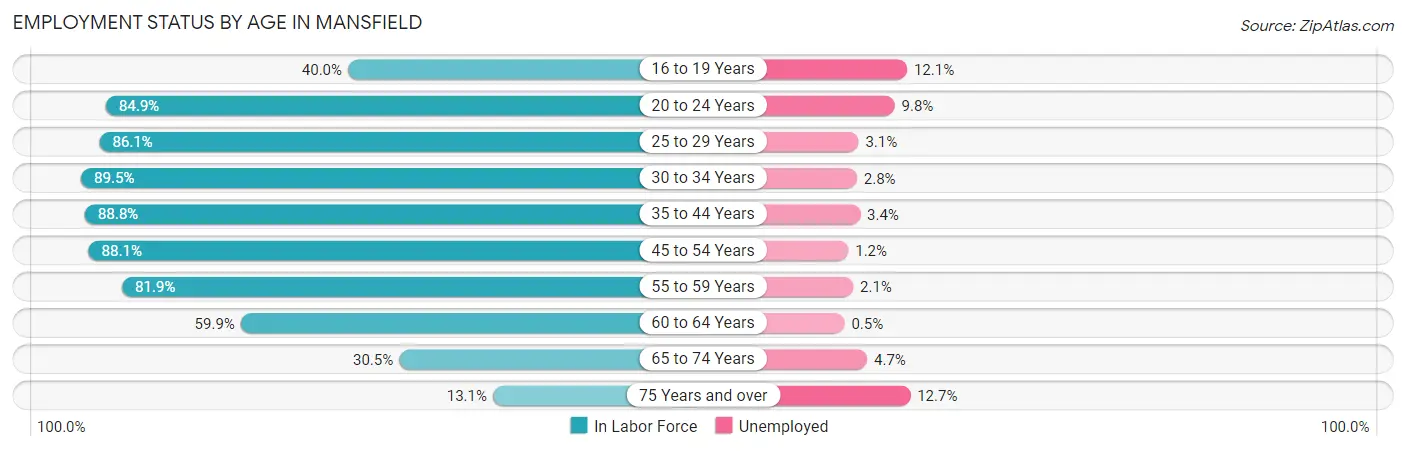
| Age Bracket | In Labor Force | Unemployed |
| 16 to 19 Years | 2,069 (40.0%) | 250 (12.1%) |
| 20 to 24 Years | 3,381 (84.9%) | 331 (9.8%) |
| 25 to 29 Years | 3,283 (86.1%) | 102 (3.1%) |
| 30 to 34 Years | 3,794 (89.5%) | 106 (2.8%) |
| 35 to 44 Years | 9,645 (88.8%) | 328 (3.4%) |
| 45 to 54 Years | 9,443 (88.1%) | 113 (1.2%) |
| 55 to 59 Years | 4,007 (81.9%) | 84 (2.1%) |
| 60 to 64 Years | 2,207 (59.9%) | 11 (0.5%) |
| 65 to 74 Years | 1,502 (30.5%) | 71 (4.7%) |
| 75 Years and over | 476 (13.1%) | 60 (12.7%) |
| Total | 39,816 (71.2%) | 1,473 (3.7%) |
Employment Status by Educational Attainment in Mansfield
According to labor force statistics for Mansfield, 84.8% of individuals (32,402) out of the total population between 25 and 64 years of age (38,210) are in the labor force, with 2.3% or 745 of them being unemployed. The group with the highest labor force participation rate are those with the educational attainment of bachelor's degree or higher, with 90.2% or 14,878 individuals in the labor force. Within the labor force, individuals with high school diploma education have the highest percentage of unemployment, with 5.0% or 255 of them being unemployed.
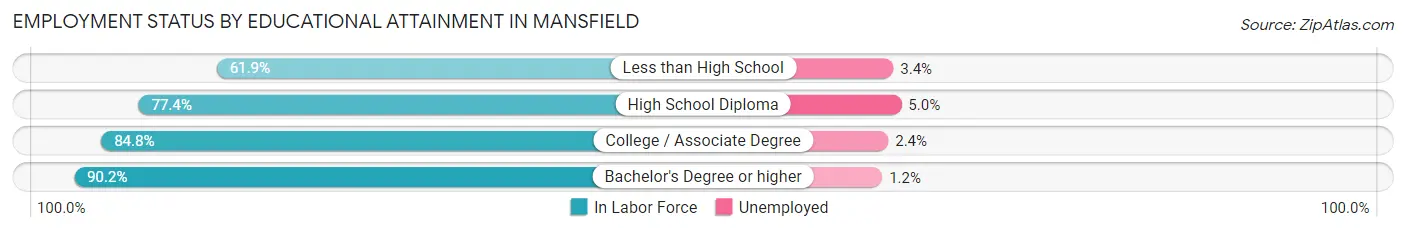
| Educational Attainment | In Labor Force | Unemployed |
| Less than High School | 1,133 (61.9%) | 62 (3.4%) |
| High School Diploma | 5,098 (77.4%) | 329 (5.0%) |
| College / Associate Degree | 11,278 (84.8%) | 319 (2.4%) |
| Bachelor's Degree or higher | 14,878 (90.2%) | 198 (1.2%) |
| Total | 32,402 (84.8%) | 879 (2.3%) |
Employment Occupations by Sex in Mansfield
Management, Business, Science and Arts Occupations
The most common Management, Business, Science and Arts occupations in Mansfield are Management (6,231 | 16.3%), Community & Social Service (4,142 | 10.8%), Computers, Engineering & Science (2,754 | 7.2%), Education Instruction & Library (2,696 | 7.1%), and Business & Financial (2,662 | 7.0%).
Management, Business, Science and Arts Occupations by Sex
Within the Management, Business, Science and Arts occupations in Mansfield, the most male-oriented occupations are Architecture & Engineering (93.7%), Computers, Engineering & Science (79.2%), and Computers & Mathematics (72.8%), while the most female-oriented occupations are Health Diagnosing & Treating (83.2%), Health Technologists (82.3%), and Legal Services & Support (80.9%).
| Occupation | Male | Female |
| Management | 3,571 (57.3%) | 2,660 (42.7%) |
| Business & Financial | 1,128 (42.4%) | 1,534 (57.6%) |
| Computers, Engineering & Science | 2,181 (79.2%) | 573 (20.8%) |
| Computers & Mathematics | 1,101 (72.8%) | 411 (27.2%) |
| Architecture & Engineering | 903 (93.7%) | 61 (6.3%) |
| Life, Physical & Social Science | 177 (63.7%) | 101 (36.3%) |
| Community & Social Service | 1,322 (31.9%) | 2,820 (68.1%) |
| Education, Arts & Media | 333 (51.5%) | 313 (48.4%) |
| Legal Services & Support | 74 (19.1%) | 313 (80.9%) |
| Education Instruction & Library | 722 (26.8%) | 1,974 (73.2%) |
| Arts, Media & Entertainment | 193 (46.7%) | 220 (53.3%) |
| Health Diagnosing & Treating | 359 (16.8%) | 1,777 (83.2%) |
| Health Technologists | 292 (17.7%) | 1,354 (82.3%) |
| Total (Category) | 8,561 (47.8%) | 9,364 (52.2%) |
| Total (Overall) | 19,913 (52.1%) | 18,287 (47.9%) |
Services Occupations
The most common Services occupations in Mansfield are Food Preparation & Serving (1,781 | 4.7%), Personal Care & Service (1,404 | 3.7%), Healthcare Support (974 | 2.5%), Cleaning & Maintenance (508 | 1.3%), and Security & Protection (468 | 1.2%).
Services Occupations by Sex
Within the Services occupations in Mansfield, the most male-oriented occupations are Law Enforcement (95.6%), Security & Protection (87.8%), and Firefighting & Prevention (80.4%), while the most female-oriented occupations are Healthcare Support (82.6%), Personal Care & Service (71.9%), and Food Preparation & Serving (49.5%).
| Occupation | Male | Female |
| Healthcare Support | 170 (17.4%) | 804 (82.6%) |
| Security & Protection | 411 (87.8%) | 57 (12.2%) |
| Firefighting & Prevention | 193 (80.4%) | 47 (19.6%) |
| Law Enforcement | 218 (95.6%) | 10 (4.4%) |
| Food Preparation & Serving | 899 (50.5%) | 882 (49.5%) |
| Cleaning & Maintenance | 361 (71.1%) | 147 (28.9%) |
| Personal Care & Service | 395 (28.1%) | 1,009 (71.9%) |
| Total (Category) | 2,236 (43.5%) | 2,899 (56.5%) |
| Total (Overall) | 19,913 (52.1%) | 18,287 (47.9%) |
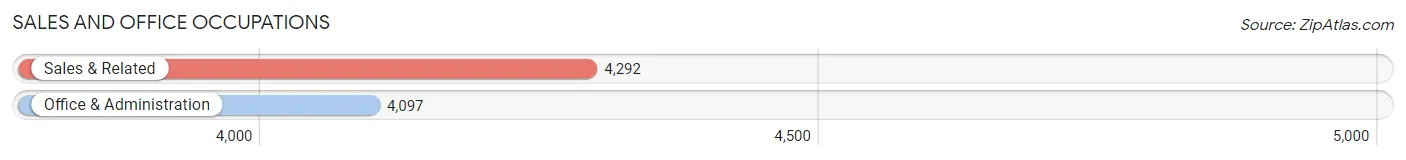
Sales and Office Occupations
The most common Sales and Office occupations in Mansfield are Sales & Related (4,292 | 11.2%), and Office & Administration (4,097 | 10.7%).
Sales and Office Occupations by Sex
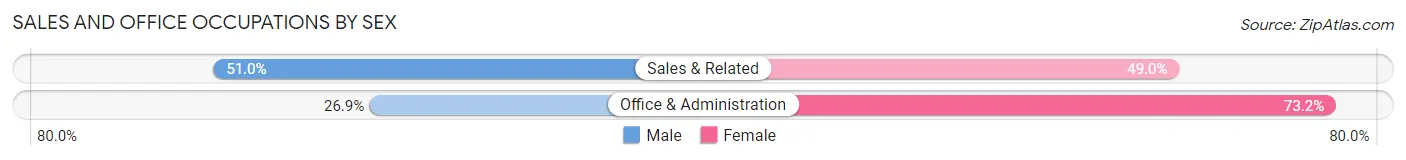
| Occupation | Male | Female |
| Sales & Related | 2,187 (51.0%) | 2,105 (49.0%) |
| Office & Administration | 1,100 (26.9%) | 2,997 (73.2%) |
| Total (Category) | 3,287 (39.2%) | 5,102 (60.8%) |
| Total (Overall) | 19,913 (52.1%) | 18,287 (47.9%) |
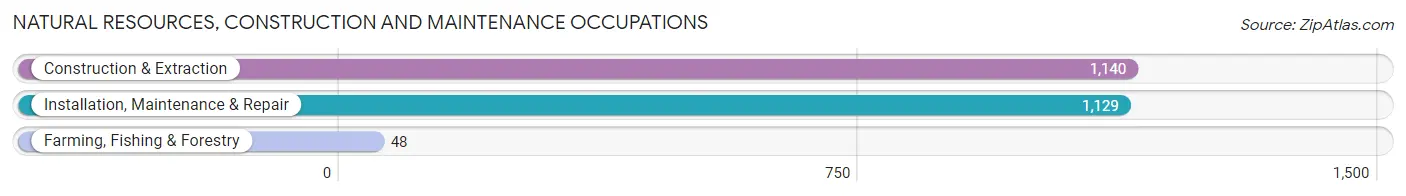
Natural Resources, Construction and Maintenance Occupations
The most common Natural Resources, Construction and Maintenance occupations in Mansfield are Construction & Extraction (1,140 | 3.0%), Installation, Maintenance & Repair (1,129 | 3.0%), and Farming, Fishing & Forestry (48 | 0.1%).
Natural Resources, Construction and Maintenance Occupations by Sex
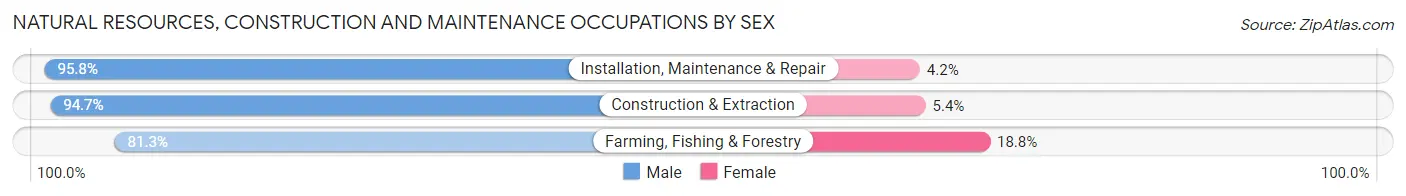
| Occupation | Male | Female |
| Farming, Fishing & Forestry | 39 (81.2%) | 9 (18.8%) |
| Construction & Extraction | 1,079 (94.7%) | 61 (5.3%) |
| Installation, Maintenance & Repair | 1,082 (95.8%) | 47 (4.2%) |
| Total (Category) | 2,200 (95.0%) | 117 (5.1%) |
| Total (Overall) | 19,913 (52.1%) | 18,287 (47.9%) |
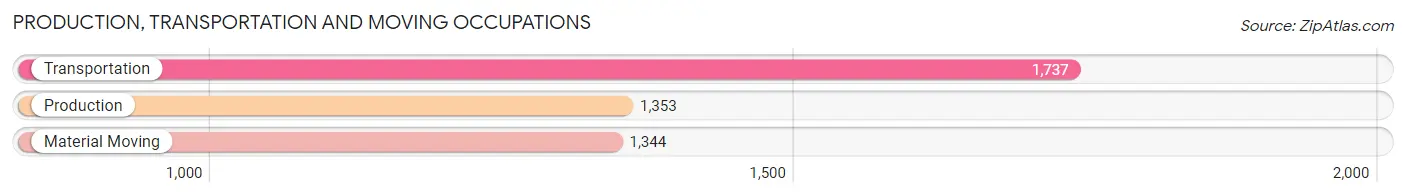
Production, Transportation and Moving Occupations
The most common Production, Transportation and Moving occupations in Mansfield are Transportation (1,737 | 4.5%), Production (1,353 | 3.5%), and Material Moving (1,344 | 3.5%).
Production, Transportation and Moving Occupations by Sex
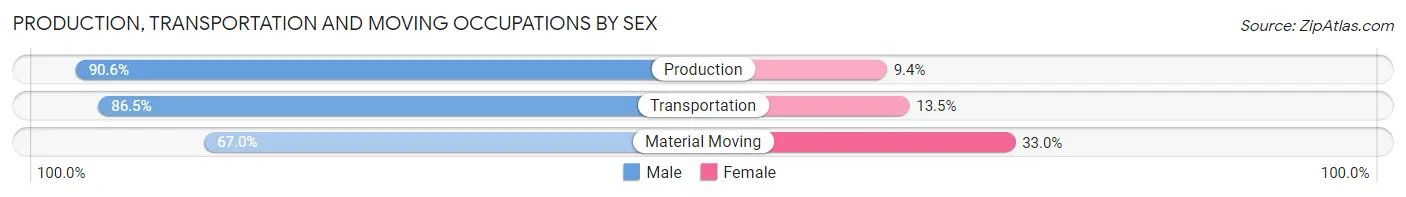
| Occupation | Male | Female |
| Production | 1,226 (90.6%) | 127 (9.4%) |
| Transportation | 1,502 (86.5%) | 235 (13.5%) |
| Material Moving | 901 (67.0%) | 443 (33.0%) |
| Total (Category) | 3,629 (81.8%) | 805 (18.2%) |
| Total (Overall) | 19,913 (52.1%) | 18,287 (47.9%) |
Employment Industries by Sex in Mansfield
Employment Industries in Mansfield
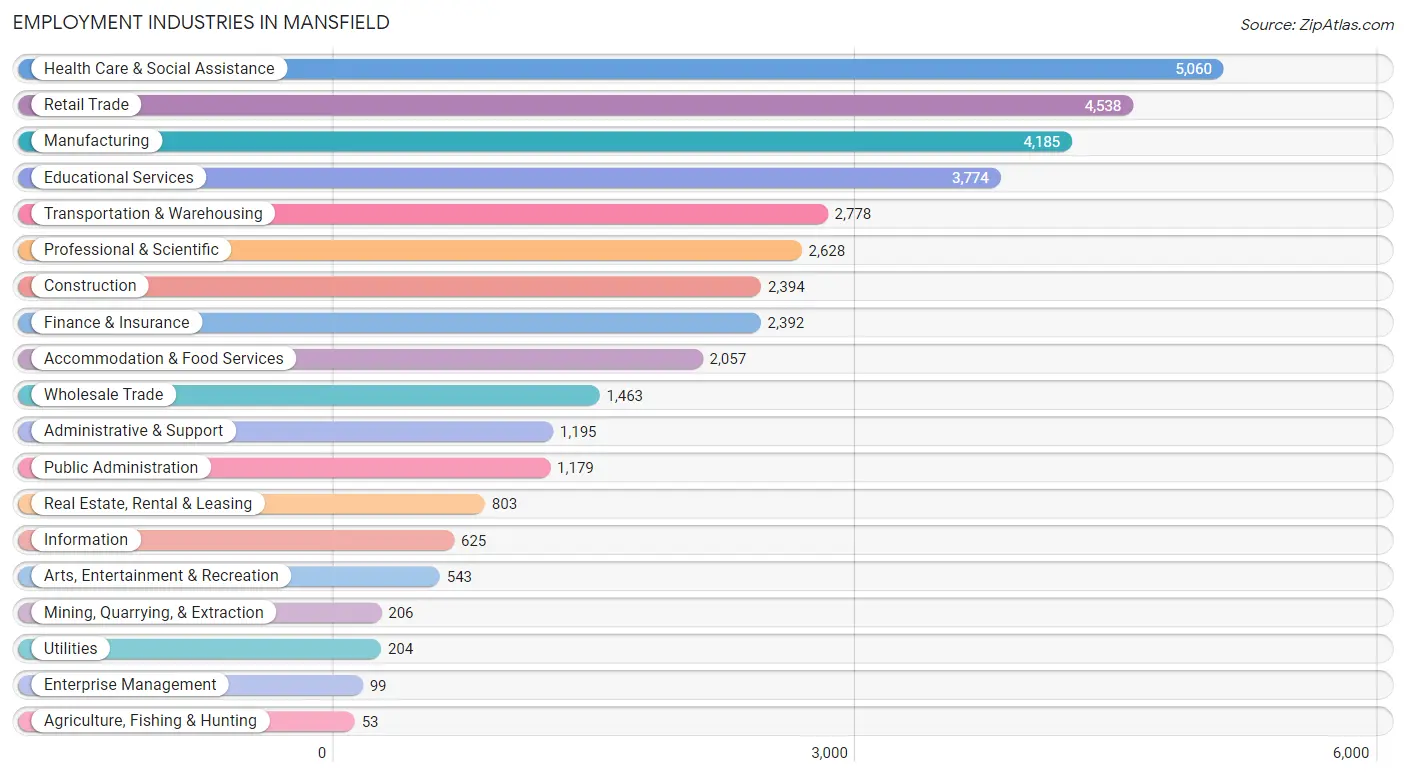
The major employment industries in Mansfield include Health Care & Social Assistance (5,060 | 13.3%), Retail Trade (4,538 | 11.9%), Manufacturing (4,185 | 11.0%), Educational Services (3,774 | 9.9%), and Transportation & Warehousing (2,778 | 7.3%).
Employment Industries by Sex in Mansfield
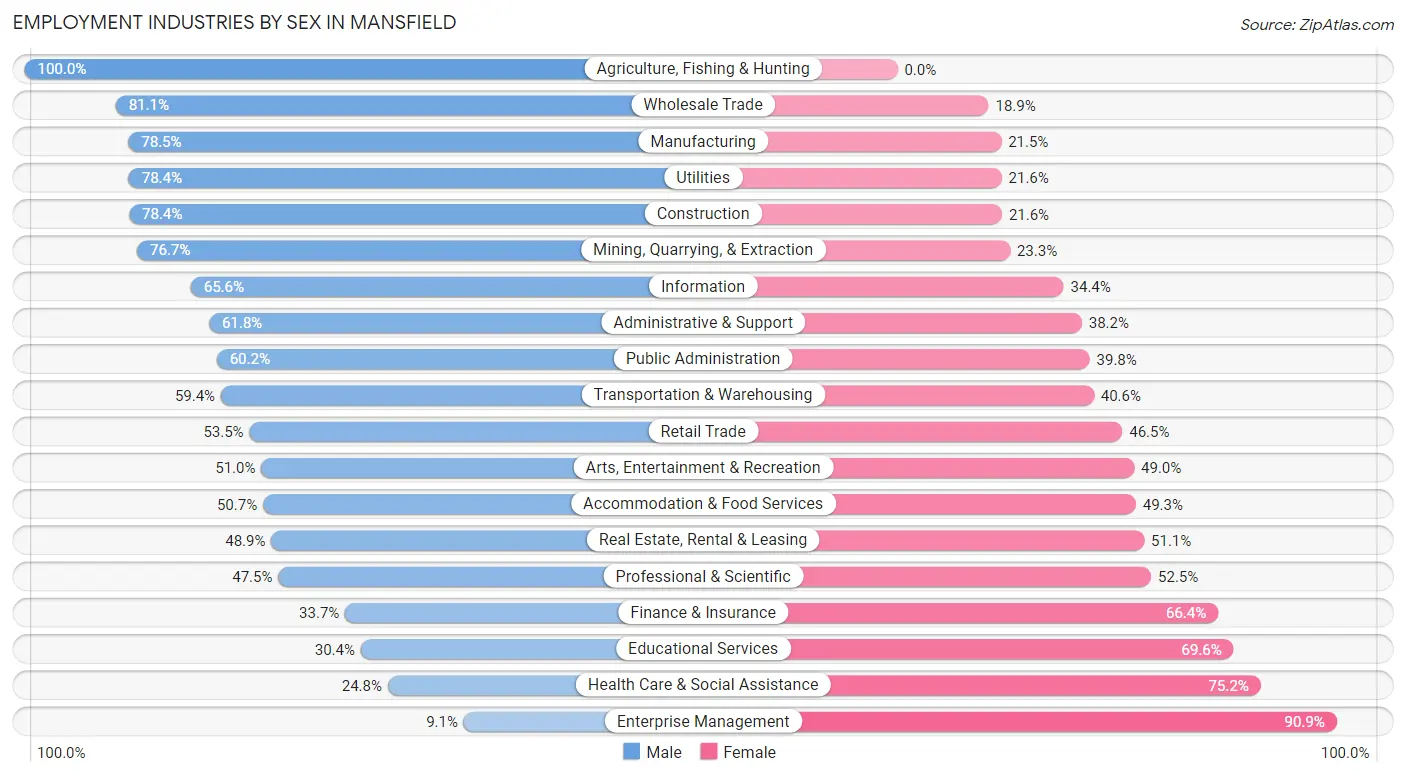
The Mansfield industries that see more men than women are Agriculture, Fishing & Hunting (100.0%), Wholesale Trade (81.1%), and Manufacturing (78.5%), whereas the industries that tend to have a higher number of women are Enterprise Management (90.9%), Health Care & Social Assistance (75.2%), and Educational Services (69.6%).
| Industry | Male | Female |
| Agriculture, Fishing & Hunting | 53 (100.0%) | 0 (0.0%) |
| Mining, Quarrying, & Extraction | 158 (76.7%) | 48 (23.3%) |
| Construction | 1,876 (78.4%) | 518 (21.6%) |
| Manufacturing | 3,286 (78.5%) | 899 (21.5%) |
| Wholesale Trade | 1,187 (81.1%) | 276 (18.9%) |
| Retail Trade | 2,426 (53.5%) | 2,112 (46.5%) |
| Transportation & Warehousing | 1,649 (59.4%) | 1,129 (40.6%) |
| Utilities | 160 (78.4%) | 44 (21.6%) |
| Information | 410 (65.6%) | 215 (34.4%) |
| Finance & Insurance | 805 (33.7%) | 1,587 (66.3%) |
| Real Estate, Rental & Leasing | 393 (48.9%) | 410 (51.1%) |
| Professional & Scientific | 1,248 (47.5%) | 1,380 (52.5%) |
| Enterprise Management | 9 (9.1%) | 90 (90.9%) |
| Administrative & Support | 739 (61.8%) | 456 (38.2%) |
| Educational Services | 1,148 (30.4%) | 2,626 (69.6%) |
| Health Care & Social Assistance | 1,256 (24.8%) | 3,804 (75.2%) |
| Arts, Entertainment & Recreation | 277 (51.0%) | 266 (49.0%) |
| Accommodation & Food Services | 1,042 (50.7%) | 1,015 (49.3%) |
| Public Administration | 710 (60.2%) | 469 (39.8%) |
| Total | 19,913 (52.1%) | 18,287 (47.9%) |
Education in Mansfield
School Enrollment in Mansfield
The most common levels of schooling among the 22,686 students in Mansfield are high school (5,730 | 25.3%), middle school (5,368 | 23.7%), and elementary school (4,198 | 18.5%).
| School Level | # Students | % Students |
| Nursery / Preschool | 898 | 4.0% |
| Kindergarten | 959 | 4.2% |
| Elementary School | 4,198 | 18.5% |
| Middle School | 5,368 | 23.7% |
| High School | 5,730 | 25.3% |
| College / Undergraduate | 4,189 | 18.5% |
| Graduate / Professional | 1,344 | 5.9% |
| Total | 22,686 | 100.0% |
School Enrollment by Age by Funding Source in Mansfield
Out of a total of 22,686 students who are enrolled in schools in Mansfield, 2,881 (12.7%) attend a private institution, while the remaining 19,805 (87.3%) are enrolled in public schools. The age group of 3 to 4 year olds has the highest likelihood of being enrolled in private schools, with 384 (72.7% in the age bracket) enrolled. Conversely, the age group of 18 to 19 year olds has the lowest likelihood of being enrolled in a private school, with 1,690 (94.9% in the age bracket) attending a public institution.
| Age Bracket | Public School | Private School |
| 3 to 4 Year Olds | 144 (27.3%) | 384 (72.7%) |
| 5 to 9 Year Old | 4,214 (89.9%) | 473 (10.1%) |
| 10 to 14 Year Olds | 6,807 (93.3%) | 490 (6.7%) |
| 15 to 17 Year Olds | 3,650 (94.9%) | 198 (5.1%) |
| 18 to 19 Year Olds | 1,690 (94.9%) | 90 (5.1%) |
| 20 to 24 Year Olds | 1,194 (69.5%) | 525 (30.5%) |
| 25 to 34 Year Olds | 1,159 (86.9%) | 175 (13.1%) |
| 35 Years and over | 942 (63.1%) | 551 (36.9%) |
| Total | 19,805 (87.3%) | 2,881 (12.7%) |
Educational Attainment by Field of Study in Mansfield
Business (5,834 | 28.0%), science & technology (2,376 | 11.4%), education (2,112 | 10.2%), engineering (1,671 | 8.0%), and arts & humanities (1,343 | 6.5%) are the most common fields of study among 20,805 individuals in Mansfield who have obtained a bachelor's degree or higher.
| Field of Study | # Graduates | % Graduates |
| Computers & Mathematics | 1,000 | 4.8% |
| Bio, Nature & Agricultural | 1,200 | 5.8% |
| Physical & Health Sciences | 608 | 2.9% |
| Psychology | 977 | 4.7% |
| Social Sciences | 758 | 3.6% |
| Engineering | 1,671 | 8.0% |
| Multidisciplinary Studies | 327 | 1.6% |
| Science & Technology | 2,376 | 11.4% |
| Business | 5,834 | 28.0% |
| Education | 2,112 | 10.2% |
| Literature & Languages | 551 | 2.6% |
| Liberal Arts & History | 618 | 3.0% |
| Visual & Performing Arts | 537 | 2.6% |
| Communications | 893 | 4.3% |
| Arts & Humanities | 1,343 | 6.5% |
| Total | 20,805 | 100.0% |
Transportation & Commute in Mansfield
Vehicle Availability by Sex in Mansfield
The most prevalent vehicle ownership categories in Mansfield are males with 2 vehicles (8,696, accounting for 43.8%) and females with 2 vehicles (7,480, making up 48.0%).
| Vehicles Available | Male | Female |
| No Vehicle | 65 (0.3%) | 65 (0.4%) |
| 1 Vehicle | 1,663 (8.4%) | 2,420 (13.4%) |
| 2 Vehicles | 8,696 (43.8%) | 7,480 (41.3%) |
| 3 Vehicles | 5,221 (26.3%) | 4,752 (26.3%) |
| 4 Vehicles | 2,855 (14.4%) | 2,301 (12.7%) |
| 5 or more Vehicles | 1,343 (6.8%) | 1,078 (6.0%) |
| Total | 19,843 (100.0%) | 18,096 (100.0%) |
Commute Time in Mansfield
The most frequently occuring commute durations in Mansfield are 30 to 34 minutes (6,275 commuters, 19.0%), 15 to 19 minutes (4,293 commuters, 13.0%), and 10 to 14 minutes (3,528 commuters, 10.7%).
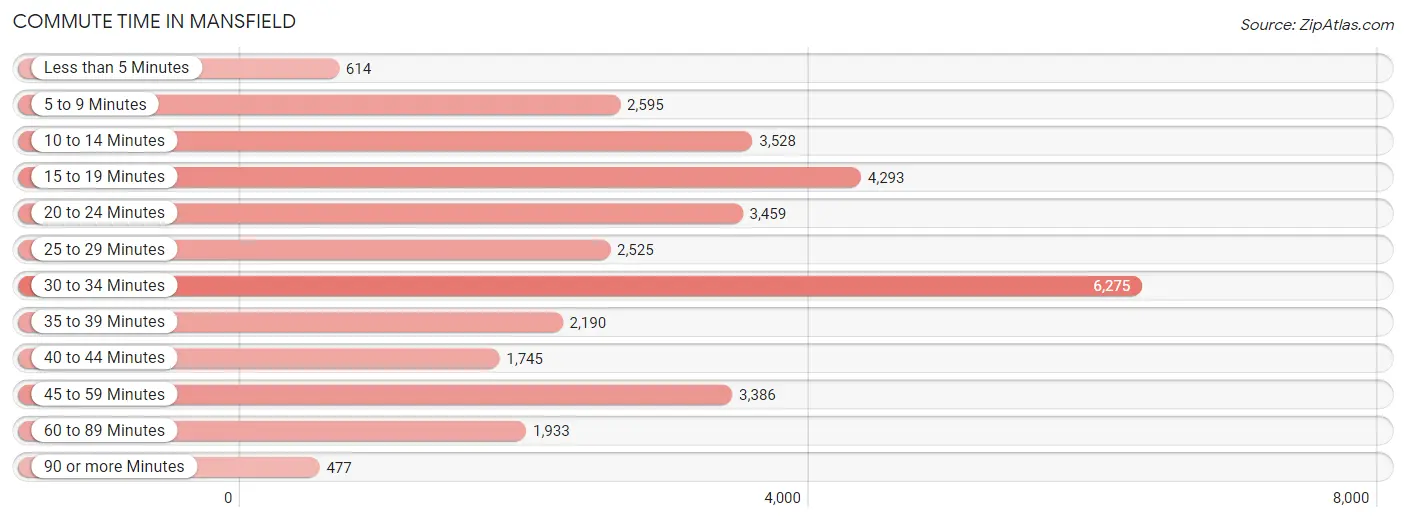
| Commute Time | # Commuters | % Commuters |
| Less than 5 Minutes | 614 | 1.9% |
| 5 to 9 Minutes | 2,595 | 7.9% |
| 10 to 14 Minutes | 3,528 | 10.7% |
| 15 to 19 Minutes | 4,293 | 13.0% |
| 20 to 24 Minutes | 3,459 | 10.5% |
| 25 to 29 Minutes | 2,525 | 7.6% |
| 30 to 34 Minutes | 6,275 | 19.0% |
| 35 to 39 Minutes | 2,190 | 6.6% |
| 40 to 44 Minutes | 1,745 | 5.3% |
| 45 to 59 Minutes | 3,386 | 10.2% |
| 60 to 89 Minutes | 1,933 | 5.9% |
| 90 or more Minutes | 477 | 1.4% |
Commute Time by Sex in Mansfield
The most common commute times in Mansfield are 30 to 34 minutes (3,973 commuters, 22.3%) for males and 15 to 19 minutes (2,499 commuters, 16.4%) for females.
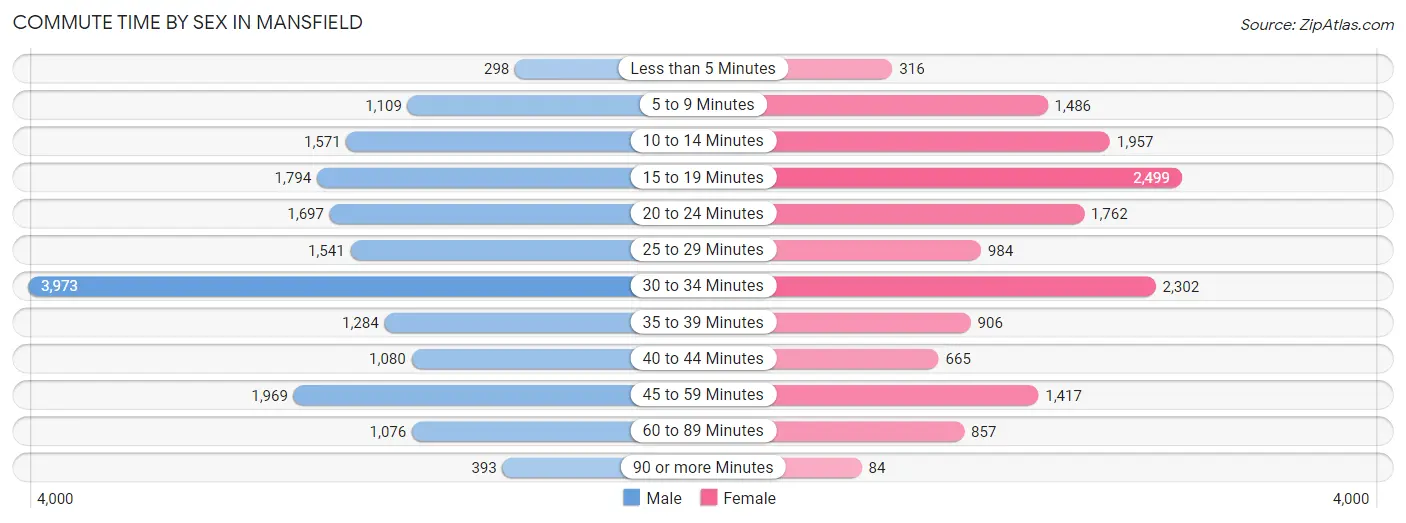
| Commute Time | Male | Female |
| Less than 5 Minutes | 298 (1.7%) | 316 (2.1%) |
| 5 to 9 Minutes | 1,109 (6.2%) | 1,486 (9.8%) |
| 10 to 14 Minutes | 1,571 (8.8%) | 1,957 (12.9%) |
| 15 to 19 Minutes | 1,794 (10.1%) | 2,499 (16.4%) |
| 20 to 24 Minutes | 1,697 (9.5%) | 1,762 (11.6%) |
| 25 to 29 Minutes | 1,541 (8.7%) | 984 (6.5%) |
| 30 to 34 Minutes | 3,973 (22.3%) | 2,302 (15.1%) |
| 35 to 39 Minutes | 1,284 (7.2%) | 906 (5.9%) |
| 40 to 44 Minutes | 1,080 (6.1%) | 665 (4.4%) |
| 45 to 59 Minutes | 1,969 (11.1%) | 1,417 (9.3%) |
| 60 to 89 Minutes | 1,076 (6.0%) | 857 (5.6%) |
| 90 or more Minutes | 393 (2.2%) | 84 (0.5%) |
Time of Departure to Work by Sex in Mansfield
The most frequent times of departure to work in Mansfield are 7:00 AM to 7:29 AM (2,852, 16.0%) for males and 7:00 AM to 7:29 AM (2,737, 18.0%) for females.
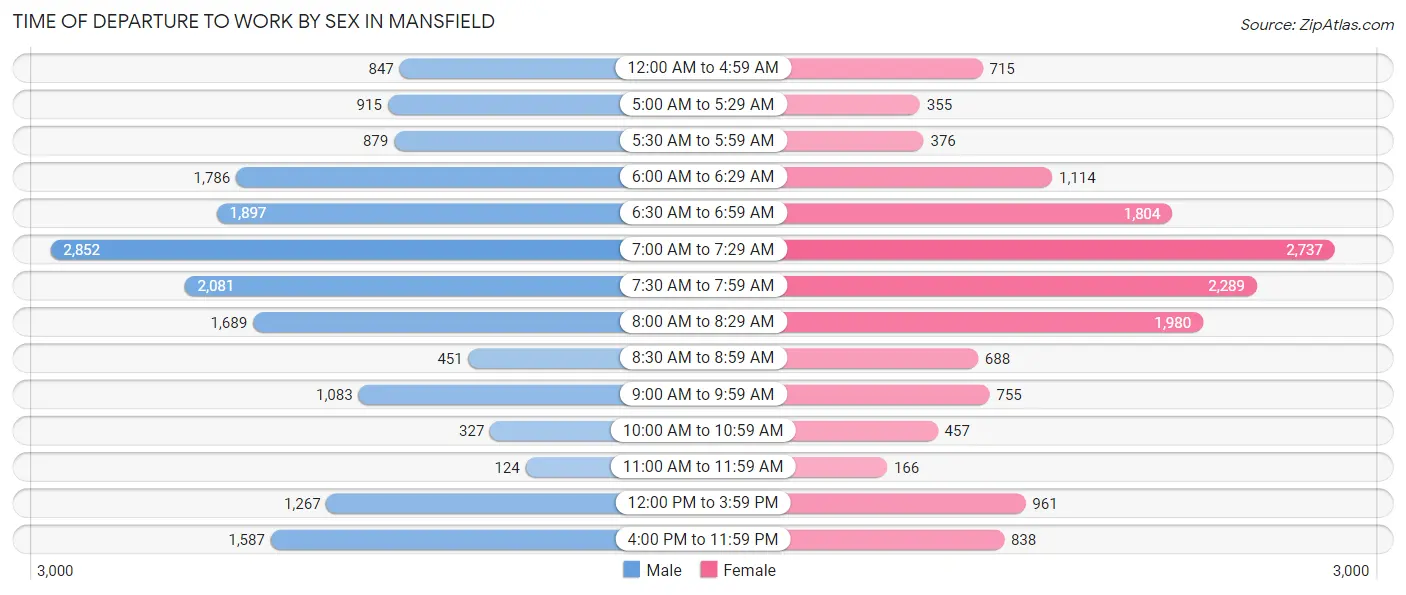
| Time of Departure | Male | Female |
| 12:00 AM to 4:59 AM | 847 (4.8%) | 715 (4.7%) |
| 5:00 AM to 5:29 AM | 915 (5.1%) | 355 (2.3%) |
| 5:30 AM to 5:59 AM | 879 (4.9%) | 376 (2.5%) |
| 6:00 AM to 6:29 AM | 1,786 (10.0%) | 1,114 (7.3%) |
| 6:30 AM to 6:59 AM | 1,897 (10.7%) | 1,804 (11.8%) |
| 7:00 AM to 7:29 AM | 2,852 (16.0%) | 2,737 (18.0%) |
| 7:30 AM to 7:59 AM | 2,081 (11.7%) | 2,289 (15.0%) |
| 8:00 AM to 8:29 AM | 1,689 (9.5%) | 1,980 (13.0%) |
| 8:30 AM to 8:59 AM | 451 (2.5%) | 688 (4.5%) |
| 9:00 AM to 9:59 AM | 1,083 (6.1%) | 755 (5.0%) |
| 10:00 AM to 10:59 AM | 327 (1.8%) | 457 (3.0%) |
| 11:00 AM to 11:59 AM | 124 (0.7%) | 166 (1.1%) |
| 12:00 PM to 3:59 PM | 1,267 (7.1%) | 961 (6.3%) |
| 4:00 PM to 11:59 PM | 1,587 (8.9%) | 838 (5.5%) |
| Total | 17,785 (100.0%) | 15,235 (100.0%) |
Housing Occupancy in Mansfield
Occupancy by Ownership in Mansfield
Of the total 23,905 dwellings in Mansfield, owner-occupied units account for 18,054 (75.5%), while renter-occupied units make up 5,851 (24.5%).
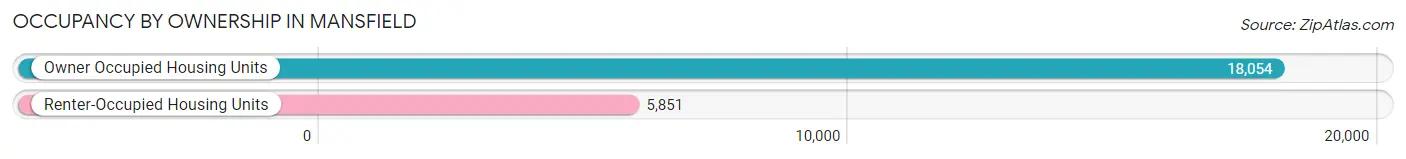
| Occupancy | # Housing Units | % Housing Units |
| Owner Occupied Housing Units | 18,054 | 75.5% |
| Renter-Occupied Housing Units | 5,851 | 24.5% |
| Total Occupied Housing Units | 23,905 | 100.0% |
Occupancy by Household Size in Mansfield
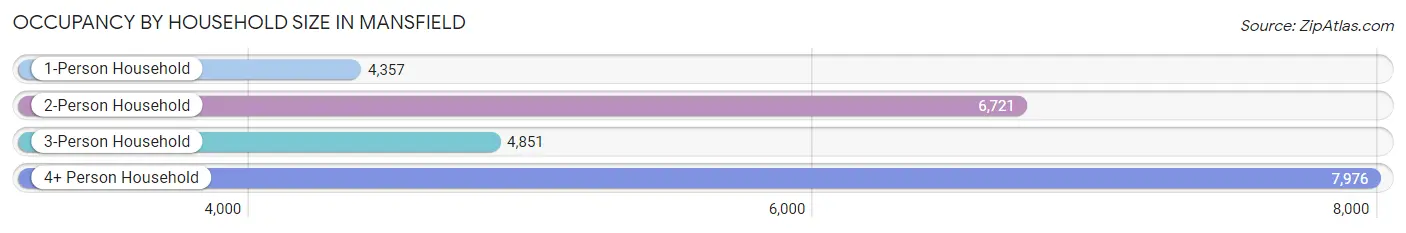
| Household Size | # Housing Units | % Housing Units |
| 1-Person Household | 4,357 | 18.2% |
| 2-Person Household | 6,721 | 28.1% |
| 3-Person Household | 4,851 | 20.3% |
| 4+ Person Household | 7,976 | 33.4% |
| Total Housing Units | 23,905 | 100.0% |
Occupancy by Ownership by Household Size in Mansfield
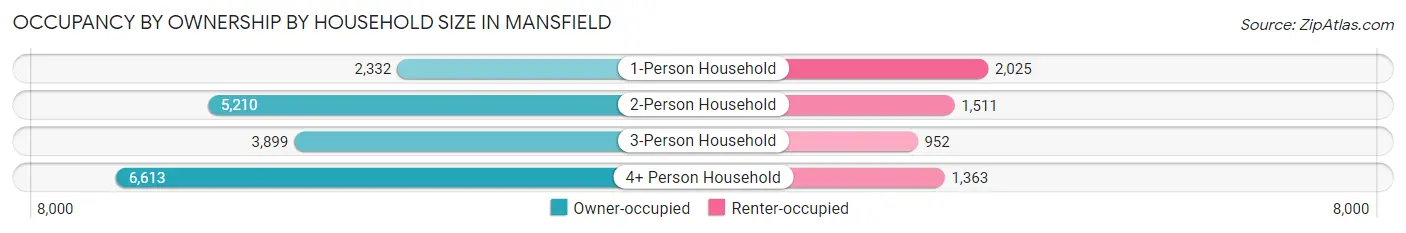
| Household Size | Owner-occupied | Renter-occupied |
| 1-Person Household | 2,332 (53.5%) | 2,025 (46.5%) |
| 2-Person Household | 5,210 (77.5%) | 1,511 (22.5%) |
| 3-Person Household | 3,899 (80.4%) | 952 (19.6%) |
| 4+ Person Household | 6,613 (82.9%) | 1,363 (17.1%) |
| Total Housing Units | 18,054 (75.5%) | 5,851 (24.5%) |
Occupancy by Educational Attainment in Mansfield
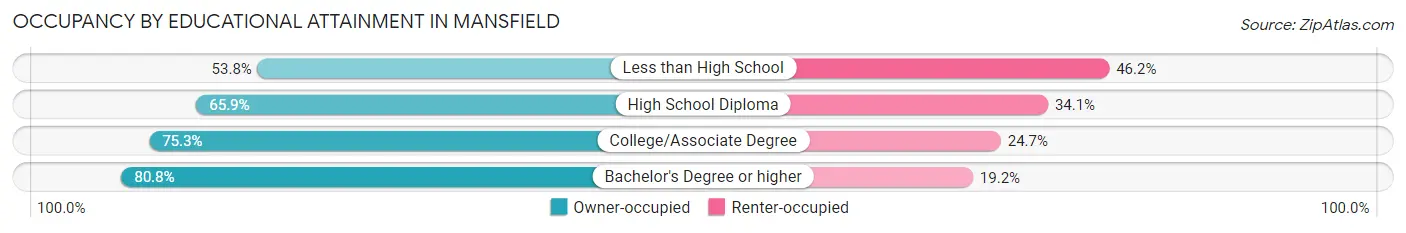
| Household Size | Owner-occupied | Renter-occupied |
| Less than High School | 482 (53.8%) | 414 (46.2%) |
| High School Diploma | 2,420 (65.9%) | 1,250 (34.1%) |
| College/Associate Degree | 6,503 (75.3%) | 2,134 (24.7%) |
| Bachelor's Degree or higher | 8,649 (80.8%) | 2,053 (19.2%) |
Occupancy by Age of Householder in Mansfield
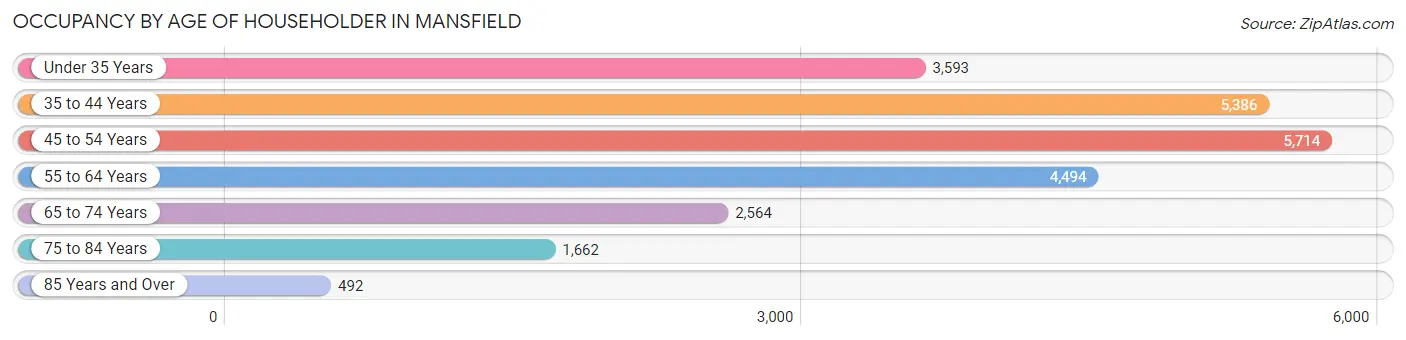
| Age Bracket | # Households | % Households |
| Under 35 Years | 3,593 | 15.0% |
| 35 to 44 Years | 5,386 | 22.5% |
| 45 to 54 Years | 5,714 | 23.9% |
| 55 to 64 Years | 4,494 | 18.8% |
| 65 to 74 Years | 2,564 | 10.7% |
| 75 to 84 Years | 1,662 | 7.0% |
| 85 Years and Over | 492 | 2.1% |
| Total | 23,905 | 100.0% |
Housing Finances in Mansfield
Median Income by Occupancy in Mansfield
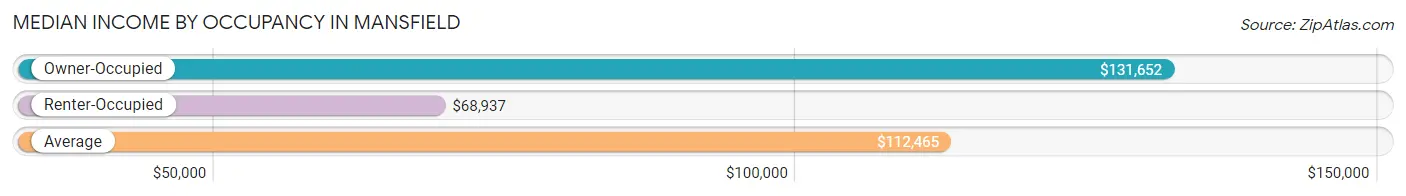
| Occupancy Type | # Households | Median Income |
| Owner-Occupied | 18,054 (75.5%) | $131,652 |
| Renter-Occupied | 5,851 (24.5%) | $68,937 |
| Average | 23,905 (100.0%) | $112,465 |
Occupancy by Householder Income Bracket in Mansfield
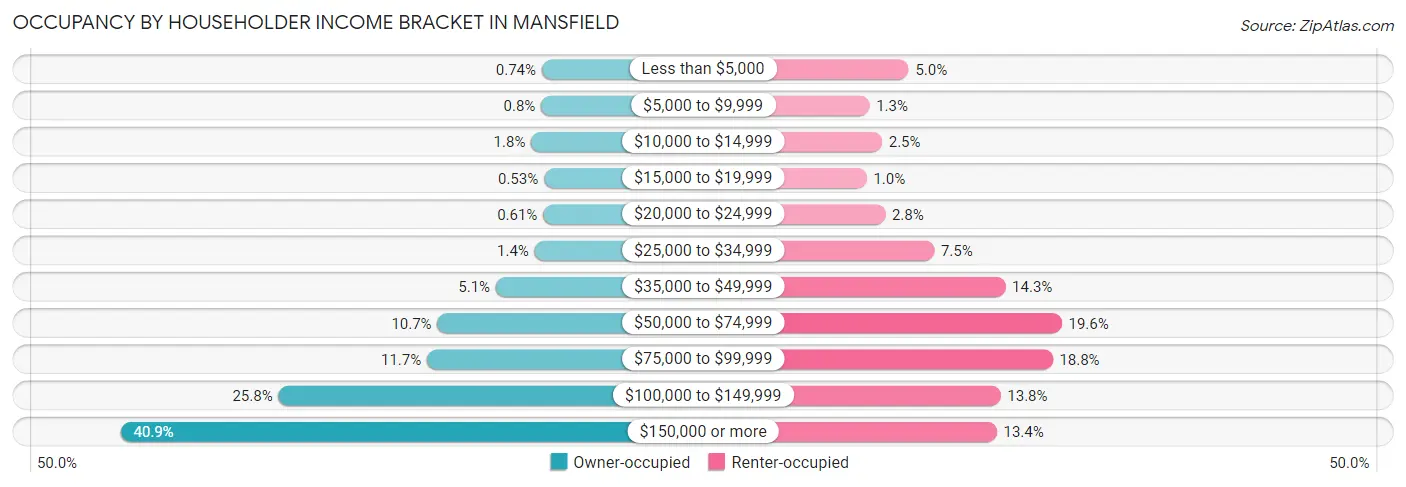
| Income Bracket | Owner-occupied | Renter-occupied |
| Less than $5,000 | 133 (0.7%) | 295 (5.0%) |
| $5,000 to $9,999 | 144 (0.8%) | 76 (1.3%) |
| $10,000 to $14,999 | 316 (1.8%) | 146 (2.5%) |
| $15,000 to $19,999 | 96 (0.5%) | 61 (1.0%) |
| $20,000 to $24,999 | 111 (0.6%) | 164 (2.8%) |
| $25,000 to $34,999 | 256 (1.4%) | 437 (7.5%) |
| $35,000 to $49,999 | 923 (5.1%) | 834 (14.2%) |
| $50,000 to $74,999 | 1,929 (10.7%) | 1,148 (19.6%) |
| $75,000 to $99,999 | 2,107 (11.7%) | 1,097 (18.8%) |
| $100,000 to $149,999 | 4,661 (25.8%) | 807 (13.8%) |
| $150,000 or more | 7,378 (40.9%) | 786 (13.4%) |
| Total | 18,054 (100.0%) | 5,851 (100.0%) |
Monthly Housing Cost Tiers in Mansfield
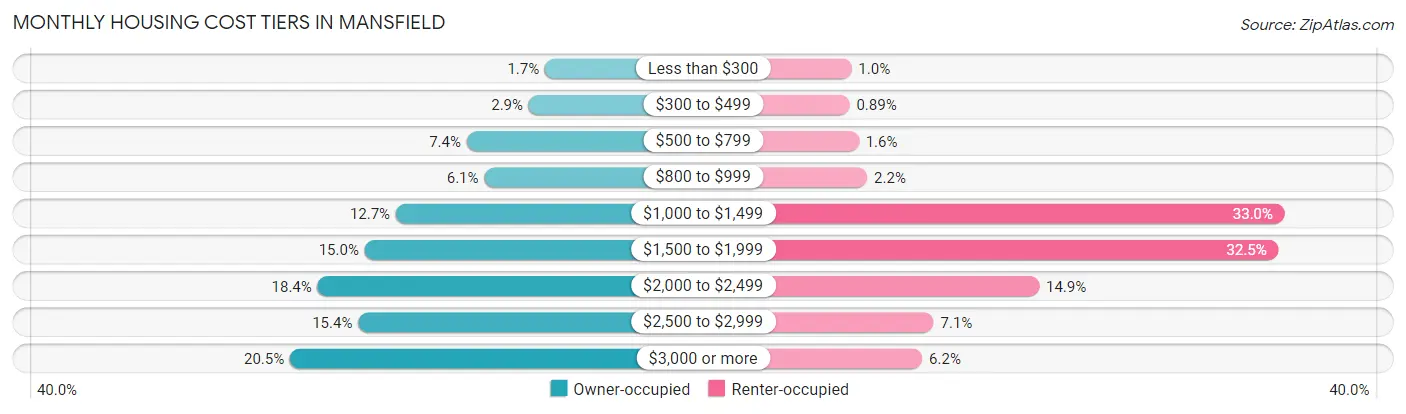
| Monthly Cost | Owner-occupied | Renter-occupied |
| Less than $300 | 301 (1.7%) | 60 (1.0%) |
| $300 to $499 | 516 (2.9%) | 52 (0.9%) |
| $500 to $799 | 1,342 (7.4%) | 92 (1.6%) |
| $800 to $999 | 1,109 (6.1%) | 128 (2.2%) |
| $1,000 to $1,499 | 2,283 (12.7%) | 1,928 (33.0%) |
| $1,500 to $1,999 | 2,699 (14.9%) | 1,901 (32.5%) |
| $2,000 to $2,499 | 3,326 (18.4%) | 869 (14.8%) |
| $2,500 to $2,999 | 2,786 (15.4%) | 414 (7.1%) |
| $3,000 or more | 3,692 (20.4%) | 365 (6.2%) |
| Total | 18,054 (100.0%) | 5,851 (100.0%) |
Physical Housing Characteristics in Mansfield
Housing Structures in Mansfield
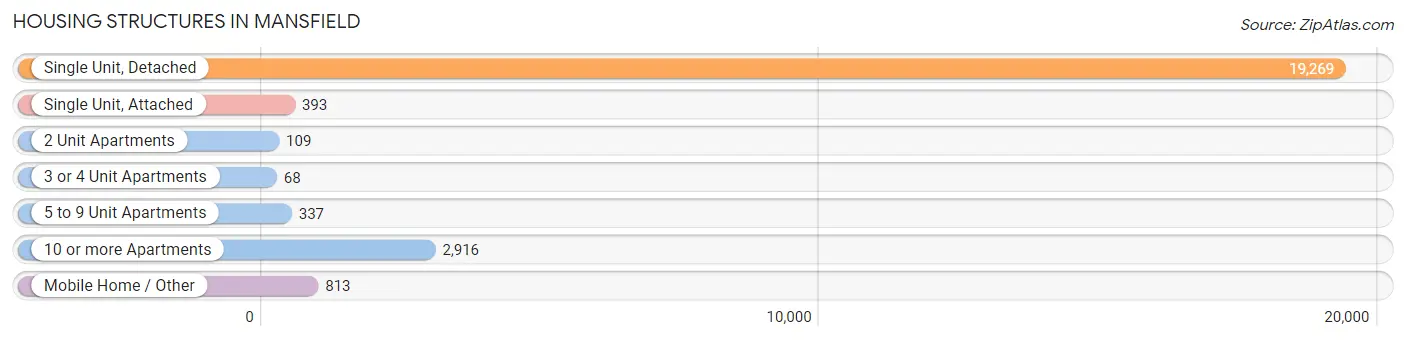
| Structure Type | # Housing Units | % Housing Units |
| Single Unit, Detached | 19,269 | 80.6% |
| Single Unit, Attached | 393 | 1.6% |
| 2 Unit Apartments | 109 | 0.5% |
| 3 or 4 Unit Apartments | 68 | 0.3% |
| 5 to 9 Unit Apartments | 337 | 1.4% |
| 10 or more Apartments | 2,916 | 12.2% |
| Mobile Home / Other | 813 | 3.4% |
| Total | 23,905 | 100.0% |
Housing Structures by Occupancy in Mansfield
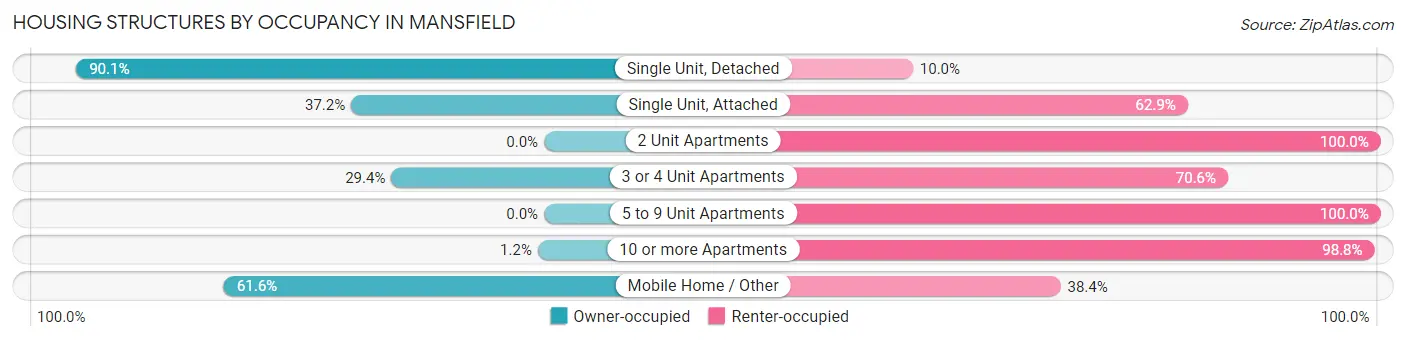
| Structure Type | Owner-occupied | Renter-occupied |
| Single Unit, Detached | 17,352 (90.0%) | 1,917 (10.0%) |
| Single Unit, Attached | 146 (37.1%) | 247 (62.8%) |
| 2 Unit Apartments | 0 (0.0%) | 109 (100.0%) |
| 3 or 4 Unit Apartments | 20 (29.4%) | 48 (70.6%) |
| 5 to 9 Unit Apartments | 0 (0.0%) | 337 (100.0%) |
| 10 or more Apartments | 35 (1.2%) | 2,881 (98.8%) |
| Mobile Home / Other | 501 (61.6%) | 312 (38.4%) |
| Total | 18,054 (75.5%) | 5,851 (24.5%) |
Housing Structures by Number of Rooms in Mansfield
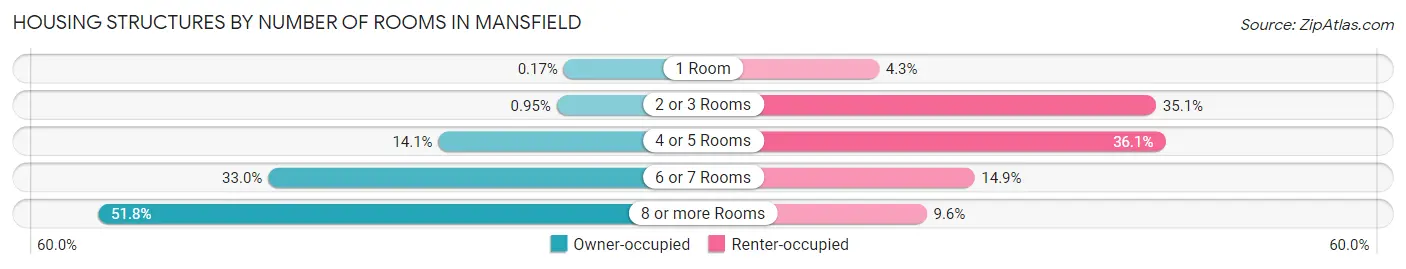
| Number of Rooms | Owner-occupied | Renter-occupied |
| 1 Room | 31 (0.2%) | 252 (4.3%) |
| 2 or 3 Rooms | 171 (0.9%) | 2,052 (35.1%) |
| 4 or 5 Rooms | 2,540 (14.1%) | 2,112 (36.1%) |
| 6 or 7 Rooms | 5,953 (33.0%) | 873 (14.9%) |
| 8 or more Rooms | 9,359 (51.8%) | 562 (9.6%) |
| Total | 18,054 (100.0%) | 5,851 (100.0%) |
Housing Structure by Heating Type in Mansfield
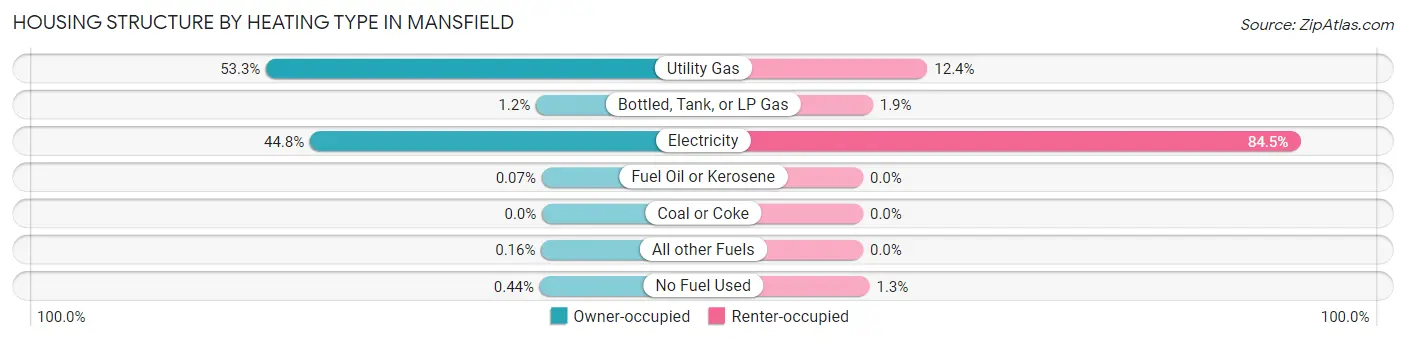
| Heating Type | Owner-occupied | Renter-occupied |
| Utility Gas | 9,624 (53.3%) | 727 (12.4%) |
| Bottled, Tank, or LP Gas | 213 (1.2%) | 110 (1.9%) |
| Electricity | 8,096 (44.8%) | 4,941 (84.5%) |
| Fuel Oil or Kerosene | 12 (0.1%) | 0 (0.0%) |
| Coal or Coke | 0 (0.0%) | 0 (0.0%) |
| All other Fuels | 29 (0.2%) | 0 (0.0%) |
| No Fuel Used | 80 (0.4%) | 73 (1.3%) |
| Total | 18,054 (100.0%) | 5,851 (100.0%) |
Household Vehicle Usage in Mansfield
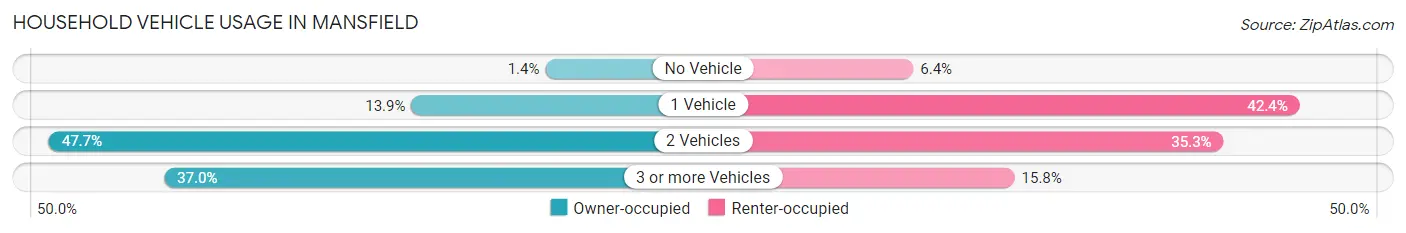
| Vehicles per Household | Owner-occupied | Renter-occupied |
| No Vehicle | 251 (1.4%) | 374 (6.4%) |
| 1 Vehicle | 2,509 (13.9%) | 2,483 (42.4%) |
| 2 Vehicles | 8,619 (47.7%) | 2,067 (35.3%) |
| 3 or more Vehicles | 6,675 (37.0%) | 927 (15.8%) |
| Total | 18,054 (100.0%) | 5,851 (100.0%) |
Real Estate & Mortgages in Mansfield
Real Estate and Mortgage Overview in Mansfield
| Characteristic | Without Mortgage | With Mortgage |
| Housing Units | 5,223 | 12,831 |
| Median Property Value | $323,200 | $362,400 |
| Median Household Income | $96,431 | $5,960 |
| Monthly Housing Costs | $966 | $3,676 |
| Real Estate Taxes | $5,905 | $264 |
Property Value by Mortgage Status in Mansfield
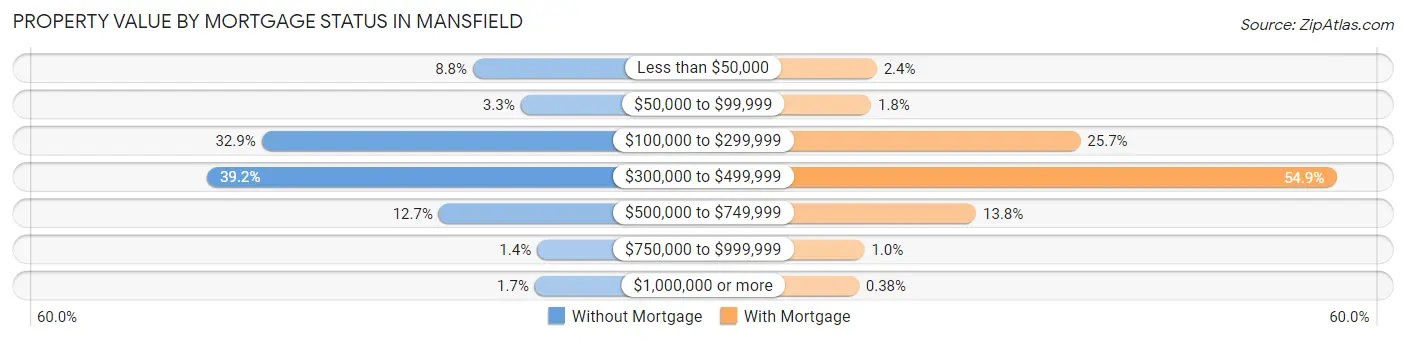
| Property Value | Without Mortgage | With Mortgage |
| Less than $50,000 | 458 (8.8%) | 311 (2.4%) |
| $50,000 to $99,999 | 174 (3.3%) | 227 (1.8%) |
| $100,000 to $299,999 | 1,720 (32.9%) | 3,297 (25.7%) |
| $300,000 to $499,999 | 2,045 (39.2%) | 7,048 (54.9%) |
| $500,000 to $749,999 | 662 (12.7%) | 1,768 (13.8%) |
| $750,000 to $999,999 | 75 (1.4%) | 131 (1.0%) |
| $1,000,000 or more | 89 (1.7%) | 49 (0.4%) |
| Total | 5,223 (100.0%) | 12,831 (100.0%) |
Household Income by Mortgage Status in Mansfield
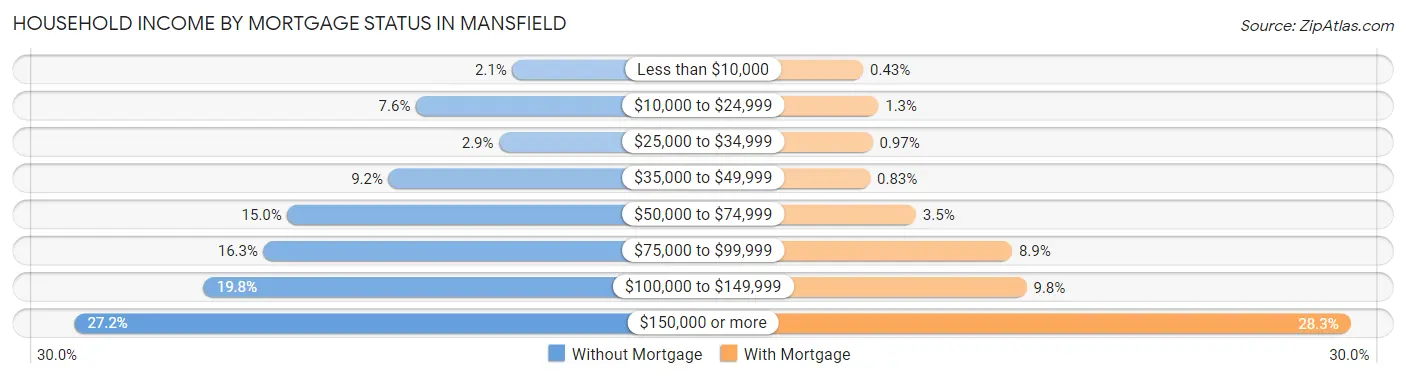
| Household Income | Without Mortgage | With Mortgage |
| Less than $10,000 | 110 (2.1%) | 55 (0.4%) |
| $10,000 to $24,999 | 398 (7.6%) | 167 (1.3%) |
| $25,000 to $34,999 | 150 (2.9%) | 125 (1.0%) |
| $35,000 to $49,999 | 480 (9.2%) | 106 (0.8%) |
| $50,000 to $74,999 | 782 (15.0%) | 443 (3.5%) |
| $75,000 to $99,999 | 853 (16.3%) | 1,147 (8.9%) |
| $100,000 to $149,999 | 1,032 (19.8%) | 1,254 (9.8%) |
| $150,000 or more | 1,418 (27.2%) | 3,629 (28.3%) |
| Total | 5,223 (100.0%) | 12,831 (100.0%) |
Property Value to Household Income Ratio in Mansfield
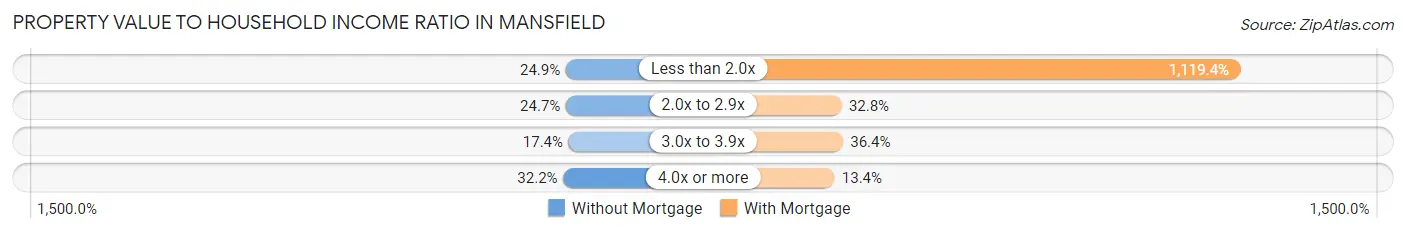
| Value-to-Income Ratio | Without Mortgage | With Mortgage |
| Less than 2.0x | 1,302 (24.9%) | 143,634 (1,119.4%) |
| 2.0x to 2.9x | 1,290 (24.7%) | 4,203 (32.8%) |
| 3.0x to 3.9x | 906 (17.3%) | 4,670 (36.4%) |
| 4.0x or more | 1,684 (32.2%) | 1,722 (13.4%) |
| Total | 5,223 (100.0%) | 12,831 (100.0%) |
Real Estate Taxes by Mortgage Status in Mansfield
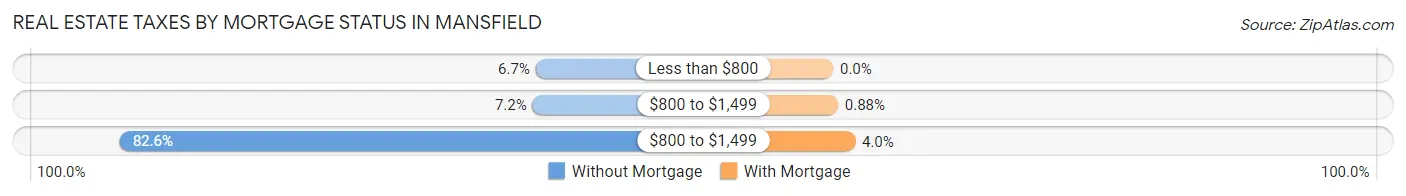
| Property Taxes | Without Mortgage | With Mortgage |
| Less than $800 | 348 (6.7%) | 0 (0.0%) |
| $800 to $1,499 | 377 (7.2%) | 113 (0.9%) |
| $800 to $1,499 | 4,315 (82.6%) | 514 (4.0%) |
| Total | 5,223 (100.0%) | 12,831 (100.0%) |
Health & Disability in Mansfield
Health Insurance Coverage by Age in Mansfield
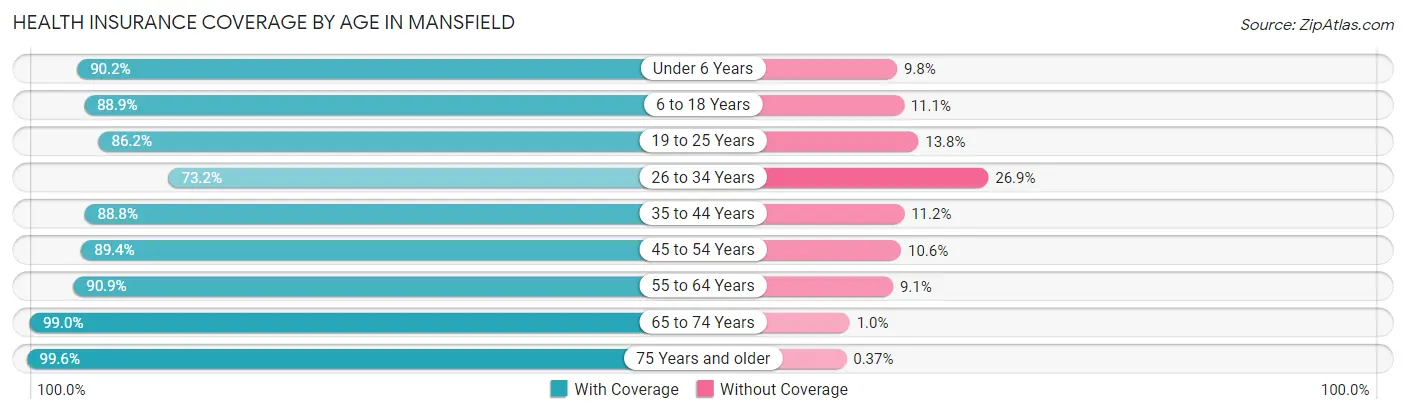
| Age Bracket | With Coverage | Without Coverage |
| Under 6 Years | 4,333 (90.2%) | 472 (9.8%) |
| 6 to 18 Years | 15,406 (88.9%) | 1,919 (11.1%) |
| 19 to 25 Years | 4,773 (86.2%) | 764 (13.8%) |
| 26 to 34 Years | 5,215 (73.2%) | 1,914 (26.9%) |
| 35 to 44 Years | 9,574 (88.8%) | 1,205 (11.2%) |
| 45 to 54 Years | 9,515 (89.4%) | 1,126 (10.6%) |
| 55 to 64 Years | 7,793 (90.9%) | 778 (9.1%) |
| 65 to 74 Years | 4,802 (99.0%) | 49 (1.0%) |
| 75 Years and older | 3,491 (99.6%) | 13 (0.4%) |
| Total | 64,902 (88.7%) | 8,240 (11.3%) |
Health Insurance Coverage by Citizenship Status in Mansfield
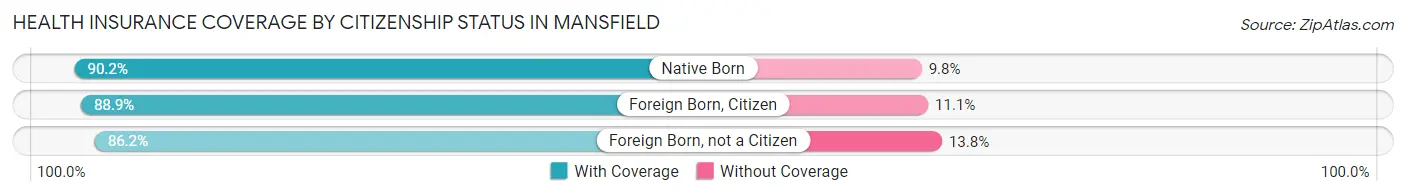
| Citizenship Status | With Coverage | Without Coverage |
| Native Born | 4,333 (90.2%) | 472 (9.8%) |
| Foreign Born, Citizen | 15,406 (88.9%) | 1,919 (11.1%) |
| Foreign Born, not a Citizen | 4,773 (86.2%) | 764 (13.8%) |
Health Insurance Coverage by Household Income in Mansfield
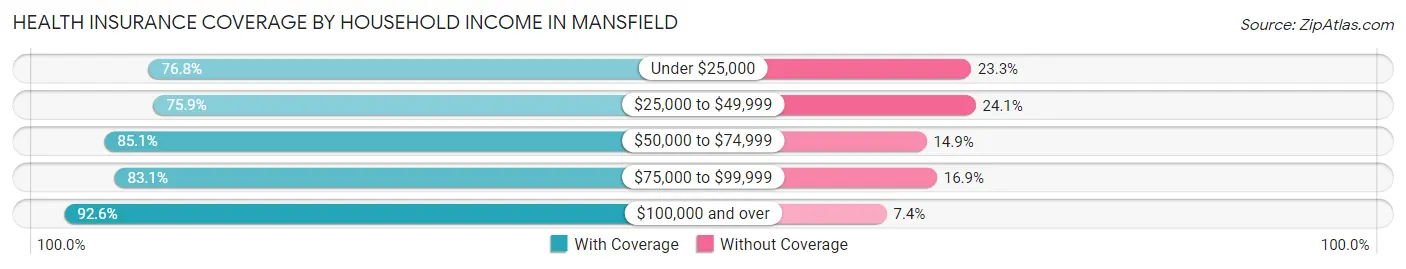
| Household Income | With Coverage | Without Coverage |
| Under $25,000 | 1,925 (76.7%) | 583 (23.3%) |
| $25,000 to $49,999 | 4,324 (75.9%) | 1,375 (24.1%) |
| $50,000 to $74,999 | 6,459 (85.1%) | 1,134 (14.9%) |
| $75,000 to $99,999 | 7,785 (83.1%) | 1,579 (16.9%) |
| $100,000 and over | 44,397 (92.6%) | 3,567 (7.4%) |
Public vs Private Health Insurance Coverage by Age in Mansfield
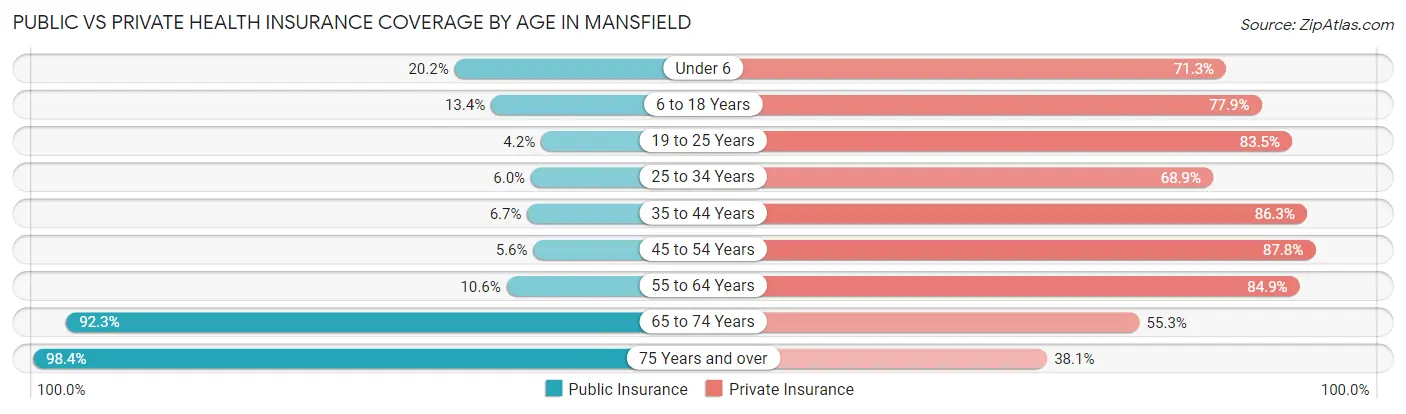
| Age Bracket | Public Insurance | Private Insurance |
| Under 6 | 971 (20.2%) | 3,426 (71.3%) |
| 6 to 18 Years | 2,326 (13.4%) | 13,487 (77.8%) |
| 19 to 25 Years | 230 (4.2%) | 4,625 (83.5%) |
| 25 to 34 Years | 429 (6.0%) | 4,910 (68.9%) |
| 35 to 44 Years | 721 (6.7%) | 9,303 (86.3%) |
| 45 to 54 Years | 593 (5.6%) | 9,346 (87.8%) |
| 55 to 64 Years | 905 (10.6%) | 7,279 (84.9%) |
| 65 to 74 Years | 4,476 (92.3%) | 2,682 (55.3%) |
| 75 Years and over | 3,449 (98.4%) | 1,336 (38.1%) |
| Total | 14,100 (19.3%) | 56,394 (77.1%) |
Disability Status by Sex by Age in Mansfield
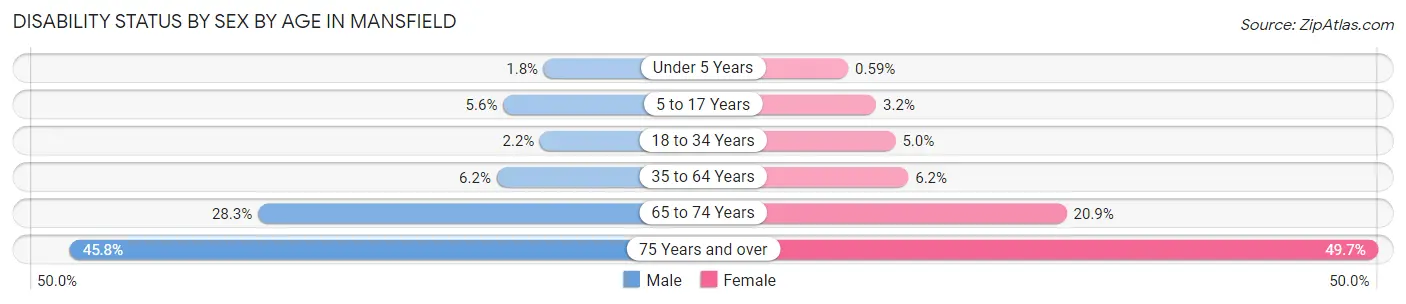
| Age Bracket | Male | Female |
| Under 5 Years | 34 (1.8%) | 11 (0.6%) |
| 5 to 17 Years | 456 (5.6%) | 276 (3.2%) |
| 18 to 34 Years | 160 (2.1%) | 338 (5.0%) |
| 35 to 64 Years | 868 (6.2%) | 983 (6.2%) |
| 65 to 74 Years | 659 (28.3%) | 527 (20.9%) |
| 75 Years and over | 737 (45.8%) | 942 (49.7%) |
Disability Class by Sex by Age in Mansfield
Disability Class: Hearing Difficulty
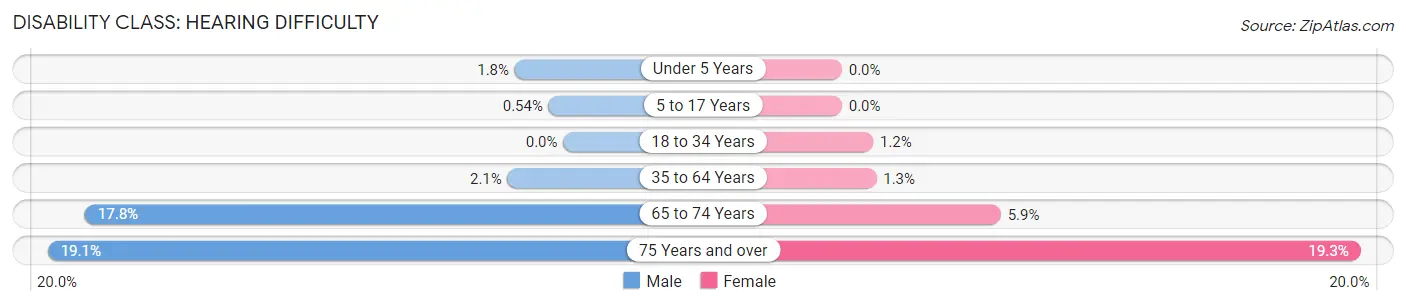
| Age Bracket | Male | Female |
| Under 5 Years | 34 (1.8%) | 0 (0.0%) |
| 5 to 17 Years | 44 (0.5%) | 0 (0.0%) |
| 18 to 34 Years | 0 (0.0%) | 79 (1.2%) |
| 35 to 64 Years | 291 (2.1%) | 204 (1.3%) |
| 65 to 74 Years | 413 (17.8%) | 149 (5.9%) |
| 75 Years and over | 308 (19.1%) | 365 (19.3%) |
Disability Class: Vision Difficulty
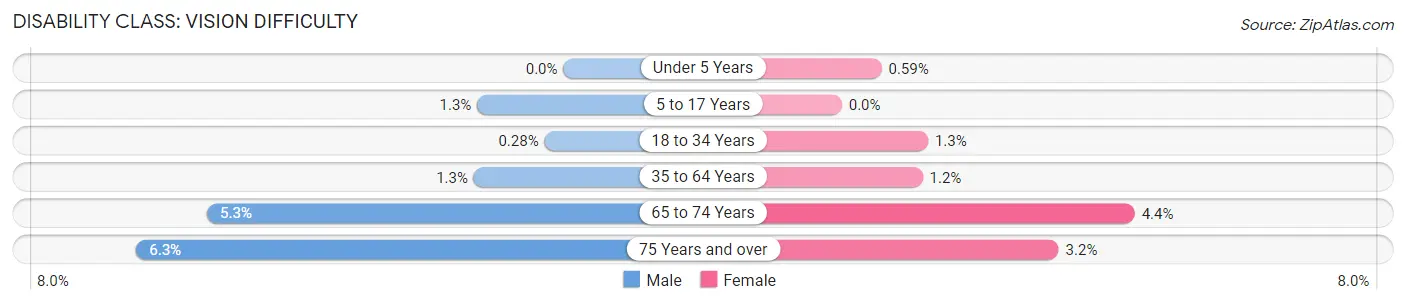
| Age Bracket | Male | Female |
| Under 5 Years | 0 (0.0%) | 11 (0.6%) |
| 5 to 17 Years | 105 (1.3%) | 0 (0.0%) |
| 18 to 34 Years | 21 (0.3%) | 87 (1.3%) |
| 35 to 64 Years | 187 (1.3%) | 192 (1.2%) |
| 65 to 74 Years | 123 (5.3%) | 110 (4.3%) |
| 75 Years and over | 102 (6.3%) | 61 (3.2%) |
Disability Class: Cognitive Difficulty
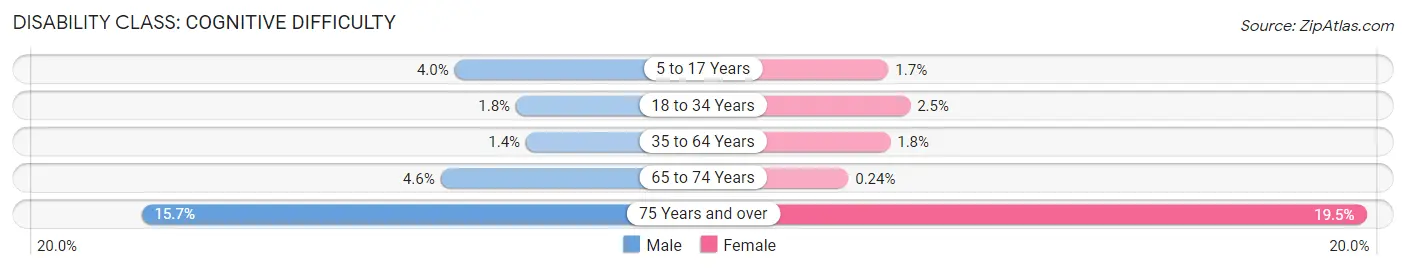
| Age Bracket | Male | Female |
| 5 to 17 Years | 330 (4.0%) | 150 (1.7%) |
| 18 to 34 Years | 131 (1.8%) | 172 (2.5%) |
| 35 to 64 Years | 196 (1.4%) | 287 (1.8%) |
| 65 to 74 Years | 106 (4.6%) | 6 (0.2%) |
| 75 Years and over | 252 (15.7%) | 369 (19.5%) |
Disability Class: Ambulatory Difficulty
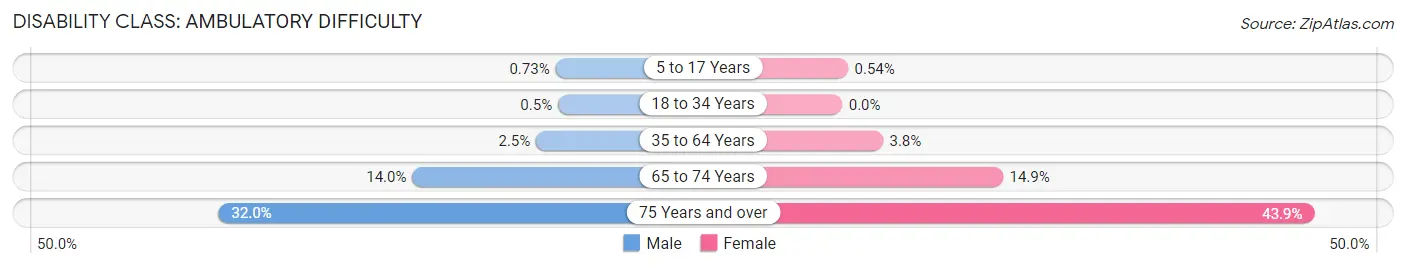
| Age Bracket | Male | Female |
| 5 to 17 Years | 60 (0.7%) | 47 (0.5%) |
| 18 to 34 Years | 37 (0.5%) | 0 (0.0%) |
| 35 to 64 Years | 356 (2.5%) | 602 (3.8%) |
| 65 to 74 Years | 326 (14.0%) | 377 (14.9%) |
| 75 Years and over | 515 (32.0%) | 831 (43.9%) |
Disability Class: Self-Care Difficulty
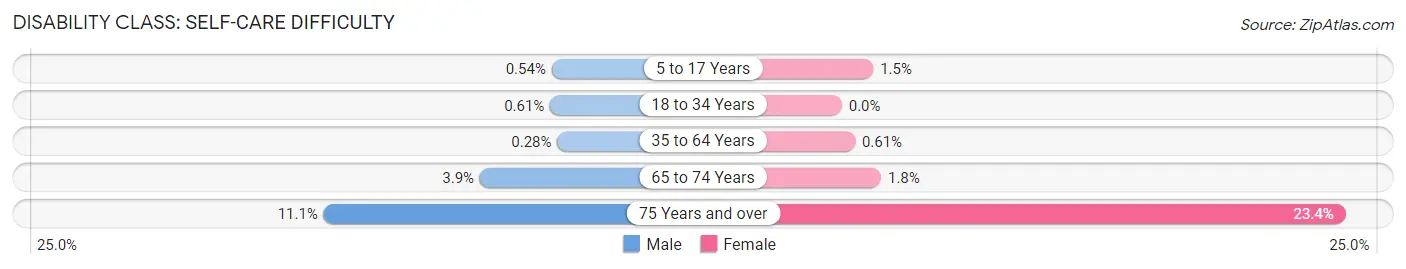
| Age Bracket | Male | Female |
| 5 to 17 Years | 44 (0.5%) | 126 (1.5%) |
| 18 to 34 Years | 45 (0.6%) | 0 (0.0%) |
| 35 to 64 Years | 39 (0.3%) | 98 (0.6%) |
| 65 to 74 Years | 90 (3.9%) | 46 (1.8%) |
| 75 Years and over | 179 (11.1%) | 443 (23.4%) |
Technology Access in Mansfield
Computing Device Access in Mansfield
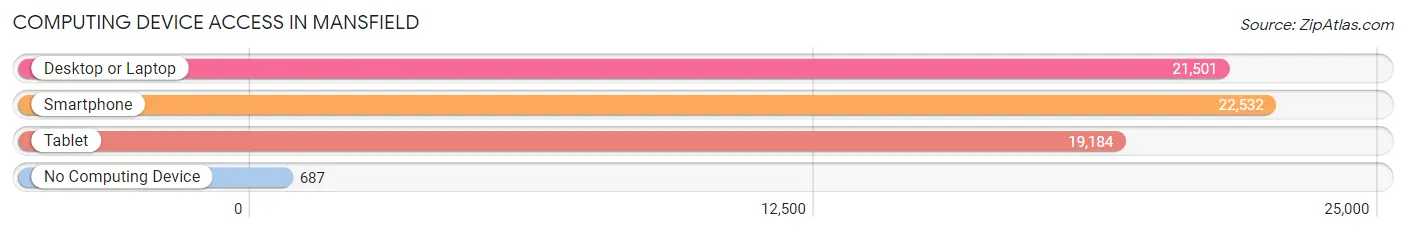
| Device Type | # Households | % Households |
| Desktop or Laptop | 21,501 | 89.9% |
| Smartphone | 22,532 | 94.3% |
| Tablet | 19,184 | 80.2% |
| No Computing Device | 687 | 2.9% |
| Total | 23,905 | 100.0% |
Internet Access in Mansfield
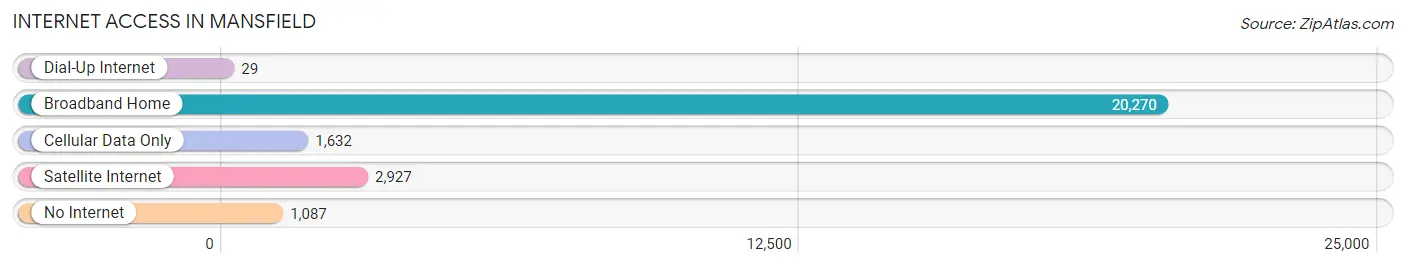
| Internet Type | # Households | % Households |
| Dial-Up Internet | 29 | 0.1% |
| Broadband Home | 20,270 | 84.8% |
| Cellular Data Only | 1,632 | 6.8% |
| Satellite Internet | 2,927 | 12.2% |
| No Internet | 1,087 | 4.5% |
| Total | 23,905 | 100.0% |
Mansfield Summary
Mansfield, Texas is a city located in Tarrant County, Texas, United States. It is part of the Dallas-Fort Worth-Arlington metropolitan area. The city had a population of 57,029 as of the 2010 census, making it the largest city in Tarrant County.
History
Mansfield was founded in 1856 by William and Mary Mansfield, who were among the first settlers in the area. The city was named after the Mansfields, who were originally from England. The city was incorporated in 1909 and has since grown to become one of the largest cities in Tarrant County.
Mansfield has a rich history of being a center for agriculture and ranching. In the late 1800s, the city was home to several large cotton plantations. The city was also home to several large dairy farms, which provided milk and other dairy products to the surrounding area.
In the early 1900s, the city began to experience a population boom as the railroad industry began to expand in the area. The city was also home to several large manufacturing plants, including a cotton mill and a paper mill.
Geography
Mansfield is located in Tarrant County, Texas, United States. It is part of the Dallas-Fort Worth-Arlington metropolitan area. The city is situated on the western edge of the Dallas-Fort Worth Metroplex, approximately 20 miles south of downtown Dallas.
The city has a total area of 28.2 square miles, of which 28.1 square miles is land and 0.1 square miles is water. The city is located in the Blackland Prairie region of Texas, which is characterized by rolling hills and flat plains.
Economy
Mansfield has a diverse economy that is driven by a variety of industries. The city is home to several large manufacturing plants, including a cotton mill and a paper mill. The city is also home to several large retail stores, including Walmart, Target, and Home Depot.
The city is also home to several large healthcare facilities, including Texas Health Harris Methodist Hospital and Baylor Scott & White Medical Center. The city is also home to several large educational institutions, including the University of Texas at Arlington and Tarrant County College.
Demographics
As of the 2010 census, the city had a population of 57,029. The racial makeup of the city was 75.3% White, 11.3% African American, 0.7% Native American, 3.2% Asian, 0.1% Pacific Islander, 6.2% from other races, and 3.2% from two or more races. Hispanic or Latino of any race were 18.3% of the population.
The median income for a household in the city was $50,945, and the median income for a family was $60,945. The per capita income for the city was $25,945. About 8.3% of families and 10.7% of the population were below the poverty line, including 15.2% of those under age 18 and 6.7% of those age 65 or over.
Conclusion
Mansfield, Texas is a city located in Tarrant County, Texas, United States. It is part of the Dallas-Fort Worth-Arlington metropolitan area. The city had a population of 57,029 as of the 2010 census, making it the largest city in Tarrant County. Mansfield has a rich history of being a center for agriculture and ranching, and is now home to several large manufacturing plants, retail stores, healthcare facilities, and educational institutions. The city has a diverse population, with a median household income of $50,945 and a per capita income of $25,945.
Common Questions
What is Per Capita Income in Mansfield?
Per Capita income in Mansfield is $44,700.
What is the Median Family Income in Mansfield?
Median Family Income in Mansfield is $128,746.
What is the Median Household income in Mansfield?
Median Household Income in Mansfield is $112,465.
What is Income or Wage Gap in Mansfield?
Income or Wage Gap in Mansfield is 20.7%.
Women in Mansfield earn 79.3 cents for every dollar earned by a man.
What is Family Income Deficit in Mansfield?
Family Income Deficit in Mansfield is $8,154.
Families that are below poverty line in Mansfield earn $8,154 less on average than the poverty threshold level.
What is Inequality or Gini Index in Mansfield?
Inequality or Gini Index in Mansfield is 0.38.
What is the Total Population of Mansfield?
Total Population of Mansfield is 73,680.
What is the Total Male Population of Mansfield?
Total Male Population of Mansfield is 35,799.
What is the Total Female Population of Mansfield?
Total Female Population of Mansfield is 37,881.
What is the Ratio of Males per 100 Females in Mansfield?
There are 94.50 Males per 100 Females in Mansfield.
What is the Ratio of Females per 100 Males in Mansfield?
There are 105.82 Females per 100 Males in Mansfield.
What is the Median Population Age in Mansfield?
Median Population Age in Mansfield is 37.3 Years.
What is the Average Family Size in Mansfield
Average Family Size in Mansfield is 3.5 People.
What is the Average Household Size in Mansfield
Average Household Size in Mansfield is 3.1 People.
How Large is the Labor Force in Mansfield?
There are 39,816 People in the Labor Forcein in Mansfield.
What is the Percentage of People in the Labor Force in Mansfield?
71.2% of People are in the Labor Force in Mansfield.
What is the Unemployment Rate in Mansfield?
Unemployment Rate in Mansfield is 3.7%.