Bunker Hill Village, TX Map & Demographics
Bunker Hill Village Map
Bunker Hill Village Overview
$132,835
PER CAPITA INCOME
$250,001
AVG FAMILY INCOME
$250,001
AVG HOUSEHOLD INCOME
83.6%
WAGE / INCOME GAP [ % ]
16.4¢/ $1
WAGE / INCOME GAP [ $ ]
$19,527
FAMILY INCOME DEFICIT
0.44
INEQUALITY / GINI INDEX
3,820
TOTAL POPULATION
1,907
MALE POPULATION
1,913
FEMALE POPULATION
99.69
MALES / 100 FEMALES
100.31
FEMALES / 100 MALES
42.2
MEDIAN AGE
3.5
AVG FAMILY SIZE
3.3
AVG HOUSEHOLD SIZE
1,473
LABOR FORCE [ PEOPLE ]
52.7%
PERCENT IN LABOR FORCE
3.6%
UNEMPLOYMENT RATE
Income in Bunker Hill Village
Income Overview in Bunker Hill Village
Per Capita Income in Bunker Hill Village is $132,835, while median incomes of families and households are $250,001 and $250,001 respectively.
| Characteristic | Number | Measure |
| Per Capita Income | 3,820 | $132,835 |
| Median Family Income | 1,072 | $250,001 |
| Mean Family Income | 1,072 | $449,924 |
| Median Household Income | 1,159 | $250,001 |
| Mean Household Income | 1,159 | $435,776 |
| Income Deficit | 1,072 | $19,527 |
| Wage / Income Gap (%) | 3,820 | 83.58% |
| Wage / Income Gap ($) | 3,820 | 16.42¢ per $1 |
| Gini / Inequality Index | 3,820 | 0.44 |
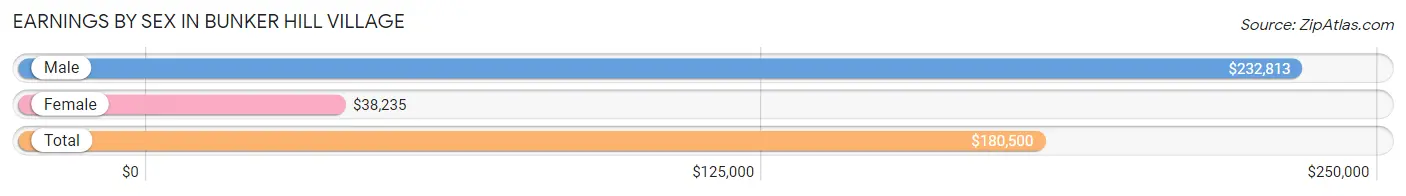
Earnings by Sex in Bunker Hill Village
Average Earnings in Bunker Hill Village are $180,500, $232,813 for men and $38,235 for women, a difference of 83.6%.
| Sex | Number | Average Earnings |
| Male | 1,074 (67.0%) | $232,813 |
| Female | 530 (33.0%) | $38,235 |
| Total | 1,604 (100.0%) | $180,500 |
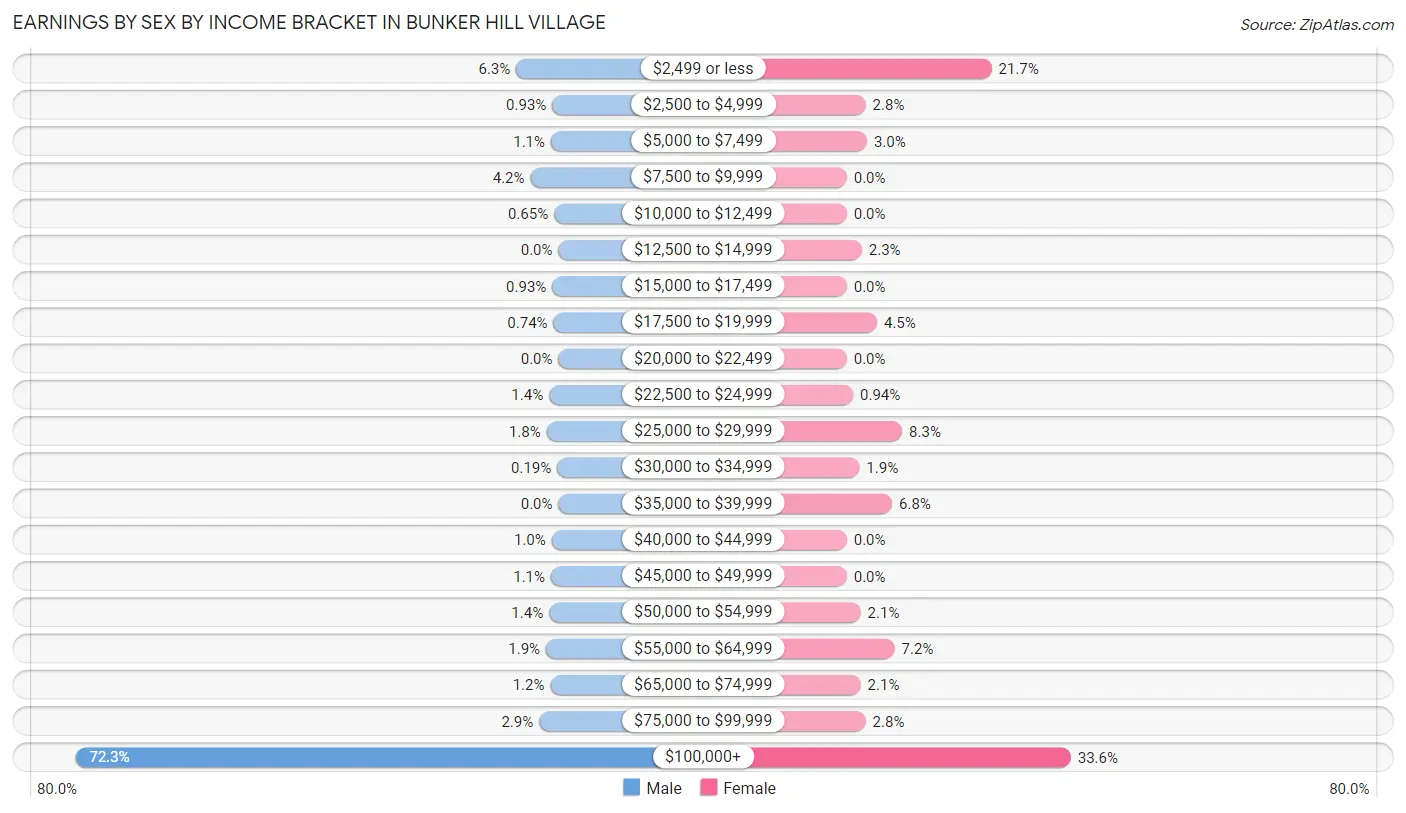
Earnings by Sex by Income Bracket in Bunker Hill Village
The most common earnings brackets in Bunker Hill Village are $100,000+ for men (776 | 72.3%) and $100,000+ for women (178 | 33.6%).
| Income | Male | Female |
| $2,499 or less | 68 (6.3%) | 115 (21.7%) |
| $2,500 to $4,999 | 10 (0.9%) | 15 (2.8%) |
| $5,000 to $7,499 | 12 (1.1%) | 16 (3.0%) |
| $7,500 to $9,999 | 45 (4.2%) | 0 (0.0%) |
| $10,000 to $12,499 | 7 (0.6%) | 0 (0.0%) |
| $12,500 to $14,999 | 0 (0.0%) | 12 (2.3%) |
| $15,000 to $17,499 | 10 (0.9%) | 0 (0.0%) |
| $17,500 to $19,999 | 8 (0.7%) | 24 (4.5%) |
| $20,000 to $22,499 | 0 (0.0%) | 0 (0.0%) |
| $22,500 to $24,999 | 15 (1.4%) | 5 (0.9%) |
| $25,000 to $29,999 | 19 (1.8%) | 44 (8.3%) |
| $30,000 to $34,999 | 2 (0.2%) | 10 (1.9%) |
| $35,000 to $39,999 | 0 (0.0%) | 36 (6.8%) |
| $40,000 to $44,999 | 11 (1.0%) | 0 (0.0%) |
| $45,000 to $49,999 | 12 (1.1%) | 0 (0.0%) |
| $50,000 to $54,999 | 15 (1.4%) | 11 (2.1%) |
| $55,000 to $64,999 | 20 (1.9%) | 38 (7.2%) |
| $65,000 to $74,999 | 13 (1.2%) | 11 (2.1%) |
| $75,000 to $99,999 | 31 (2.9%) | 15 (2.8%) |
| $100,000+ | 776 (72.3%) | 178 (33.6%) |
| Total | 1,074 (100.0%) | 530 (100.0%) |
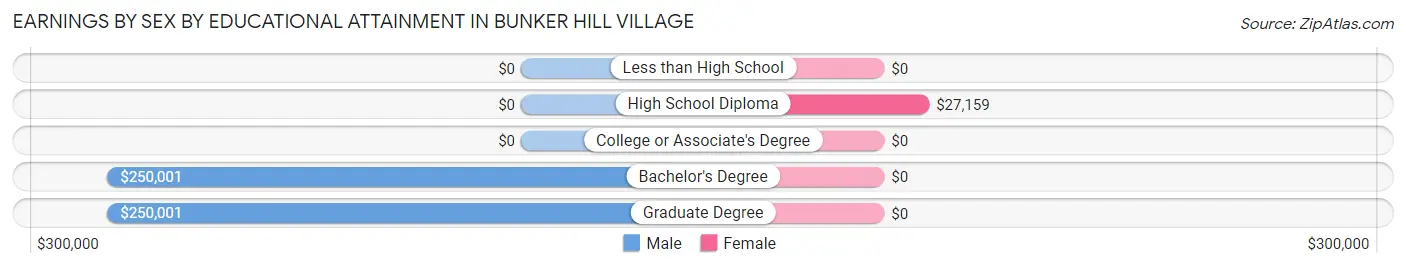
Earnings by Sex by Educational Attainment in Bunker Hill Village
Average earnings in Bunker Hill Village are $250,001 for men and $59,600 for women, a difference of 76.2%. Men with an educational attainment of bachelor's degree enjoy the highest average annual earnings of $250,001, while those with bachelor's degree education earn the least with $250,001. Women with an educational attainment of high school diploma earn the most with the average annual earnings of $27,159, while those with high school diploma education have the smallest earnings of $27,159.
| Educational Attainment | Male Income | Female Income |
| Less than High School | - | - |
| High School Diploma | - | - |
| College or Associate's Degree | - | - |
| Bachelor's Degree | $250,001 | $0 |
| Graduate Degree | $250,001 | $0 |
| Total | $250,001 | $59,600 |
Family Income in Bunker Hill Village
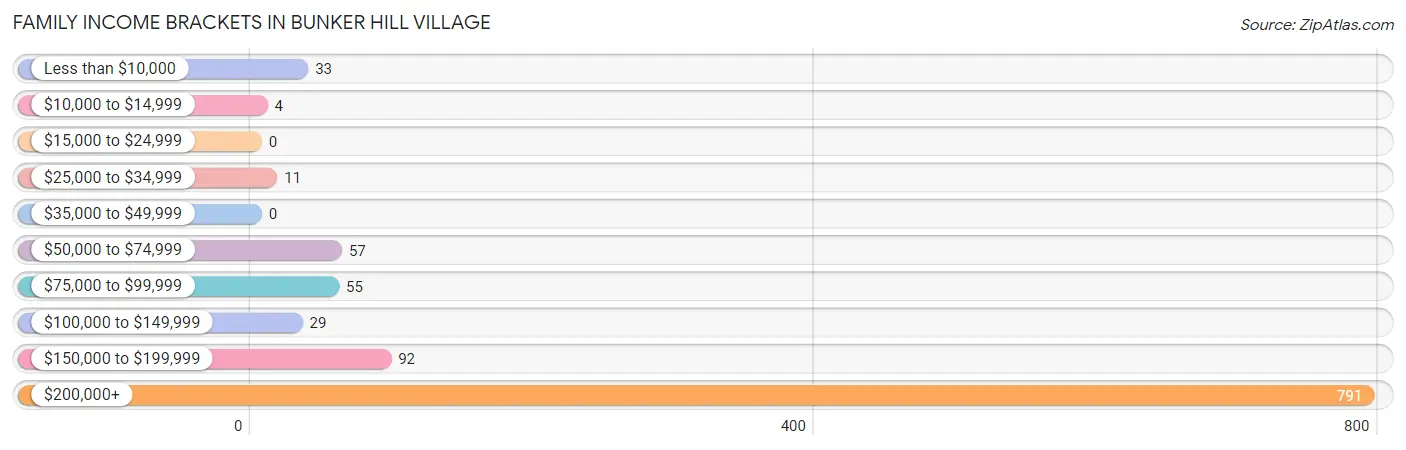
Family Income Brackets in Bunker Hill Village
According to the Bunker Hill Village family income data, there are 791 families falling into the $200,000+ income range, which is the most common income bracket and makes up 73.8% of all families.
| Income Bracket | # Families | % Families |
| Less than $10,000 | 33 | 3.1% |
| $10,000 to $14,999 | 4 | 0.4% |
| $15,000 to $24,999 | 0 | 0.0% |
| $25,000 to $34,999 | 11 | 1.0% |
| $35,000 to $49,999 | 0 | 0.0% |
| $50,000 to $74,999 | 57 | 5.3% |
| $75,000 to $99,999 | 55 | 5.1% |
| $100,000 to $149,999 | 29 | 2.7% |
| $150,000 to $199,999 | 92 | 8.6% |
| $200,000+ | 791 | 73.8% |
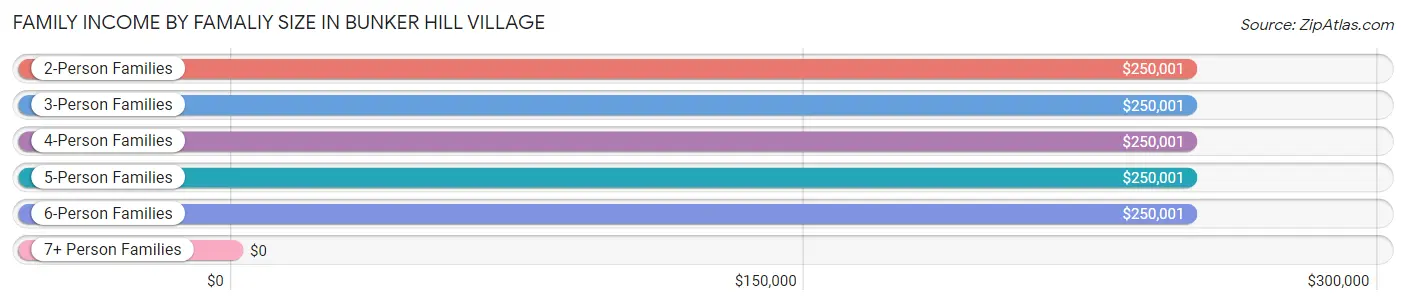
Family Income by Famaliy Size in Bunker Hill Village
2-person families (400 | 37.3%) account for the highest median family income in Bunker Hill Village with $250,001 per family, while 2-person families (400 | 37.3%) have the highest median income of $125,000 per family member.
| Income Bracket | # Families | Median Income |
| 2-Person Families | 400 (37.3%) | $250,001 |
| 3-Person Families | 195 (18.2%) | $250,001 |
| 4-Person Families | 220 (20.5%) | $250,001 |
| 5-Person Families | 206 (19.2%) | $250,001 |
| 6-Person Families | 28 (2.6%) | $250,001 |
| 7+ Person Families | 23 (2.1%) | $0 |
| Total | 1,072 (100.0%) | $250,001 |
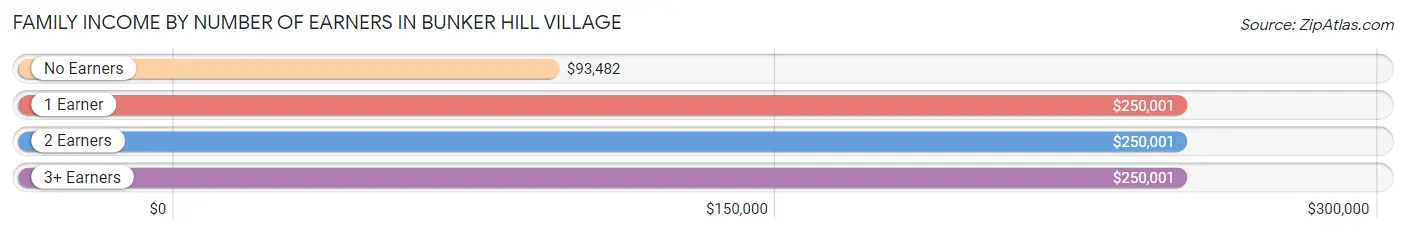
Family Income by Number of Earners in Bunker Hill Village
The median family income in Bunker Hill Village is $250,001, with families comprising 1 earner (497) having the highest median family income of $250,001, while families with no earners (108) have the lowest median family income of $93,482, accounting for 46.4% and 10.1% of families, respectively.
| Number of Earners | # Families | Median Income |
| No Earners | 108 (10.1%) | $93,482 |
| 1 Earner | 497 (46.4%) | $250,001 |
| 2 Earners | 377 (35.2%) | $250,001 |
| 3+ Earners | 90 (8.4%) | $250,001 |
| Total | 1,072 (100.0%) | $250,001 |
Household Income in Bunker Hill Village
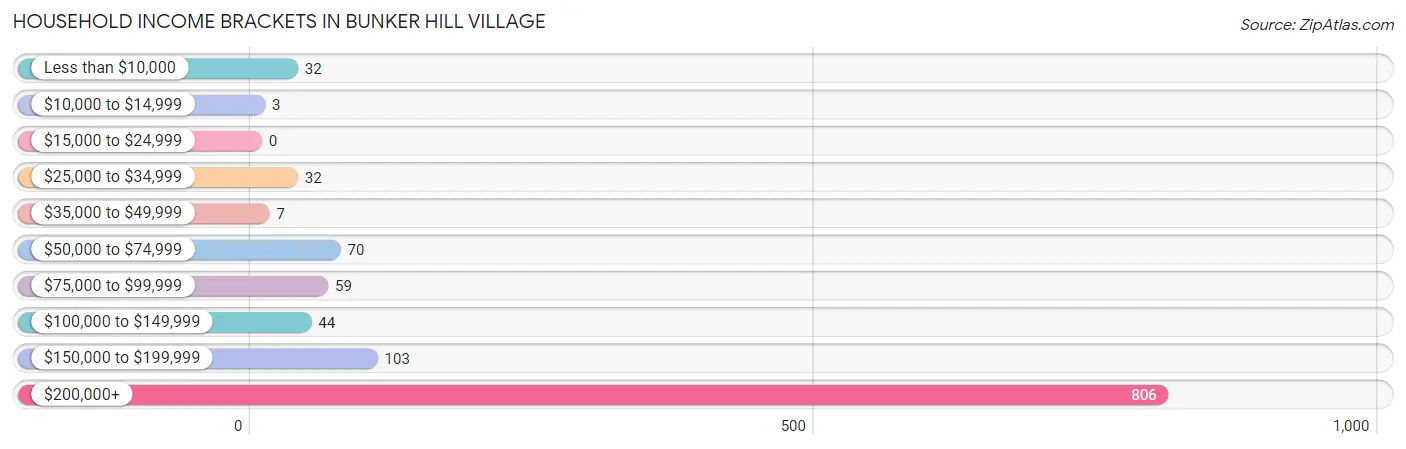
Household Income Brackets in Bunker Hill Village
With 806 households falling in the category, the $200,000+ income range is the most frequent in Bunker Hill Village, accounting for 69.5% of all households.
| Income Bracket | # Households | % Households |
| Less than $10,000 | 32 | 2.8% |
| $10,000 to $14,999 | 3 | 0.3% |
| $15,000 to $24,999 | 0 | 0.0% |
| $25,000 to $34,999 | 32 | 2.8% |
| $35,000 to $49,999 | 7 | 0.6% |
| $50,000 to $74,999 | 70 | 6.0% |
| $75,000 to $99,999 | 59 | 5.1% |
| $100,000 to $149,999 | 44 | 3.8% |
| $150,000 to $199,999 | 103 | 8.9% |
| $200,000+ | 806 | 69.5% |
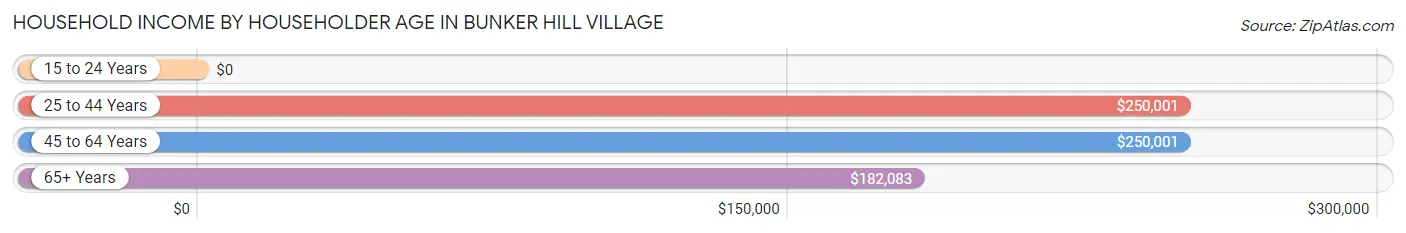
Household Income by Householder Age in Bunker Hill Village
The median household income in Bunker Hill Village is $250,001, with the highest median household income of $250,001 found in the 25 to 44 years age bracket for the primary householder. A total of 261 households (22.5%) fall into this category.
| Income Bracket | # Households | Median Income |
| 15 to 24 Years | 0 (0.0%) | $0 |
| 25 to 44 Years | 261 (22.5%) | $250,001 |
| 45 to 64 Years | 622 (53.7%) | $250,001 |
| 65+ Years | 276 (23.8%) | $182,083 |
| Total | 1,159 (100.0%) | $250,001 |
Poverty in Bunker Hill Village
Income Below Poverty by Sex and Age in Bunker Hill Village
With 3.4% poverty level for males and 4.2% for females among the residents of Bunker Hill Village, 55 to 64 year old males and 18 to 24 year old females are the most vulnerable to poverty, with 35 males (10.6%) and 39 females (22.7%) in their respective age groups living below the poverty level.
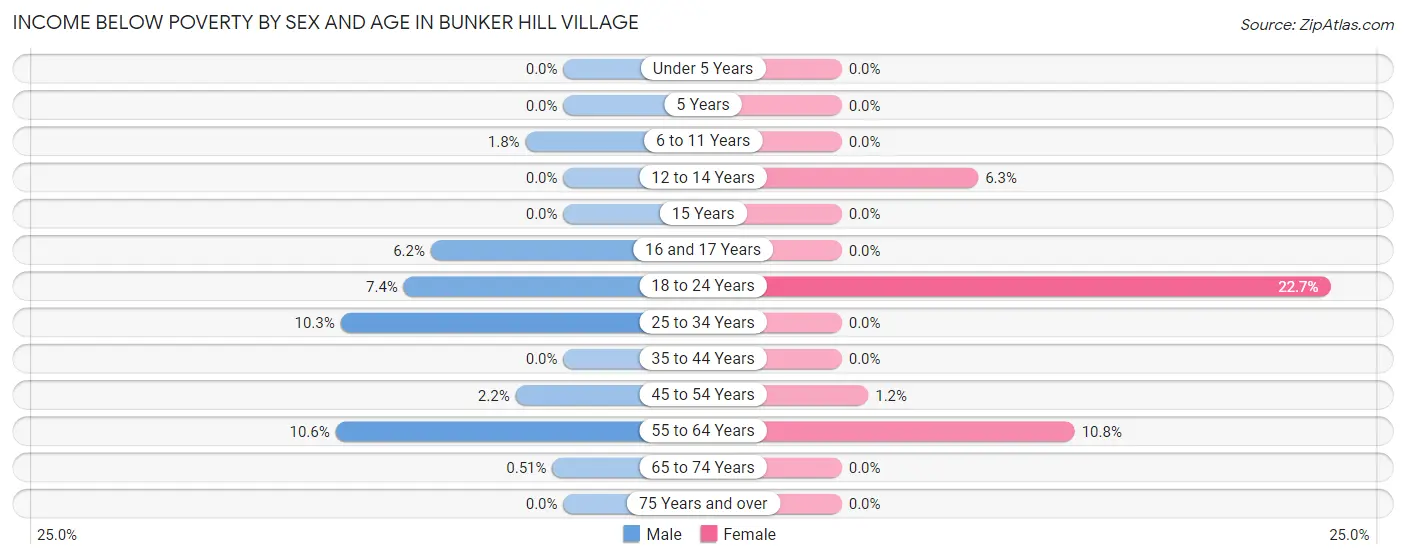
| Age Bracket | Male | Female |
| Under 5 Years | 0 (0.0%) | 0 (0.0%) |
| 5 Years | 0 (0.0%) | 0 (0.0%) |
| 6 to 11 Years | 5 (1.8%) | 0 (0.0%) |
| 12 to 14 Years | 0 (0.0%) | 5 (6.3%) |
| 15 Years | 0 (0.0%) | 0 (0.0%) |
| 16 and 17 Years | 4 (6.1%) | 0 (0.0%) |
| 18 to 24 Years | 10 (7.4%) | 39 (22.7%) |
| 25 to 34 Years | 3 (10.3%) | 0 (0.0%) |
| 35 to 44 Years | 0 (0.0%) | 0 (0.0%) |
| 45 to 54 Years | 6 (2.2%) | 4 (1.2%) |
| 55 to 64 Years | 35 (10.6%) | 32 (10.8%) |
| 65 to 74 Years | 1 (0.5%) | 0 (0.0%) |
| 75 Years and over | 0 (0.0%) | 0 (0.0%) |
| Total | 64 (3.4%) | 80 (4.2%) |
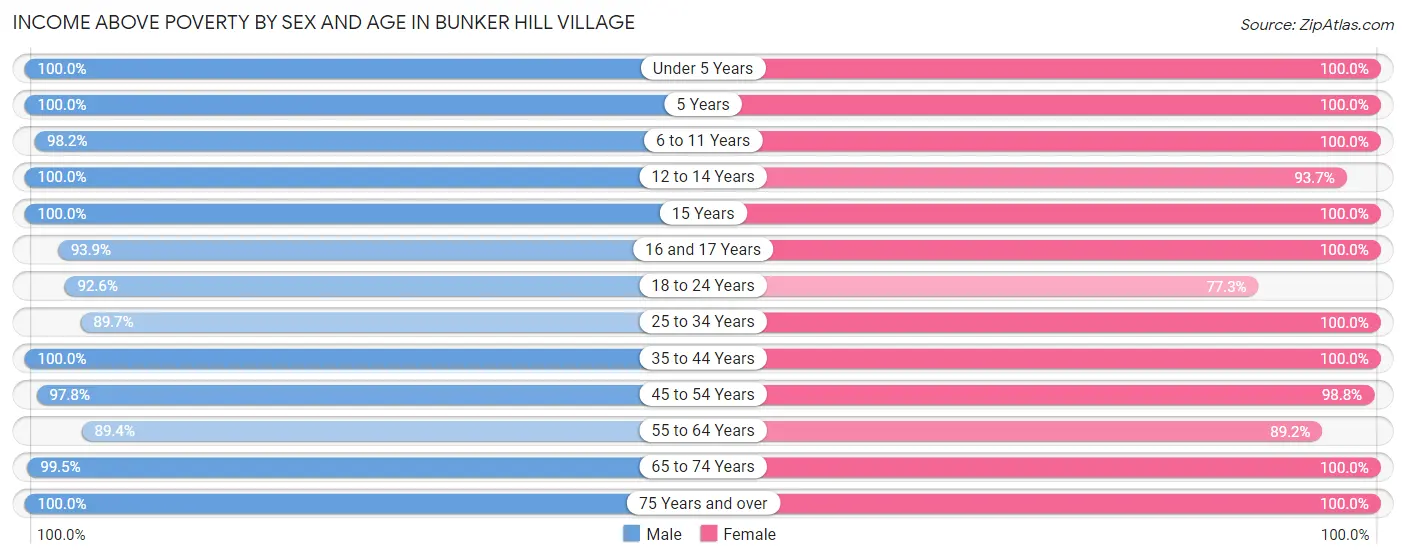
Income Above Poverty by Sex and Age in Bunker Hill Village
According to the poverty statistics in Bunker Hill Village, males aged under 5 years and females aged under 5 years are the age groups that are most secure financially, with 100.0% of males and 100.0% of females in these age groups living above the poverty line.
| Age Bracket | Male | Female |
| Under 5 Years | 36 (100.0%) | 55 (100.0%) |
| 5 Years | 29 (100.0%) | 43 (100.0%) |
| 6 to 11 Years | 279 (98.2%) | 259 (100.0%) |
| 12 to 14 Years | 148 (100.0%) | 74 (93.7%) |
| 15 Years | 49 (100.0%) | 43 (100.0%) |
| 16 and 17 Years | 61 (93.9%) | 170 (100.0%) |
| 18 to 24 Years | 125 (92.6%) | 133 (77.3%) |
| 25 to 34 Years | 26 (89.7%) | 29 (100.0%) |
| 35 to 44 Years | 243 (100.0%) | 259 (100.0%) |
| 45 to 54 Years | 264 (97.8%) | 320 (98.8%) |
| 55 to 64 Years | 296 (89.4%) | 264 (89.2%) |
| 65 to 74 Years | 194 (99.5%) | 97 (100.0%) |
| 75 Years and over | 93 (100.0%) | 87 (100.0%) |
| Total | 1,843 (96.6%) | 1,833 (95.8%) |
Income Below Poverty Among Married-Couple Families in Bunker Hill Village
The poverty statistics for married-couple families in Bunker Hill Village show that 3.7% or 37 of the total 990 families live below the poverty line. Families with no children have the highest poverty rate of 6.7%, comprising of 33 families. On the other hand, families with 1 or 2 children have the lowest poverty rate of 0.0%, which includes 0 families.
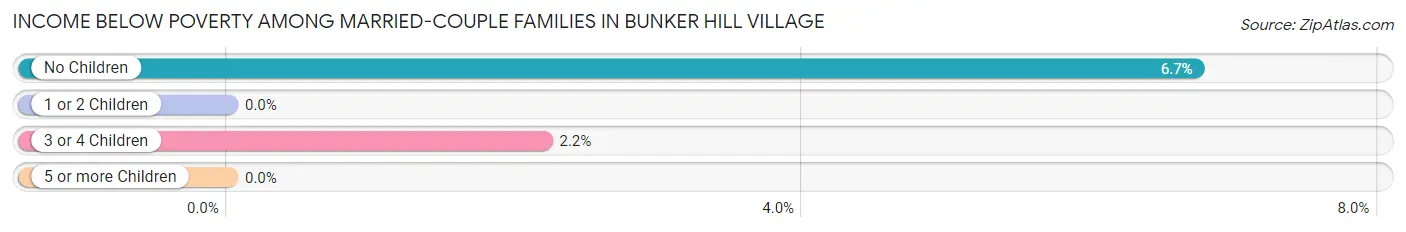
| Children | Above Poverty | Below Poverty |
| No Children | 457 (93.3%) | 33 (6.7%) |
| 1 or 2 Children | 317 (100.0%) | 0 (0.0%) |
| 3 or 4 Children | 179 (97.8%) | 4 (2.2%) |
| 5 or more Children | 0 (0.0%) | 0 (0.0%) |
| Total | 953 (96.3%) | 37 (3.7%) |
Income Below Poverty Among Single-Parent Households in Bunker Hill Village
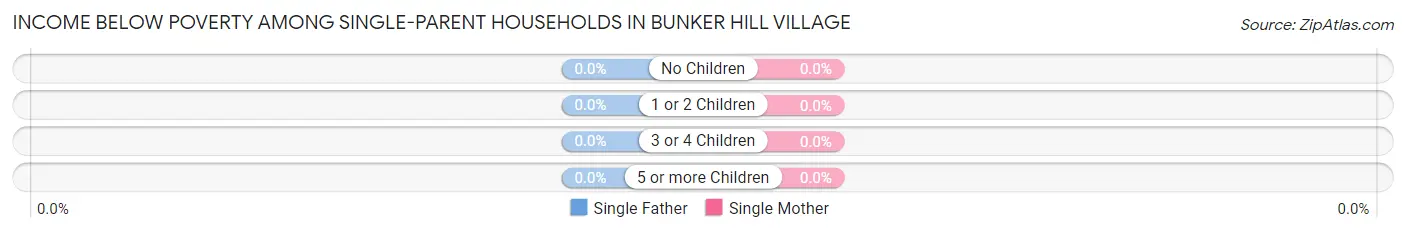
| Children | Single Father | Single Mother |
| No Children | 0 (0.0%) | 0 (0.0%) |
| 1 or 2 Children | 0 (0.0%) | 0 (0.0%) |
| 3 or 4 Children | 0 (0.0%) | 0 (0.0%) |
| 5 or more Children | 0 (0.0%) | 0 (0.0%) |
| Total | 0 (0.0%) | 0 (0.0%) |
Income Below Poverty Among Married-Couple vs Single-Parent Households in Bunker Hill Village
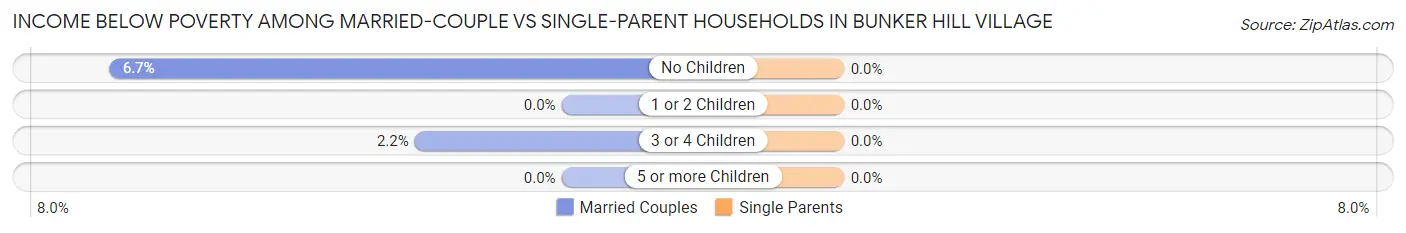
| Children | Married-Couple Families | Single-Parent Households |
| No Children | 33 (6.7%) | 0 (0.0%) |
| 1 or 2 Children | 0 (0.0%) | 0 (0.0%) |
| 3 or 4 Children | 4 (2.2%) | 0 (0.0%) |
| 5 or more Children | 0 (0.0%) | 0 (0.0%) |
| Total | 37 (3.7%) | 0 (0.0%) |
Race in Bunker Hill Village
The most populous races in Bunker Hill Village are White / Caucasian (3,093 | 81.0%), Asian (394 | 10.3%), and Two or more Races (310 | 8.1%).
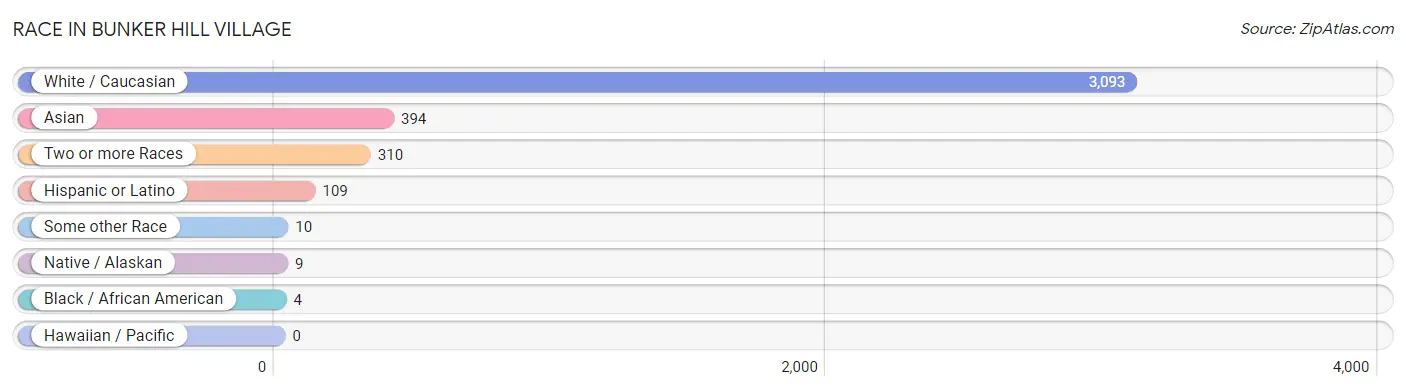
| Race | # Population | % Population |
| Asian | 394 | 10.3% |
| Black / African American | 4 | 0.1% |
| Hawaiian / Pacific | 0 | 0.0% |
| Hispanic or Latino | 109 | 2.9% |
| Native / Alaskan | 9 | 0.2% |
| White / Caucasian | 3,093 | 81.0% |
| Two or more Races | 310 | 8.1% |
| Some other Race | 10 | 0.3% |
| Total | 3,820 | 100.0% |
Ancestry in Bunker Hill Village
The most populous ancestries reported in Bunker Hill Village are English (768 | 20.1%), German (458 | 12.0%), Scottish (362 | 9.5%), Dutch (287 | 7.5%), and American (240 | 6.3%), together accounting for 55.4% of all Bunker Hill Village residents.
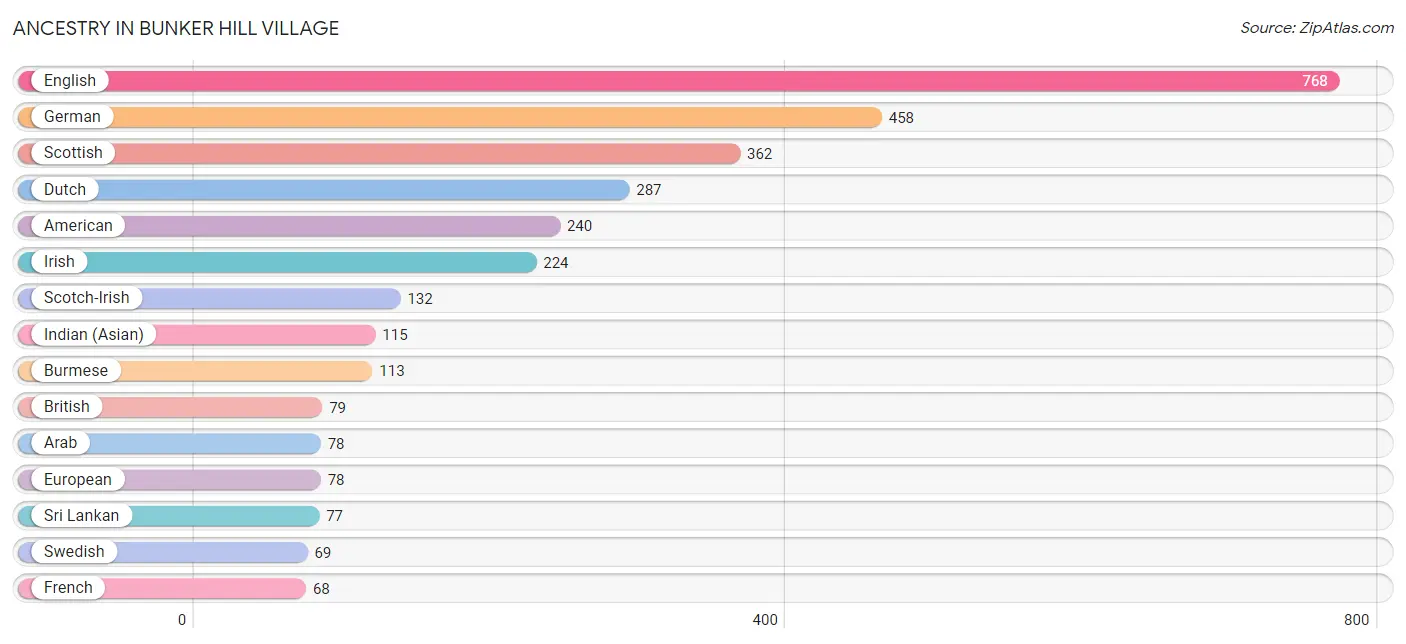
| Ancestry | # Population | % Population |
| American | 240 | 6.3% |
| Arab | 78 | 2.0% |
| British | 79 | 2.1% |
| Burmese | 113 | 3.0% |
| Cajun | 22 | 0.6% |
| Canadian | 17 | 0.4% |
| Cuban | 18 | 0.5% |
| Czechoslovakian | 10 | 0.3% |
| Danish | 10 | 0.3% |
| Dutch | 287 | 7.5% |
| Eastern European | 14 | 0.4% |
| English | 768 | 20.1% |
| European | 78 | 2.0% |
| Filipino | 12 | 0.3% |
| French | 68 | 1.8% |
| German | 458 | 12.0% |
| Houma | 9 | 0.2% |
| Indian (Asian) | 115 | 3.0% |
| Iranian | 52 | 1.4% |
| Irish | 224 | 5.9% |
| Italian | 64 | 1.7% |
| Korean | 16 | 0.4% |
| Lebanese | 27 | 0.7% |
| Lithuanian | 21 | 0.5% |
| Mexican | 44 | 1.1% |
| Northern European | 25 | 0.6% |
| Norwegian | 10 | 0.3% |
| Pakistani | 55 | 1.4% |
| Peruvian | 24 | 0.6% |
| Polish | 50 | 1.3% |
| Puerto Rican | 23 | 0.6% |
| Russian | 55 | 1.4% |
| Scandinavian | 6 | 0.2% |
| Scotch-Irish | 132 | 3.5% |
| Scottish | 362 | 9.5% |
| South American | 24 | 0.6% |
| Sri Lankan | 77 | 2.0% |
| Swedish | 69 | 1.8% |
| Thai | 18 | 0.5% | View All 39 Rows |
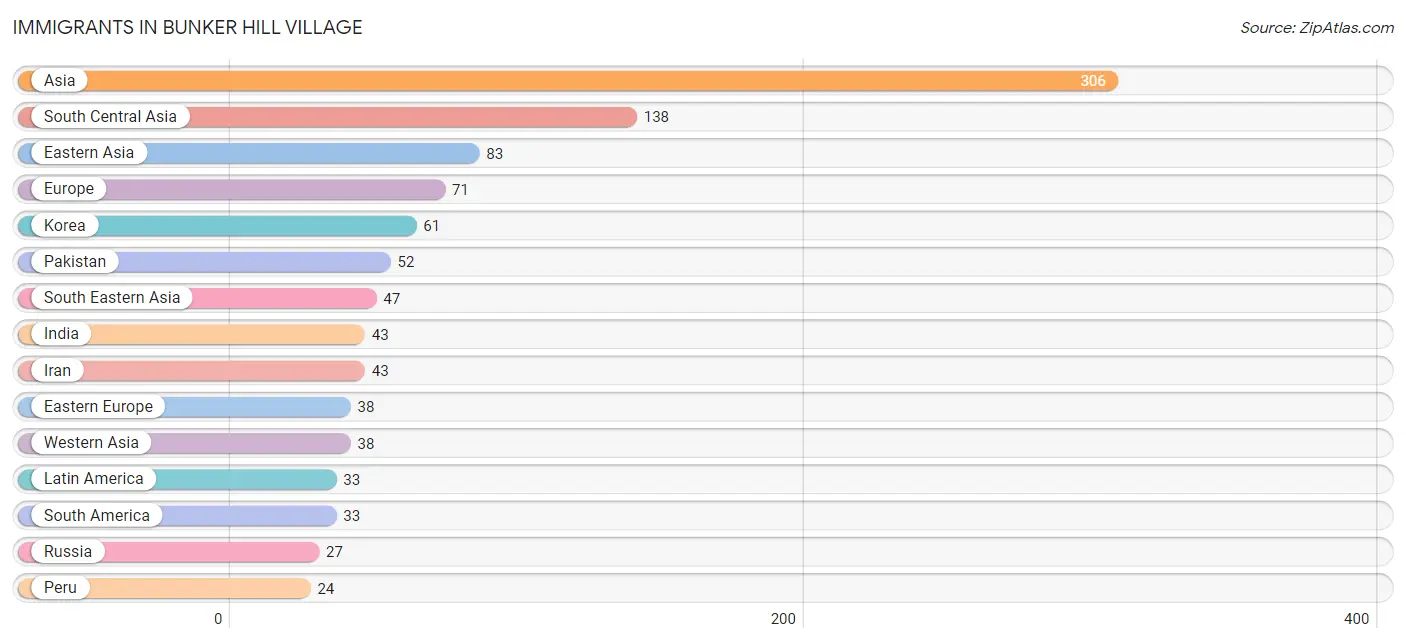
Immigrants in Bunker Hill Village
The most numerous immigrant groups reported in Bunker Hill Village came from Asia (306 | 8.0%), South Central Asia (138 | 3.6%), Eastern Asia (83 | 2.2%), Europe (71 | 1.9%), and Korea (61 | 1.6%), together accounting for 17.2% of all Bunker Hill Village residents.
| Immigration Origin | # Population | % Population |
| Asia | 306 | 8.0% |
| Canada | 19 | 0.5% |
| China | 22 | 0.6% |
| Colombia | 9 | 0.2% |
| Eastern Asia | 83 | 2.2% |
| Eastern Europe | 38 | 1.0% |
| Europe | 71 | 1.9% |
| Germany | 11 | 0.3% |
| India | 43 | 1.1% |
| Iran | 43 | 1.1% |
| Iraq | 9 | 0.2% |
| Ireland | 11 | 0.3% |
| Korea | 61 | 1.6% |
| Latin America | 33 | 0.9% |
| Northern Europe | 22 | 0.6% |
| Pakistan | 52 | 1.4% |
| Peru | 24 | 0.6% |
| Philippines | 8 | 0.2% |
| Poland | 11 | 0.3% |
| Russia | 27 | 0.7% |
| South America | 33 | 0.9% |
| South Central Asia | 138 | 3.6% |
| South Eastern Asia | 47 | 1.2% |
| Syria | 19 | 0.5% |
| Taiwan | 9 | 0.2% |
| Thailand | 23 | 0.6% |
| Vietnam | 16 | 0.4% |
| Western Asia | 38 | 1.0% |
| Western Europe | 11 | 0.3% | View All 29 Rows |
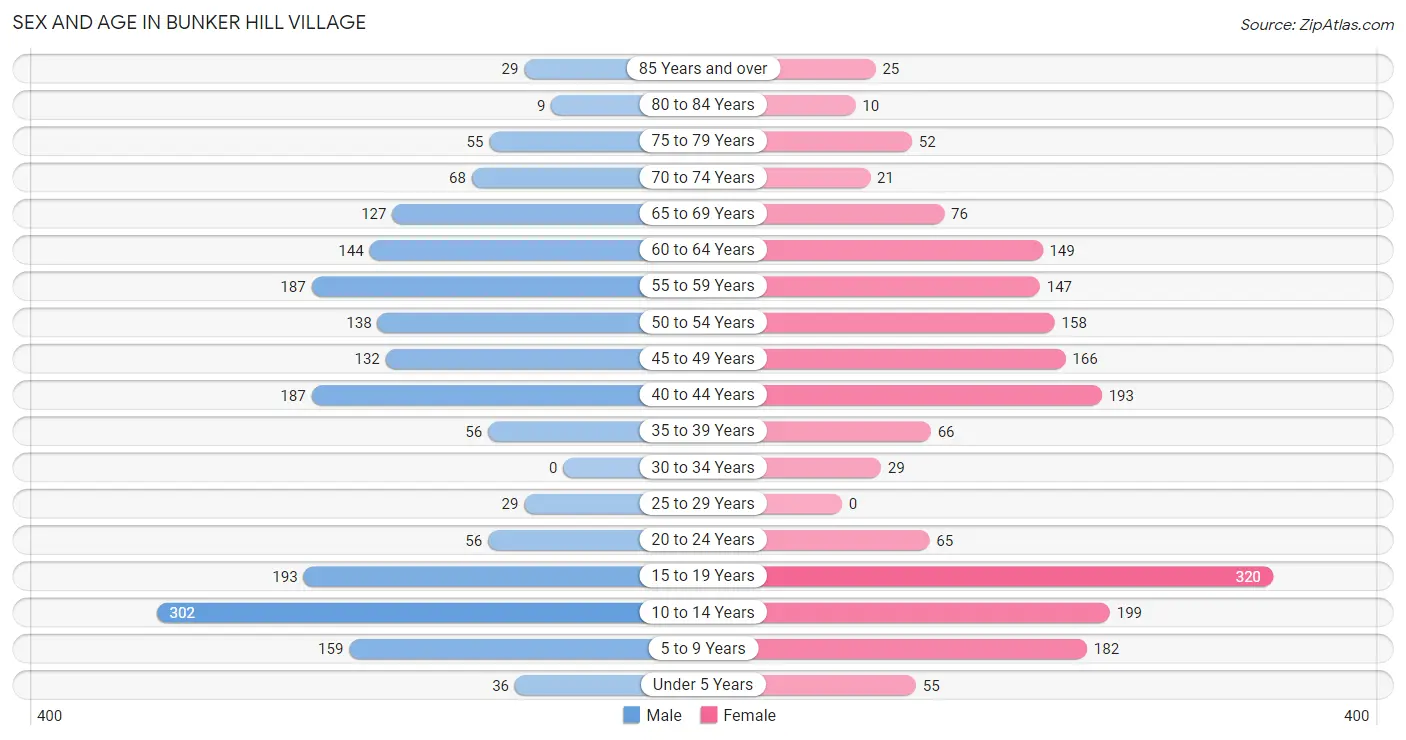
Sex and Age in Bunker Hill Village
Sex and Age in Bunker Hill Village
The most populous age groups in Bunker Hill Village are 10 to 14 Years (302 | 15.8%) for men and 15 to 19 Years (320 | 16.7%) for women.
| Age Bracket | Male | Female |
| Under 5 Years | 36 (1.9%) | 55 (2.9%) |
| 5 to 9 Years | 159 (8.3%) | 182 (9.5%) |
| 10 to 14 Years | 302 (15.8%) | 199 (10.4%) |
| 15 to 19 Years | 193 (10.1%) | 320 (16.7%) |
| 20 to 24 Years | 56 (2.9%) | 65 (3.4%) |
| 25 to 29 Years | 29 (1.5%) | 0 (0.0%) |
| 30 to 34 Years | 0 (0.0%) | 29 (1.5%) |
| 35 to 39 Years | 56 (2.9%) | 66 (3.5%) |
| 40 to 44 Years | 187 (9.8%) | 193 (10.1%) |
| 45 to 49 Years | 132 (6.9%) | 166 (8.7%) |
| 50 to 54 Years | 138 (7.2%) | 158 (8.3%) |
| 55 to 59 Years | 187 (9.8%) | 147 (7.7%) |
| 60 to 64 Years | 144 (7.5%) | 149 (7.8%) |
| 65 to 69 Years | 127 (6.7%) | 76 (4.0%) |
| 70 to 74 Years | 68 (3.6%) | 21 (1.1%) |
| 75 to 79 Years | 55 (2.9%) | 52 (2.7%) |
| 80 to 84 Years | 9 (0.5%) | 10 (0.5%) |
| 85 Years and over | 29 (1.5%) | 25 (1.3%) |
| Total | 1,907 (100.0%) | 1,913 (100.0%) |
Families and Households in Bunker Hill Village
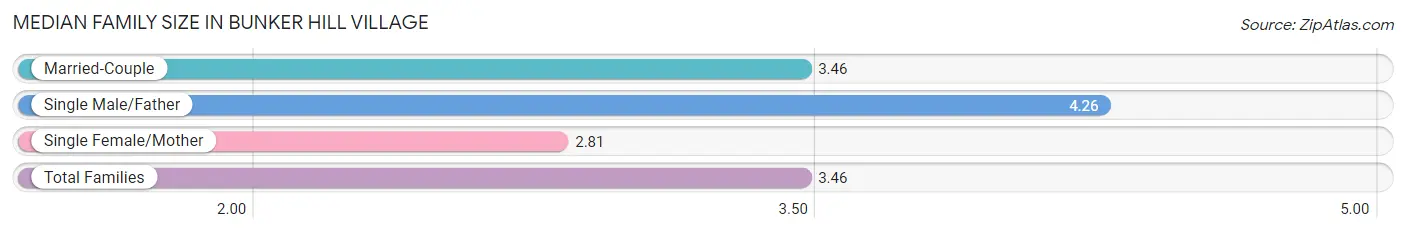
Median Family Size in Bunker Hill Village
The median family size in Bunker Hill Village is 3.46 persons per family, with single male/father families (39 | 3.6%) accounting for the largest median family size of 4.26 persons per family. On the other hand, single female/mother families (43 | 4.0%) represent the smallest median family size with 2.81 persons per family.
| Family Type | # Families | Family Size |
| Married-Couple | 990 (92.3%) | 3.46 |
| Single Male/Father | 39 (3.6%) | 4.26 |
| Single Female/Mother | 43 (4.0%) | 2.81 |
| Total Families | 1,072 (100.0%) | 3.46 |
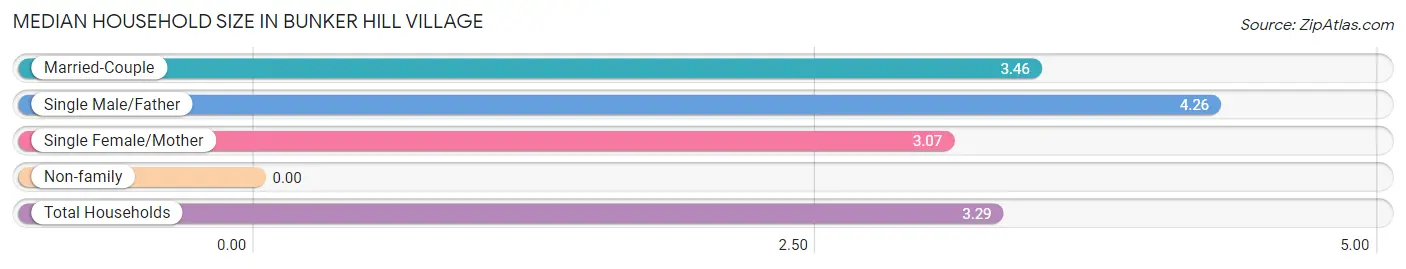
Median Household Size in Bunker Hill Village
| Household Type | # Households | Household Size |
| Married-Couple | 990 (85.4%) | 3.46 |
| Single Male/Father | 39 (3.4%) | 4.26 |
| Single Female/Mother | 43 (3.7%) | 3.07 |
| Non-family | 87 (7.5%) | - |
| Total Households | 1,159 (100.0%) | 3.29 |
Household Size by Marriage Status in Bunker Hill Village
Out of a total of 1,159 households in Bunker Hill Village, 1,072 (92.5%) are family households, while 87 (7.5%) are nonfamily households. The most numerous type of family households are 2-person households, comprising 400, and the most common type of nonfamily households are 1-person households, comprising 87.
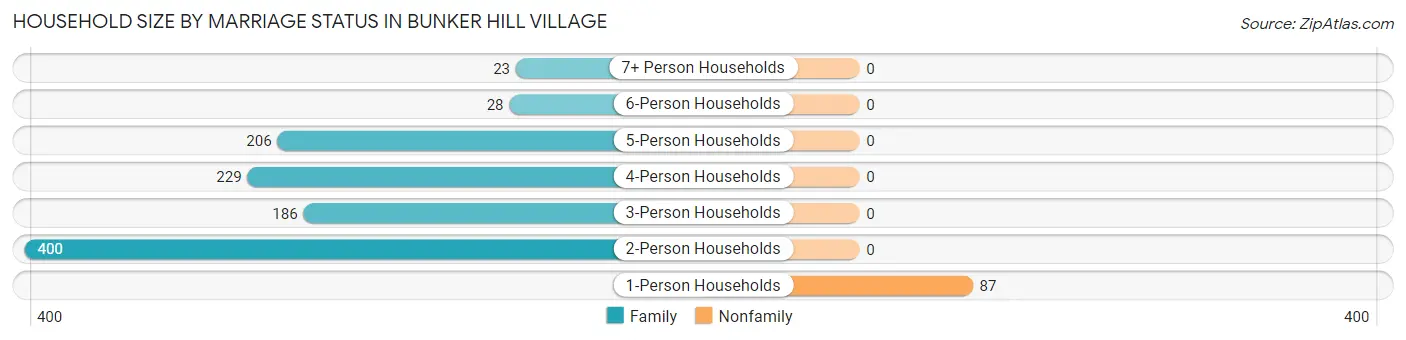
| Household Size | Family Households | Nonfamily Households |
| 1-Person Households | - | 87 (7.5%) |
| 2-Person Households | 400 (34.5%) | 0 (0.0%) |
| 3-Person Households | 186 (16.1%) | 0 (0.0%) |
| 4-Person Households | 229 (19.8%) | 0 (0.0%) |
| 5-Person Households | 206 (17.8%) | 0 (0.0%) |
| 6-Person Households | 28 (2.4%) | 0 (0.0%) |
| 7+ Person Households | 23 (2.0%) | 0 (0.0%) |
| Total | 1,072 (92.5%) | 87 (7.5%) |
Female Fertility in Bunker Hill Village
Fertility by Age in Bunker Hill Village
Average fertility rate in Bunker Hill Village is 55.0 births per 1,000 women. Women in the age bracket of 35 to 50 years have the highest fertility rate with 87.0 births per 1,000 women. Women in the age bracket of 35 to 50 years acount for 83.3% of all women with births.
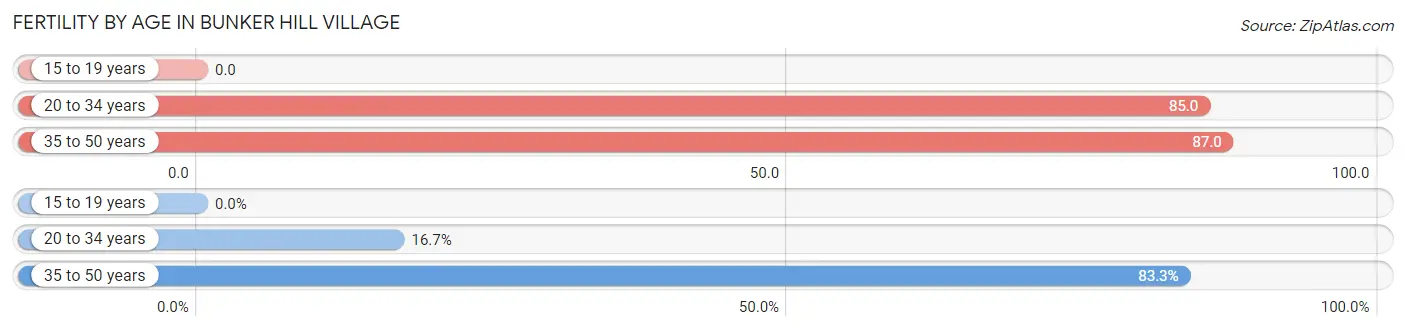
| Age Bracket | Women with Births | Births / 1,000 Women |
| 15 to 19 years | 0 (0.0%) | 0.0 |
| 20 to 34 years | 8 (16.7%) | 85.0 |
| 35 to 50 years | 40 (83.3%) | 87.0 |
| Total | 48 (100.0%) | 55.0 |
Fertility by Age by Marriage Status in Bunker Hill Village
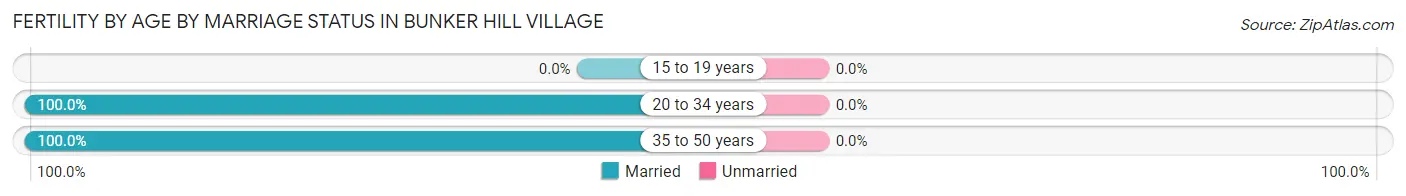
| Age Bracket | Married | Unmarried |
| 15 to 19 years | 0 (0.0%) | 0 (0.0%) |
| 20 to 34 years | 8 (100.0%) | 0 (0.0%) |
| 35 to 50 years | 40 (100.0%) | 0 (0.0%) |
| Total | 48 (100.0%) | 0 (0.0%) |
Fertility by Education in Bunker Hill Village
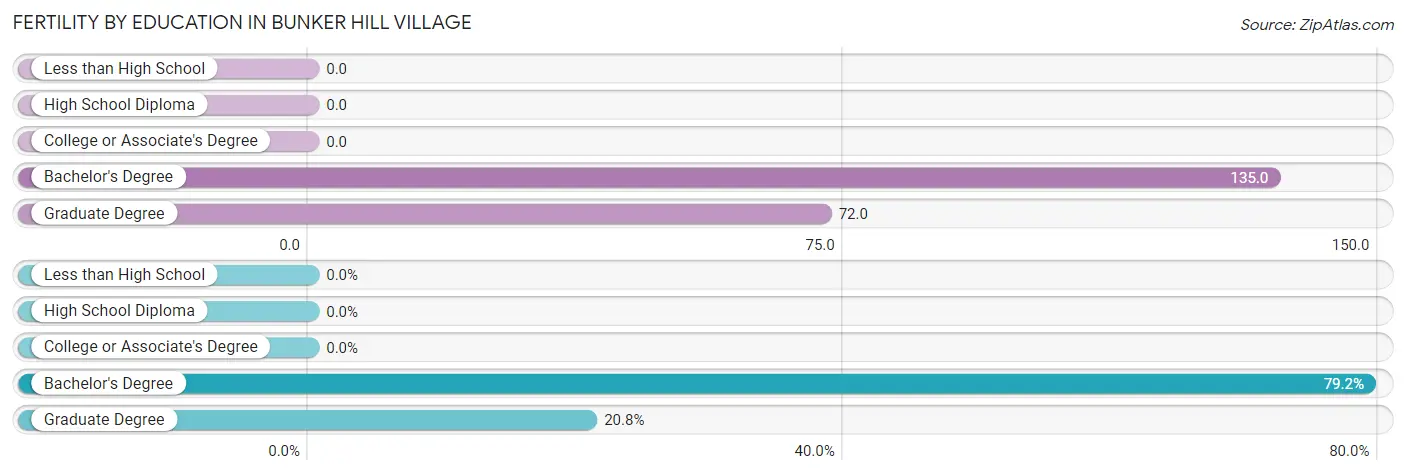
| Educational Attainment | Women with Births | Births / 1,000 Women |
| Less than High School | 0 (0.0%) | 0.0 |
| High School Diploma | 0 (0.0%) | 0.0 |
| College or Associate's Degree | 0 (0.0%) | 0.0 |
| Bachelor's Degree | 38 (79.2%) | 135.0 |
| Graduate Degree | 10 (20.8%) | 72.0 |
| Total | 48 (100.0%) | 55.0 |
Fertility by Education by Marriage Status in Bunker Hill Village
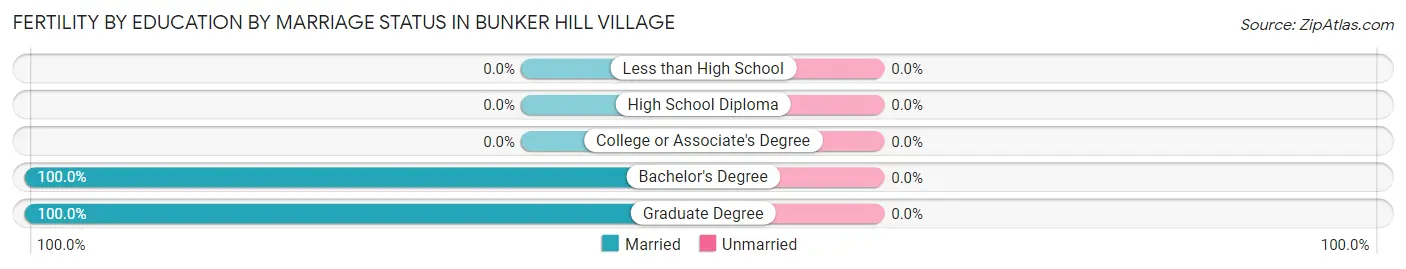
| Educational Attainment | Married | Unmarried |
| Less than High School | 0 (0.0%) | 0 (0.0%) |
| High School Diploma | 0 (0.0%) | 0 (0.0%) |
| College or Associate's Degree | 0 (0.0%) | 0 (0.0%) |
| Bachelor's Degree | 38 (100.0%) | 0 (0.0%) |
| Graduate Degree | 10 (100.0%) | 0 (0.0%) |
| Total | 48 (100.0%) | 0 (0.0%) |
Employment Characteristics in Bunker Hill Village
Employment by Class of Employer in Bunker Hill Village
Among the 1,419 employed individuals in Bunker Hill Village, private company employees (898 | 63.3%), self-employed (incorporated) (193 | 13.6%), and self-employed (not incorporated) (188 | 13.3%) make up the most common classes of employment.
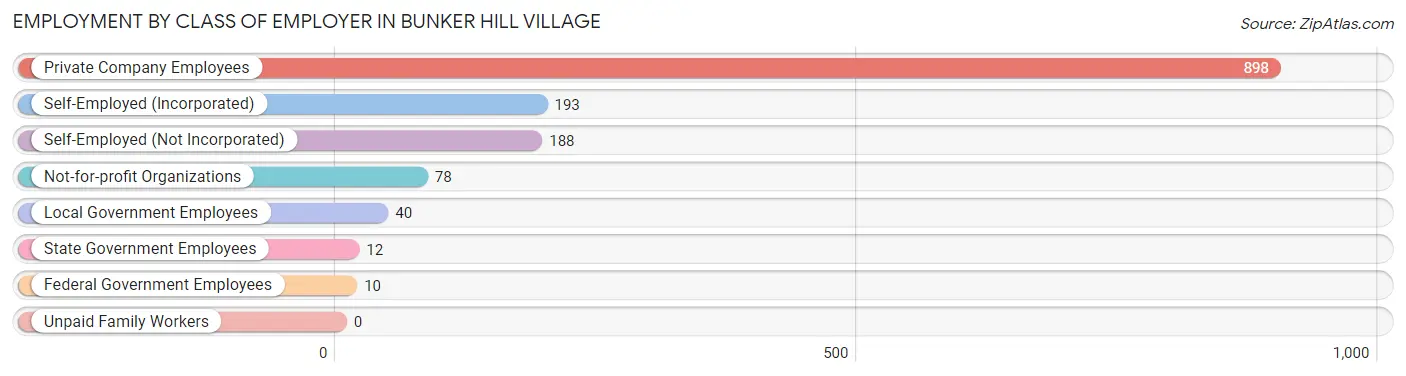
| Employer Class | # Employees | % Employees |
| Private Company Employees | 898 | 63.3% |
| Self-Employed (Incorporated) | 193 | 13.6% |
| Self-Employed (Not Incorporated) | 188 | 13.3% |
| Not-for-profit Organizations | 78 | 5.5% |
| Local Government Employees | 40 | 2.8% |
| State Government Employees | 12 | 0.9% |
| Federal Government Employees | 10 | 0.7% |
| Unpaid Family Workers | 0 | 0.0% |
| Total | 1,419 | 100.0% |
Employment Status by Age in Bunker Hill Village
According to the labor force statistics for Bunker Hill Village, out of the total population over 16 years of age (2,795), 52.7% or 1,473 individuals are in the labor force, with 3.6% or 53 of them unemployed. The age group with the highest labor force participation rate is 25 to 29 years, with 89.7% or 26 individuals in the labor force. Within the labor force, the 20 to 24 years age range has the highest percentage of unemployed individuals, with 47.6% or 10 of them being unemployed.
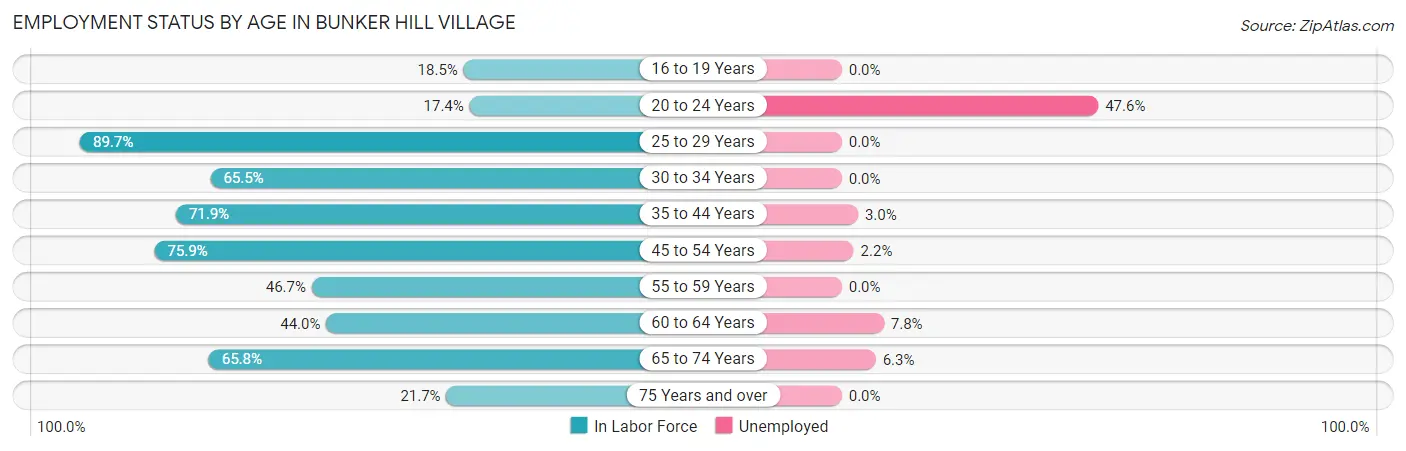
| Age Bracket | In Labor Force | Unemployed |
| 16 to 19 Years | 78 (18.5%) | 0 (0.0%) |
| 20 to 24 Years | 21 (17.4%) | 10 (47.6%) |
| 25 to 29 Years | 26 (89.7%) | 0 (0.0%) |
| 30 to 34 Years | 19 (65.5%) | 0 (0.0%) |
| 35 to 44 Years | 361 (71.9%) | 11 (3.0%) |
| 45 to 54 Years | 451 (75.9%) | 10 (2.2%) |
| 55 to 59 Years | 156 (46.7%) | 0 (0.0%) |
| 60 to 64 Years | 129 (44.0%) | 10 (7.8%) |
| 65 to 74 Years | 192 (65.8%) | 12 (6.3%) |
| 75 Years and over | 39 (21.7%) | 0 (0.0%) |
| Total | 1,473 (52.7%) | 53 (3.6%) |
Employment Status by Educational Attainment in Bunker Hill Village
According to labor force statistics for Bunker Hill Village, 64.1% of individuals (1,142) out of the total population between 25 and 64 years of age (1,781) are in the labor force, with 2.7% or 31 of them being unemployed. The group with the highest labor force participation rate are those with the educational attainment of high school diploma, with 73.8% or 45 individuals in the labor force. Within the labor force, individuals with bachelor's degree or higher education have the highest percentage of unemployment, with 3.0% or 31 of them being unemployed.
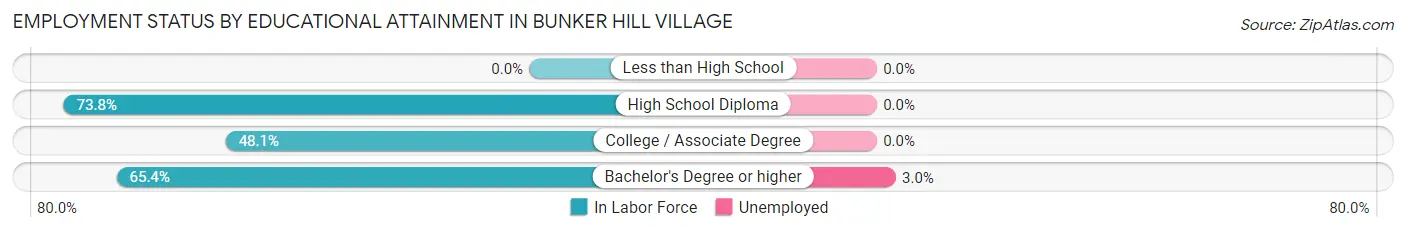
| Educational Attainment | In Labor Force | Unemployed |
| Less than High School | 0 (0.0%) | 0 (0.0%) |
| High School Diploma | 45 (73.8%) | 0 (0.0%) |
| College / Associate Degree | 64 (48.1%) | 0 (0.0%) |
| Bachelor's Degree or higher | 1,033 (65.4%) | 47 (3.0%) |
| Total | 1,142 (64.1%) | 48 (2.7%) |
Employment Occupations by Sex in Bunker Hill Village
Management, Business, Science and Arts Occupations
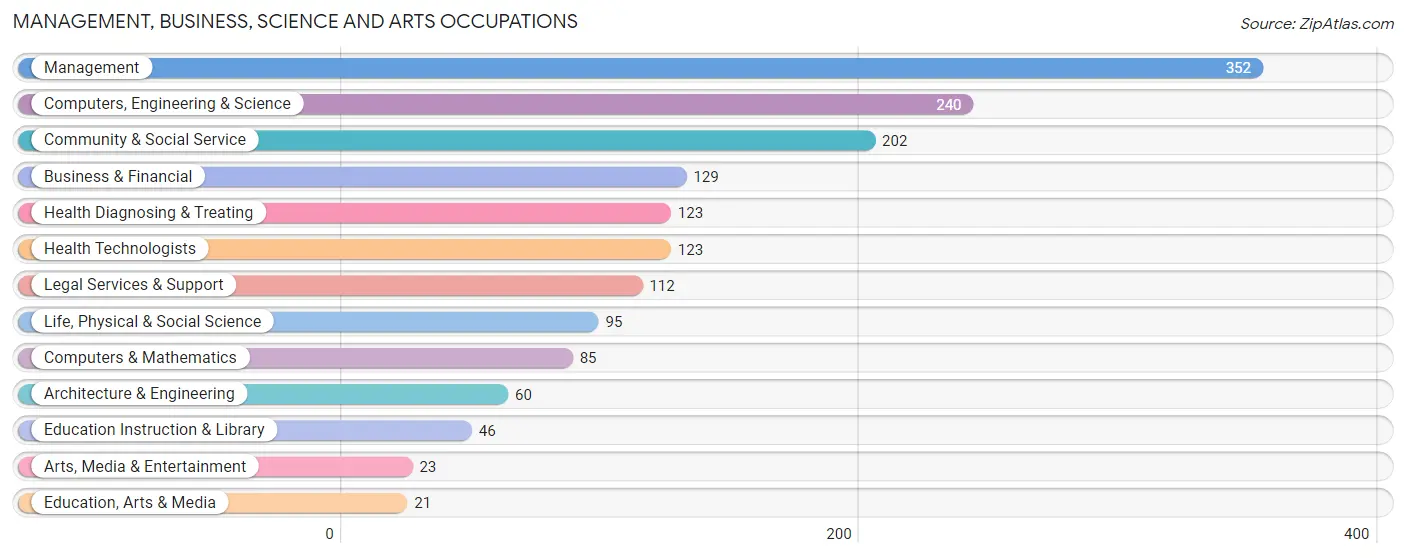
The most common Management, Business, Science and Arts occupations in Bunker Hill Village are Management (352 | 24.8%), Computers, Engineering & Science (240 | 16.9%), Community & Social Service (202 | 14.2%), Business & Financial (129 | 9.1%), and Health Diagnosing & Treating (123 | 8.7%).
Management, Business, Science and Arts Occupations by Sex
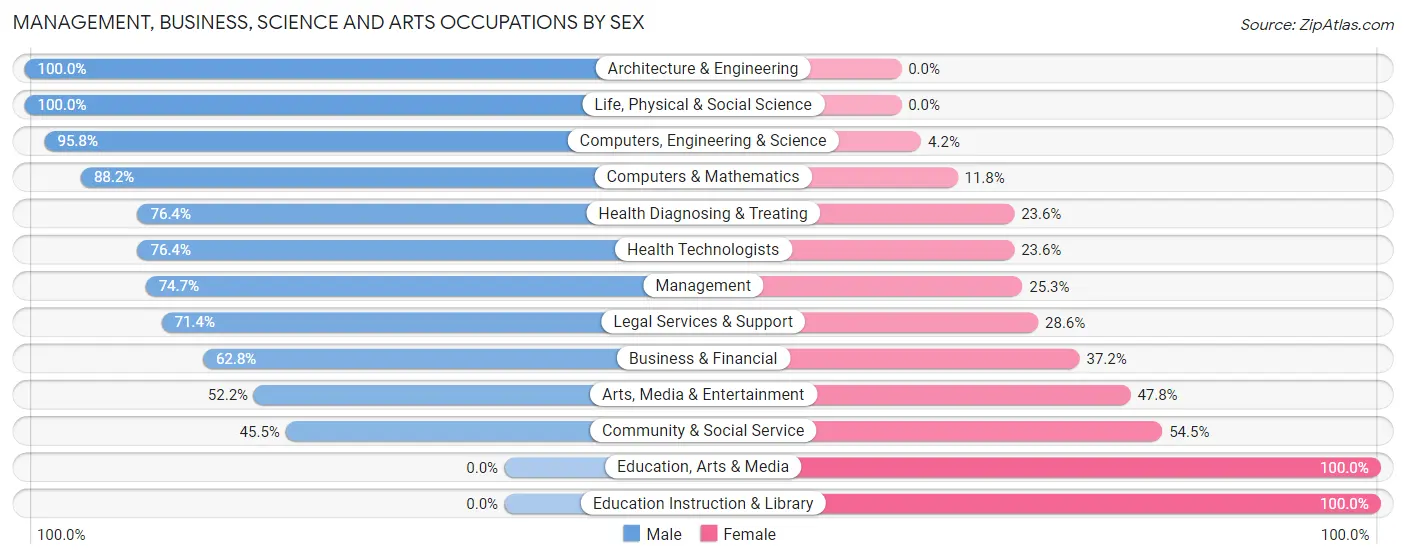
Within the Management, Business, Science and Arts occupations in Bunker Hill Village, the most male-oriented occupations are Architecture & Engineering (100.0%), Life, Physical & Social Science (100.0%), and Computers, Engineering & Science (95.8%), while the most female-oriented occupations are Education, Arts & Media (100.0%), Education Instruction & Library (100.0%), and Community & Social Service (54.5%).
| Occupation | Male | Female |
| Management | 263 (74.7%) | 89 (25.3%) |
| Business & Financial | 81 (62.8%) | 48 (37.2%) |
| Computers, Engineering & Science | 230 (95.8%) | 10 (4.2%) |
| Computers & Mathematics | 75 (88.2%) | 10 (11.8%) |
| Architecture & Engineering | 60 (100.0%) | 0 (0.0%) |
| Life, Physical & Social Science | 95 (100.0%) | 0 (0.0%) |
| Community & Social Service | 92 (45.5%) | 110 (54.5%) |
| Education, Arts & Media | 0 (0.0%) | 21 (100.0%) |
| Legal Services & Support | 80 (71.4%) | 32 (28.6%) |
| Education Instruction & Library | 0 (0.0%) | 46 (100.0%) |
| Arts, Media & Entertainment | 12 (52.2%) | 11 (47.8%) |
| Health Diagnosing & Treating | 94 (76.4%) | 29 (23.6%) |
| Health Technologists | 94 (76.4%) | 29 (23.6%) |
| Total (Category) | 760 (72.7%) | 286 (27.3%) |
| Total (Overall) | 982 (69.2%) | 437 (30.8%) |
Services Occupations
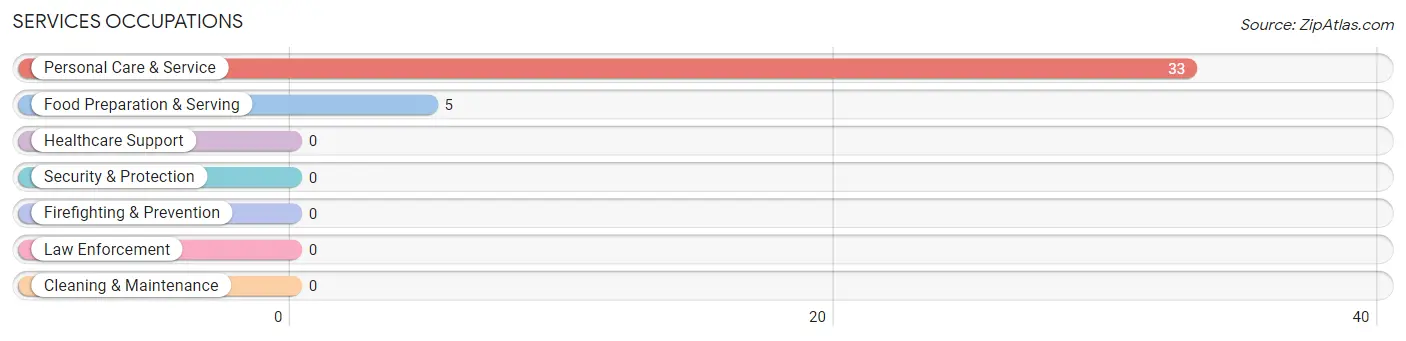
The most common Services occupations in Bunker Hill Village are Personal Care & Service (33 | 2.3%), and Food Preparation & Serving (5 | 0.4%).
Services Occupations by Sex
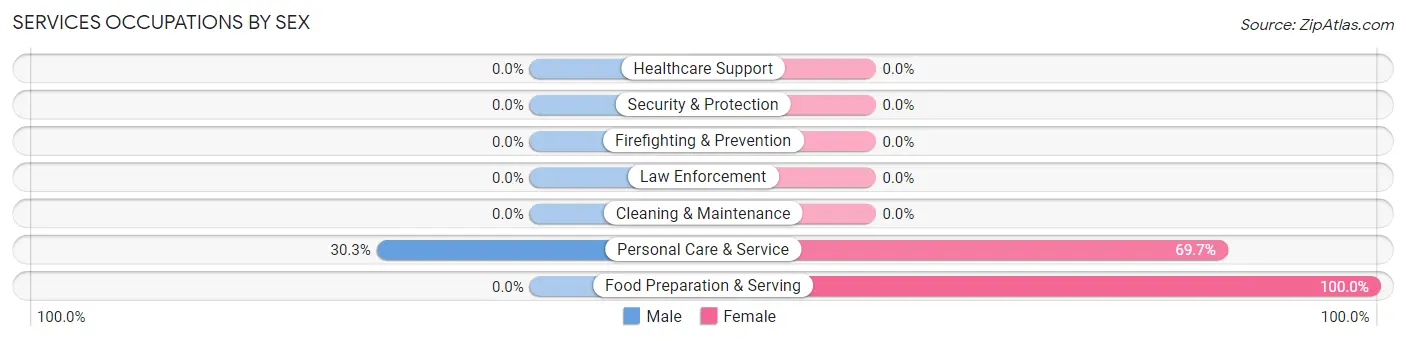
| Occupation | Male | Female |
| Healthcare Support | 0 (0.0%) | 0 (0.0%) |
| Security & Protection | 0 (0.0%) | 0 (0.0%) |
| Firefighting & Prevention | 0 (0.0%) | 0 (0.0%) |
| Law Enforcement | 0 (0.0%) | 0 (0.0%) |
| Food Preparation & Serving | 0 (0.0%) | 5 (100.0%) |
| Cleaning & Maintenance | 0 (0.0%) | 0 (0.0%) |
| Personal Care & Service | 10 (30.3%) | 23 (69.7%) |
| Total (Category) | 10 (26.3%) | 28 (73.7%) |
| Total (Overall) | 982 (69.2%) | 437 (30.8%) |
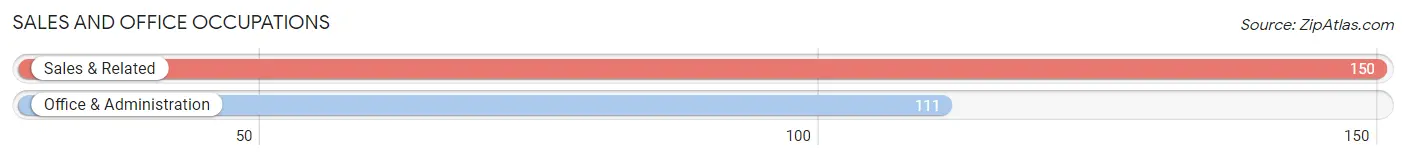
Sales and Office Occupations
The most common Sales and Office occupations in Bunker Hill Village are Sales & Related (150 | 10.6%), and Office & Administration (111 | 7.8%).
Sales and Office Occupations by Sex
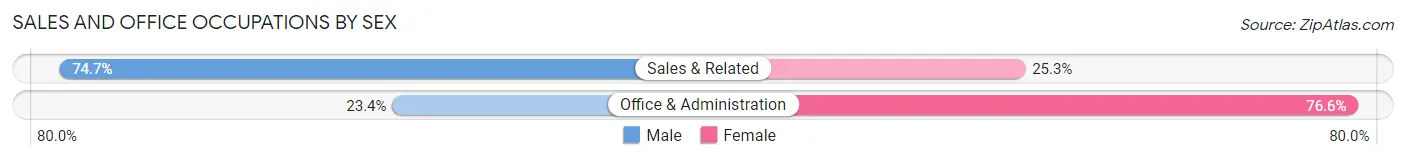
| Occupation | Male | Female |
| Sales & Related | 112 (74.7%) | 38 (25.3%) |
| Office & Administration | 26 (23.4%) | 85 (76.6%) |
| Total (Category) | 138 (52.9%) | 123 (47.1%) |
| Total (Overall) | 982 (69.2%) | 437 (30.8%) |
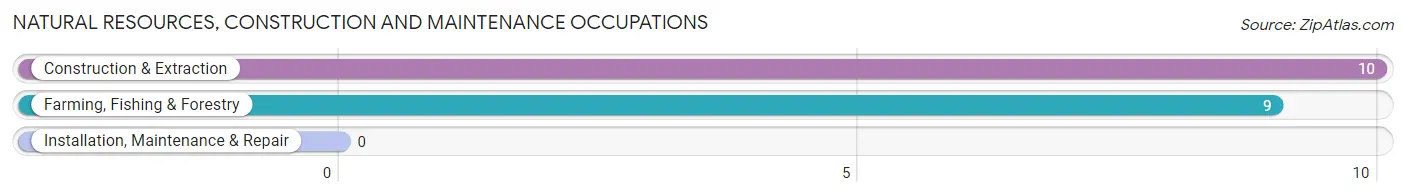
Natural Resources, Construction and Maintenance Occupations
The most common Natural Resources, Construction and Maintenance occupations in Bunker Hill Village are Construction & Extraction (10 | 0.7%), and Farming, Fishing & Forestry (9 | 0.6%).
Natural Resources, Construction and Maintenance Occupations by Sex
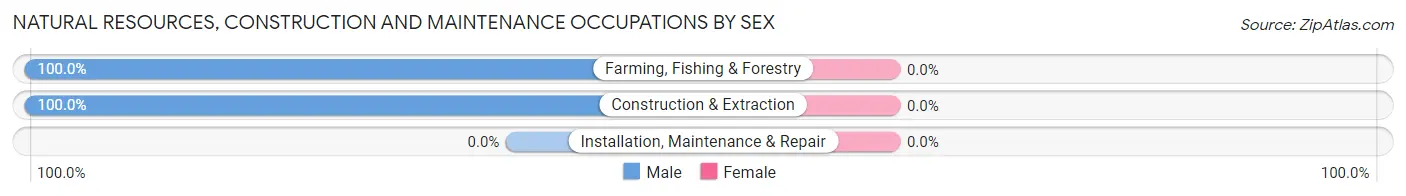
| Occupation | Male | Female |
| Farming, Fishing & Forestry | 9 (100.0%) | 0 (0.0%) |
| Construction & Extraction | 10 (100.0%) | 0 (0.0%) |
| Installation, Maintenance & Repair | 0 (0.0%) | 0 (0.0%) |
| Total (Category) | 19 (100.0%) | 0 (0.0%) |
| Total (Overall) | 982 (69.2%) | 437 (30.8%) |
Production, Transportation and Moving Occupations
The most common Production, Transportation and Moving occupations in Bunker Hill Village are , and Material Moving (55 | 3.9%).
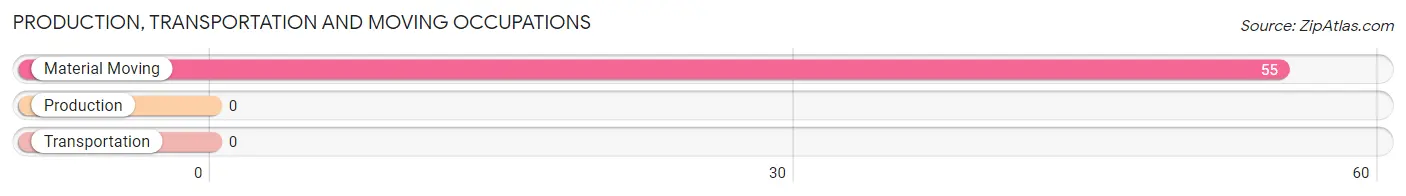
Production, Transportation and Moving Occupations by Sex
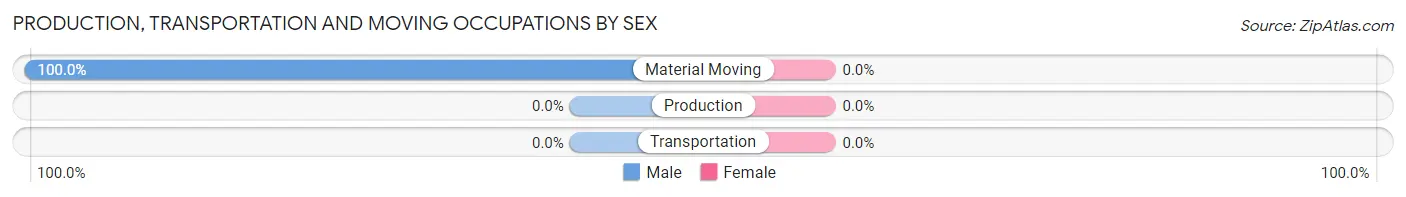
| Occupation | Male | Female |
| Production | 0 (0.0%) | 0 (0.0%) |
| Transportation | 0 (0.0%) | 0 (0.0%) |
| Material Moving | 55 (100.0%) | 0 (0.0%) |
| Total (Category) | 55 (100.0%) | 0 (0.0%) |
| Total (Overall) | 982 (69.2%) | 437 (30.8%) |
Employment Industries by Sex in Bunker Hill Village
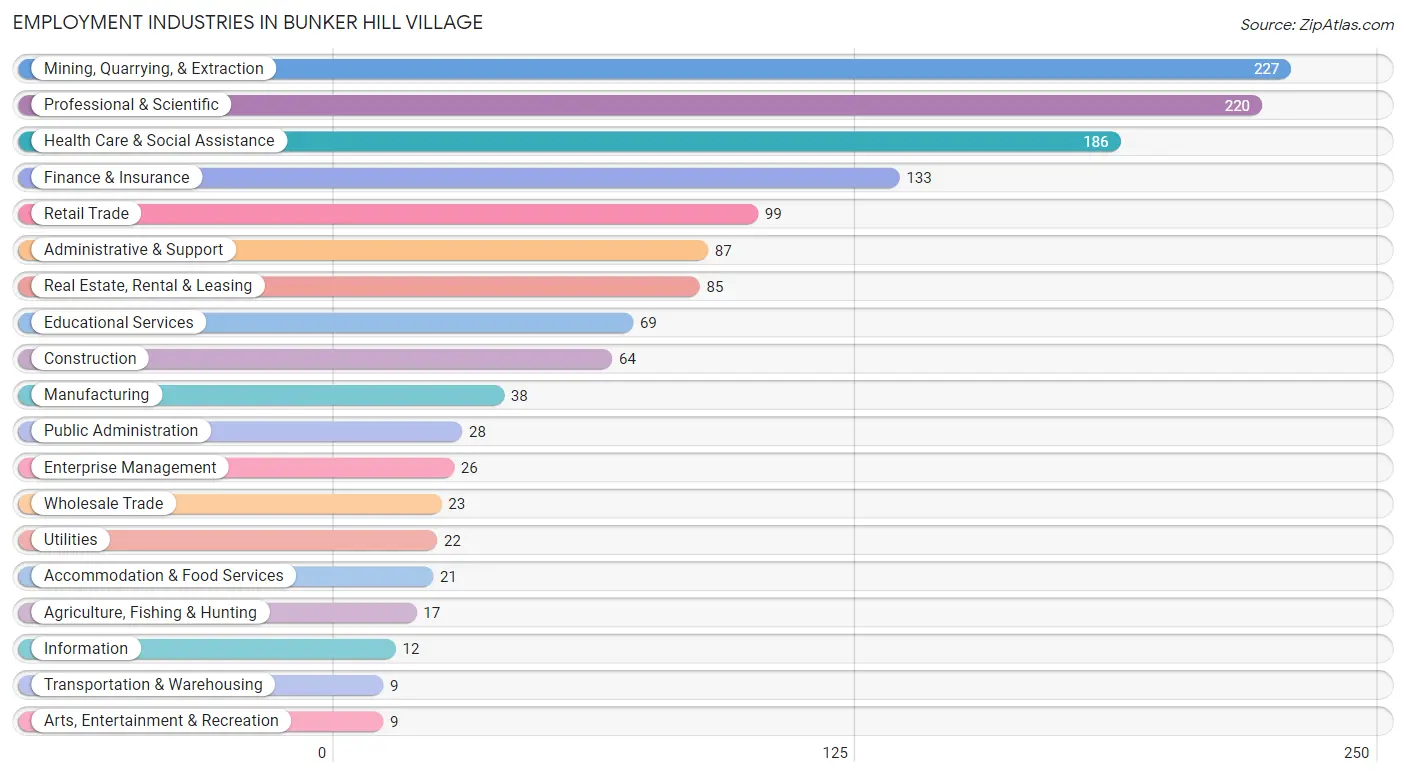
Employment Industries in Bunker Hill Village
The major employment industries in Bunker Hill Village include Mining, Quarrying, & Extraction (227 | 16.0%), Professional & Scientific (220 | 15.5%), Health Care & Social Assistance (186 | 13.1%), Finance & Insurance (133 | 9.4%), and Retail Trade (99 | 7.0%).
Employment Industries by Sex in Bunker Hill Village
The Bunker Hill Village industries that see more men than women are Agriculture, Fishing & Hunting (100.0%), Wholesale Trade (100.0%), and Transportation & Warehousing (100.0%), whereas the industries that tend to have a higher number of women are Arts, Entertainment & Recreation (100.0%), Educational Services (82.6%), and Accommodation & Food Services (52.4%).
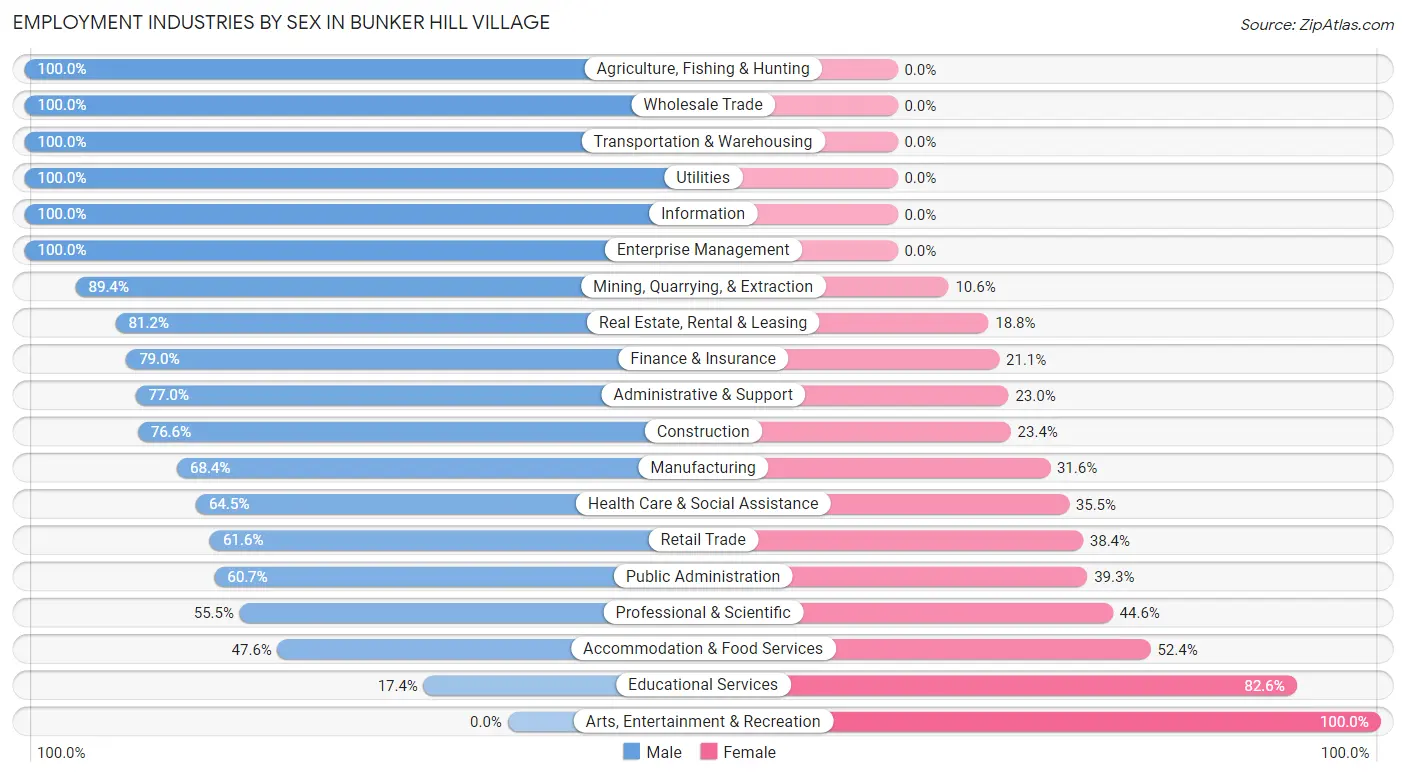
| Industry | Male | Female |
| Agriculture, Fishing & Hunting | 17 (100.0%) | 0 (0.0%) |
| Mining, Quarrying, & Extraction | 203 (89.4%) | 24 (10.6%) |
| Construction | 49 (76.6%) | 15 (23.4%) |
| Manufacturing | 26 (68.4%) | 12 (31.6%) |
| Wholesale Trade | 23 (100.0%) | 0 (0.0%) |
| Retail Trade | 61 (61.6%) | 38 (38.4%) |
| Transportation & Warehousing | 9 (100.0%) | 0 (0.0%) |
| Utilities | 22 (100.0%) | 0 (0.0%) |
| Information | 12 (100.0%) | 0 (0.0%) |
| Finance & Insurance | 105 (78.9%) | 28 (21.0%) |
| Real Estate, Rental & Leasing | 69 (81.2%) | 16 (18.8%) |
| Professional & Scientific | 122 (55.4%) | 98 (44.6%) |
| Enterprise Management | 26 (100.0%) | 0 (0.0%) |
| Administrative & Support | 67 (77.0%) | 20 (23.0%) |
| Educational Services | 12 (17.4%) | 57 (82.6%) |
| Health Care & Social Assistance | 120 (64.5%) | 66 (35.5%) |
| Arts, Entertainment & Recreation | 0 (0.0%) | 9 (100.0%) |
| Accommodation & Food Services | 10 (47.6%) | 11 (52.4%) |
| Public Administration | 17 (60.7%) | 11 (39.3%) |
| Total | 982 (69.2%) | 437 (30.8%) |
Education in Bunker Hill Village
School Enrollment in Bunker Hill Village
The most common levels of schooling among the 1,573 students in Bunker Hill Village are middle school (459 | 29.2%), high school (442 | 28.1%), and elementary school (272 | 17.3%).
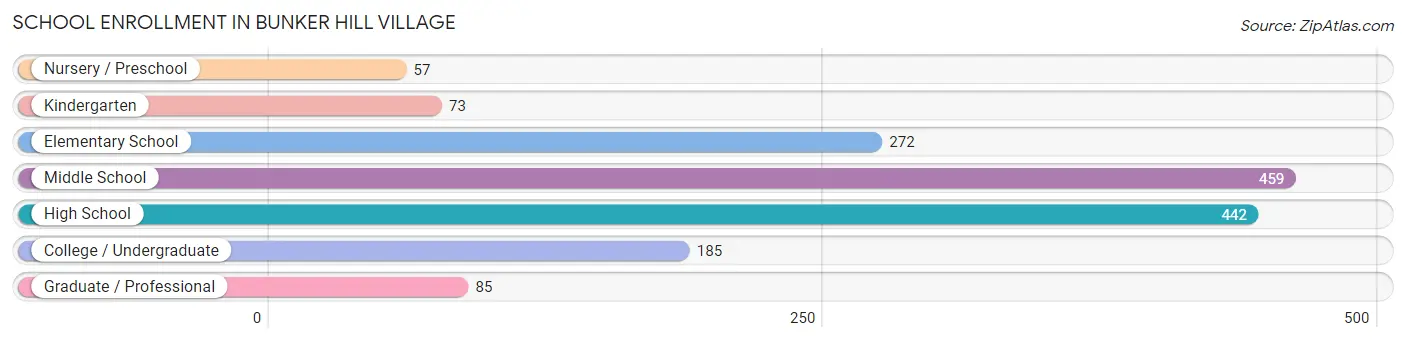
| School Level | # Students | % Students |
| Nursery / Preschool | 57 | 3.6% |
| Kindergarten | 73 | 4.6% |
| Elementary School | 272 | 17.3% |
| Middle School | 459 | 29.2% |
| High School | 442 | 28.1% |
| College / Undergraduate | 185 | 11.8% |
| Graduate / Professional | 85 | 5.4% |
| Total | 1,573 | 100.0% |
School Enrollment by Age by Funding Source in Bunker Hill Village
Out of a total of 1,573 students who are enrolled in schools in Bunker Hill Village, 418 (26.6%) attend a private institution, while the remaining 1,155 (73.4%) are enrolled in public schools. The age group of 3 to 4 year olds has the highest likelihood of being enrolled in private schools, with 24 (70.6% in the age bracket) enrolled. Conversely, the age group of 18 to 19 year olds has the lowest likelihood of being enrolled in a private school, with 168 (96.0% in the age bracket) attending a public institution.
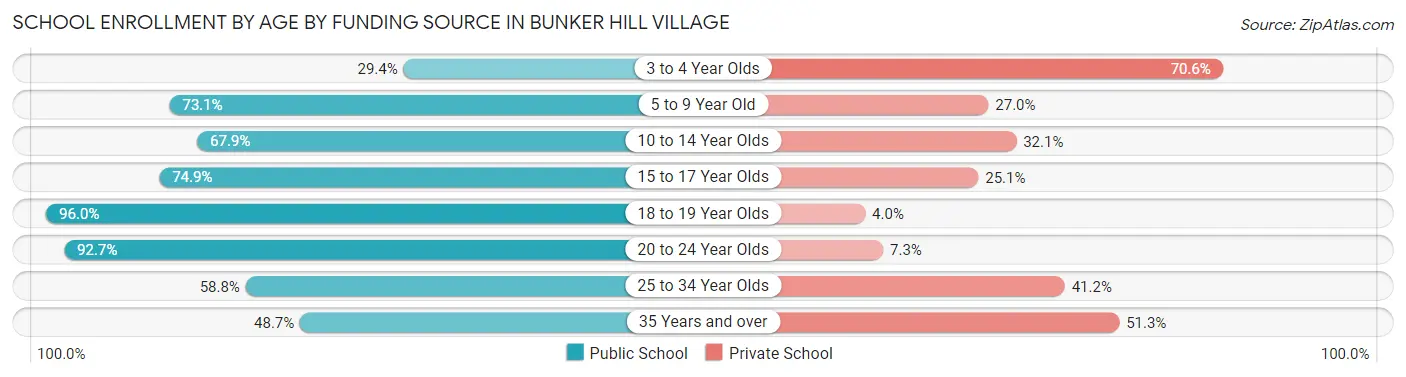
| Age Bracket | Public School | Private School |
| 3 to 4 Year Olds | 10 (29.4%) | 24 (70.6%) |
| 5 to 9 Year Old | 244 (73.1%) | 90 (27.0%) |
| 10 to 14 Year Olds | 340 (67.9%) | 161 (32.1%) |
| 15 to 17 Year Olds | 245 (74.9%) | 82 (25.1%) |
| 18 to 19 Year Olds | 168 (96.0%) | 7 (4.0%) |
| 20 to 24 Year Olds | 101 (92.7%) | 8 (7.3%) |
| 25 to 34 Year Olds | 10 (58.8%) | 7 (41.2%) |
| 35 Years and over | 37 (48.7%) | 39 (51.3%) |
| Total | 1,155 (73.4%) | 418 (26.6%) |
Educational Attainment by Field of Study in Bunker Hill Village
Business (670 | 32.9%), engineering (331 | 16.2%), bio, nature & agricultural (202 | 9.9%), social sciences (182 | 8.9%), and physical & health sciences (149 | 7.3%) are the most common fields of study among 2,038 individuals in Bunker Hill Village who have obtained a bachelor's degree or higher.
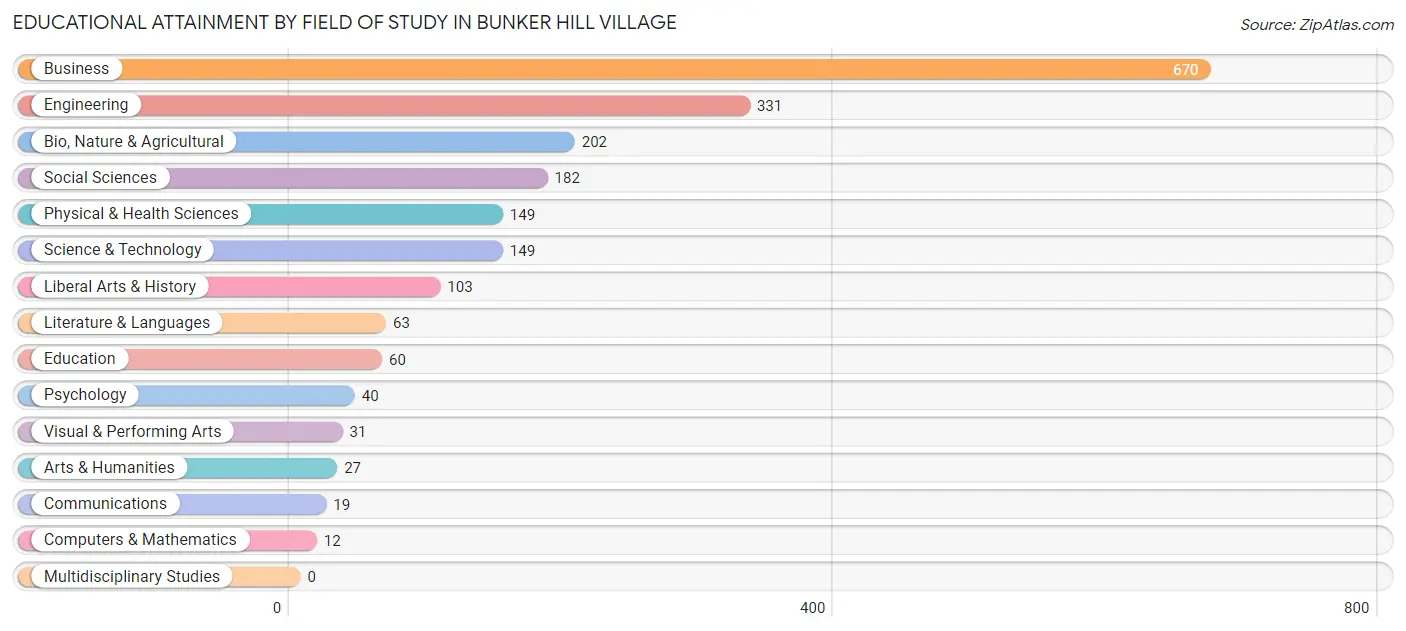
| Field of Study | # Graduates | % Graduates |
| Computers & Mathematics | 12 | 0.6% |
| Bio, Nature & Agricultural | 202 | 9.9% |
| Physical & Health Sciences | 149 | 7.3% |
| Psychology | 40 | 2.0% |
| Social Sciences | 182 | 8.9% |
| Engineering | 331 | 16.2% |
| Multidisciplinary Studies | 0 | 0.0% |
| Science & Technology | 149 | 7.3% |
| Business | 670 | 32.9% |
| Education | 60 | 2.9% |
| Literature & Languages | 63 | 3.1% |
| Liberal Arts & History | 103 | 5.1% |
| Visual & Performing Arts | 31 | 1.5% |
| Communications | 19 | 0.9% |
| Arts & Humanities | 27 | 1.3% |
| Total | 2,038 | 100.0% |
Transportation & Commute in Bunker Hill Village
Vehicle Availability by Sex in Bunker Hill Village
The most prevalent vehicle ownership categories in Bunker Hill Village are males with 2 vehicles (419, accounting for 42.7%) and females with 2 vehicles (212, making up 95.9%).
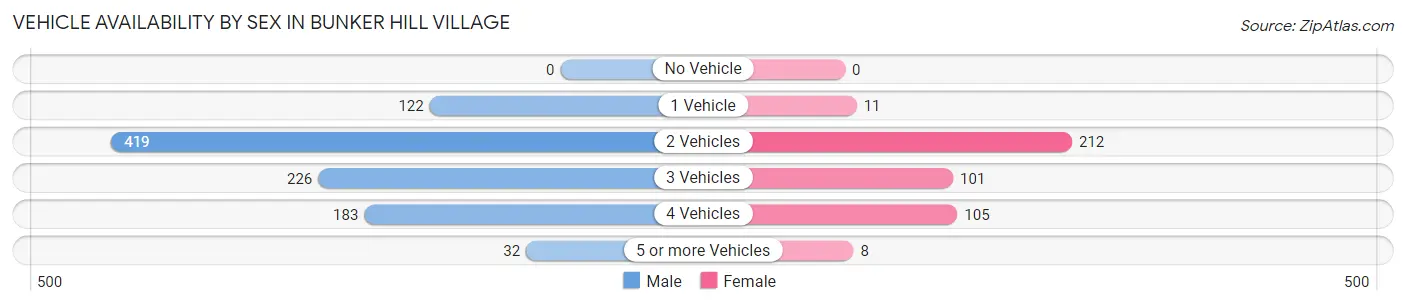
| Vehicles Available | Male | Female |
| No Vehicle | 0 (0.0%) | 0 (0.0%) |
| 1 Vehicle | 122 (12.4%) | 11 (2.5%) |
| 2 Vehicles | 419 (42.7%) | 212 (48.5%) |
| 3 Vehicles | 226 (23.0%) | 101 (23.1%) |
| 4 Vehicles | 183 (18.6%) | 105 (24.0%) |
| 5 or more Vehicles | 32 (3.3%) | 8 (1.8%) |
| Total | 982 (100.0%) | 437 (100.0%) |
Commute Time in Bunker Hill Village
The most frequently occuring commute durations in Bunker Hill Village are 20 to 24 minutes (160 commuters, 16.4%), 30 to 34 minutes (153 commuters, 15.7%), and 25 to 29 minutes (143 commuters, 14.7%).
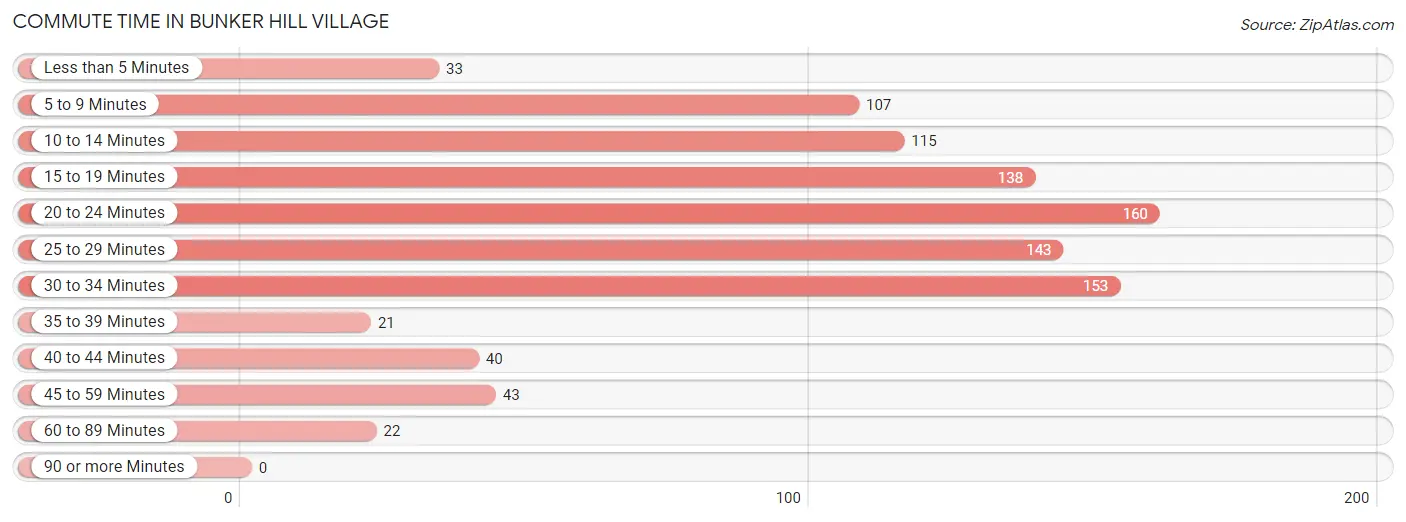
| Commute Time | # Commuters | % Commuters |
| Less than 5 Minutes | 33 | 3.4% |
| 5 to 9 Minutes | 107 | 11.0% |
| 10 to 14 Minutes | 115 | 11.8% |
| 15 to 19 Minutes | 138 | 14.1% |
| 20 to 24 Minutes | 160 | 16.4% |
| 25 to 29 Minutes | 143 | 14.7% |
| 30 to 34 Minutes | 153 | 15.7% |
| 35 to 39 Minutes | 21 | 2.1% |
| 40 to 44 Minutes | 40 | 4.1% |
| 45 to 59 Minutes | 43 | 4.4% |
| 60 to 89 Minutes | 22 | 2.3% |
| 90 or more Minutes | 0 | 0.0% |
Commute Time by Sex in Bunker Hill Village
The most common commute times in Bunker Hill Village are 25 to 29 minutes (110 commuters, 16.5%) for males and 20 to 24 minutes (79 commuters, 25.7%) for females.
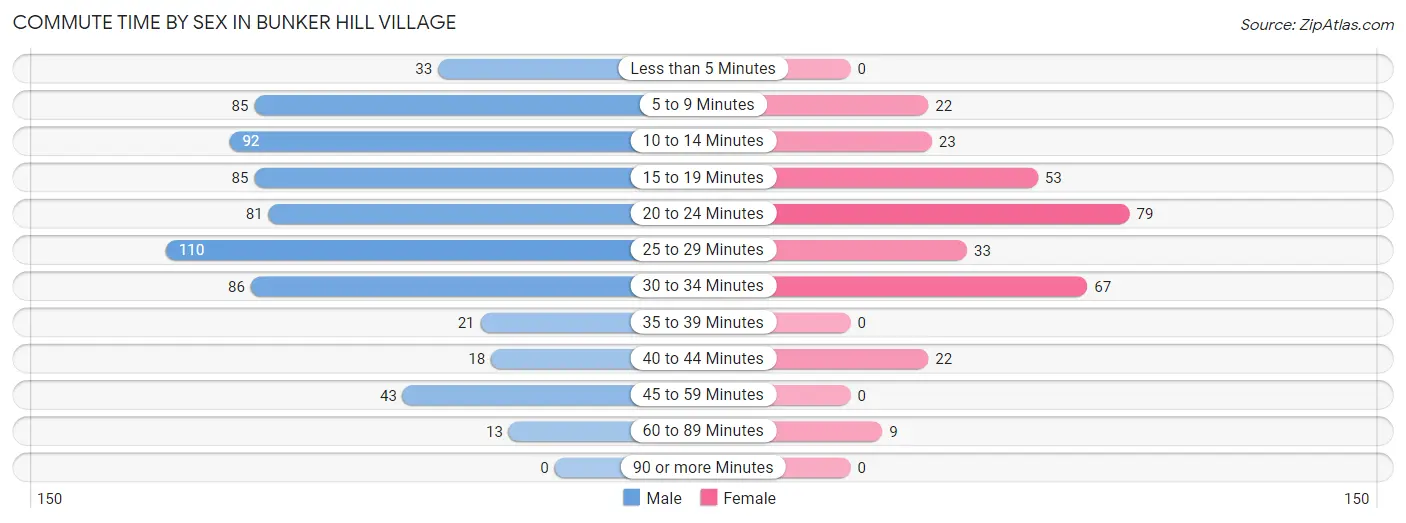
| Commute Time | Male | Female |
| Less than 5 Minutes | 33 (5.0%) | 0 (0.0%) |
| 5 to 9 Minutes | 85 (12.7%) | 22 (7.1%) |
| 10 to 14 Minutes | 92 (13.8%) | 23 (7.5%) |
| 15 to 19 Minutes | 85 (12.7%) | 53 (17.2%) |
| 20 to 24 Minutes | 81 (12.1%) | 79 (25.7%) |
| 25 to 29 Minutes | 110 (16.5%) | 33 (10.7%) |
| 30 to 34 Minutes | 86 (12.9%) | 67 (21.7%) |
| 35 to 39 Minutes | 21 (3.2%) | 0 (0.0%) |
| 40 to 44 Minutes | 18 (2.7%) | 22 (7.1%) |
| 45 to 59 Minutes | 43 (6.5%) | 0 (0.0%) |
| 60 to 89 Minutes | 13 (1.9%) | 9 (2.9%) |
| 90 or more Minutes | 0 (0.0%) | 0 (0.0%) |
Time of Departure to Work by Sex in Bunker Hill Village
The most frequent times of departure to work in Bunker Hill Village are 7:30 AM to 7:59 AM (167, 25.0%) for males and 7:30 AM to 7:59 AM (118, 38.3%) for females.
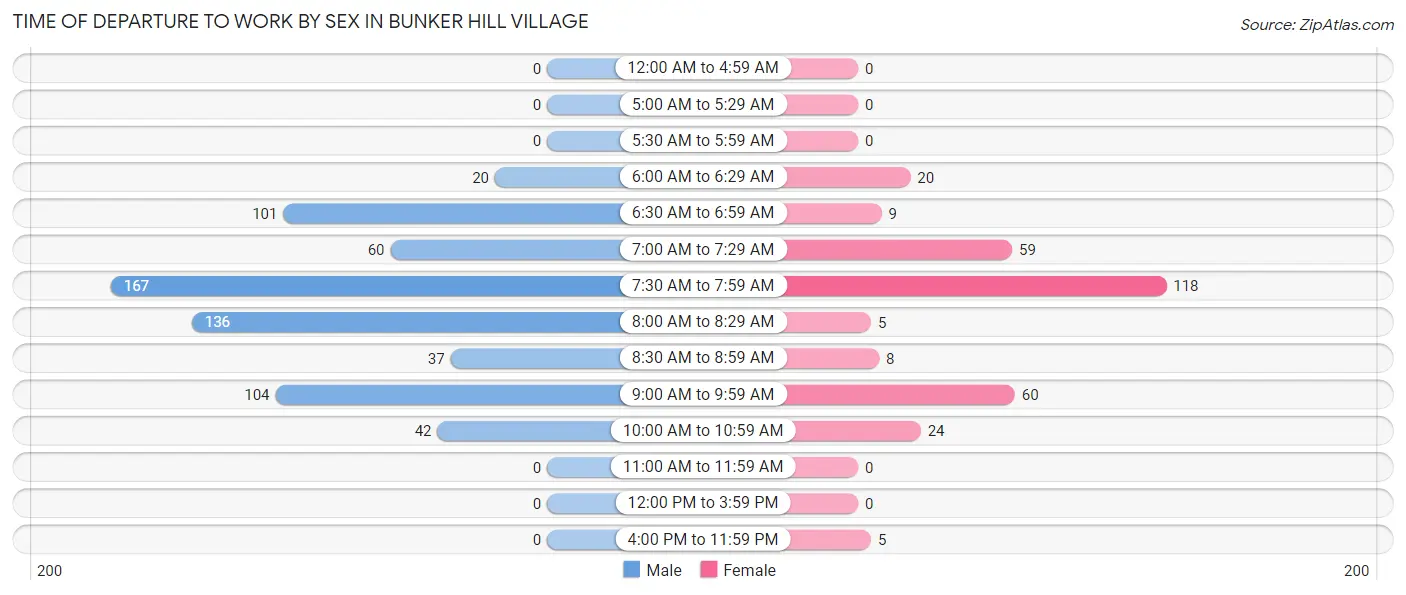
| Time of Departure | Male | Female |
| 12:00 AM to 4:59 AM | 0 (0.0%) | 0 (0.0%) |
| 5:00 AM to 5:29 AM | 0 (0.0%) | 0 (0.0%) |
| 5:30 AM to 5:59 AM | 0 (0.0%) | 0 (0.0%) |
| 6:00 AM to 6:29 AM | 20 (3.0%) | 20 (6.5%) |
| 6:30 AM to 6:59 AM | 101 (15.1%) | 9 (2.9%) |
| 7:00 AM to 7:29 AM | 60 (9.0%) | 59 (19.2%) |
| 7:30 AM to 7:59 AM | 167 (25.0%) | 118 (38.3%) |
| 8:00 AM to 8:29 AM | 136 (20.4%) | 5 (1.6%) |
| 8:30 AM to 8:59 AM | 37 (5.6%) | 8 (2.6%) |
| 9:00 AM to 9:59 AM | 104 (15.6%) | 60 (19.5%) |
| 10:00 AM to 10:59 AM | 42 (6.3%) | 24 (7.8%) |
| 11:00 AM to 11:59 AM | 0 (0.0%) | 0 (0.0%) |
| 12:00 PM to 3:59 PM | 0 (0.0%) | 0 (0.0%) |
| 4:00 PM to 11:59 PM | 0 (0.0%) | 5 (1.6%) |
| Total | 667 (100.0%) | 308 (100.0%) |
Housing Occupancy in Bunker Hill Village
Occupancy by Ownership in Bunker Hill Village
Of the total 1,159 dwellings in Bunker Hill Village, owner-occupied units account for 1,095 (94.5%), while renter-occupied units make up 64 (5.5%).
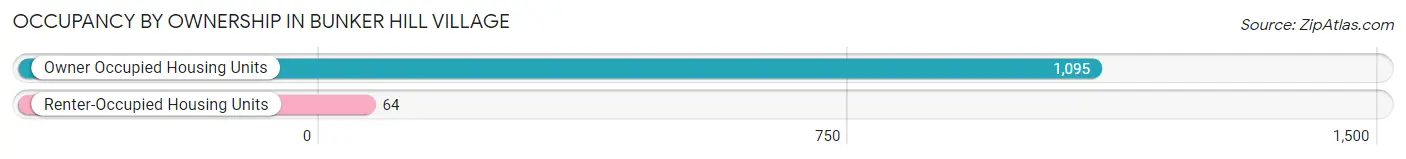
| Occupancy | # Housing Units | % Housing Units |
| Owner Occupied Housing Units | 1,095 | 94.5% |
| Renter-Occupied Housing Units | 64 | 5.5% |
| Total Occupied Housing Units | 1,159 | 100.0% |
Occupancy by Household Size in Bunker Hill Village
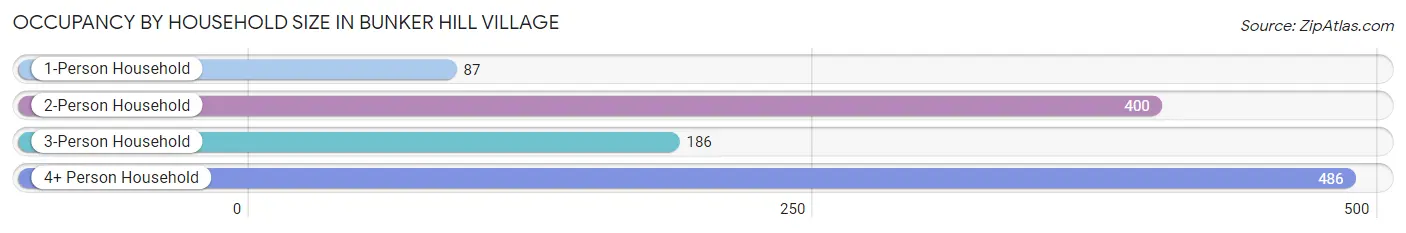
| Household Size | # Housing Units | % Housing Units |
| 1-Person Household | 87 | 7.5% |
| 2-Person Household | 400 | 34.5% |
| 3-Person Household | 186 | 16.1% |
| 4+ Person Household | 486 | 41.9% |
| Total Housing Units | 1,159 | 100.0% |
Occupancy by Ownership by Household Size in Bunker Hill Village
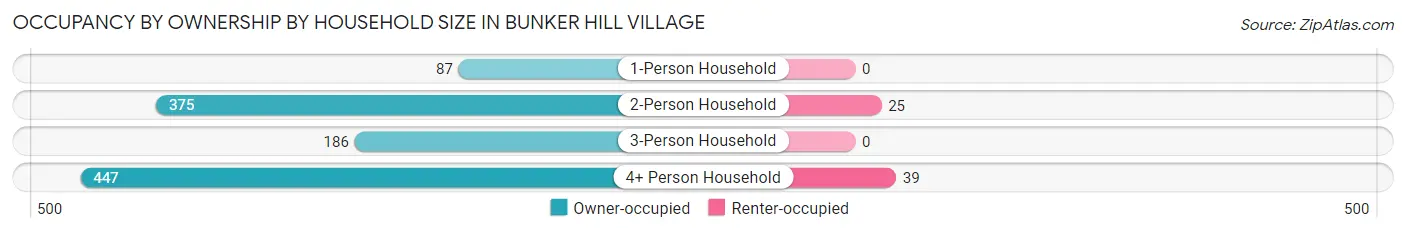
| Household Size | Owner-occupied | Renter-occupied |
| 1-Person Household | 87 (100.0%) | 0 (0.0%) |
| 2-Person Household | 375 (93.8%) | 25 (6.2%) |
| 3-Person Household | 186 (100.0%) | 0 (0.0%) |
| 4+ Person Household | 447 (92.0%) | 39 (8.0%) |
| Total Housing Units | 1,095 (94.5%) | 64 (5.5%) |
Occupancy by Educational Attainment in Bunker Hill Village
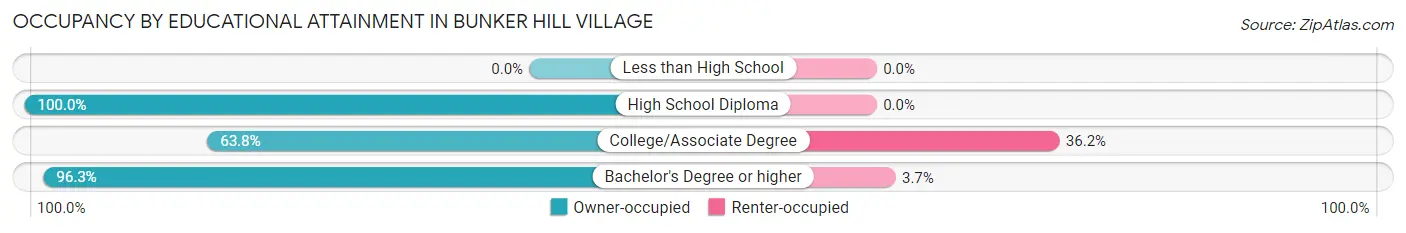
| Household Size | Owner-occupied | Renter-occupied |
| Less than High School | 0 (0.0%) | 0 (0.0%) |
| High School Diploma | 47 (100.0%) | 0 (0.0%) |
| College/Associate Degree | 44 (63.8%) | 25 (36.2%) |
| Bachelor's Degree or higher | 1,004 (96.3%) | 39 (3.7%) |
Occupancy by Age of Householder in Bunker Hill Village
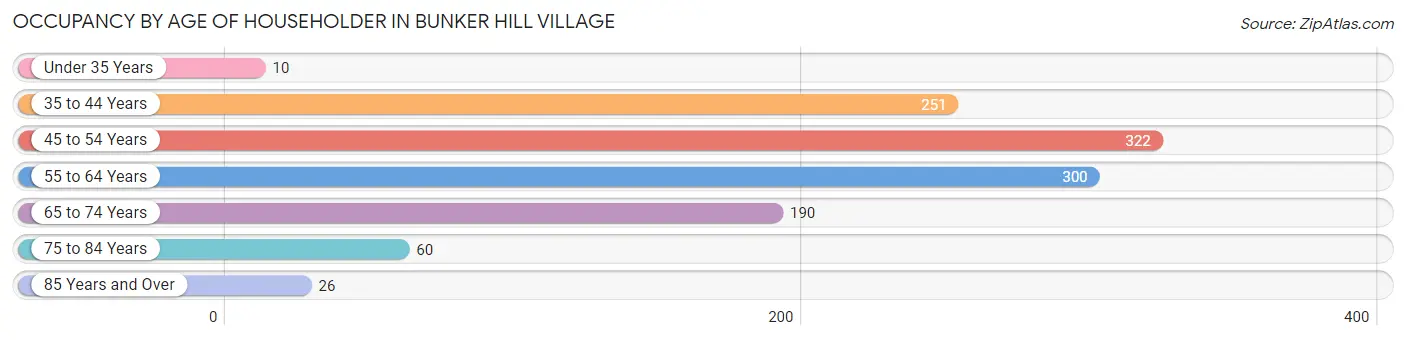
| Age Bracket | # Households | % Households |
| Under 35 Years | 10 | 0.9% |
| 35 to 44 Years | 251 | 21.7% |
| 45 to 54 Years | 322 | 27.8% |
| 55 to 64 Years | 300 | 25.9% |
| 65 to 74 Years | 190 | 16.4% |
| 75 to 84 Years | 60 | 5.2% |
| 85 Years and Over | 26 | 2.2% |
| Total | 1,159 | 100.0% |
Housing Finances in Bunker Hill Village
Median Income by Occupancy in Bunker Hill Village
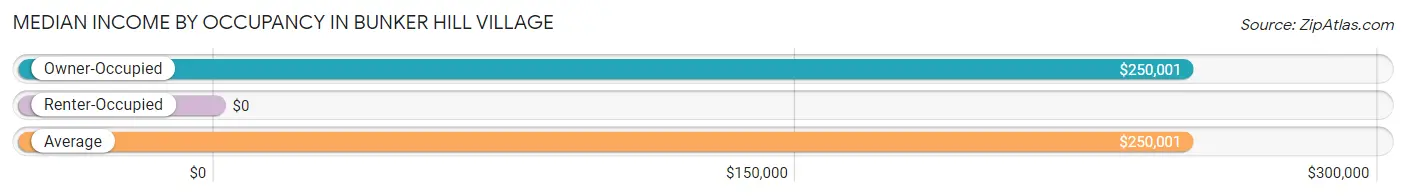
| Occupancy Type | # Households | Median Income |
| Owner-Occupied | 1,095 (94.5%) | $250,001 |
| Renter-Occupied | 64 (5.5%) | $0 |
| Average | 1,159 (100.0%) | $250,001 |
Occupancy by Householder Income Bracket in Bunker Hill Village
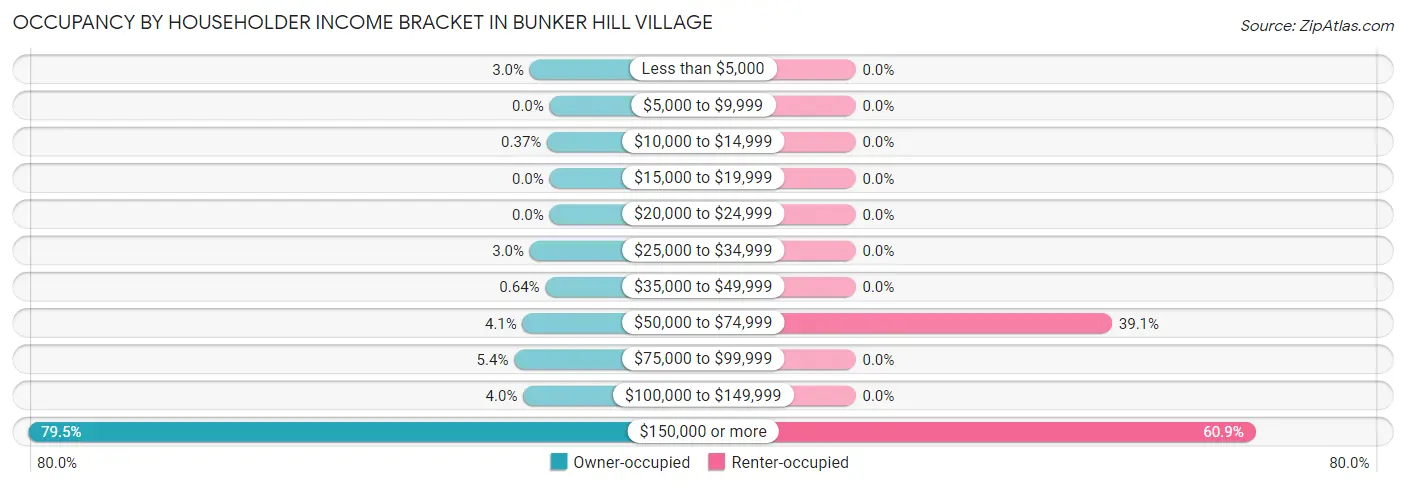
| Income Bracket | Owner-occupied | Renter-occupied |
| Less than $5,000 | 33 (3.0%) | 0 (0.0%) |
| $5,000 to $9,999 | 0 (0.0%) | 0 (0.0%) |
| $10,000 to $14,999 | 4 (0.4%) | 0 (0.0%) |
| $15,000 to $19,999 | 0 (0.0%) | 0 (0.0%) |
| $20,000 to $24,999 | 0 (0.0%) | 0 (0.0%) |
| $25,000 to $34,999 | 33 (3.0%) | 0 (0.0%) |
| $35,000 to $49,999 | 7 (0.6%) | 0 (0.0%) |
| $50,000 to $74,999 | 45 (4.1%) | 25 (39.1%) |
| $75,000 to $99,999 | 59 (5.4%) | 0 (0.0%) |
| $100,000 to $149,999 | 44 (4.0%) | 0 (0.0%) |
| $150,000 or more | 870 (79.4%) | 39 (60.9%) |
| Total | 1,095 (100.0%) | 64 (100.0%) |
Monthly Housing Cost Tiers in Bunker Hill Village
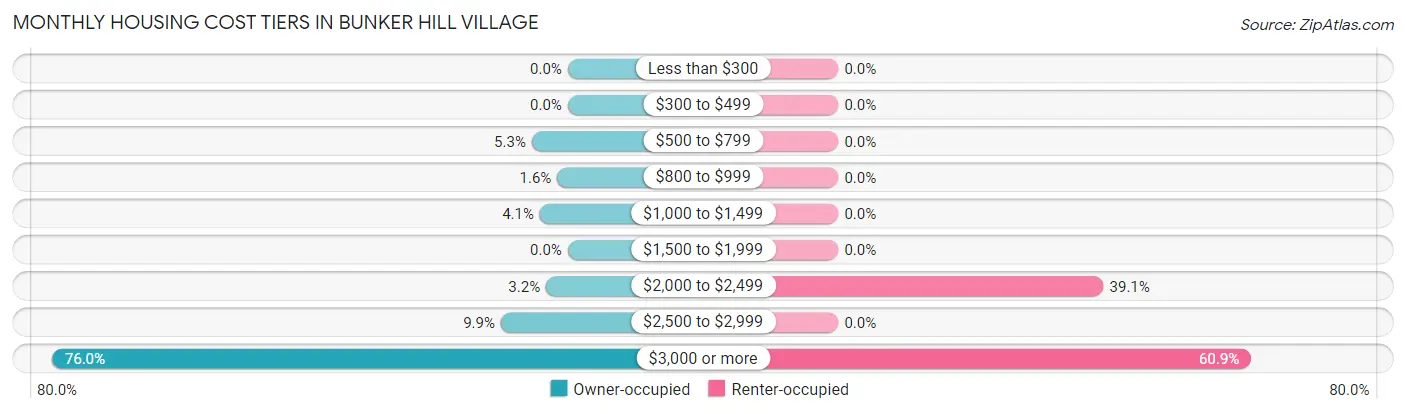
| Monthly Cost | Owner-occupied | Renter-occupied |
| Less than $300 | 0 (0.0%) | 0 (0.0%) |
| $300 to $499 | 0 (0.0%) | 0 (0.0%) |
| $500 to $799 | 58 (5.3%) | 0 (0.0%) |
| $800 to $999 | 17 (1.5%) | 0 (0.0%) |
| $1,000 to $1,499 | 45 (4.1%) | 0 (0.0%) |
| $1,500 to $1,999 | 0 (0.0%) | 0 (0.0%) |
| $2,000 to $2,499 | 35 (3.2%) | 25 (39.1%) |
| $2,500 to $2,999 | 108 (9.9%) | 0 (0.0%) |
| $3,000 or more | 832 (76.0%) | 39 (60.9%) |
| Total | 1,095 (100.0%) | 64 (100.0%) |
Physical Housing Characteristics in Bunker Hill Village
Housing Structures in Bunker Hill Village
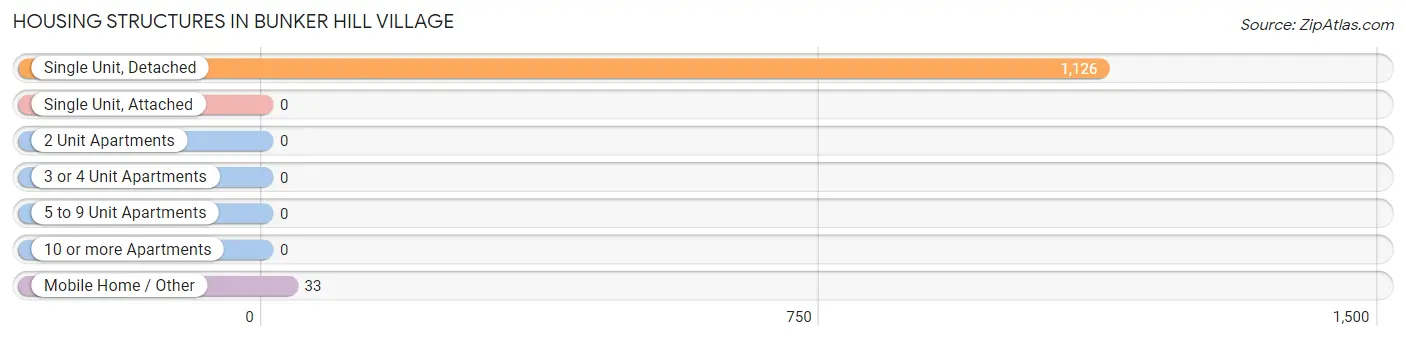
| Structure Type | # Housing Units | % Housing Units |
| Single Unit, Detached | 1,126 | 97.2% |
| Single Unit, Attached | 0 | 0.0% |
| 2 Unit Apartments | 0 | 0.0% |
| 3 or 4 Unit Apartments | 0 | 0.0% |
| 5 to 9 Unit Apartments | 0 | 0.0% |
| 10 or more Apartments | 0 | 0.0% |
| Mobile Home / Other | 33 | 2.9% |
| Total | 1,159 | 100.0% |
Housing Structures by Occupancy in Bunker Hill Village
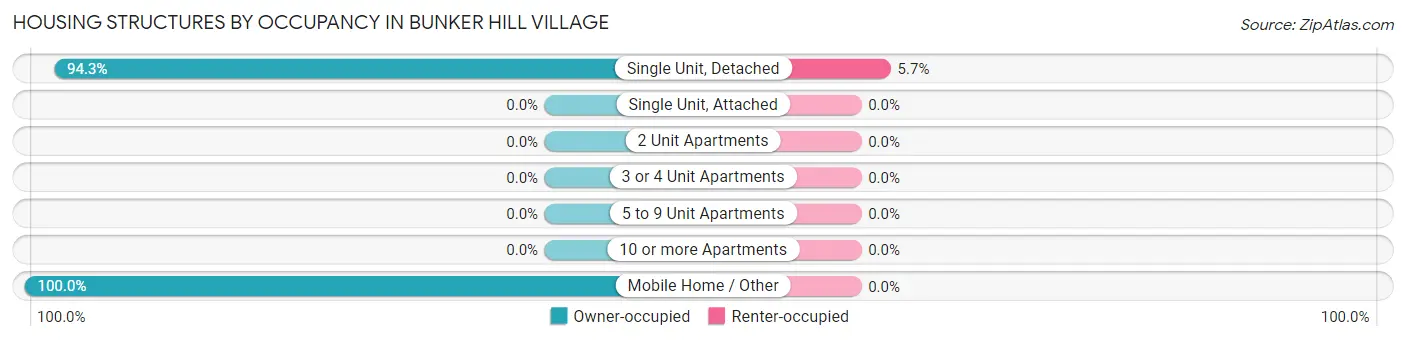
| Structure Type | Owner-occupied | Renter-occupied |
| Single Unit, Detached | 1,062 (94.3%) | 64 (5.7%) |
| Single Unit, Attached | 0 (0.0%) | 0 (0.0%) |
| 2 Unit Apartments | 0 (0.0%) | 0 (0.0%) |
| 3 or 4 Unit Apartments | 0 (0.0%) | 0 (0.0%) |
| 5 to 9 Unit Apartments | 0 (0.0%) | 0 (0.0%) |
| 10 or more Apartments | 0 (0.0%) | 0 (0.0%) |
| Mobile Home / Other | 33 (100.0%) | 0 (0.0%) |
| Total | 1,095 (94.5%) | 64 (5.5%) |
Housing Structures by Number of Rooms in Bunker Hill Village
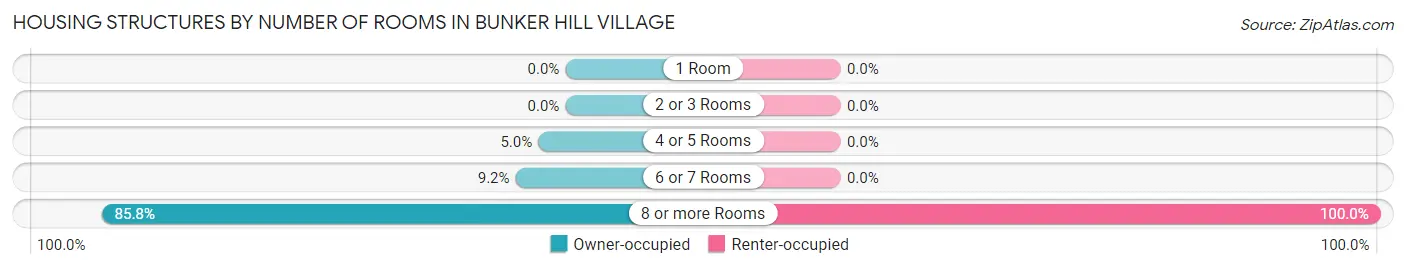
| Number of Rooms | Owner-occupied | Renter-occupied |
| 1 Room | 0 (0.0%) | 0 (0.0%) |
| 2 or 3 Rooms | 0 (0.0%) | 0 (0.0%) |
| 4 or 5 Rooms | 55 (5.0%) | 0 (0.0%) |
| 6 or 7 Rooms | 101 (9.2%) | 0 (0.0%) |
| 8 or more Rooms | 939 (85.8%) | 64 (100.0%) |
| Total | 1,095 (100.0%) | 64 (100.0%) |
Housing Structure by Heating Type in Bunker Hill Village
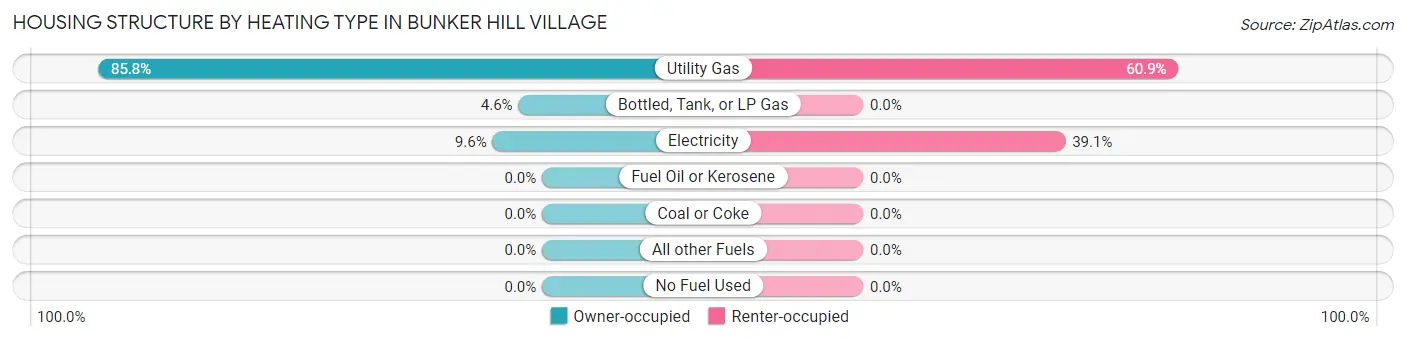
| Heating Type | Owner-occupied | Renter-occupied |
| Utility Gas | 940 (85.8%) | 39 (60.9%) |
| Bottled, Tank, or LP Gas | 50 (4.6%) | 0 (0.0%) |
| Electricity | 105 (9.6%) | 25 (39.1%) |
| Fuel Oil or Kerosene | 0 (0.0%) | 0 (0.0%) |
| Coal or Coke | 0 (0.0%) | 0 (0.0%) |
| All other Fuels | 0 (0.0%) | 0 (0.0%) |
| No Fuel Used | 0 (0.0%) | 0 (0.0%) |
| Total | 1,095 (100.0%) | 64 (100.0%) |
Household Vehicle Usage in Bunker Hill Village
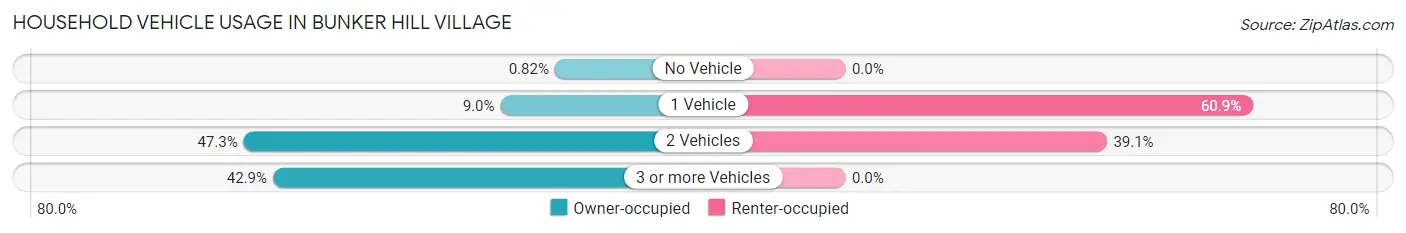
| Vehicles per Household | Owner-occupied | Renter-occupied |
| No Vehicle | 9 (0.8%) | 0 (0.0%) |
| 1 Vehicle | 98 (8.9%) | 39 (60.9%) |
| 2 Vehicles | 518 (47.3%) | 25 (39.1%) |
| 3 or more Vehicles | 470 (42.9%) | 0 (0.0%) |
| Total | 1,095 (100.0%) | 64 (100.0%) |
Real Estate & Mortgages in Bunker Hill Village
Real Estate and Mortgage Overview in Bunker Hill Village
| Characteristic | Without Mortgage | With Mortgage |
| Housing Units | 526 | 569 |
| Median Property Value | $2,000,001 | $2,000,001 |
| Median Household Income | $208,864 | $515 |
| Monthly Housing Costs | $1,501 | $552 |
| Real Estate Taxes | $10,001 | $0 |
Property Value by Mortgage Status in Bunker Hill Village
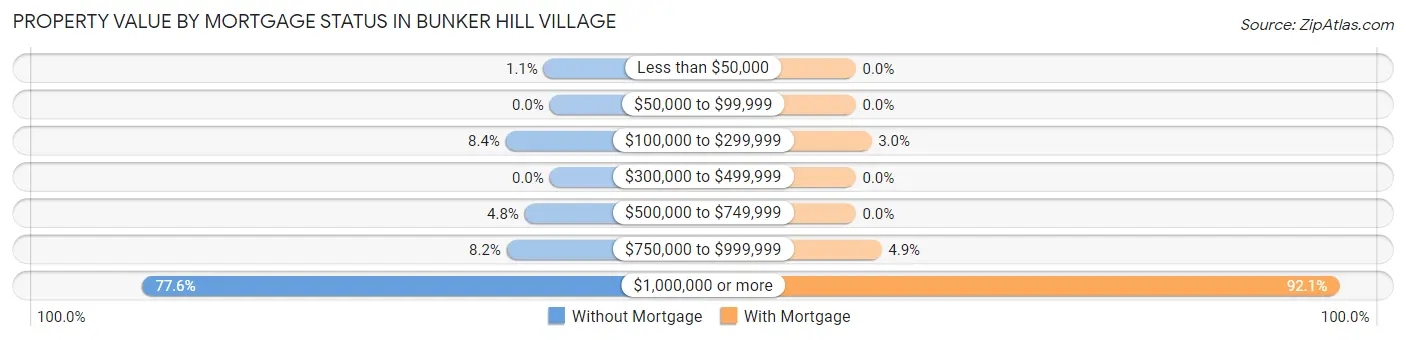
| Property Value | Without Mortgage | With Mortgage |
| Less than $50,000 | 6 (1.1%) | 0 (0.0%) |
| $50,000 to $99,999 | 0 (0.0%) | 0 (0.0%) |
| $100,000 to $299,999 | 44 (8.4%) | 17 (3.0%) |
| $300,000 to $499,999 | 0 (0.0%) | 0 (0.0%) |
| $500,000 to $749,999 | 25 (4.8%) | 0 (0.0%) |
| $750,000 to $999,999 | 43 (8.2%) | 28 (4.9%) |
| $1,000,000 or more | 408 (77.6%) | 524 (92.1%) |
| Total | 526 (100.0%) | 569 (100.0%) |
Household Income by Mortgage Status in Bunker Hill Village
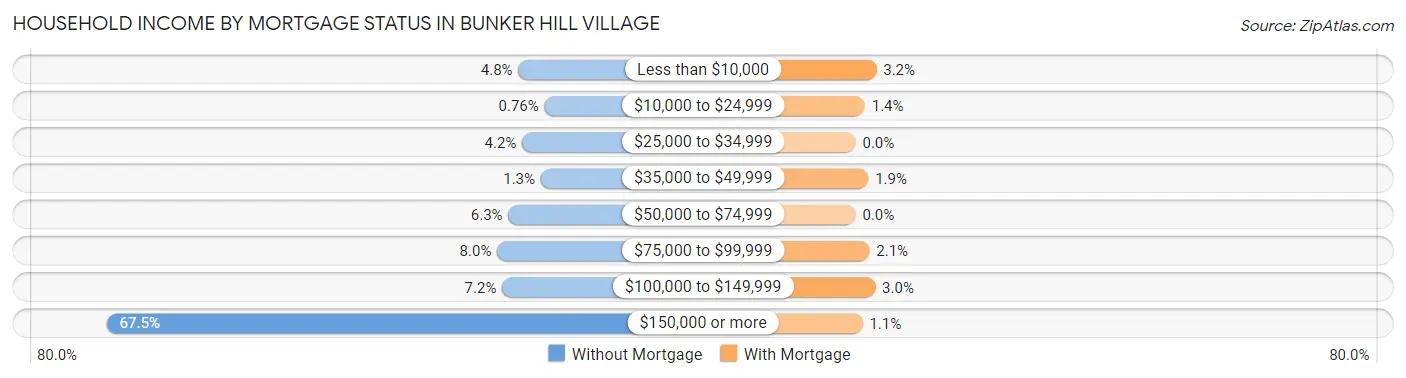
| Household Income | Without Mortgage | With Mortgage |
| Less than $10,000 | 25 (4.8%) | 18 (3.2%) |
| $10,000 to $24,999 | 4 (0.8%) | 8 (1.4%) |
| $25,000 to $34,999 | 22 (4.2%) | 0 (0.0%) |
| $35,000 to $49,999 | 7 (1.3%) | 11 (1.9%) |
| $50,000 to $74,999 | 33 (6.3%) | 0 (0.0%) |
| $75,000 to $99,999 | 42 (8.0%) | 12 (2.1%) |
| $100,000 to $149,999 | 38 (7.2%) | 17 (3.0%) |
| $150,000 or more | 355 (67.5%) | 6 (1.1%) |
| Total | 526 (100.0%) | 569 (100.0%) |
Property Value to Household Income Ratio in Bunker Hill Village
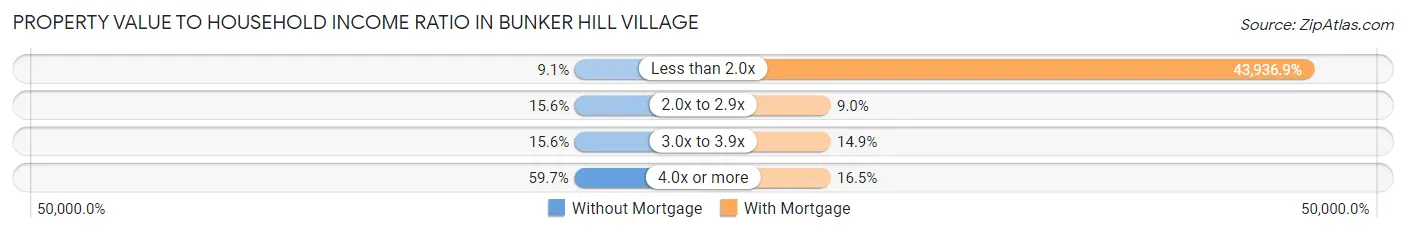
| Value-to-Income Ratio | Without Mortgage | With Mortgage |
| Less than 2.0x | 48 (9.1%) | 250,001 (43,936.9%) |
| 2.0x to 2.9x | 82 (15.6%) | 51 (9.0%) |
| 3.0x to 3.9x | 82 (15.6%) | 85 (14.9%) |
| 4.0x or more | 314 (59.7%) | 94 (16.5%) |
| Total | 526 (100.0%) | 569 (100.0%) |
Real Estate Taxes by Mortgage Status in Bunker Hill Village
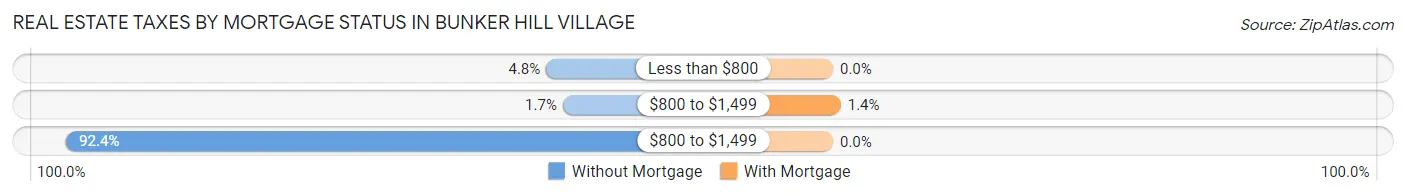
| Property Taxes | Without Mortgage | With Mortgage |
| Less than $800 | 25 (4.8%) | 0 (0.0%) |
| $800 to $1,499 | 9 (1.7%) | 8 (1.4%) |
| $800 to $1,499 | 486 (92.4%) | 0 (0.0%) |
| Total | 526 (100.0%) | 569 (100.0%) |
Health & Disability in Bunker Hill Village
Health Insurance Coverage by Age in Bunker Hill Village
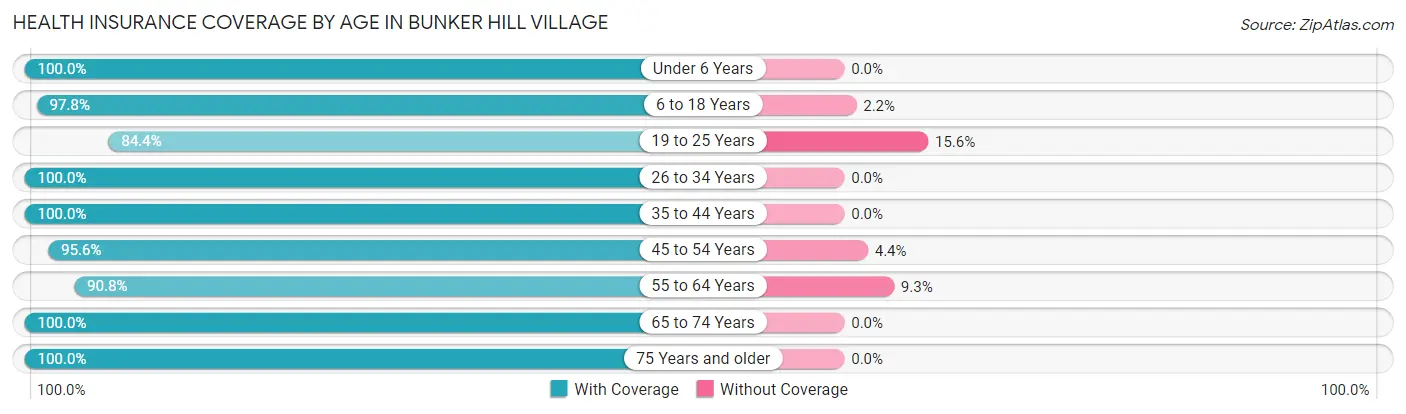
| Age Bracket | With Coverage | Without Coverage |
| Under 6 Years | 163 (100.0%) | 0 (0.0%) |
| 6 to 18 Years | 1,185 (97.8%) | 27 (2.2%) |
| 19 to 25 Years | 162 (84.4%) | 30 (15.6%) |
| 26 to 34 Years | 58 (100.0%) | 0 (0.0%) |
| 35 to 44 Years | 502 (100.0%) | 0 (0.0%) |
| 45 to 54 Years | 568 (95.6%) | 26 (4.4%) |
| 55 to 64 Years | 569 (90.7%) | 58 (9.2%) |
| 65 to 74 Years | 292 (100.0%) | 0 (0.0%) |
| 75 Years and older | 180 (100.0%) | 0 (0.0%) |
| Total | 3,679 (96.3%) | 141 (3.7%) |
Health Insurance Coverage by Citizenship Status in Bunker Hill Village
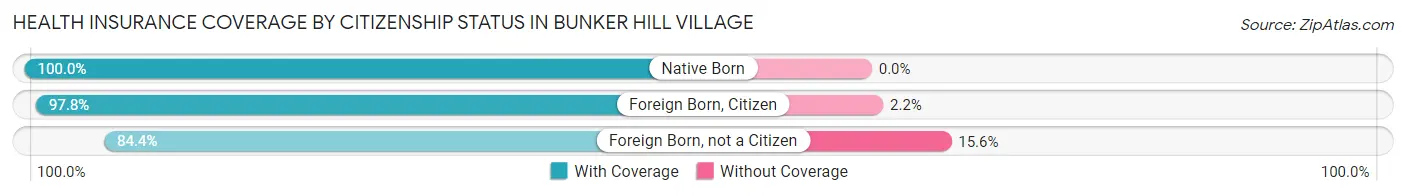
| Citizenship Status | With Coverage | Without Coverage |
| Native Born | 163 (100.0%) | 0 (0.0%) |
| Foreign Born, Citizen | 1,185 (97.8%) | 27 (2.2%) |
| Foreign Born, not a Citizen | 162 (84.4%) | 30 (15.6%) |
Health Insurance Coverage by Household Income in Bunker Hill Village
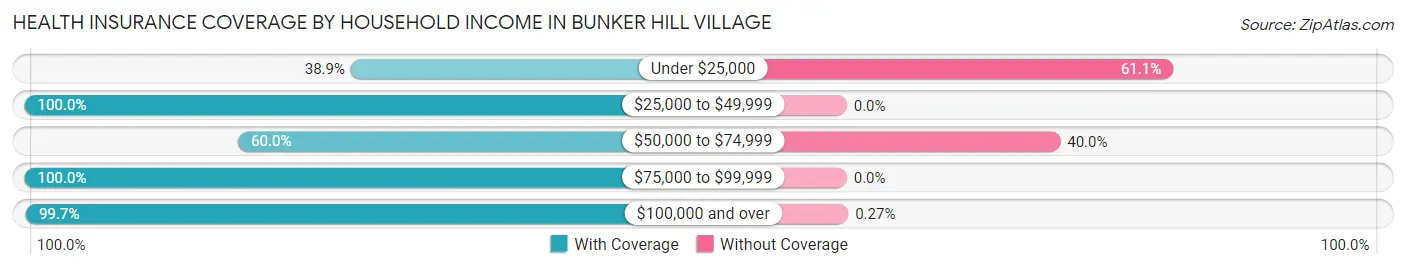
| Household Income | With Coverage | Without Coverage |
| Under $25,000 | 49 (38.9%) | 77 (61.1%) |
| $25,000 to $49,999 | 63 (100.0%) | 0 (0.0%) |
| $50,000 to $74,999 | 78 (60.0%) | 52 (40.0%) |
| $75,000 to $99,999 | 115 (100.0%) | 0 (0.0%) |
| $100,000 and over | 3,368 (99.7%) | 9 (0.3%) |
Public vs Private Health Insurance Coverage by Age in Bunker Hill Village
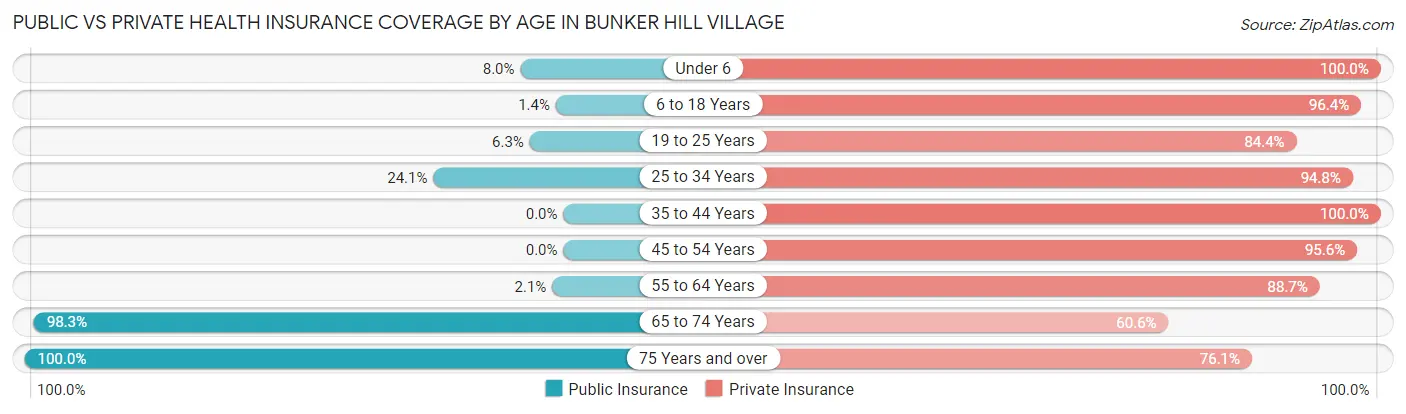
| Age Bracket | Public Insurance | Private Insurance |
| Under 6 | 13 (8.0%) | 163 (100.0%) |
| 6 to 18 Years | 17 (1.4%) | 1,168 (96.4%) |
| 19 to 25 Years | 12 (6.2%) | 162 (84.4%) |
| 25 to 34 Years | 14 (24.1%) | 55 (94.8%) |
| 35 to 44 Years | 0 (0.0%) | 502 (100.0%) |
| 45 to 54 Years | 0 (0.0%) | 568 (95.6%) |
| 55 to 64 Years | 13 (2.1%) | 556 (88.7%) |
| 65 to 74 Years | 287 (98.3%) | 177 (60.6%) |
| 75 Years and over | 180 (100.0%) | 137 (76.1%) |
| Total | 536 (14.0%) | 3,488 (91.3%) |
Disability Status by Sex by Age in Bunker Hill Village
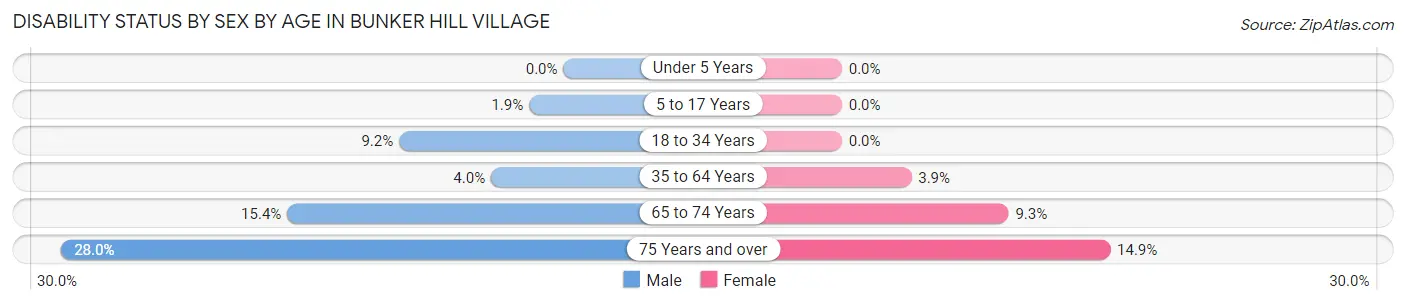
| Age Bracket | Male | Female |
| Under 5 Years | 0 (0.0%) | 0 (0.0%) |
| 5 to 17 Years | 11 (1.9%) | 0 (0.0%) |
| 18 to 34 Years | 15 (9.1%) | 0 (0.0%) |
| 35 to 64 Years | 34 (4.0%) | 34 (3.9%) |
| 65 to 74 Years | 30 (15.4%) | 9 (9.3%) |
| 75 Years and over | 26 (28.0%) | 13 (14.9%) |
Disability Class by Sex by Age in Bunker Hill Village
Disability Class: Hearing Difficulty
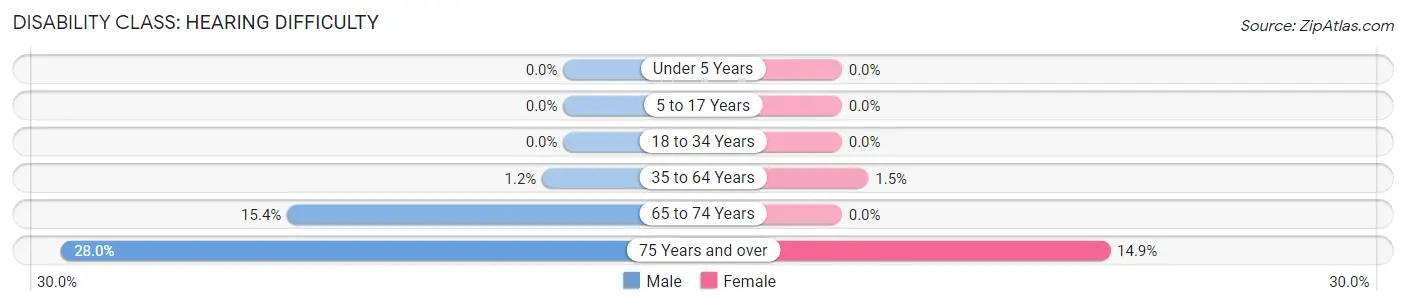
| Age Bracket | Male | Female |
| Under 5 Years | 0 (0.0%) | 0 (0.0%) |
| 5 to 17 Years | 0 (0.0%) | 0 (0.0%) |
| 18 to 34 Years | 0 (0.0%) | 0 (0.0%) |
| 35 to 64 Years | 10 (1.2%) | 13 (1.5%) |
| 65 to 74 Years | 30 (15.4%) | 0 (0.0%) |
| 75 Years and over | 26 (28.0%) | 13 (14.9%) |
Disability Class: Vision Difficulty
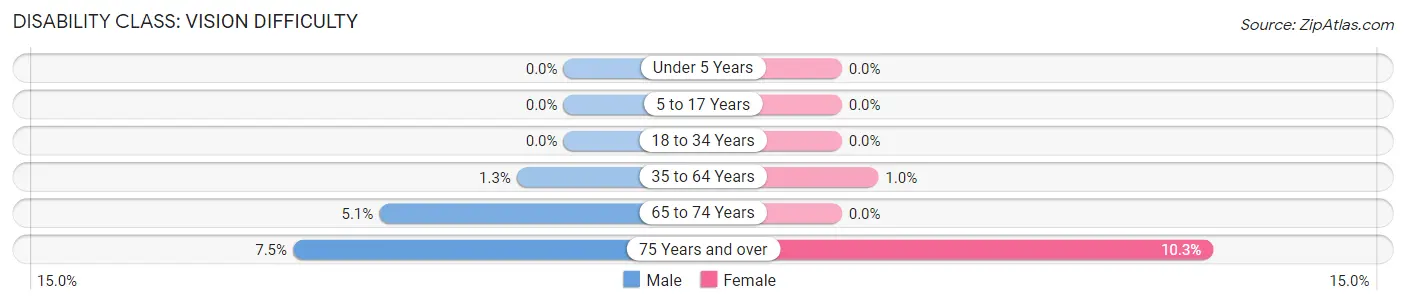
| Age Bracket | Male | Female |
| Under 5 Years | 0 (0.0%) | 0 (0.0%) |
| 5 to 17 Years | 0 (0.0%) | 0 (0.0%) |
| 18 to 34 Years | 0 (0.0%) | 0 (0.0%) |
| 35 to 64 Years | 11 (1.3%) | 9 (1.0%) |
| 65 to 74 Years | 10 (5.1%) | 0 (0.0%) |
| 75 Years and over | 7 (7.5%) | 9 (10.3%) |
Disability Class: Cognitive Difficulty
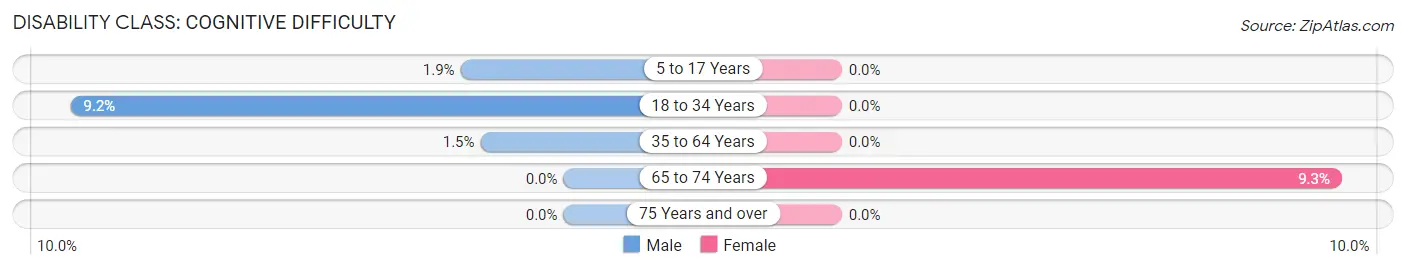
| Age Bracket | Male | Female |
| 5 to 17 Years | 11 (1.9%) | 0 (0.0%) |
| 18 to 34 Years | 15 (9.1%) | 0 (0.0%) |
| 35 to 64 Years | 13 (1.5%) | 0 (0.0%) |
| 65 to 74 Years | 0 (0.0%) | 9 (9.3%) |
| 75 Years and over | 0 (0.0%) | 0 (0.0%) |
Disability Class: Ambulatory Difficulty
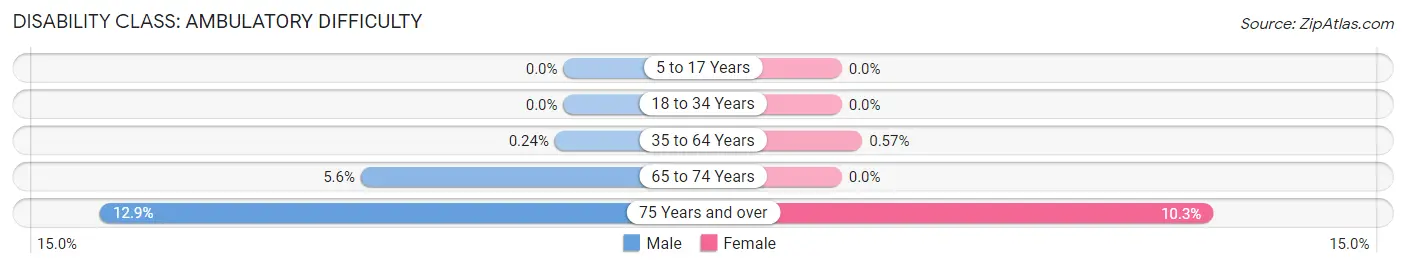
| Age Bracket | Male | Female |
| 5 to 17 Years | 0 (0.0%) | 0 (0.0%) |
| 18 to 34 Years | 0 (0.0%) | 0 (0.0%) |
| 35 to 64 Years | 2 (0.2%) | 5 (0.6%) |
| 65 to 74 Years | 11 (5.6%) | 0 (0.0%) |
| 75 Years and over | 12 (12.9%) | 9 (10.3%) |
Disability Class: Self-Care Difficulty
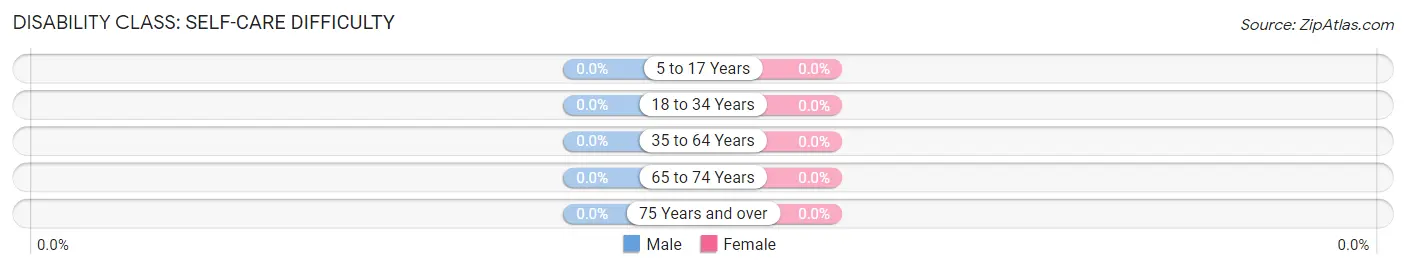
| Age Bracket | Male | Female |
| 5 to 17 Years | 0 (0.0%) | 0 (0.0%) |
| 18 to 34 Years | 0 (0.0%) | 0 (0.0%) |
| 35 to 64 Years | 0 (0.0%) | 0 (0.0%) |
| 65 to 74 Years | 0 (0.0%) | 0 (0.0%) |
| 75 Years and over | 0 (0.0%) | 0 (0.0%) |
Technology Access in Bunker Hill Village
Computing Device Access in Bunker Hill Village
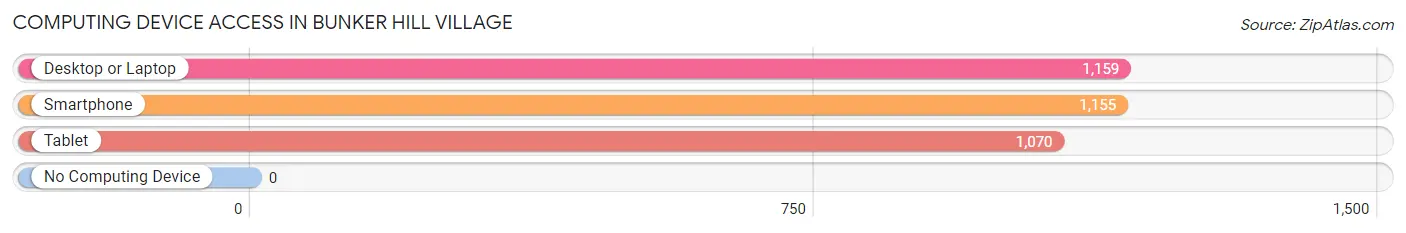
| Device Type | # Households | % Households |
| Desktop or Laptop | 1,159 | 100.0% |
| Smartphone | 1,155 | 99.7% |
| Tablet | 1,070 | 92.3% |
| No Computing Device | 0 | 0.0% |
| Total | 1,159 | 100.0% |
Internet Access in Bunker Hill Village
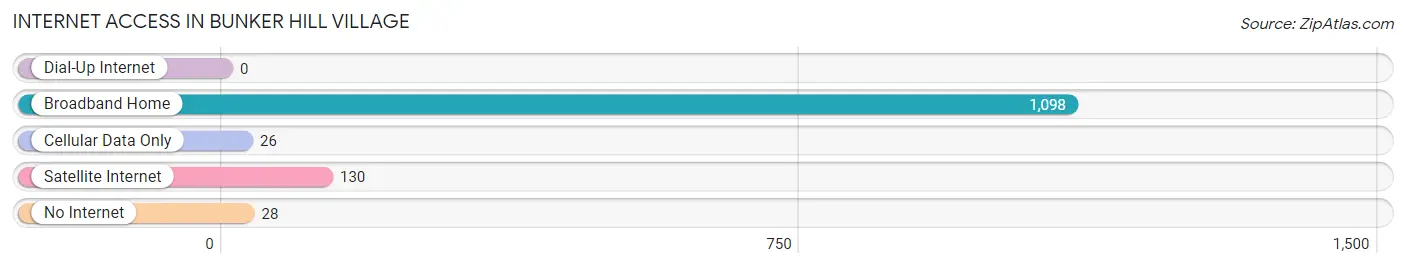
| Internet Type | # Households | % Households |
| Dial-Up Internet | 0 | 0.0% |
| Broadband Home | 1,098 | 94.7% |
| Cellular Data Only | 26 | 2.2% |
| Satellite Internet | 130 | 11.2% |
| No Internet | 28 | 2.4% |
| Total | 1,159 | 100.0% |
Bunker Hill Village Summary
Bunker Hill Village is a city located in Harris County, Texas, United States. It is an affluent suburb of Houston and is part of the Greater Houston metropolitan area. The population was 3,633 at the 2010 census.
History
Bunker Hill Village was founded in 1954 by oilman and real estate developer William G. Farrington. Farrington purchased the land from the Bunker Hill Land Company, which was owned by the family of former Texas Governor Ross Sterling. Farrington named the city after the Battle of Bunker Hill, which was fought during the American Revolutionary War.
The city was incorporated in 1955 and was the first city in Harris County to be incorporated since the 1950s. The city was designed to be a residential community and was planned to have a population of 10,000.
Geography
Bunker Hill Village is located in western Harris County at 29°45'17" North, 95°35'17" West (29.754722, -95.588333). It is bordered to the north by the city of Houston, to the east by the city of Jersey Village, to the south by the city of Piney Point Village, and to the west by the city of Hunters Creek Village.
According to the United States Census Bureau, the city has a total area of 2.2 square miles (5.7 km2), all of it land.
Economy
Bunker Hill Village is a wealthy suburb of Houston and is home to many affluent residents. The city has a strong economy and is home to many businesses, including oil and gas companies, financial services firms, and medical and healthcare providers.
Demographics
As of the census of 2010, there were 3,633 people, 1,541 households, and 1,093 families residing in the city. The population density was 1,637.2 people per square mile (631.2/km2). There were 1,637 housing units at an average density of 735.2 per square mile (284.2/km2). The racial makeup of the city was 91.2% White, 2.2% African American, 0.2% Native American, 4.2% Asian, 0.1% Pacific Islander, 0.9% from other races, and 1.2% from two or more races. Hispanic or Latino of any race were 4.3% of the population.
There were 1,541 households, out of which 28.2% had children under the age of 18 living with them, 63.2% were married couples living together, 6.2% had a female householder with no husband present, and 28.7% were non-families. 24.2% of all households were made up of individuals, and 11.2% had someone living alone who was 65 years of age or older. The average household size was 2.37 and the average family size was 2.83.
In the city, the population was spread out, with 22.2% under the age of 18, 4.2% from 18 to 24, 22.2% from 25 to 44, 33.2% from 45 to 64, and 18.2% who were 65 years of age or older. The median age was 45 years. For every 100 females, there were 93.2 males. For every 100 females age 18 and over, there were 91.2 males.
The median income for a household in the city was $150,000, and the median income for a family was $175,000. Males had a median income of $100,000 versus $50,000 for females. The per capita income for the city was $80,000. About 2.2% of families and 3.2% of the population were below the poverty line, including 3.2% of those under age 18 and 3.2% of those age 65 or over.
Common Questions
What is Per Capita Income in Bunker Hill Village?
Per Capita income in Bunker Hill Village is $132,835.
What is the Median Family Income in Bunker Hill Village?
Median Family Income in Bunker Hill Village is $250,001.
What is the Median Household income in Bunker Hill Village?
Median Household Income in Bunker Hill Village is $250,001.
What is Income or Wage Gap in Bunker Hill Village?
Income or Wage Gap in Bunker Hill Village is 83.6%.
Women in Bunker Hill Village earn 16.4 cents for every dollar earned by a man.
What is Family Income Deficit in Bunker Hill Village?
Family Income Deficit in Bunker Hill Village is $19,527.
Families that are below poverty line in Bunker Hill Village earn $19,527 less on average than the poverty threshold level.
What is Inequality or Gini Index in Bunker Hill Village?
Inequality or Gini Index in Bunker Hill Village is 0.44.
What is the Total Population of Bunker Hill Village?
Total Population of Bunker Hill Village is 3,820.
What is the Total Male Population of Bunker Hill Village?
Total Male Population of Bunker Hill Village is 1,907.
What is the Total Female Population of Bunker Hill Village?
Total Female Population of Bunker Hill Village is 1,913.
What is the Ratio of Males per 100 Females in Bunker Hill Village?
There are 99.69 Males per 100 Females in Bunker Hill Village.
What is the Ratio of Females per 100 Males in Bunker Hill Village?
There are 100.31 Females per 100 Males in Bunker Hill Village.
What is the Median Population Age in Bunker Hill Village?
Median Population Age in Bunker Hill Village is 42.2 Years.
What is the Average Family Size in Bunker Hill Village
Average Family Size in Bunker Hill Village is 3.5 People.
What is the Average Household Size in Bunker Hill Village
Average Household Size in Bunker Hill Village is 3.3 People.
How Large is the Labor Force in Bunker Hill Village?
There are 1,473 People in the Labor Forcein in Bunker Hill Village.
What is the Percentage of People in the Labor Force in Bunker Hill Village?
52.7% of People are in the Labor Force in Bunker Hill Village.
What is the Unemployment Rate in Bunker Hill Village?
Unemployment Rate in Bunker Hill Village is 3.6%.