San Angelo, TX Map & Demographics
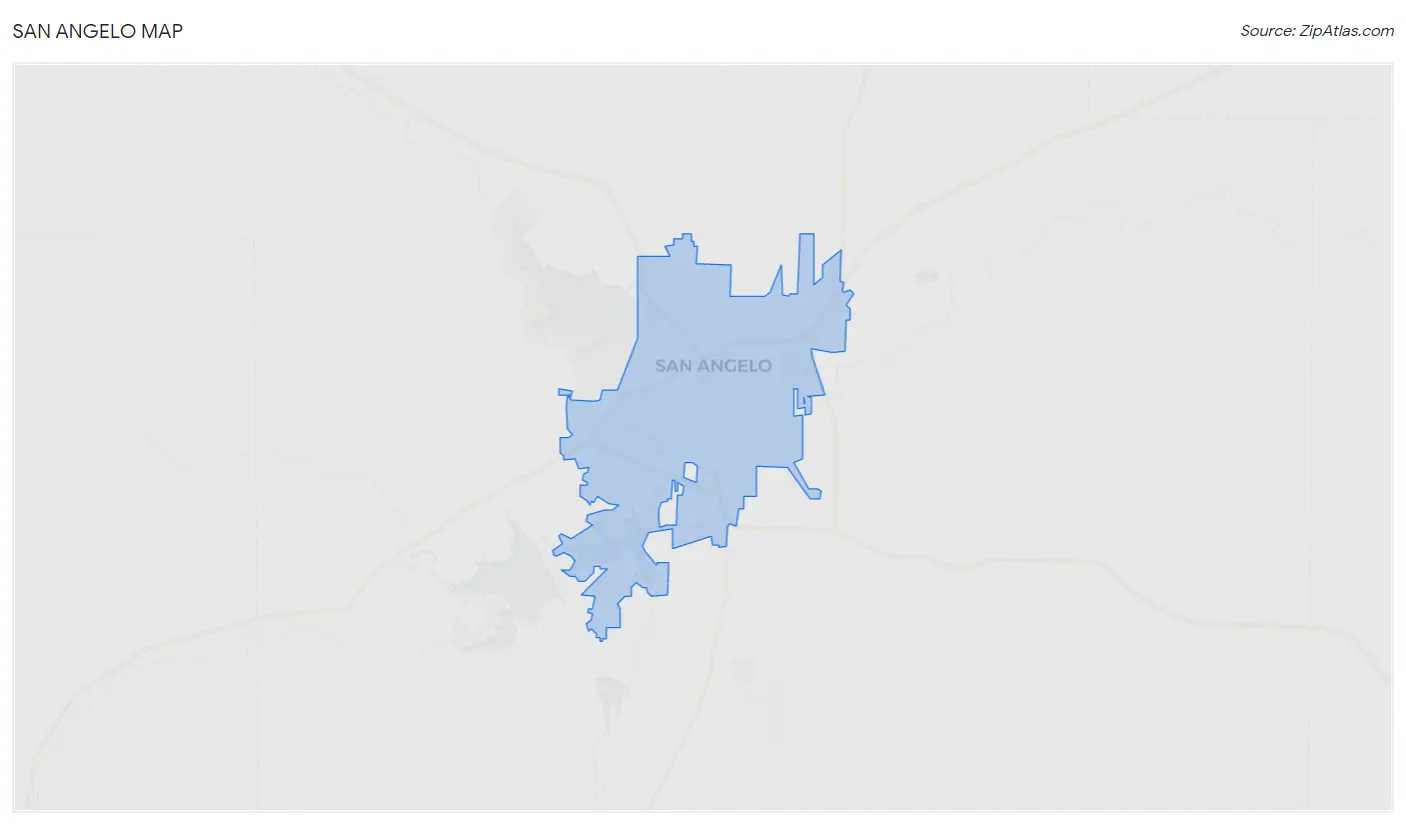
San Angelo Map
San Angelo Overview
$33,179
PER CAPITA INCOME
$79,409
AVG FAMILY INCOME
$65,040
AVG HOUSEHOLD INCOME
29.1%
WAGE / INCOME GAP [ % ]
70.9¢/ $1
WAGE / INCOME GAP [ $ ]
$12,168
FAMILY INCOME DEFICIT
0.44
INEQUALITY / GINI INDEX
99,422
TOTAL POPULATION
49,733
MALE POPULATION
49,689
FEMALE POPULATION
100.09
MALES / 100 FEMALES
99.91
FEMALES / 100 MALES
34.7
MEDIAN AGE
3.1
AVG FAMILY SIZE
2.4
AVG HOUSEHOLD SIZE
51,648
LABOR FORCE [ PEOPLE ]
65.4%
PERCENT IN LABOR FORCE
3.2%
UNEMPLOYMENT RATE
San Angelo Area Codes
Income in San Angelo
Income Overview in San Angelo
Per Capita Income in San Angelo is $33,179, while median incomes of families and households are $79,409 and $65,040 respectively.
| Characteristic | Number | Measure |
| Per Capita Income | 99,422 | $33,179 |
| Median Family Income | 24,107 | $79,409 |
| Mean Family Income | 24,107 | $96,558 |
| Median Household Income | 38,447 | $65,040 |
| Mean Household Income | 38,447 | $83,004 |
| Income Deficit | 24,107 | $12,168 |
| Wage / Income Gap (%) | 99,422 | 29.06% |
| Wage / Income Gap ($) | 99,422 | 70.94¢ per $1 |
| Gini / Inequality Index | 99,422 | 0.44 |
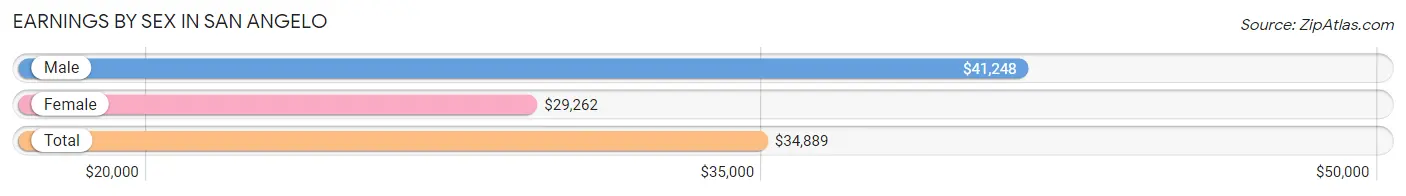
Earnings by Sex in San Angelo
Average Earnings in San Angelo are $34,889, $41,248 for men and $29,262 for women, a difference of 29.1%.
| Sex | Number | Average Earnings |
| Male | 28,920 (53.7%) | $41,248 |
| Female | 24,946 (46.3%) | $29,262 |
| Total | 53,866 (100.0%) | $34,889 |
Earnings by Sex by Income Bracket in San Angelo
The most common earnings brackets in San Angelo are $75,000 to $99,999 for men (3,373 | 11.7%) and $25,000 to $29,999 for women (2,632 | 10.5%).
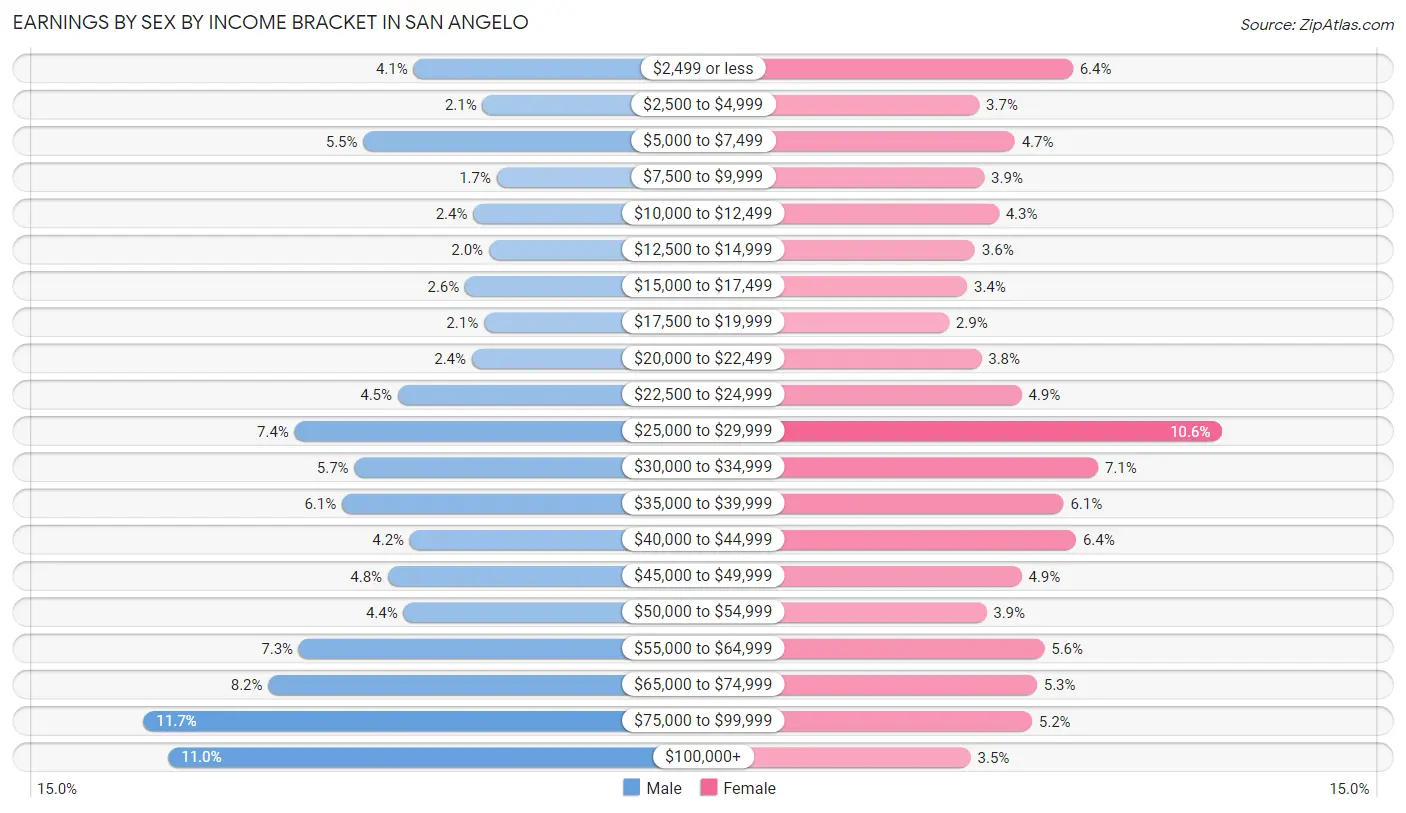
| Income | Male | Female |
| $2,499 or less | 1,178 (4.1%) | 1,584 (6.4%) |
| $2,500 to $4,999 | 617 (2.1%) | 929 (3.7%) |
| $5,000 to $7,499 | 1,586 (5.5%) | 1,177 (4.7%) |
| $7,500 to $9,999 | 501 (1.7%) | 962 (3.9%) |
| $10,000 to $12,499 | 691 (2.4%) | 1,064 (4.3%) |
| $12,500 to $14,999 | 564 (1.9%) | 897 (3.6%) |
| $15,000 to $17,499 | 757 (2.6%) | 843 (3.4%) |
| $17,500 to $19,999 | 604 (2.1%) | 717 (2.9%) |
| $20,000 to $22,499 | 702 (2.4%) | 944 (3.8%) |
| $22,500 to $24,999 | 1,304 (4.5%) | 1,226 (4.9%) |
| $25,000 to $29,999 | 2,144 (7.4%) | 2,632 (10.5%) |
| $30,000 to $34,999 | 1,656 (5.7%) | 1,761 (7.1%) |
| $35,000 to $39,999 | 1,757 (6.1%) | 1,518 (6.1%) |
| $40,000 to $44,999 | 1,206 (4.2%) | 1,607 (6.4%) |
| $45,000 to $49,999 | 1,385 (4.8%) | 1,224 (4.9%) |
| $50,000 to $54,999 | 1,259 (4.3%) | 977 (3.9%) |
| $55,000 to $64,999 | 2,107 (7.3%) | 1,385 (5.6%) |
| $65,000 to $74,999 | 2,358 (8.2%) | 1,333 (5.3%) |
| $75,000 to $99,999 | 3,373 (11.7%) | 1,297 (5.2%) |
| $100,000+ | 3,171 (11.0%) | 869 (3.5%) |
| Total | 28,920 (100.0%) | 24,946 (100.0%) |
Earnings by Sex by Educational Attainment in San Angelo
Average earnings in San Angelo are $51,463 for men and $34,403 for women, a difference of 33.2%. Men with an educational attainment of graduate degree enjoy the highest average annual earnings of $71,916, while those with less than high school education earn the least with $34,428. Women with an educational attainment of graduate degree earn the most with the average annual earnings of $60,032, while those with less than high school education have the smallest earnings of $23,918.
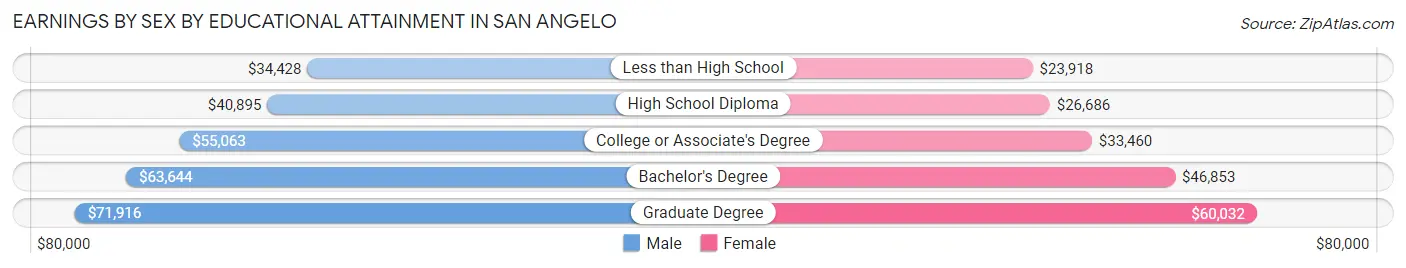
| Educational Attainment | Male Income | Female Income |
| Less than High School | $34,428 | $23,918 |
| High School Diploma | $40,895 | $26,686 |
| College or Associate's Degree | $55,063 | $33,460 |
| Bachelor's Degree | $63,644 | $46,853 |
| Graduate Degree | $71,916 | $60,032 |
| Total | $51,463 | $34,403 |
Family Income in San Angelo
Family Income Brackets in San Angelo
According to the San Angelo family income data, there are 5,472 families falling into the $100,000 to $149,999 income range, which is the most common income bracket and makes up 22.7% of all families. Conversely, the $10,000 to $14,999 income bracket is the least frequent group with only 313 families (1.3%) belonging to this category.
| Income Bracket | # Families | % Families |
| Less than $10,000 | 868 | 3.6% |
| $10,000 to $14,999 | 313 | 1.3% |
| $15,000 to $24,999 | 892 | 3.7% |
| $25,000 to $34,999 | 1,591 | 6.6% |
| $35,000 to $49,999 | 2,917 | 12.1% |
| $50,000 to $74,999 | 4,918 | 20.4% |
| $75,000 to $99,999 | 3,905 | 16.2% |
| $100,000 to $149,999 | 5,472 | 22.7% |
| $150,000 to $199,999 | 1,832 | 7.6% |
| $200,000+ | 1,398 | 5.8% |
Family Income by Famaliy Size in San Angelo
7+ person families (433 | 1.8%) account for the highest median family income in San Angelo with $141,172 per family, while 2-person families (11,659 | 48.4%) have the highest median income of $34,152 per family member.
| Income Bracket | # Families | Median Income |
| 2-Person Families | 11,659 (48.4%) | $68,304 |
| 3-Person Families | 5,200 (21.6%) | $78,583 |
| 4-Person Families | 4,001 (16.6%) | $95,375 |
| 5-Person Families | 1,966 (8.2%) | $96,630 |
| 6-Person Families | 848 (3.5%) | $125,062 |
| 7+ Person Families | 433 (1.8%) | $141,172 |
| Total | 24,107 (100.0%) | $79,409 |
Family Income by Number of Earners in San Angelo
The median family income in San Angelo is $79,409, with families comprising 3+ earners (2,759) having the highest median family income of $125,397, while families with no earners (3,506) have the lowest median family income of $44,511, accounting for 11.4% and 14.5% of families, respectively.
| Number of Earners | # Families | Median Income |
| No Earners | 3,506 (14.5%) | $44,511 |
| 1 Earner | 8,704 (36.1%) | $60,225 |
| 2 Earners | 9,138 (37.9%) | $101,246 |
| 3+ Earners | 2,759 (11.4%) | $125,397 |
| Total | 24,107 (100.0%) | $79,409 |
Household Income in San Angelo
Household Income Brackets in San Angelo
With 6,959 households falling in the category, the $50,000 to $74,999 income range is the most frequent in San Angelo, accounting for 18.1% of all households. In contrast, only 1,423 households (3.7%) fall into the $10,000 to $14,999 income bracket, making it the least populous group.
| Income Bracket | # Households | % Households |
| Less than $10,000 | 1,884 | 4.9% |
| $10,000 to $14,999 | 1,423 | 3.7% |
| $15,000 to $24,999 | 3,345 | 8.7% |
| $25,000 to $34,999 | 3,383 | 8.8% |
| $35,000 to $49,999 | 5,037 | 13.1% |
| $50,000 to $74,999 | 6,959 | 18.1% |
| $75,000 to $99,999 | 5,767 | 15.0% |
| $100,000 to $149,999 | 6,882 | 17.9% |
| $150,000 to $199,999 | 1,999 | 5.2% |
| $200,000+ | 1,769 | 4.6% |
Household Income by Householder Age in San Angelo
The median household income in San Angelo is $65,040, with the highest median household income of $73,908 found in the 25 to 44 years age bracket for the primary householder. A total of 13,940 households (36.3%) fall into this category. Meanwhile, the 15 to 24 years age bracket for the primary householder has the lowest median household income of $39,116, with 2,697 households (7.0%) in this group.
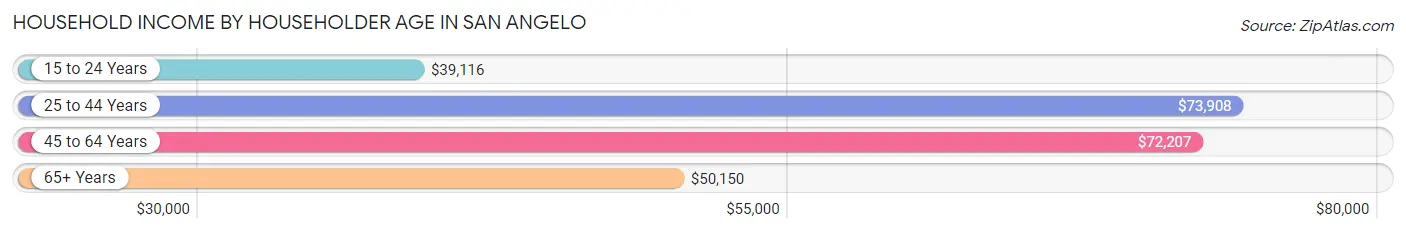
| Income Bracket | # Households | Median Income |
| 15 to 24 Years | 2,697 (7.0%) | $39,116 |
| 25 to 44 Years | 13,940 (36.3%) | $73,908 |
| 45 to 64 Years | 11,858 (30.8%) | $72,207 |
| 65+ Years | 9,952 (25.9%) | $50,150 |
| Total | 38,447 (100.0%) | $65,040 |
Poverty in San Angelo
Income Below Poverty by Sex and Age in San Angelo
With 9.6% poverty level for males and 14.0% for females among the residents of San Angelo, under 5 year old males and 18 to 24 year old females are the most vulnerable to poverty, with 777 males (26.2%) and 1,188 females (27.3%) in their respective age groups living below the poverty level.
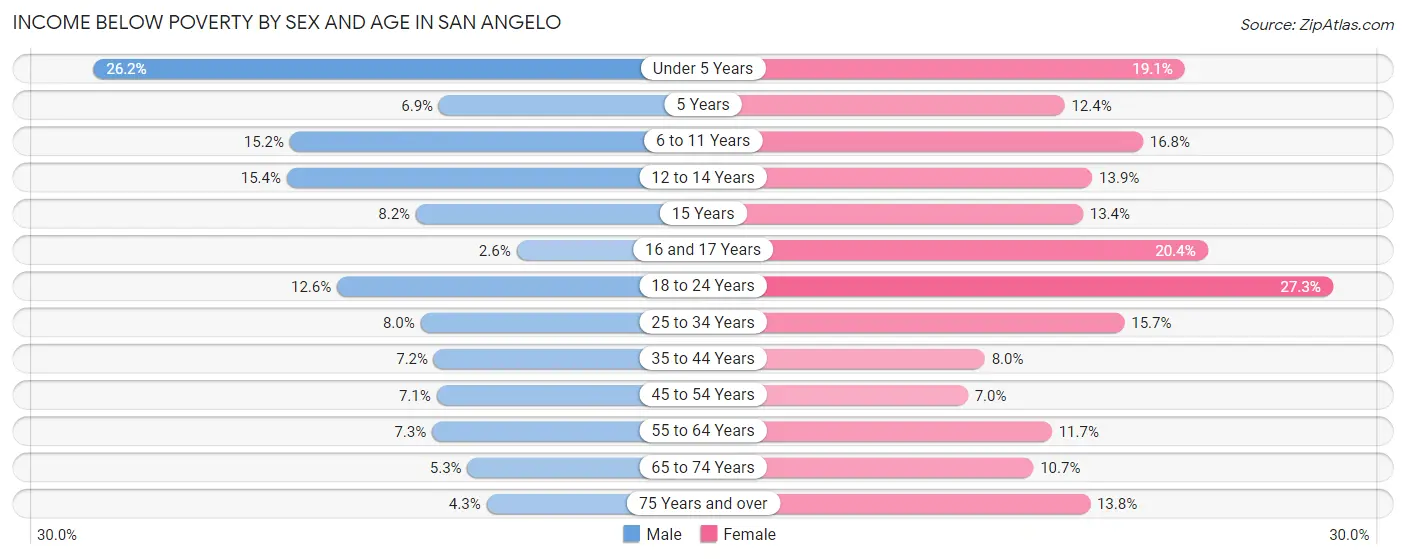
| Age Bracket | Male | Female |
| Under 5 Years | 777 (26.2%) | 565 (19.1%) |
| 5 Years | 50 (6.9%) | 65 (12.4%) |
| 6 to 11 Years | 578 (15.2%) | 638 (16.8%) |
| 12 to 14 Years | 322 (15.4%) | 274 (13.9%) |
| 15 Years | 48 (8.2%) | 97 (13.4%) |
| 16 and 17 Years | 37 (2.6%) | 250 (20.4%) |
| 18 to 24 Years | 565 (12.6%) | 1,188 (27.3%) |
| 25 to 34 Years | 613 (8.0%) | 1,028 (15.7%) |
| 35 to 44 Years | 431 (7.2%) | 488 (8.0%) |
| 45 to 54 Years | 342 (7.1%) | 360 (7.0%) |
| 55 to 64 Years | 356 (7.3%) | 674 (11.7%) |
| 65 to 74 Years | 224 (5.3%) | 508 (10.7%) |
| 75 Years and over | 114 (4.3%) | 513 (13.8%) |
| Total | 4,457 (9.6%) | 6,648 (14.0%) |
Income Above Poverty by Sex and Age in San Angelo
According to the poverty statistics in San Angelo, males aged 16 and 17 years and females aged 45 to 54 years are the age groups that are most secure financially, with 97.4% of males and 93.0% of females in these age groups living above the poverty line.
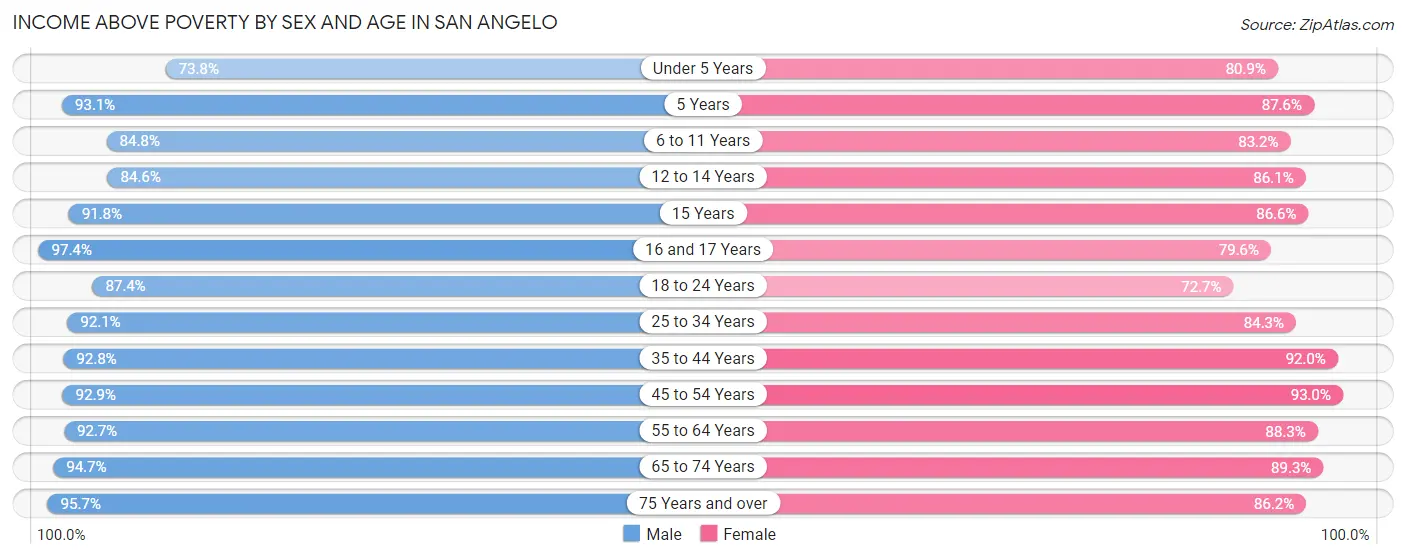
| Age Bracket | Male | Female |
| Under 5 Years | 2,192 (73.8%) | 2,395 (80.9%) |
| 5 Years | 671 (93.1%) | 459 (87.6%) |
| 6 to 11 Years | 3,216 (84.8%) | 3,169 (83.2%) |
| 12 to 14 Years | 1,769 (84.6%) | 1,692 (86.1%) |
| 15 Years | 537 (91.8%) | 626 (86.6%) |
| 16 and 17 Years | 1,383 (97.4%) | 978 (79.6%) |
| 18 to 24 Years | 3,920 (87.4%) | 3,159 (72.7%) |
| 25 to 34 Years | 7,096 (92.0%) | 5,509 (84.3%) |
| 35 to 44 Years | 5,543 (92.8%) | 5,639 (92.0%) |
| 45 to 54 Years | 4,501 (92.9%) | 4,774 (93.0%) |
| 55 to 64 Years | 4,514 (92.7%) | 5,093 (88.3%) |
| 65 to 74 Years | 3,972 (94.7%) | 4,259 (89.3%) |
| 75 Years and over | 2,550 (95.7%) | 3,199 (86.2%) |
| Total | 41,864 (90.4%) | 40,951 (86.0%) |
Income Below Poverty Among Married-Couple Families in San Angelo
The poverty statistics for married-couple families in San Angelo show that 2.1% or 364 of the total 16,969 families live below the poverty line. Families with 5 or more children have the highest poverty rate of 24.8%, comprising of 35 families. On the other hand, families with 1 or 2 children have the lowest poverty rate of 0.8%, which includes 42 families.
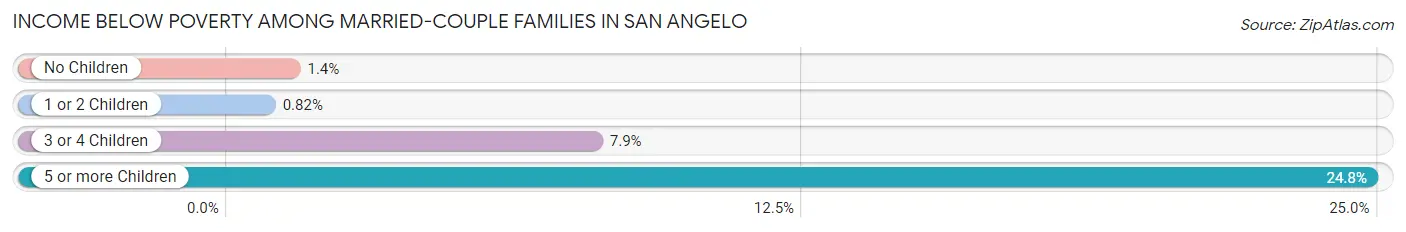
| Children | Above Poverty | Below Poverty |
| No Children | 9,604 (98.6%) | 132 (1.4%) |
| 1 or 2 Children | 5,098 (99.2%) | 42 (0.8%) |
| 3 or 4 Children | 1,797 (92.1%) | 155 (7.9%) |
| 5 or more Children | 106 (75.2%) | 35 (24.8%) |
| Total | 16,605 (97.9%) | 364 (2.1%) |
Income Below Poverty Among Single-Parent Households in San Angelo
According to the poverty data in San Angelo, 11.3% or 250 single-father households and 26.7% or 1,315 single-mother households are living below the poverty line. Among single-father households, those with 3 or 4 children have the highest poverty rate, with 29 households (48.3%) experiencing poverty. Likewise, among single-mother households, those with 5 or more children have the highest poverty rate, with 89 households (100.0%) falling below the poverty line.
| Children | Single Father | Single Mother |
| No Children | 9 (0.9%) | 214 (14.1%) |
| 1 or 2 Children | 212 (19.4%) | 680 (24.1%) |
| 3 or 4 Children | 29 (48.3%) | 332 (66.4%) |
| 5 or more Children | 0 (0.0%) | 89 (100.0%) |
| Total | 250 (11.3%) | 1,315 (26.7%) |
Income Below Poverty Among Married-Couple vs Single-Parent Households in San Angelo
The poverty data for San Angelo shows that 364 of the married-couple family households (2.1%) and 1,565 of the single-parent households (21.9%) are living below the poverty level. Within the married-couple family households, those with 5 or more children have the highest poverty rate, with 35 households (24.8%) falling below the poverty line. Among the single-parent households, those with 5 or more children have the highest poverty rate, with 89 household (100.0%) living below poverty.
| Children | Married-Couple Families | Single-Parent Households |
| No Children | 132 (1.4%) | 223 (8.6%) |
| 1 or 2 Children | 42 (0.8%) | 892 (22.8%) |
| 3 or 4 Children | 155 (7.9%) | 361 (64.5%) |
| 5 or more Children | 35 (24.8%) | 89 (100.0%) |
| Total | 364 (2.1%) | 1,565 (21.9%) |
Race in San Angelo
The most populous races in San Angelo are White / Caucasian (70,594 | 71.0%), Hispanic or Latino (43,897 | 44.2%), and Two or more Races (15,558 | 15.7%).
| Race | # Population | % Population |
| Asian | 1,290 | 1.3% |
| Black / African American | 4,522 | 4.5% |
| Hawaiian / Pacific | 92 | 0.1% |
| Hispanic or Latino | 43,897 | 44.2% |
| Native / Alaskan | 602 | 0.6% |
| White / Caucasian | 70,594 | 71.0% |
| Two or more Races | 15,558 | 15.7% |
| Some other Race | 6,764 | 6.8% |
| Total | 99,422 | 100.0% |
Ancestry in San Angelo
The most populous ancestries reported in San Angelo are Mexican (39,572 | 39.8%), German (11,045 | 11.1%), English (8,513 | 8.6%), Irish (8,510 | 8.6%), and American (4,443 | 4.5%), together accounting for 72.5% of all San Angelo residents.
| Ancestry | # Population | % Population |
| African | 471 | 0.5% |
| Alaskan Athabascan | 16 | 0.0% |
| American | 4,443 | 4.5% |
| Apache | 13 | 0.0% |
| Arab | 214 | 0.2% |
| Argentinean | 114 | 0.1% |
| Austrian | 200 | 0.2% |
| Bangladeshi | 29 | 0.0% |
| Belgian | 138 | 0.1% |
| Bermudan | 24 | 0.0% |
| Bhutanese | 153 | 0.2% |
| Blackfeet | 20 | 0.0% |
| Bolivian | 41 | 0.0% |
| Brazilian | 38 | 0.0% |
| British | 302 | 0.3% |
| British West Indian | 32 | 0.0% |
| Burmese | 381 | 0.4% |
| Cajun | 21 | 0.0% |
| Canadian | 17 | 0.0% |
| Central American | 132 | 0.1% |
| Central American Indian | 50 | 0.1% |
| Cherokee | 424 | 0.4% |
| Chickasaw | 6 | 0.0% |
| Choctaw | 179 | 0.2% |
| Colombian | 172 | 0.2% |
| Creek | 6 | 0.0% |
| Cuban | 56 | 0.1% |
| Czech | 645 | 0.6% |
| Czechoslovakian | 42 | 0.0% |
| Danish | 111 | 0.1% |
| Dominican | 269 | 0.3% |
| Dutch | 768 | 0.8% |
| Dutch West Indian | 7 | 0.0% |
| Ecuadorian | 13 | 0.0% |
| English | 8,513 | 8.6% |
| European | 1,731 | 1.7% |
| Finnish | 94 | 0.1% |
| French | 1,433 | 1.4% |
| French Canadian | 212 | 0.2% |
| German | 11,045 | 11.1% |
| Greek | 24 | 0.0% |
| Guamanian / Chamorro | 25 | 0.0% |
| Guatemalan | 65 | 0.1% |
| Haitian | 97 | 0.1% |
| Hopi | 21 | 0.0% |
| Houma | 6 | 0.0% |
| Hungarian | 11 | 0.0% |
| Indian (Asian) | 355 | 0.4% |
| Iraqi | 42 | 0.0% |
| Irish | 8,510 | 8.6% |
| Iroquois | 38 | 0.0% |
| Italian | 1,419 | 1.4% |
| Jamaican | 55 | 0.1% |
| Japanese | 5 | 0.0% |
| Kenyan | 36 | 0.0% |
| Kiowa | 8 | 0.0% |
| Korean | 506 | 0.5% |
| Lebanese | 69 | 0.1% |
| Lithuanian | 23 | 0.0% |
| Luxembourger | 21 | 0.0% |
| Malaysian | 13 | 0.0% |
| Mexican | 39,572 | 39.8% |
| Mexican American Indian | 204 | 0.2% |
| Native Hawaiian | 114 | 0.1% |
| Navajo | 19 | 0.0% |
| Nicaraguan | 10 | 0.0% |
| Nigerian | 85 | 0.1% |
| Northern European | 93 | 0.1% |
| Norwegian | 511 | 0.5% |
| Ottawa | 5 | 0.0% |
| Pakistani | 17 | 0.0% |
| Panamanian | 24 | 0.0% |
| Pennsylvania German | 149 | 0.2% |
| Polish | 503 | 0.5% |
| Portuguese | 73 | 0.1% |
| Potawatomi | 9 | 0.0% |
| Puerto Rican | 625 | 0.6% |
| Romanian | 71 | 0.1% |
| Russian | 92 | 0.1% |
| Salvadoran | 33 | 0.0% |
| Samoan | 22 | 0.0% |
| Scandinavian | 167 | 0.2% |
| Scotch-Irish | 1,101 | 1.1% |
| Scottish | 1,407 | 1.4% |
| Serbian | 27 | 0.0% |
| Sioux | 29 | 0.0% |
| Slavic | 33 | 0.0% |
| South American | 498 | 0.5% |
| Spaniard | 245 | 0.3% |
| Spanish | 291 | 0.3% |
| Spanish American Indian | 18 | 0.0% |
| Sri Lankan | 295 | 0.3% |
| Subsaharan African | 592 | 0.6% |
| Swedish | 615 | 0.6% |
| Swiss | 181 | 0.2% |
| Syrian | 19 | 0.0% |
| Thai | 156 | 0.2% |
| Trinidadian and Tobagonian | 28 | 0.0% |
| Turkish | 97 | 0.1% |
| Ukrainian | 21 | 0.0% |
| Venezuelan | 158 | 0.2% |
| Welsh | 324 | 0.3% |
| West Indian | 36 | 0.0% |
| Yugoslavian | 81 | 0.1% | View All 104 Rows |
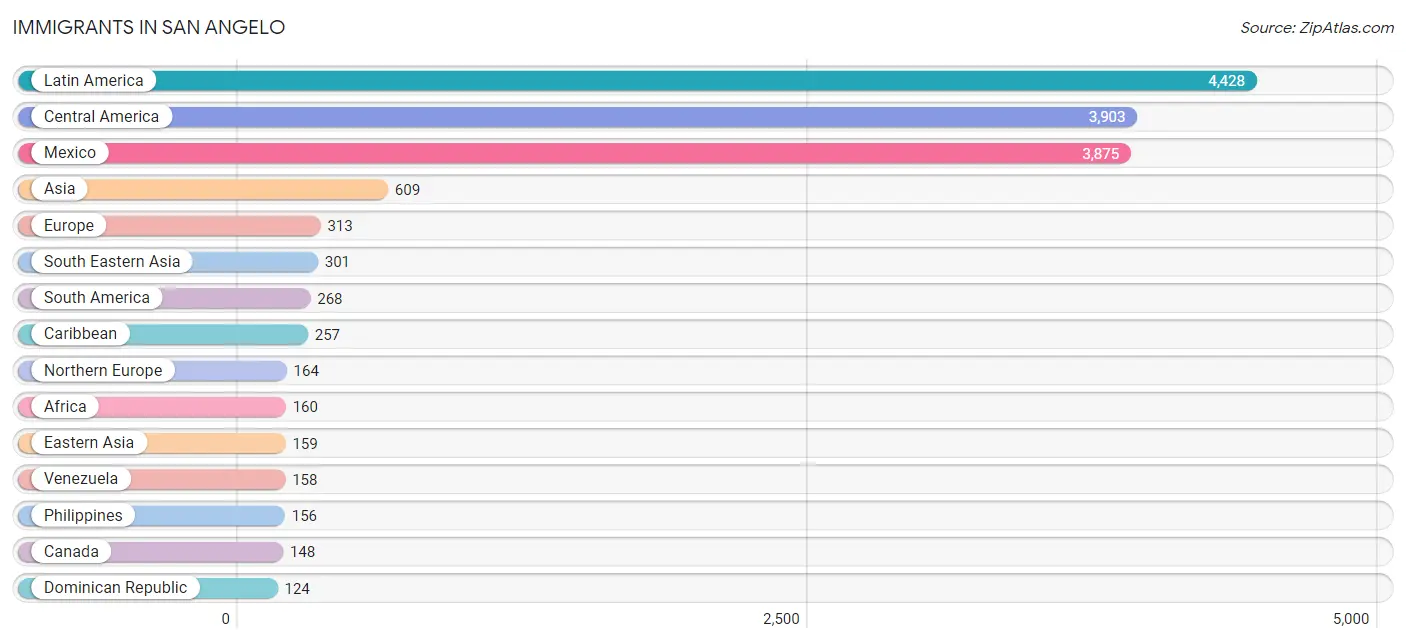
Immigrants in San Angelo
The most numerous immigrant groups reported in San Angelo came from Latin America (4,428 | 4.4%), Central America (3,903 | 3.9%), Mexico (3,875 | 3.9%), Asia (609 | 0.6%), and Europe (313 | 0.3%), together accounting for 13.2% of all San Angelo residents.
| Immigration Origin | # Population | % Population |
| Africa | 160 | 0.2% |
| Asia | 609 | 0.6% |
| Australia | 11 | 0.0% |
| Bolivia | 41 | 0.0% |
| Bosnia and Herzegovina | 7 | 0.0% |
| Brazil | 6 | 0.0% |
| Canada | 148 | 0.2% |
| Caribbean | 257 | 0.3% |
| Central America | 3,903 | 3.9% |
| China | 44 | 0.0% |
| Cuba | 4 | 0.0% |
| Dominican Republic | 124 | 0.1% |
| Eastern Africa | 67 | 0.1% |
| Eastern Asia | 159 | 0.2% |
| Eastern Europe | 38 | 0.0% |
| Ecuador | 13 | 0.0% |
| Egypt | 5 | 0.0% |
| England | 87 | 0.1% |
| Europe | 313 | 0.3% |
| Germany | 59 | 0.1% |
| Grenada | 32 | 0.0% |
| Guatemala | 28 | 0.0% |
| Guyana | 50 | 0.1% |
| Haiti | 28 | 0.0% |
| India | 34 | 0.0% |
| Iraq | 24 | 0.0% |
| Italy | 24 | 0.0% |
| Jamaica | 46 | 0.1% |
| Kenya | 67 | 0.1% |
| Korea | 115 | 0.1% |
| Latin America | 4,428 | 4.4% |
| Mexico | 3,875 | 3.9% |
| Nepal | 30 | 0.0% |
| Netherlands | 8 | 0.0% |
| Nigeria | 75 | 0.1% |
| Northern Africa | 5 | 0.0% |
| Northern Europe | 164 | 0.2% |
| Oceania | 11 | 0.0% |
| Pakistan | 2 | 0.0% |
| Philippines | 156 | 0.2% |
| South Africa | 13 | 0.0% |
| South America | 268 | 0.3% |
| South Central Asia | 66 | 0.1% |
| South Eastern Asia | 301 | 0.3% |
| Southern Europe | 26 | 0.0% |
| Spain | 2 | 0.0% |
| Switzerland | 18 | 0.0% |
| Thailand | 59 | 0.1% |
| Trinidad and Tobago | 23 | 0.0% |
| Turkey | 59 | 0.1% |
| Ukraine | 31 | 0.0% |
| Venezuela | 158 | 0.2% |
| Vietnam | 86 | 0.1% |
| Western Africa | 75 | 0.1% |
| Western Asia | 83 | 0.1% |
| Western Europe | 85 | 0.1% | View All 56 Rows |
Sex and Age in San Angelo
Sex and Age in San Angelo
The most populous age groups in San Angelo are 20 to 24 Years (4,731 | 9.5%) for men and 20 to 24 Years (3,836 | 7.7%) for women.
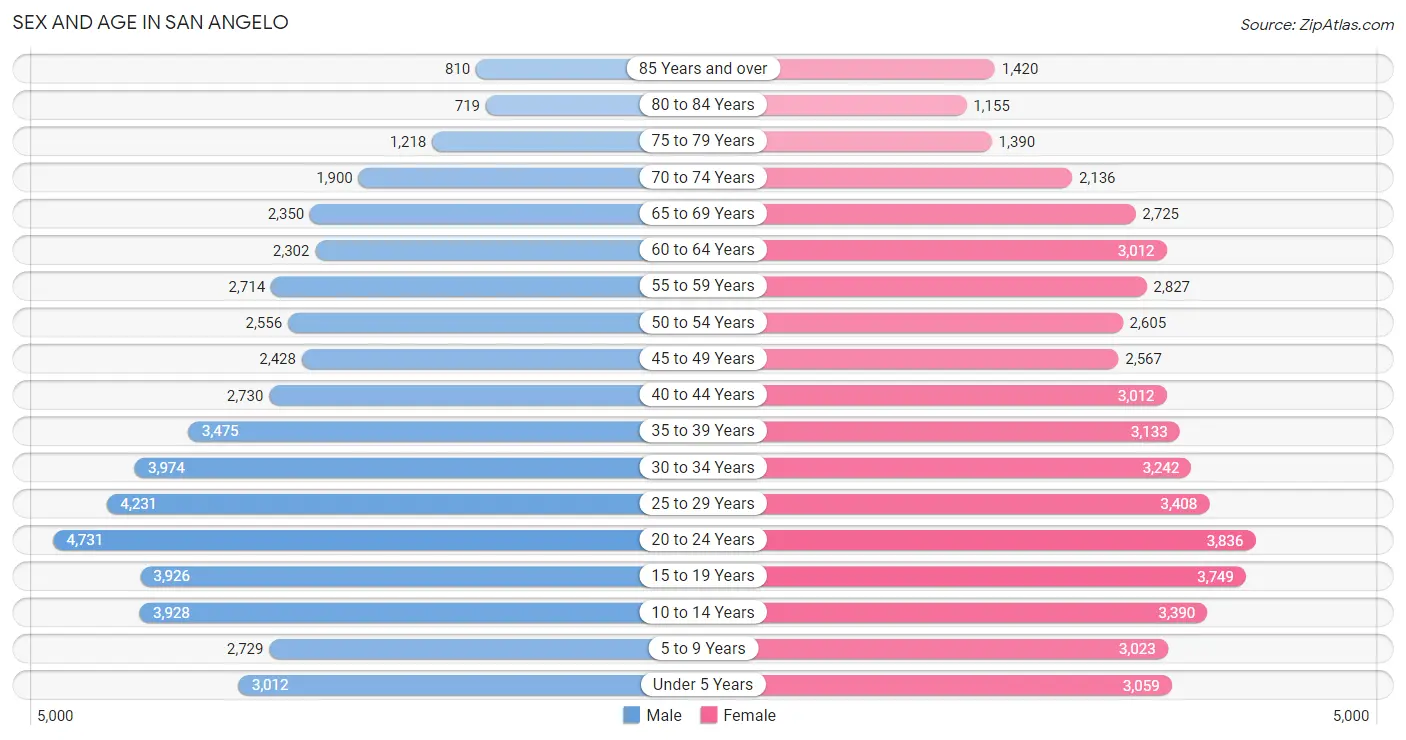
| Age Bracket | Male | Female |
| Under 5 Years | 3,012 (6.1%) | 3,059 (6.2%) |
| 5 to 9 Years | 2,729 (5.5%) | 3,023 (6.1%) |
| 10 to 14 Years | 3,928 (7.9%) | 3,390 (6.8%) |
| 15 to 19 Years | 3,926 (7.9%) | 3,749 (7.5%) |
| 20 to 24 Years | 4,731 (9.5%) | 3,836 (7.7%) |
| 25 to 29 Years | 4,231 (8.5%) | 3,408 (6.9%) |
| 30 to 34 Years | 3,974 (8.0%) | 3,242 (6.5%) |
| 35 to 39 Years | 3,475 (7.0%) | 3,133 (6.3%) |
| 40 to 44 Years | 2,730 (5.5%) | 3,012 (6.1%) |
| 45 to 49 Years | 2,428 (4.9%) | 2,567 (5.2%) |
| 50 to 54 Years | 2,556 (5.1%) | 2,605 (5.2%) |
| 55 to 59 Years | 2,714 (5.5%) | 2,827 (5.7%) |
| 60 to 64 Years | 2,302 (4.6%) | 3,012 (6.1%) |
| 65 to 69 Years | 2,350 (4.7%) | 2,725 (5.5%) |
| 70 to 74 Years | 1,900 (3.8%) | 2,136 (4.3%) |
| 75 to 79 Years | 1,218 (2.5%) | 1,390 (2.8%) |
| 80 to 84 Years | 719 (1.5%) | 1,155 (2.3%) |
| 85 Years and over | 810 (1.6%) | 1,420 (2.9%) |
| Total | 49,733 (100.0%) | 49,689 (100.0%) |
Families and Households in San Angelo
Median Family Size in San Angelo
The median family size in San Angelo is 3.08 persons per family, with married-couple families (16,969 | 70.4%) accounting for the largest median family size of 3.21 persons per family. On the other hand, single male/father families (2,209 | 9.2%) represent the smallest median family size with 2.46 persons per family.
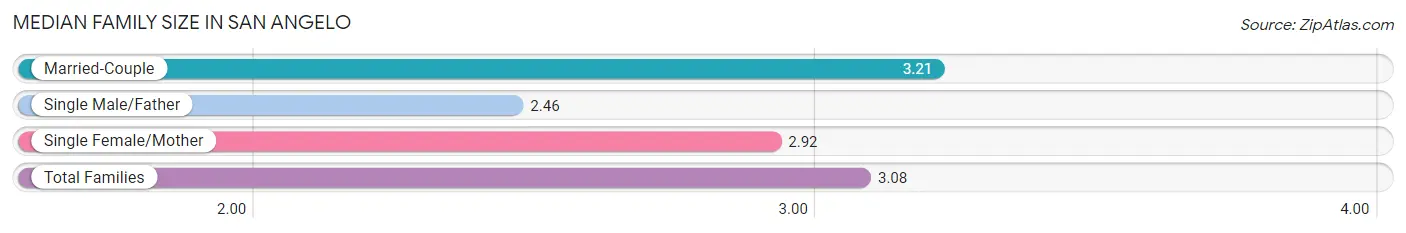
| Family Type | # Families | Family Size |
| Married-Couple | 16,969 (70.4%) | 3.21 |
| Single Male/Father | 2,209 (9.2%) | 2.46 |
| Single Female/Mother | 4,929 (20.4%) | 2.92 |
| Total Families | 24,107 (100.0%) | 3.08 |
Median Household Size in San Angelo
The median household size in San Angelo is 2.44 persons per household, with married-couple households (16,969 | 44.1%) accounting for the largest median household size of 3.23 persons per household. non-family households (14,340 | 37.3%) represent the smallest median household size with 1.24 persons per household.
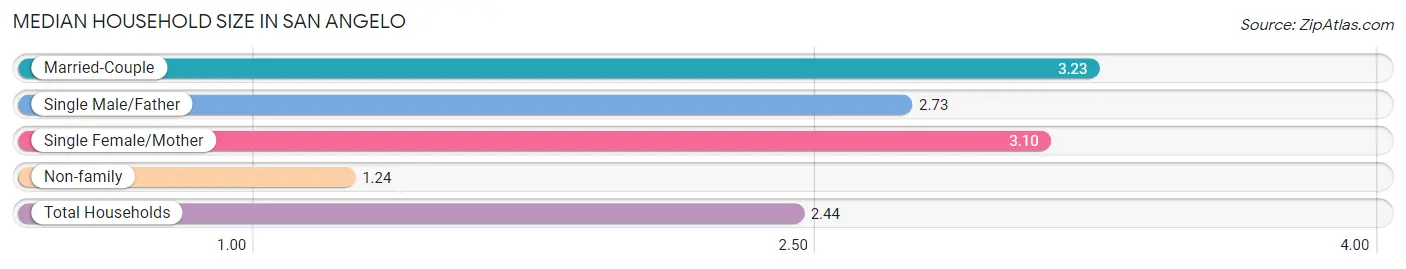
| Household Type | # Households | Household Size |
| Married-Couple | 16,969 (44.1%) | 3.23 |
| Single Male/Father | 2,209 (5.8%) | 2.73 |
| Single Female/Mother | 4,929 (12.8%) | 3.10 |
| Non-family | 14,340 (37.3%) | 1.24 |
| Total Households | 38,447 (100.0%) | 2.44 |
Household Size by Marriage Status in San Angelo
Out of a total of 38,447 households in San Angelo, 24,107 (62.7%) are family households, while 14,340 (37.3%) are nonfamily households. The most numerous type of family households are 2-person households, comprising 10,888, and the most common type of nonfamily households are 1-person households, comprising 11,576.
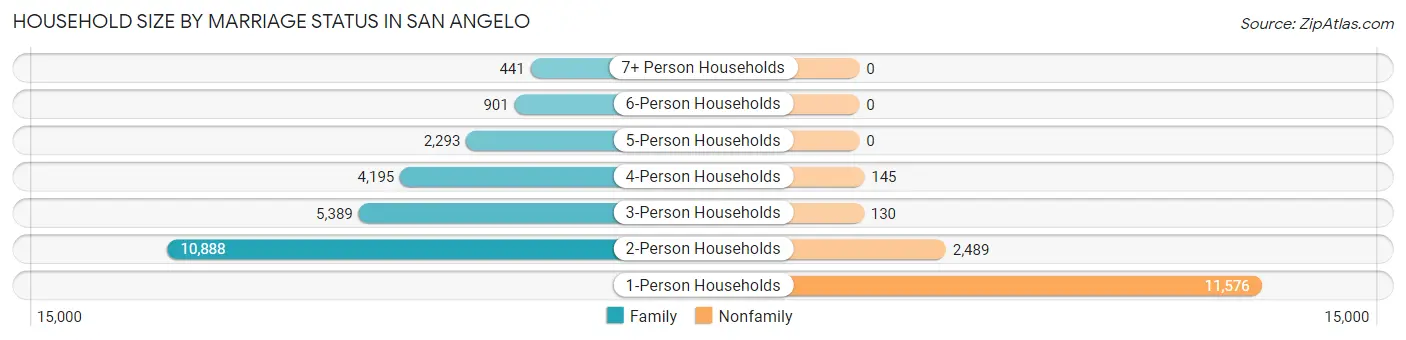
| Household Size | Family Households | Nonfamily Households |
| 1-Person Households | - | 11,576 (30.1%) |
| 2-Person Households | 10,888 (28.3%) | 2,489 (6.5%) |
| 3-Person Households | 5,389 (14.0%) | 130 (0.3%) |
| 4-Person Households | 4,195 (10.9%) | 145 (0.4%) |
| 5-Person Households | 2,293 (6.0%) | 0 (0.0%) |
| 6-Person Households | 901 (2.3%) | 0 (0.0%) |
| 7+ Person Households | 441 (1.1%) | 0 (0.0%) |
| Total | 24,107 (62.7%) | 14,340 (37.3%) |
Female Fertility in San Angelo
Fertility by Age in San Angelo
Average fertility rate in San Angelo is 52.0 births per 1,000 women. Women in the age bracket of 20 to 34 years have the highest fertility rate with 99.0 births per 1,000 women. Women in the age bracket of 20 to 34 years acount for 84.6% of all women with births.
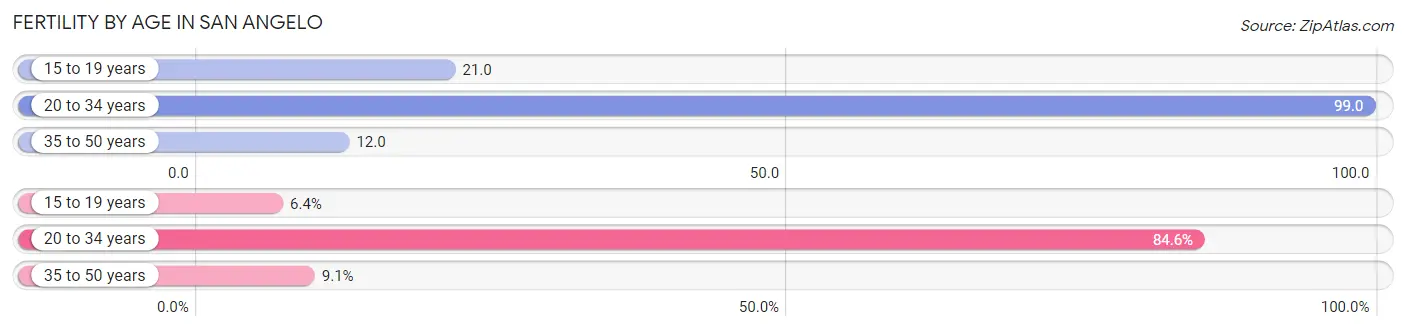
| Age Bracket | Women with Births | Births / 1,000 Women |
| 15 to 19 years | 78 (6.4%) | 21.0 |
| 20 to 34 years | 1,036 (84.6%) | 99.0 |
| 35 to 50 years | 111 (9.1%) | 12.0 |
| Total | 1,225 (100.0%) | 52.0 |
Fertility by Age by Marriage Status in San Angelo
69.1% of women with births (1,225) in San Angelo are married. The highest percentage of unmarried women with births falls into 15 to 19 years age bracket with 100.0% of them unmarried at the time of birth, while the lowest percentage of unmarried women with births belong to 35 to 50 years age bracket with 0.0% of them unmarried.
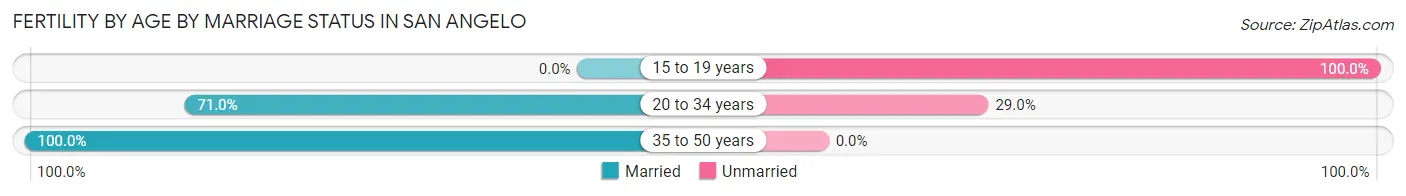
| Age Bracket | Married | Unmarried |
| 15 to 19 years | 0 (0.0%) | 78 (100.0%) |
| 20 to 34 years | 736 (71.0%) | 300 (29.0%) |
| 35 to 50 years | 111 (100.0%) | 0 (0.0%) |
| Total | 846 (69.1%) | 379 (30.9%) |
Fertility by Education in San Angelo
Average fertility rate in San Angelo is 52.0 births per 1,000 women. Women with the education attainment of bachelor's degree have the highest fertility rate of 88.0 births per 1,000 women, while women with the education attainment of college or associate's degree have the lowest fertility at 32.0 births per 1,000 women. Women with the education attainment of high school diploma represent 30.0% of all women with births.
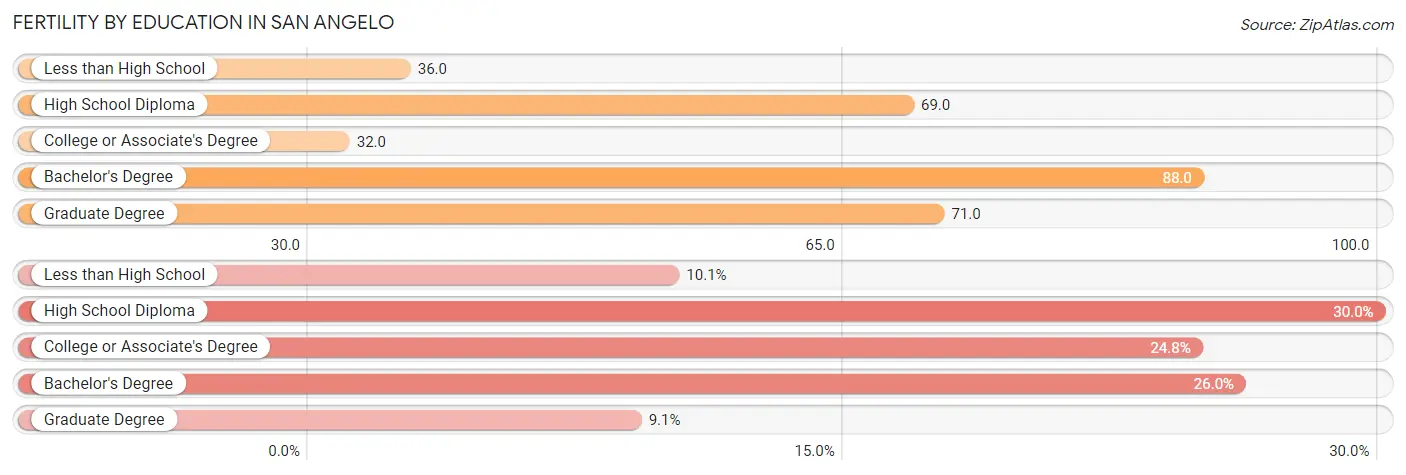
| Educational Attainment | Women with Births | Births / 1,000 Women |
| Less than High School | 124 (10.1%) | 36.0 |
| High School Diploma | 367 (30.0%) | 69.0 |
| College or Associate's Degree | 304 (24.8%) | 32.0 |
| Bachelor's Degree | 319 (26.0%) | 88.0 |
| Graduate Degree | 111 (9.1%) | 71.0 |
| Total | 1,225 (100.0%) | 52.0 |
Fertility by Education by Marriage Status in San Angelo
30.9% of women with births in San Angelo are unmarried. Women with the educational attainment of graduate degree are most likely to be married with 100.0% of them married at childbirth, while women with the educational attainment of less than high school are least likely to be married with 68.5% of them unmarried at childbirth.
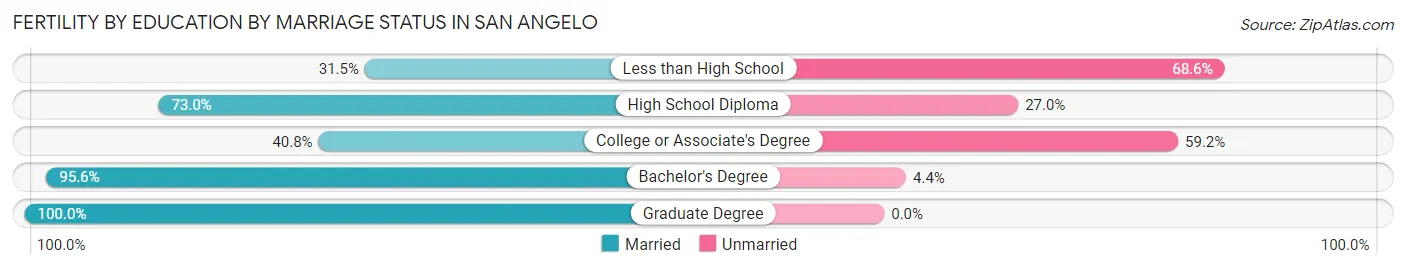
| Educational Attainment | Married | Unmarried |
| Less than High School | 39 (31.5%) | 85 (68.5%) |
| High School Diploma | 268 (73.0%) | 99 (27.0%) |
| College or Associate's Degree | 124 (40.8%) | 180 (59.2%) |
| Bachelor's Degree | 305 (95.6%) | 14 (4.4%) |
| Graduate Degree | 111 (100.0%) | 0 (0.0%) |
| Total | 846 (69.1%) | 379 (30.9%) |
Employment Characteristics in San Angelo
Employment by Class of Employer in San Angelo
Among the 48,927 employed individuals in San Angelo, private company employees (29,592 | 60.5%), federal government employees (4,980 | 10.2%), and not-for-profit organizations (4,313 | 8.8%) make up the most common classes of employment.
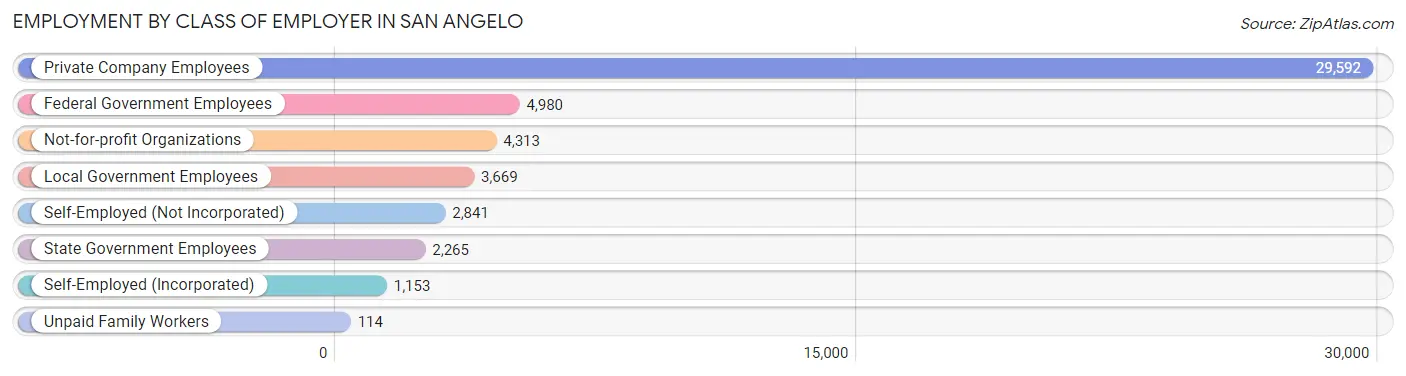
| Employer Class | # Employees | % Employees |
| Private Company Employees | 29,592 | 60.5% |
| Self-Employed (Incorporated) | 1,153 | 2.4% |
| Self-Employed (Not Incorporated) | 2,841 | 5.8% |
| Not-for-profit Organizations | 4,313 | 8.8% |
| Local Government Employees | 3,669 | 7.5% |
| State Government Employees | 2,265 | 4.6% |
| Federal Government Employees | 4,980 | 10.2% |
| Unpaid Family Workers | 114 | 0.2% |
| Total | 48,927 | 100.0% |
Employment Status by Age in San Angelo
According to the labor force statistics for San Angelo, out of the total population over 16 years of age (78,973), 65.4% or 51,648 individuals are in the labor force, with 3.2% or 1,653 of them unemployed. The age group with the highest labor force participation rate is 45 to 54 years, with 85.7% or 8,704 individuals in the labor force. Within the labor force, the 16 to 19 years age range has the highest percentage of unemployed individuals, with 9.4% or 279 of them being unemployed.
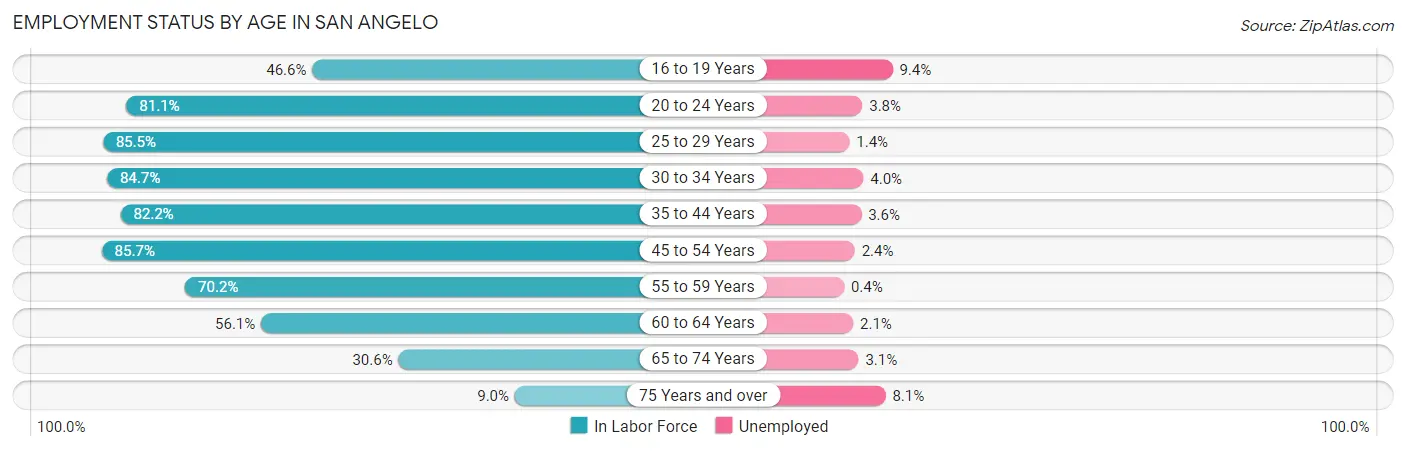
| Age Bracket | In Labor Force | Unemployed |
| 16 to 19 Years | 2,967 (46.6%) | 279 (9.4%) |
| 20 to 24 Years | 6,948 (81.1%) | 264 (3.8%) |
| 25 to 29 Years | 6,531 (85.5%) | 91 (1.4%) |
| 30 to 34 Years | 6,112 (84.7%) | 244 (4.0%) |
| 35 to 44 Years | 10,152 (82.2%) | 365 (3.6%) |
| 45 to 54 Years | 8,704 (85.7%) | 209 (2.4%) |
| 55 to 59 Years | 3,890 (70.2%) | 16 (0.4%) |
| 60 to 64 Years | 2,981 (56.1%) | 63 (2.1%) |
| 65 to 74 Years | 2,788 (30.6%) | 86 (3.1%) |
| 75 Years and over | 604 (9.0%) | 49 (8.1%) |
| Total | 51,648 (65.4%) | 1,653 (3.2%) |
Employment Status by Educational Attainment in San Angelo
According to labor force statistics for San Angelo, 79.6% of individuals (38,380) out of the total population between 25 and 64 years of age (48,216) are in the labor force, with 2.6% or 998 of them being unemployed. The group with the highest labor force participation rate are those with the educational attainment of bachelor's degree or higher, with 86.8% or 10,058 individuals in the labor force. Within the labor force, individuals with less than high school education have the highest percentage of unemployment, with 5.1% or 203 of them being unemployed.
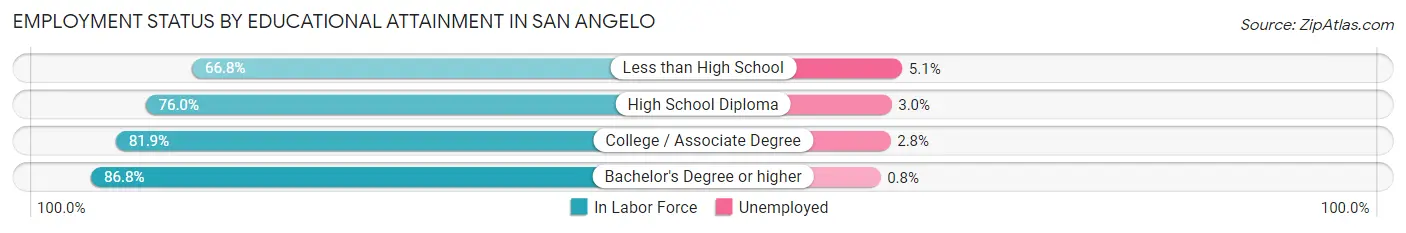
| Educational Attainment | In Labor Force | Unemployed |
| Less than High School | 3,979 (66.8%) | 304 (5.1%) |
| High School Diploma | 10,211 (76.0%) | 403 (3.0%) |
| College / Associate Degree | 14,117 (81.9%) | 483 (2.8%) |
| Bachelor's Degree or higher | 10,058 (86.8%) | 93 (0.8%) |
| Total | 38,380 (79.6%) | 1,254 (2.6%) |
Employment Occupations by Sex in San Angelo
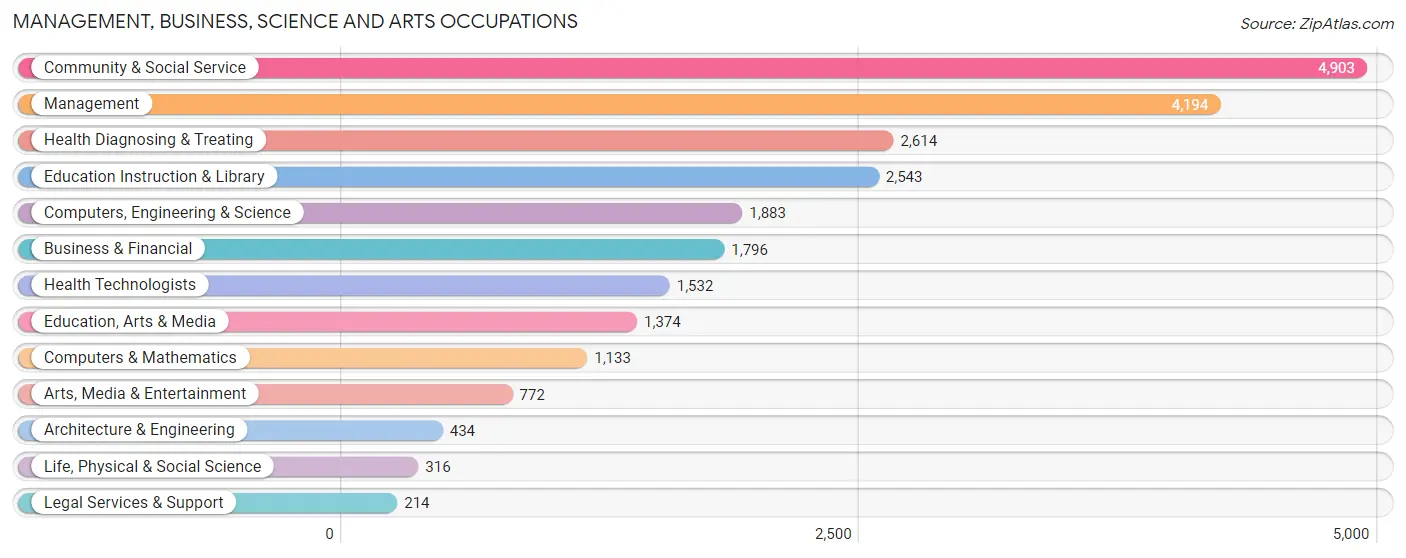
Management, Business, Science and Arts Occupations
The most common Management, Business, Science and Arts occupations in San Angelo are Community & Social Service (4,903 | 10.4%), Management (4,194 | 8.9%), Health Diagnosing & Treating (2,614 | 5.5%), Education Instruction & Library (2,543 | 5.4%), and Computers, Engineering & Science (1,883 | 4.0%).
Management, Business, Science and Arts Occupations by Sex
Within the Management, Business, Science and Arts occupations in San Angelo, the most male-oriented occupations are Architecture & Engineering (89.4%), Computers & Mathematics (75.2%), and Computers, Engineering & Science (72.0%), while the most female-oriented occupations are Health Diagnosing & Treating (78.7%), Health Technologists (78.5%), and Education Instruction & Library (66.3%).
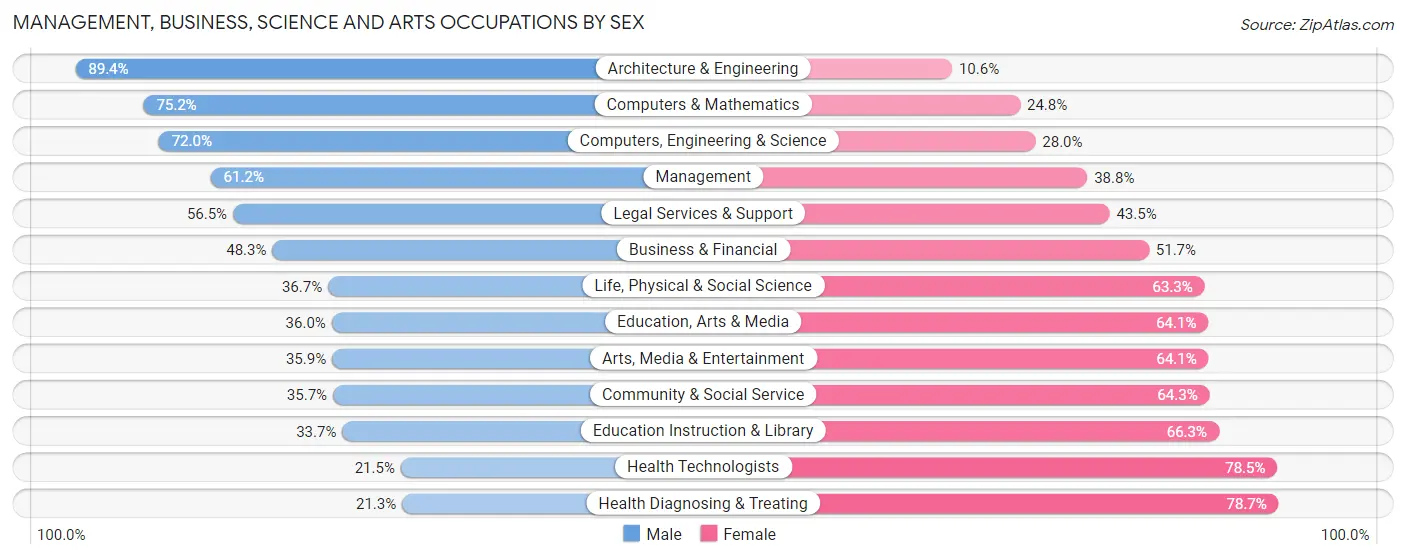
| Occupation | Male | Female |
| Management | 2,566 (61.2%) | 1,628 (38.8%) |
| Business & Financial | 868 (48.3%) | 928 (51.7%) |
| Computers, Engineering & Science | 1,356 (72.0%) | 527 (28.0%) |
| Computers & Mathematics | 852 (75.2%) | 281 (24.8%) |
| Architecture & Engineering | 388 (89.4%) | 46 (10.6%) |
| Life, Physical & Social Science | 116 (36.7%) | 200 (63.3%) |
| Community & Social Service | 1,750 (35.7%) | 3,153 (64.3%) |
| Education, Arts & Media | 494 (35.9%) | 880 (64.0%) |
| Legal Services & Support | 121 (56.5%) | 93 (43.5%) |
| Education Instruction & Library | 858 (33.7%) | 1,685 (66.3%) |
| Arts, Media & Entertainment | 277 (35.9%) | 495 (64.1%) |
| Health Diagnosing & Treating | 556 (21.3%) | 2,058 (78.7%) |
| Health Technologists | 330 (21.5%) | 1,202 (78.5%) |
| Total (Category) | 7,096 (46.1%) | 8,294 (53.9%) |
| Total (Overall) | 24,915 (52.7%) | 22,328 (47.3%) |
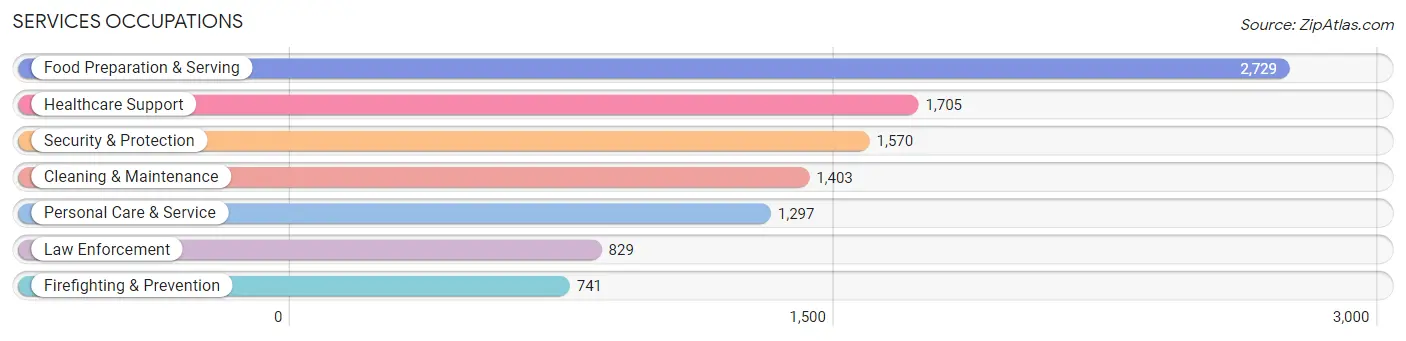
Services Occupations
The most common Services occupations in San Angelo are Food Preparation & Serving (2,729 | 5.8%), Healthcare Support (1,705 | 3.6%), Security & Protection (1,570 | 3.3%), Cleaning & Maintenance (1,403 | 3.0%), and Personal Care & Service (1,297 | 2.8%).
Services Occupations by Sex
Within the Services occupations in San Angelo, the most male-oriented occupations are Firefighting & Prevention (98.5%), Security & Protection (88.1%), and Law Enforcement (78.8%), while the most female-oriented occupations are Healthcare Support (91.8%), Personal Care & Service (64.0%), and Food Preparation & Serving (63.7%).
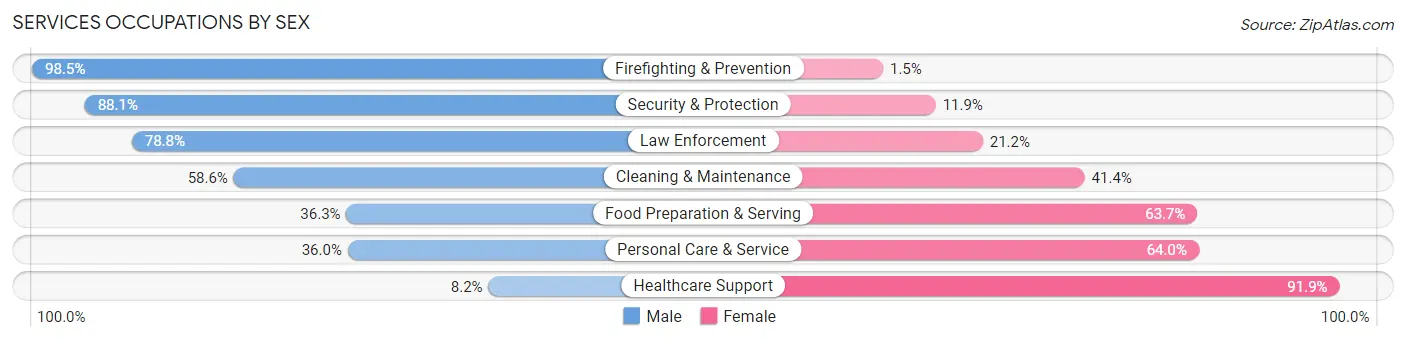
| Occupation | Male | Female |
| Healthcare Support | 139 (8.2%) | 1,566 (91.8%) |
| Security & Protection | 1,383 (88.1%) | 187 (11.9%) |
| Firefighting & Prevention | 730 (98.5%) | 11 (1.5%) |
| Law Enforcement | 653 (78.8%) | 176 (21.2%) |
| Food Preparation & Serving | 990 (36.3%) | 1,739 (63.7%) |
| Cleaning & Maintenance | 822 (58.6%) | 581 (41.4%) |
| Personal Care & Service | 467 (36.0%) | 830 (64.0%) |
| Total (Category) | 3,801 (43.7%) | 4,903 (56.3%) |
| Total (Overall) | 24,915 (52.7%) | 22,328 (47.3%) |
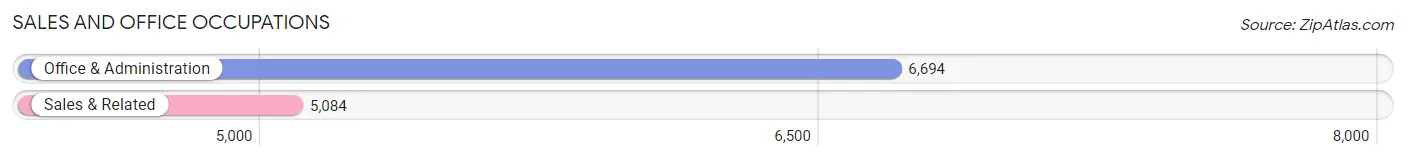
Sales and Office Occupations
The most common Sales and Office occupations in San Angelo are Office & Administration (6,694 | 14.2%), and Sales & Related (5,084 | 10.8%).
Sales and Office Occupations by Sex
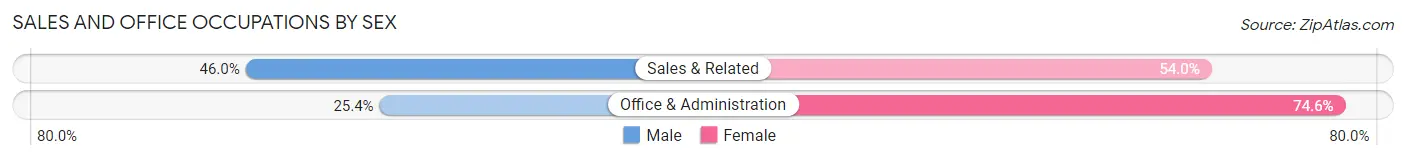
| Occupation | Male | Female |
| Sales & Related | 2,339 (46.0%) | 2,745 (54.0%) |
| Office & Administration | 1,701 (25.4%) | 4,993 (74.6%) |
| Total (Category) | 4,040 (34.3%) | 7,738 (65.7%) |
| Total (Overall) | 24,915 (52.7%) | 22,328 (47.3%) |
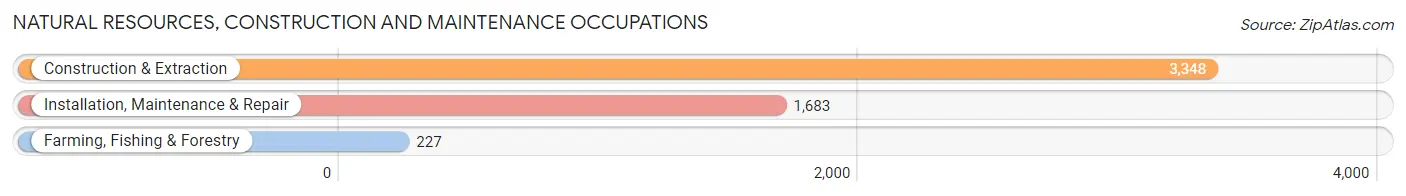
Natural Resources, Construction and Maintenance Occupations
The most common Natural Resources, Construction and Maintenance occupations in San Angelo are Construction & Extraction (3,348 | 7.1%), Installation, Maintenance & Repair (1,683 | 3.6%), and Farming, Fishing & Forestry (227 | 0.5%).
Natural Resources, Construction and Maintenance Occupations by Sex
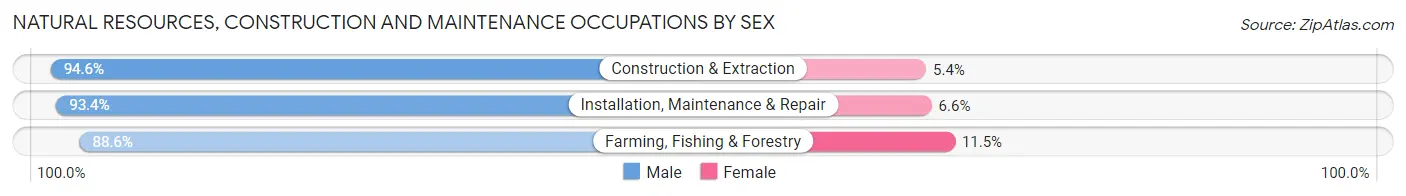
| Occupation | Male | Female |
| Farming, Fishing & Forestry | 201 (88.5%) | 26 (11.5%) |
| Construction & Extraction | 3,166 (94.6%) | 182 (5.4%) |
| Installation, Maintenance & Repair | 1,572 (93.4%) | 111 (6.6%) |
| Total (Category) | 4,939 (93.9%) | 319 (6.1%) |
| Total (Overall) | 24,915 (52.7%) | 22,328 (47.3%) |
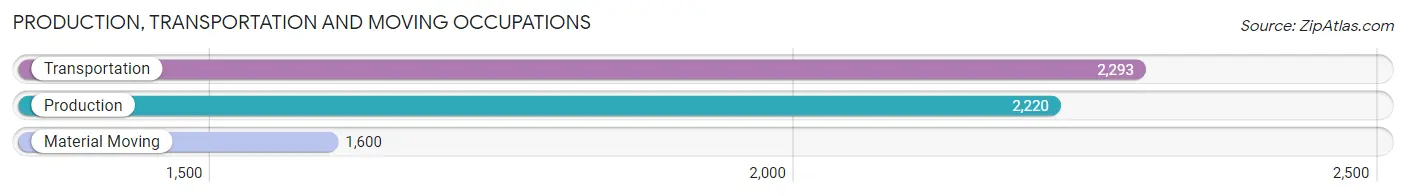
Production, Transportation and Moving Occupations
The most common Production, Transportation and Moving occupations in San Angelo are Transportation (2,293 | 4.9%), Production (2,220 | 4.7%), and Material Moving (1,600 | 3.4%).
Production, Transportation and Moving Occupations by Sex
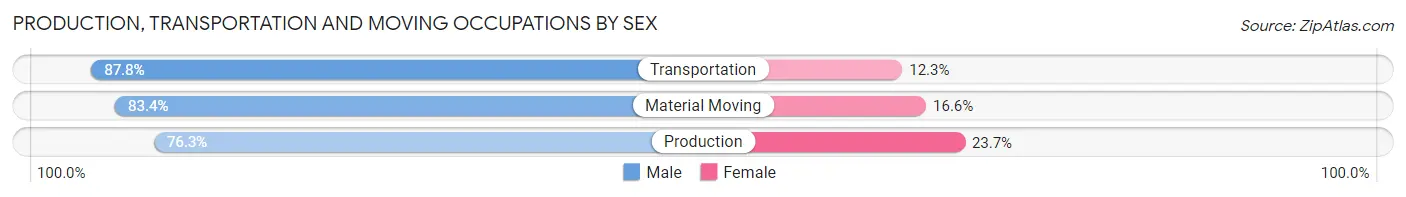
| Occupation | Male | Female |
| Production | 1,693 (76.3%) | 527 (23.7%) |
| Transportation | 2,012 (87.7%) | 281 (12.2%) |
| Material Moving | 1,334 (83.4%) | 266 (16.6%) |
| Total (Category) | 5,039 (82.4%) | 1,074 (17.6%) |
| Total (Overall) | 24,915 (52.7%) | 22,328 (47.3%) |
Employment Industries by Sex in San Angelo
Employment Industries in San Angelo
The major employment industries in San Angelo include Health Care & Social Assistance (7,100 | 15.0%), Retail Trade (6,104 | 12.9%), Educational Services (4,135 | 8.7%), Public Administration (3,814 | 8.1%), and Construction (3,748 | 7.9%).
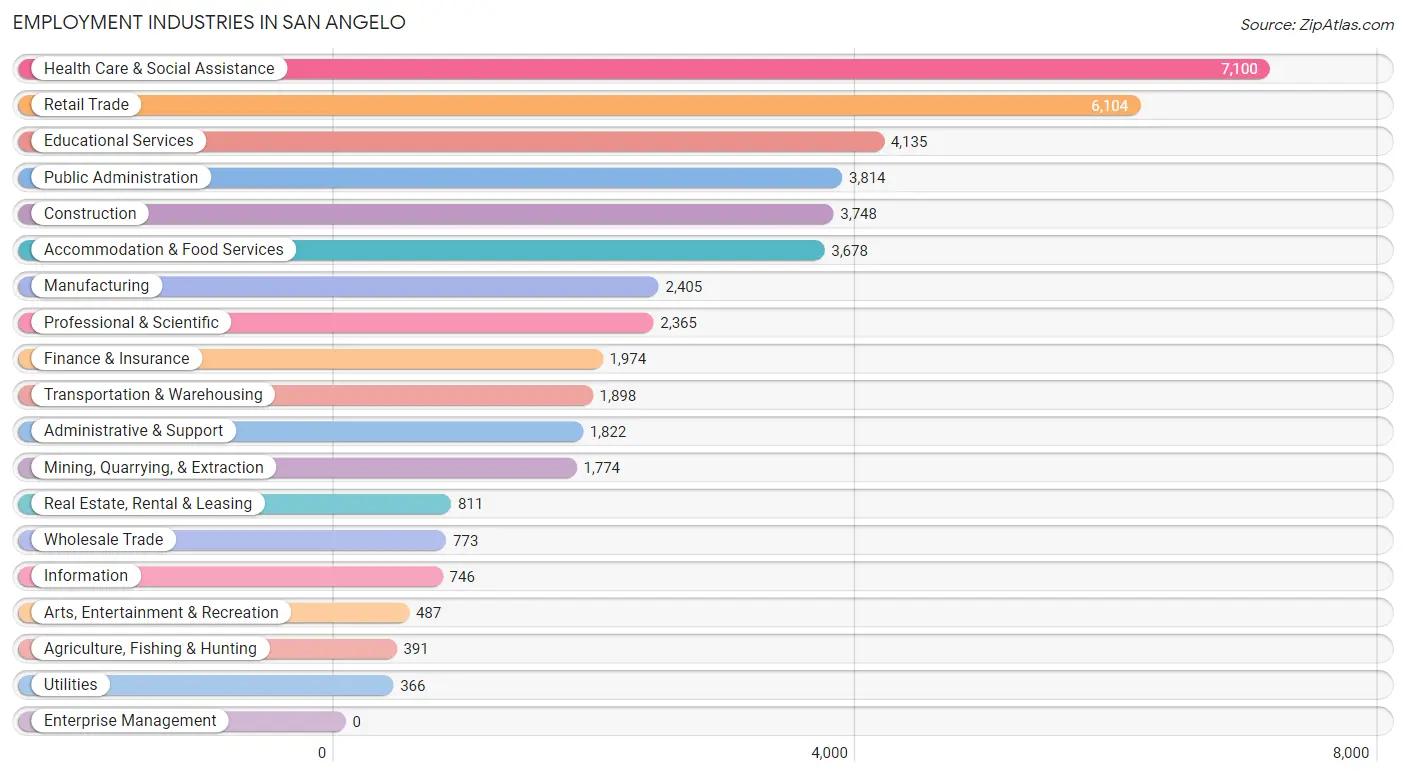
Employment Industries by Sex in San Angelo
The San Angelo industries that see more men than women are Utilities (96.2%), Agriculture, Fishing & Hunting (91.3%), and Construction (89.5%), whereas the industries that tend to have a higher number of women are Health Care & Social Assistance (84.4%), Finance & Insurance (75.6%), and Educational Services (64.3%).
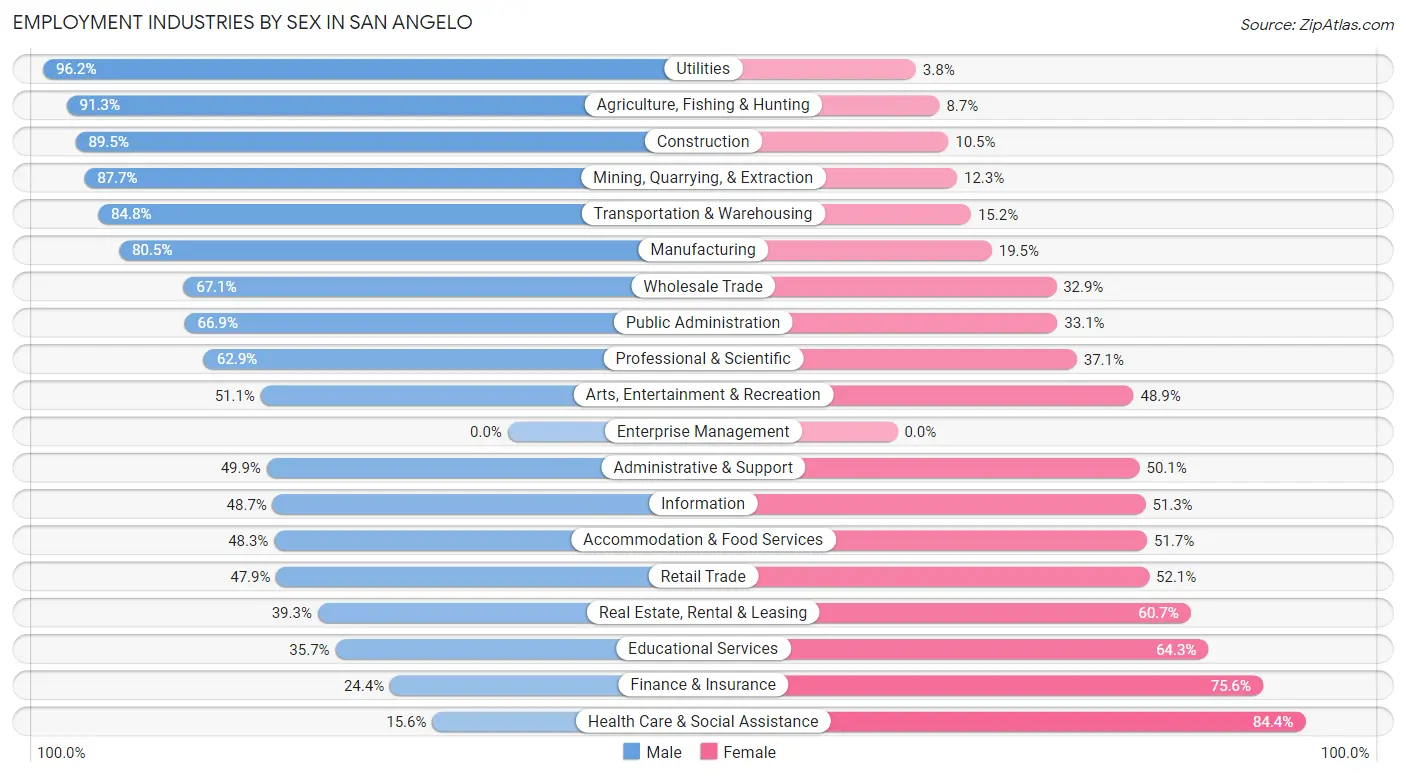
| Industry | Male | Female |
| Agriculture, Fishing & Hunting | 357 (91.3%) | 34 (8.7%) |
| Mining, Quarrying, & Extraction | 1,555 (87.7%) | 219 (12.3%) |
| Construction | 3,353 (89.5%) | 395 (10.5%) |
| Manufacturing | 1,935 (80.5%) | 470 (19.5%) |
| Wholesale Trade | 519 (67.1%) | 254 (32.9%) |
| Retail Trade | 2,924 (47.9%) | 3,180 (52.1%) |
| Transportation & Warehousing | 1,609 (84.8%) | 289 (15.2%) |
| Utilities | 352 (96.2%) | 14 (3.8%) |
| Information | 363 (48.7%) | 383 (51.3%) |
| Finance & Insurance | 481 (24.4%) | 1,493 (75.6%) |
| Real Estate, Rental & Leasing | 319 (39.3%) | 492 (60.7%) |
| Professional & Scientific | 1,487 (62.9%) | 878 (37.1%) |
| Enterprise Management | 0 (0.0%) | 0 (0.0%) |
| Administrative & Support | 909 (49.9%) | 913 (50.1%) |
| Educational Services | 1,475 (35.7%) | 2,660 (64.3%) |
| Health Care & Social Assistance | 1,109 (15.6%) | 5,991 (84.4%) |
| Arts, Entertainment & Recreation | 249 (51.1%) | 238 (48.9%) |
| Accommodation & Food Services | 1,778 (48.3%) | 1,900 (51.7%) |
| Public Administration | 2,551 (66.9%) | 1,263 (33.1%) |
| Total | 24,915 (52.7%) | 22,328 (47.3%) |
Education in San Angelo
School Enrollment in San Angelo
The most common levels of schooling among the 26,280 students in San Angelo are college / undergraduate (7,514 | 28.6%), middle school (5,821 | 22.2%), and high school (4,976 | 18.9%).
| School Level | # Students | % Students |
| Nursery / Preschool | 1,202 | 4.6% |
| Kindergarten | 957 | 3.6% |
| Elementary School | 4,776 | 18.2% |
| Middle School | 5,821 | 22.2% |
| High School | 4,976 | 18.9% |
| College / Undergraduate | 7,514 | 28.6% |
| Graduate / Professional | 1,034 | 3.9% |
| Total | 26,280 | 100.0% |
School Enrollment by Age by Funding Source in San Angelo
Out of a total of 26,280 students who are enrolled in schools in San Angelo, 2,786 (10.6%) attend a private institution, while the remaining 23,494 (89.4%) are enrolled in public schools. The age group of 3 to 4 year olds has the highest likelihood of being enrolled in private schools, with 240 (27.5% in the age bracket) enrolled. Conversely, the age group of 18 to 19 year olds has the lowest likelihood of being enrolled in a private school, with 2,433 (96.0% in the age bracket) attending a public institution.
| Age Bracket | Public School | Private School |
| 3 to 4 Year Olds | 632 (72.5%) | 240 (27.5%) |
| 5 to 9 Year Old | 4,768 (92.9%) | 366 (7.1%) |
| 10 to 14 Year Olds | 6,255 (88.0%) | 850 (12.0%) |
| 15 to 17 Year Olds | 3,305 (88.2%) | 444 (11.8%) |
| 18 to 19 Year Olds | 2,433 (96.0%) | 102 (4.0%) |
| 20 to 24 Year Olds | 3,193 (93.3%) | 230 (6.7%) |
| 25 to 34 Year Olds | 1,510 (82.9%) | 311 (17.1%) |
| 35 Years and over | 1,404 (85.6%) | 237 (14.4%) |
| Total | 23,494 (89.4%) | 2,786 (10.6%) |
Educational Attainment by Field of Study in San Angelo
Business (3,585 | 20.9%), education (2,355 | 13.7%), science & technology (1,758 | 10.2%), arts & humanities (1,612 | 9.4%), and bio, nature & agricultural (1,394 | 8.1%) are the most common fields of study among 17,178 individuals in San Angelo who have obtained a bachelor's degree or higher.
| Field of Study | # Graduates | % Graduates |
| Computers & Mathematics | 538 | 3.1% |
| Bio, Nature & Agricultural | 1,394 | 8.1% |
| Physical & Health Sciences | 403 | 2.4% |
| Psychology | 1,215 | 7.1% |
| Social Sciences | 744 | 4.3% |
| Engineering | 559 | 3.3% |
| Multidisciplinary Studies | 181 | 1.1% |
| Science & Technology | 1,758 | 10.2% |
| Business | 3,585 | 20.9% |
| Education | 2,355 | 13.7% |
| Literature & Languages | 758 | 4.4% |
| Liberal Arts & History | 1,007 | 5.9% |
| Visual & Performing Arts | 413 | 2.4% |
| Communications | 656 | 3.8% |
| Arts & Humanities | 1,612 | 9.4% |
| Total | 17,178 | 100.0% |
Transportation & Commute in San Angelo
Vehicle Availability by Sex in San Angelo
The most prevalent vehicle ownership categories in San Angelo are males with 2 vehicles (11,561, accounting for 47.1%) and females with 2 vehicles (9,252, making up 53.5%).
| Vehicles Available | Male | Female |
| No Vehicle | 701 (2.9%) | 370 (1.7%) |
| 1 Vehicle | 4,512 (18.4%) | 5,668 (26.2%) |
| 2 Vehicles | 11,561 (47.1%) | 9,252 (42.8%) |
| 3 Vehicles | 5,804 (23.6%) | 4,224 (19.5%) |
| 4 Vehicles | 1,029 (4.2%) | 1,362 (6.3%) |
| 5 or more Vehicles | 961 (3.9%) | 740 (3.4%) |
| Total | 24,568 (100.0%) | 21,616 (100.0%) |
Commute Time in San Angelo
The most frequently occuring commute durations in San Angelo are 15 to 19 minutes (12,878 commuters, 28.3%), 10 to 14 minutes (11,526 commuters, 25.3%), and 5 to 9 minutes (9,069 commuters, 19.9%).
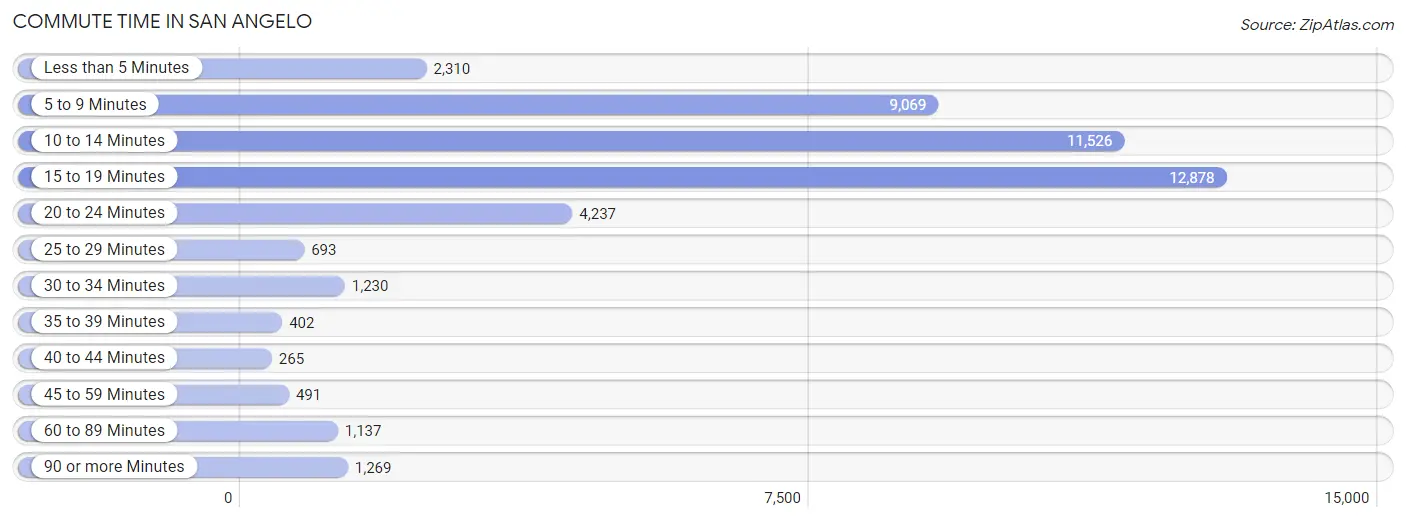
| Commute Time | # Commuters | % Commuters |
| Less than 5 Minutes | 2,310 | 5.1% |
| 5 to 9 Minutes | 9,069 | 19.9% |
| 10 to 14 Minutes | 11,526 | 25.3% |
| 15 to 19 Minutes | 12,878 | 28.3% |
| 20 to 24 Minutes | 4,237 | 9.3% |
| 25 to 29 Minutes | 693 | 1.5% |
| 30 to 34 Minutes | 1,230 | 2.7% |
| 35 to 39 Minutes | 402 | 0.9% |
| 40 to 44 Minutes | 265 | 0.6% |
| 45 to 59 Minutes | 491 | 1.1% |
| 60 to 89 Minutes | 1,137 | 2.5% |
| 90 or more Minutes | 1,269 | 2.8% |
Commute Time by Sex in San Angelo
The most common commute times in San Angelo are 15 to 19 minutes (6,566 commuters, 26.4%) for males and 15 to 19 minutes (6,312 commuters, 30.5%) for females.
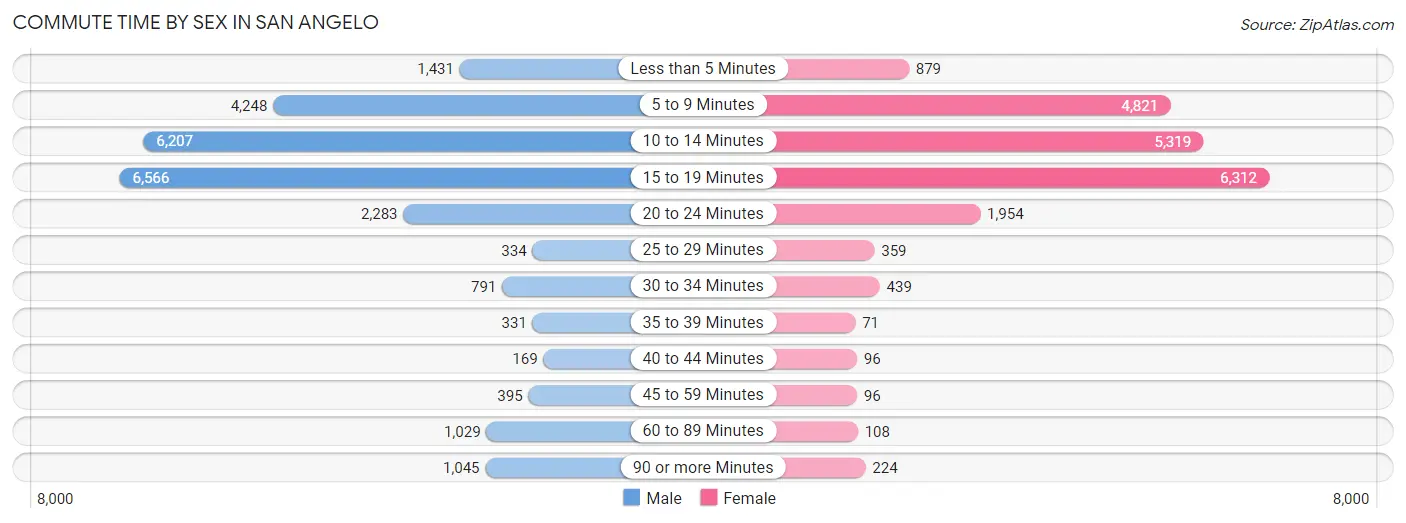
| Commute Time | Male | Female |
| Less than 5 Minutes | 1,431 (5.8%) | 879 (4.3%) |
| 5 to 9 Minutes | 4,248 (17.1%) | 4,821 (23.3%) |
| 10 to 14 Minutes | 6,207 (25.0%) | 5,319 (25.7%) |
| 15 to 19 Minutes | 6,566 (26.4%) | 6,312 (30.5%) |
| 20 to 24 Minutes | 2,283 (9.2%) | 1,954 (9.5%) |
| 25 to 29 Minutes | 334 (1.3%) | 359 (1.7%) |
| 30 to 34 Minutes | 791 (3.2%) | 439 (2.1%) |
| 35 to 39 Minutes | 331 (1.3%) | 71 (0.3%) |
| 40 to 44 Minutes | 169 (0.7%) | 96 (0.5%) |
| 45 to 59 Minutes | 395 (1.6%) | 96 (0.5%) |
| 60 to 89 Minutes | 1,029 (4.1%) | 108 (0.5%) |
| 90 or more Minutes | 1,045 (4.2%) | 224 (1.1%) |
Time of Departure to Work by Sex in San Angelo
The most frequent times of departure to work in San Angelo are 7:30 AM to 7:59 AM (3,505, 14.1%) for males and 7:30 AM to 7:59 AM (4,425, 21.4%) for females.
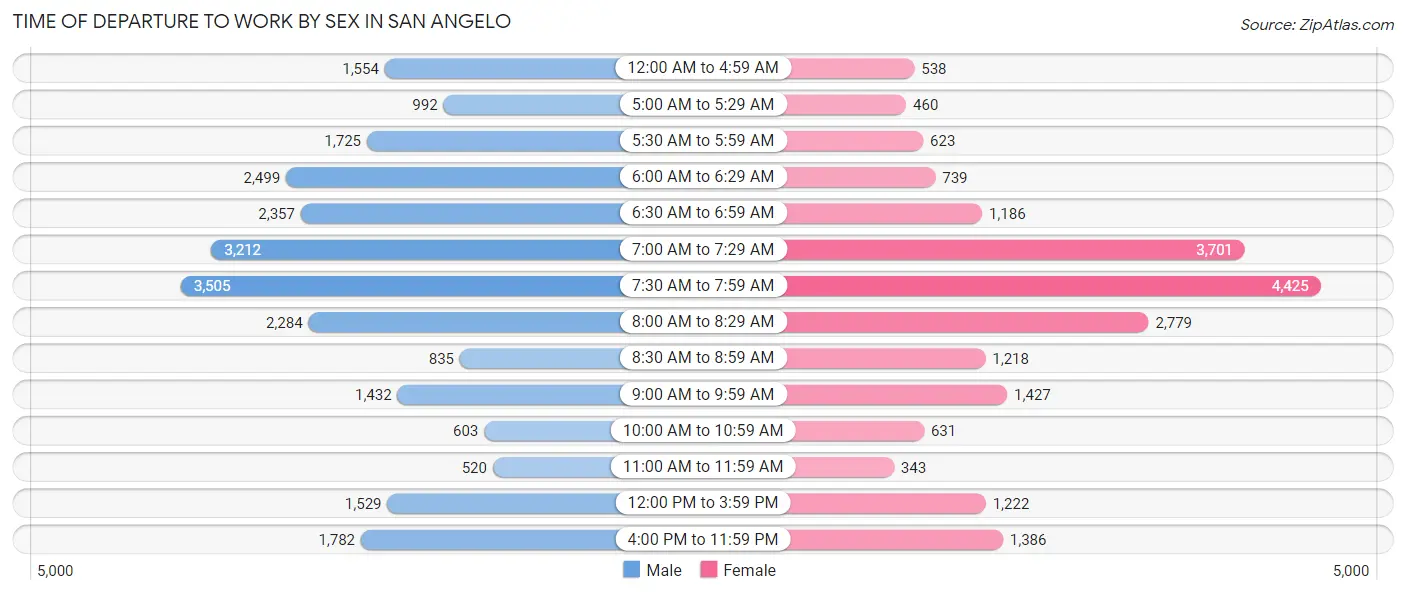
| Time of Departure | Male | Female |
| 12:00 AM to 4:59 AM | 1,554 (6.3%) | 538 (2.6%) |
| 5:00 AM to 5:29 AM | 992 (4.0%) | 460 (2.2%) |
| 5:30 AM to 5:59 AM | 1,725 (7.0%) | 623 (3.0%) |
| 6:00 AM to 6:29 AM | 2,499 (10.1%) | 739 (3.6%) |
| 6:30 AM to 6:59 AM | 2,357 (9.5%) | 1,186 (5.7%) |
| 7:00 AM to 7:29 AM | 3,212 (12.9%) | 3,701 (17.9%) |
| 7:30 AM to 7:59 AM | 3,505 (14.1%) | 4,425 (21.4%) |
| 8:00 AM to 8:29 AM | 2,284 (9.2%) | 2,779 (13.4%) |
| 8:30 AM to 8:59 AM | 835 (3.4%) | 1,218 (5.9%) |
| 9:00 AM to 9:59 AM | 1,432 (5.8%) | 1,427 (6.9%) |
| 10:00 AM to 10:59 AM | 603 (2.4%) | 631 (3.0%) |
| 11:00 AM to 11:59 AM | 520 (2.1%) | 343 (1.7%) |
| 12:00 PM to 3:59 PM | 1,529 (6.2%) | 1,222 (5.9%) |
| 4:00 PM to 11:59 PM | 1,782 (7.2%) | 1,386 (6.7%) |
| Total | 24,829 (100.0%) | 20,678 (100.0%) |
Housing Occupancy in San Angelo
Occupancy by Ownership in San Angelo
Of the total 38,447 dwellings in San Angelo, owner-occupied units account for 24,596 (64.0%), while renter-occupied units make up 13,851 (36.0%).
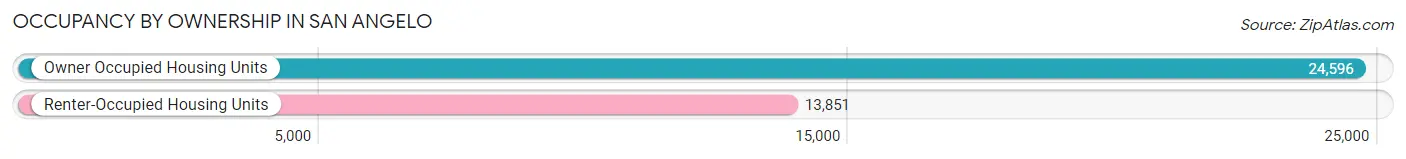
| Occupancy | # Housing Units | % Housing Units |
| Owner Occupied Housing Units | 24,596 | 64.0% |
| Renter-Occupied Housing Units | 13,851 | 36.0% |
| Total Occupied Housing Units | 38,447 | 100.0% |
Occupancy by Household Size in San Angelo
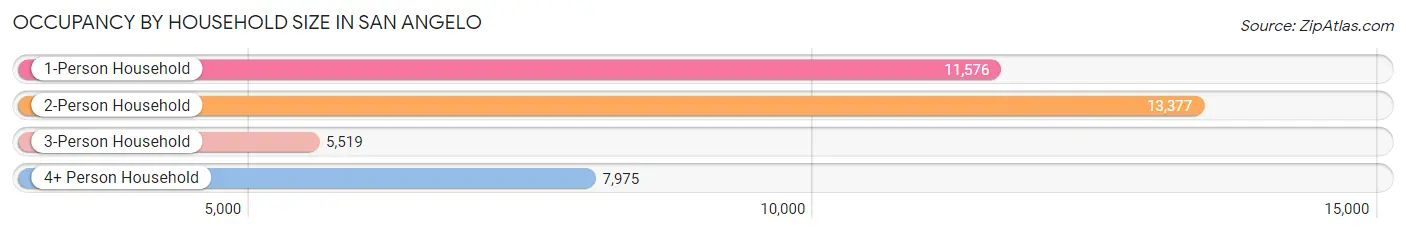
| Household Size | # Housing Units | % Housing Units |
| 1-Person Household | 11,576 | 30.1% |
| 2-Person Household | 13,377 | 34.8% |
| 3-Person Household | 5,519 | 14.3% |
| 4+ Person Household | 7,975 | 20.7% |
| Total Housing Units | 38,447 | 100.0% |
Occupancy by Ownership by Household Size in San Angelo
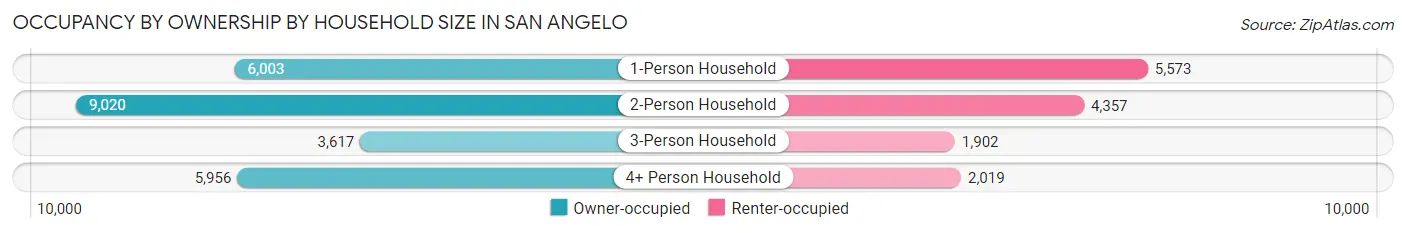
| Household Size | Owner-occupied | Renter-occupied |
| 1-Person Household | 6,003 (51.9%) | 5,573 (48.1%) |
| 2-Person Household | 9,020 (67.4%) | 4,357 (32.6%) |
| 3-Person Household | 3,617 (65.5%) | 1,902 (34.5%) |
| 4+ Person Household | 5,956 (74.7%) | 2,019 (25.3%) |
| Total Housing Units | 24,596 (64.0%) | 13,851 (36.0%) |
Occupancy by Educational Attainment in San Angelo
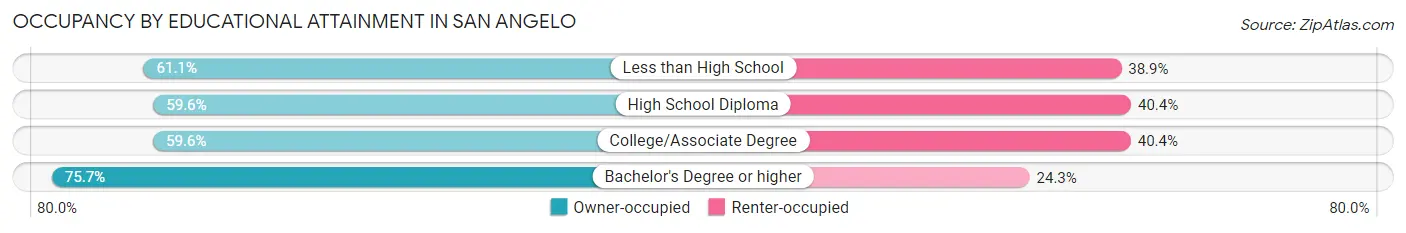
| Household Size | Owner-occupied | Renter-occupied |
| Less than High School | 2,872 (61.1%) | 1,827 (38.9%) |
| High School Diploma | 5,503 (59.6%) | 3,735 (40.4%) |
| College/Associate Degree | 8,627 (59.6%) | 5,846 (40.4%) |
| Bachelor's Degree or higher | 7,594 (75.7%) | 2,443 (24.3%) |
Occupancy by Age of Householder in San Angelo
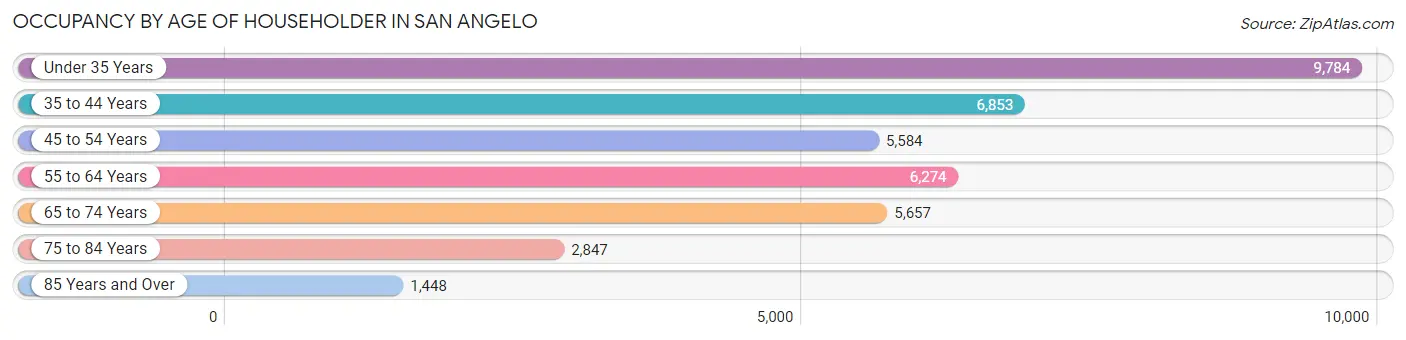
| Age Bracket | # Households | % Households |
| Under 35 Years | 9,784 | 25.5% |
| 35 to 44 Years | 6,853 | 17.8% |
| 45 to 54 Years | 5,584 | 14.5% |
| 55 to 64 Years | 6,274 | 16.3% |
| 65 to 74 Years | 5,657 | 14.7% |
| 75 to 84 Years | 2,847 | 7.4% |
| 85 Years and Over | 1,448 | 3.8% |
| Total | 38,447 | 100.0% |
Housing Finances in San Angelo
Median Income by Occupancy in San Angelo
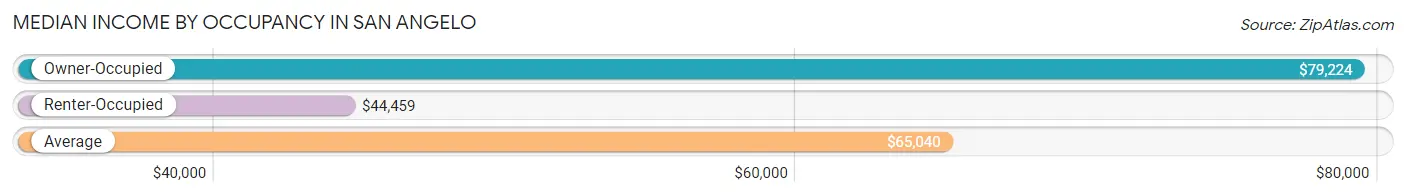
| Occupancy Type | # Households | Median Income |
| Owner-Occupied | 24,596 (64.0%) | $79,224 |
| Renter-Occupied | 13,851 (36.0%) | $44,459 |
| Average | 38,447 (100.0%) | $65,040 |
Occupancy by Householder Income Bracket in San Angelo
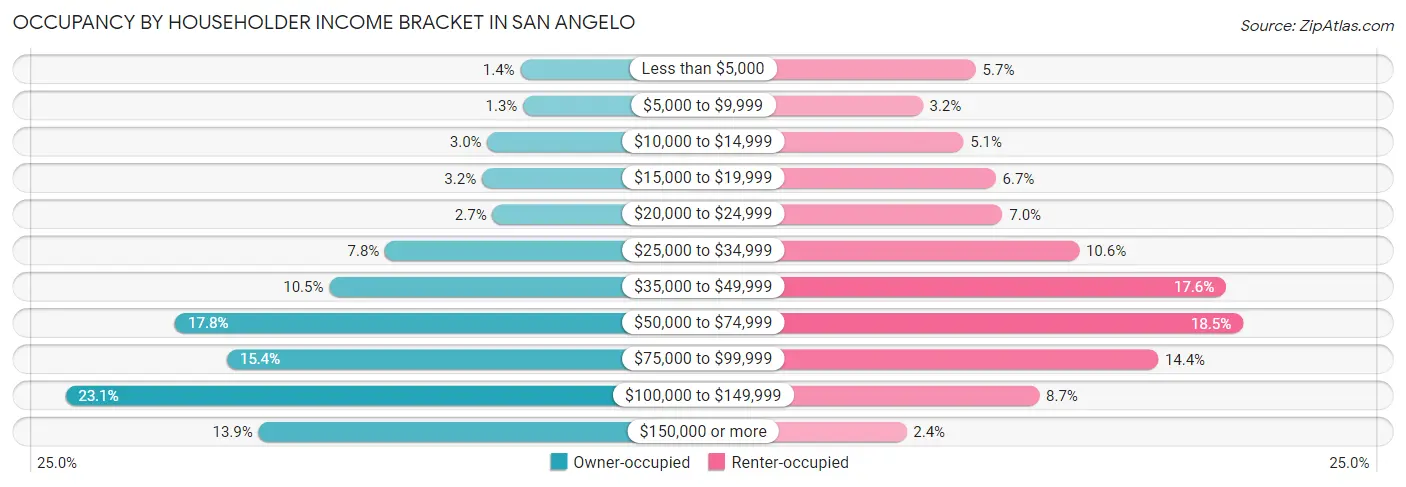
| Income Bracket | Owner-occupied | Renter-occupied |
| Less than $5,000 | 341 (1.4%) | 792 (5.7%) |
| $5,000 to $9,999 | 311 (1.3%) | 442 (3.2%) |
| $10,000 to $14,999 | 728 (3.0%) | 710 (5.1%) |
| $15,000 to $19,999 | 793 (3.2%) | 924 (6.7%) |
| $20,000 to $24,999 | 670 (2.7%) | 968 (7.0%) |
| $25,000 to $34,999 | 1,927 (7.8%) | 1,474 (10.6%) |
| $35,000 to $49,999 | 2,580 (10.5%) | 2,444 (17.6%) |
| $50,000 to $74,999 | 4,385 (17.8%) | 2,556 (18.4%) |
| $75,000 to $99,999 | 3,781 (15.4%) | 1,995 (14.4%) |
| $100,000 to $149,999 | 5,672 (23.1%) | 1,211 (8.7%) |
| $150,000 or more | 3,408 (13.9%) | 335 (2.4%) |
| Total | 24,596 (100.0%) | 13,851 (100.0%) |
Monthly Housing Cost Tiers in San Angelo
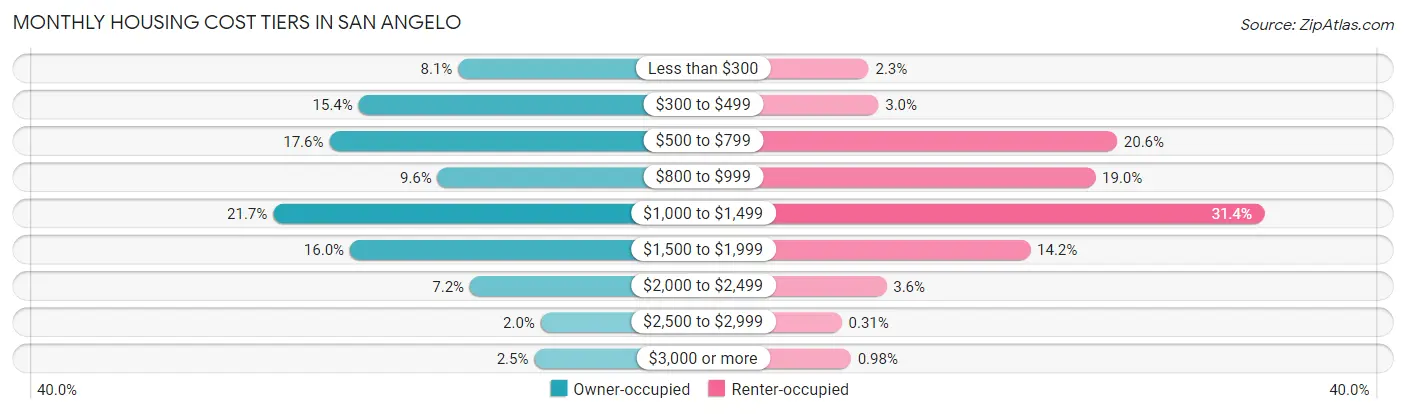
| Monthly Cost | Owner-occupied | Renter-occupied |
| Less than $300 | 1,985 (8.1%) | 317 (2.3%) |
| $300 to $499 | 3,787 (15.4%) | 417 (3.0%) |
| $500 to $799 | 4,318 (17.6%) | 2,850 (20.6%) |
| $800 to $999 | 2,356 (9.6%) | 2,629 (19.0%) |
| $1,000 to $1,499 | 5,338 (21.7%) | 4,349 (31.4%) |
| $1,500 to $1,999 | 3,945 (16.0%) | 1,966 (14.2%) |
| $2,000 to $2,499 | 1,771 (7.2%) | 498 (3.6%) |
| $2,500 to $2,999 | 490 (2.0%) | 43 (0.3%) |
| $3,000 or more | 606 (2.5%) | 136 (1.0%) |
| Total | 24,596 (100.0%) | 13,851 (100.0%) |
Physical Housing Characteristics in San Angelo
Housing Structures in San Angelo
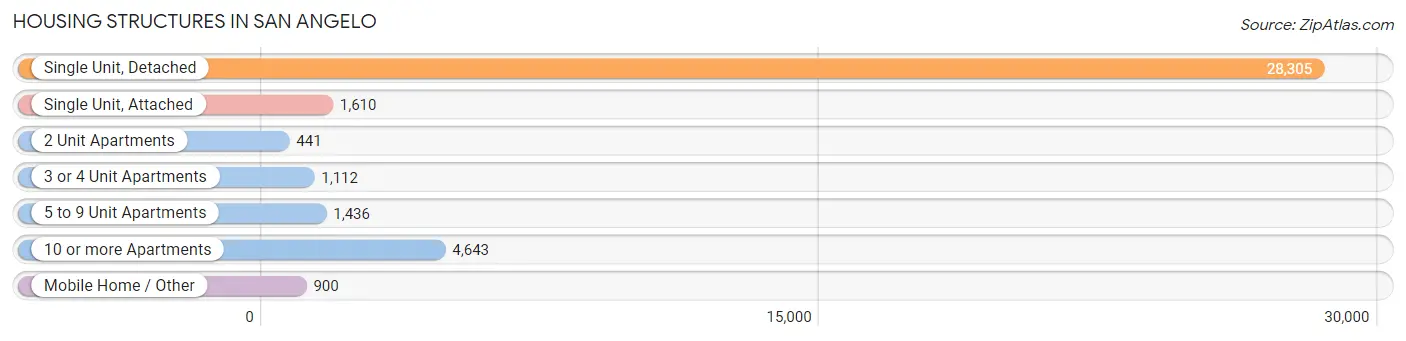
| Structure Type | # Housing Units | % Housing Units |
| Single Unit, Detached | 28,305 | 73.6% |
| Single Unit, Attached | 1,610 | 4.2% |
| 2 Unit Apartments | 441 | 1.1% |
| 3 or 4 Unit Apartments | 1,112 | 2.9% |
| 5 to 9 Unit Apartments | 1,436 | 3.7% |
| 10 or more Apartments | 4,643 | 12.1% |
| Mobile Home / Other | 900 | 2.3% |
| Total | 38,447 | 100.0% |
Housing Structures by Occupancy in San Angelo
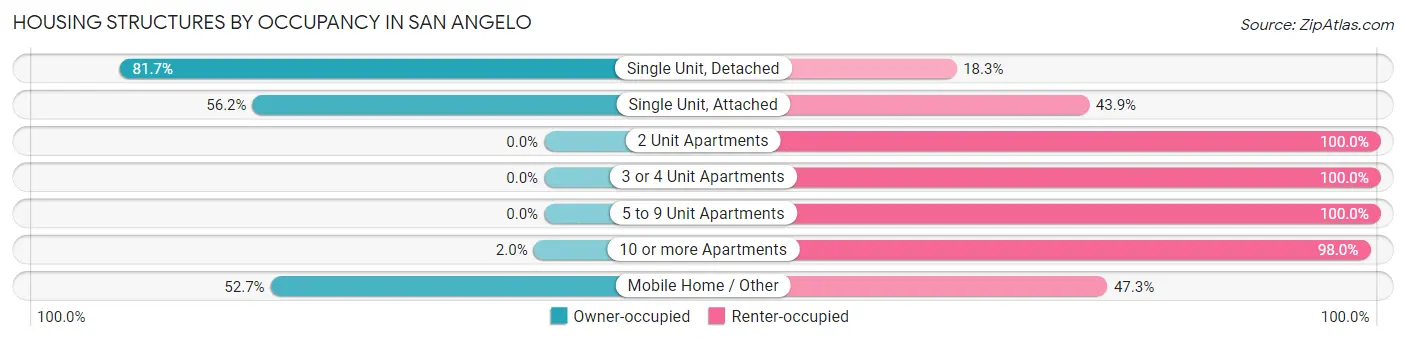
| Structure Type | Owner-occupied | Renter-occupied |
| Single Unit, Detached | 23,124 (81.7%) | 5,181 (18.3%) |
| Single Unit, Attached | 904 (56.1%) | 706 (43.9%) |
| 2 Unit Apartments | 0 (0.0%) | 441 (100.0%) |
| 3 or 4 Unit Apartments | 0 (0.0%) | 1,112 (100.0%) |
| 5 to 9 Unit Apartments | 0 (0.0%) | 1,436 (100.0%) |
| 10 or more Apartments | 94 (2.0%) | 4,549 (98.0%) |
| Mobile Home / Other | 474 (52.7%) | 426 (47.3%) |
| Total | 24,596 (64.0%) | 13,851 (36.0%) |
Housing Structures by Number of Rooms in San Angelo
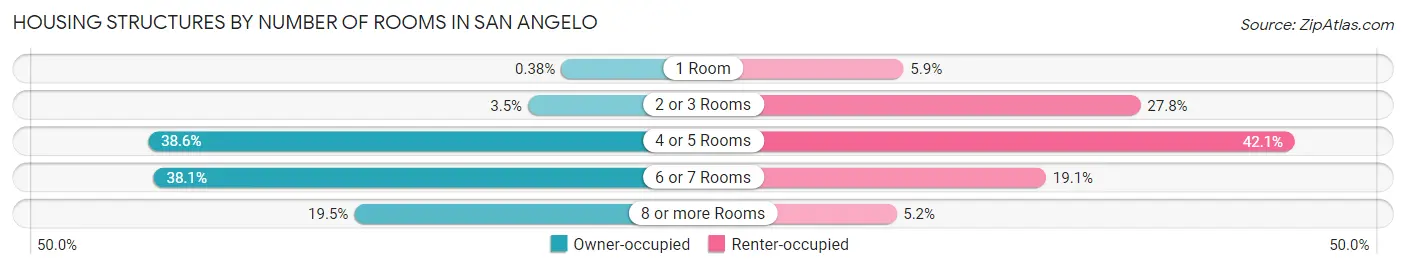
| Number of Rooms | Owner-occupied | Renter-occupied |
| 1 Room | 93 (0.4%) | 813 (5.9%) |
| 2 or 3 Rooms | 849 (3.5%) | 3,849 (27.8%) |
| 4 or 5 Rooms | 9,488 (38.6%) | 5,829 (42.1%) |
| 6 or 7 Rooms | 9,364 (38.1%) | 2,638 (19.1%) |
| 8 or more Rooms | 4,802 (19.5%) | 722 (5.2%) |
| Total | 24,596 (100.0%) | 13,851 (100.0%) |
Housing Structure by Heating Type in San Angelo
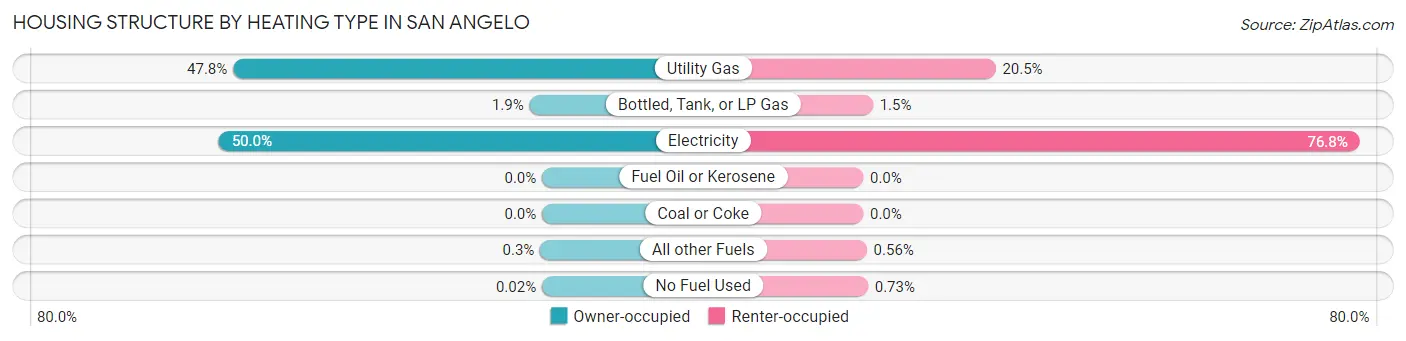
| Heating Type | Owner-occupied | Renter-occupied |
| Utility Gas | 11,749 (47.8%) | 2,835 (20.5%) |
| Bottled, Tank, or LP Gas | 478 (1.9%) | 207 (1.5%) |
| Electricity | 12,292 (50.0%) | 10,631 (76.7%) |
| Fuel Oil or Kerosene | 0 (0.0%) | 0 (0.0%) |
| Coal or Coke | 0 (0.0%) | 0 (0.0%) |
| All other Fuels | 73 (0.3%) | 77 (0.6%) |
| No Fuel Used | 4 (0.0%) | 101 (0.7%) |
| Total | 24,596 (100.0%) | 13,851 (100.0%) |
Household Vehicle Usage in San Angelo
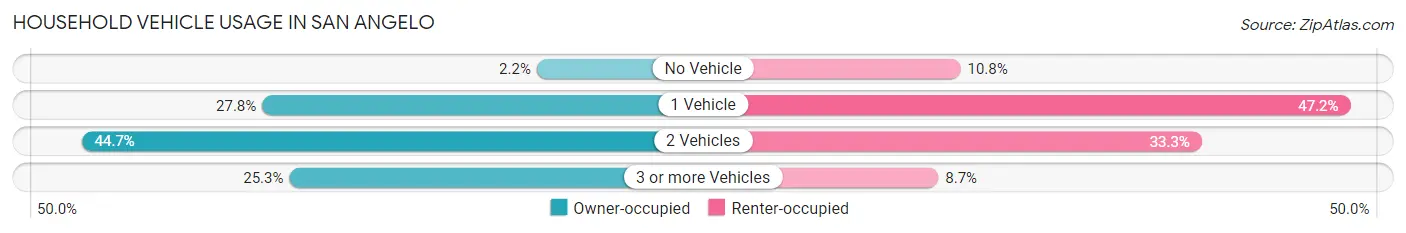
| Vehicles per Household | Owner-occupied | Renter-occupied |
| No Vehicle | 538 (2.2%) | 1,495 (10.8%) |
| 1 Vehicle | 6,846 (27.8%) | 6,535 (47.2%) |
| 2 Vehicles | 10,991 (44.7%) | 4,613 (33.3%) |
| 3 or more Vehicles | 6,221 (25.3%) | 1,208 (8.7%) |
| Total | 24,596 (100.0%) | 13,851 (100.0%) |
Real Estate & Mortgages in San Angelo
Real Estate and Mortgage Overview in San Angelo
| Characteristic | Without Mortgage | With Mortgage |
| Housing Units | 12,341 | 12,255 |
| Median Property Value | $156,500 | $183,600 |
| Median Household Income | $66,743 | $2,019 |
| Monthly Housing Costs | $533 | $562 |
| Real Estate Taxes | $1,683 | $604 |
Property Value by Mortgage Status in San Angelo
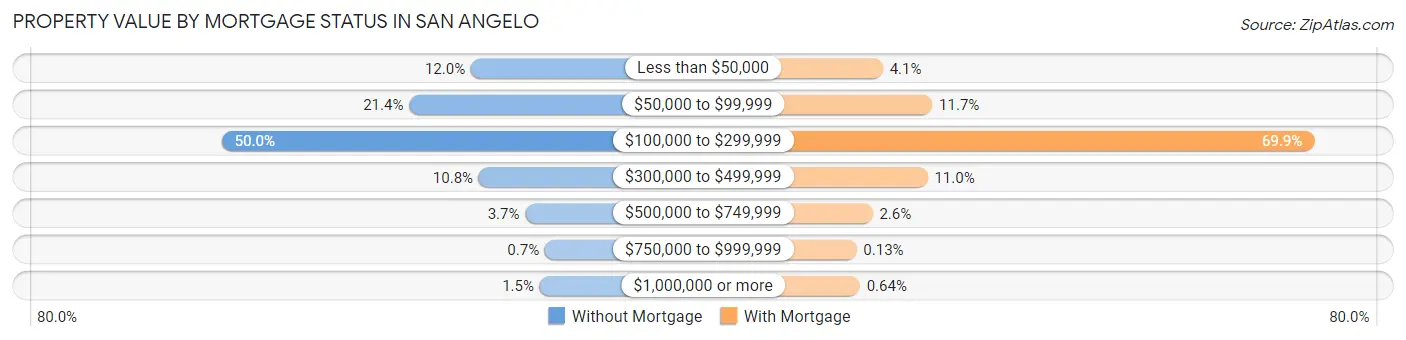
| Property Value | Without Mortgage | With Mortgage |
| Less than $50,000 | 1,478 (12.0%) | 507 (4.1%) |
| $50,000 to $99,999 | 2,640 (21.4%) | 1,430 (11.7%) |
| $100,000 to $299,999 | 6,167 (50.0%) | 8,564 (69.9%) |
| $300,000 to $499,999 | 1,329 (10.8%) | 1,343 (11.0%) |
| $500,000 to $749,999 | 456 (3.7%) | 316 (2.6%) |
| $750,000 to $999,999 | 87 (0.7%) | 16 (0.1%) |
| $1,000,000 or more | 184 (1.5%) | 79 (0.6%) |
| Total | 12,341 (100.0%) | 12,255 (100.0%) |
Household Income by Mortgage Status in San Angelo
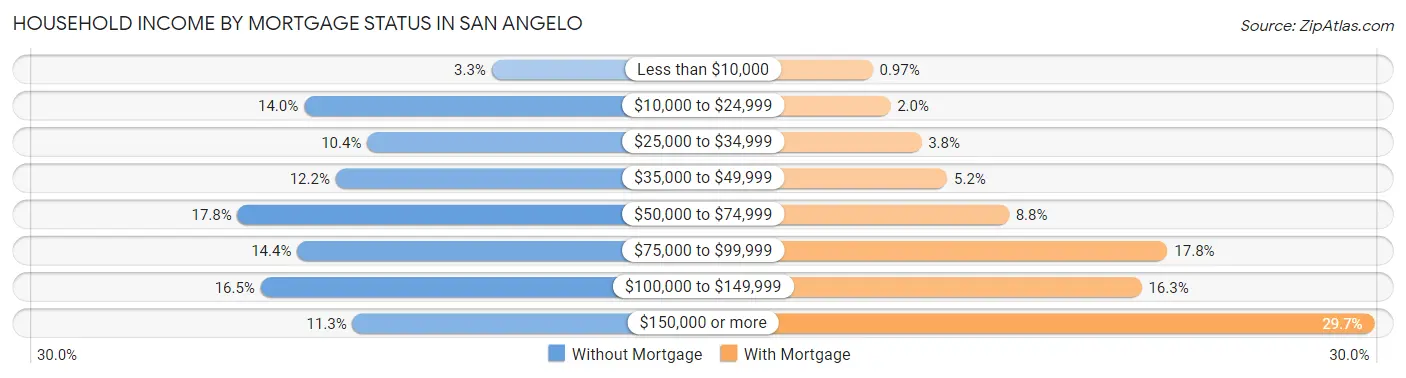
| Household Income | Without Mortgage | With Mortgage |
| Less than $10,000 | 409 (3.3%) | 119 (1.0%) |
| $10,000 to $24,999 | 1,731 (14.0%) | 243 (2.0%) |
| $25,000 to $34,999 | 1,286 (10.4%) | 460 (3.7%) |
| $35,000 to $49,999 | 1,508 (12.2%) | 641 (5.2%) |
| $50,000 to $74,999 | 2,201 (17.8%) | 1,072 (8.7%) |
| $75,000 to $99,999 | 1,779 (14.4%) | 2,184 (17.8%) |
| $100,000 to $149,999 | 2,038 (16.5%) | 2,002 (16.3%) |
| $150,000 or more | 1,389 (11.3%) | 3,634 (29.6%) |
| Total | 12,341 (100.0%) | 12,255 (100.0%) |
Property Value to Household Income Ratio in San Angelo
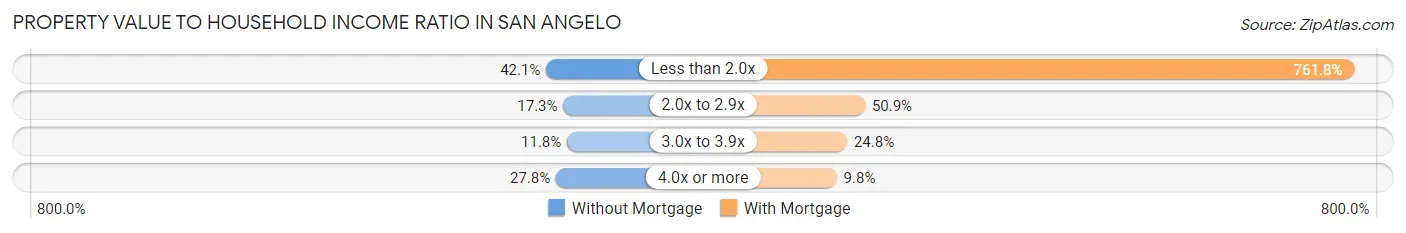
| Value-to-Income Ratio | Without Mortgage | With Mortgage |
| Less than 2.0x | 5,201 (42.1%) | 93,361 (761.8%) |
| 2.0x to 2.9x | 2,129 (17.2%) | 6,235 (50.9%) |
| 3.0x to 3.9x | 1,452 (11.8%) | 3,041 (24.8%) |
| 4.0x or more | 3,436 (27.8%) | 1,200 (9.8%) |
| Total | 12,341 (100.0%) | 12,255 (100.0%) |
Real Estate Taxes by Mortgage Status in San Angelo
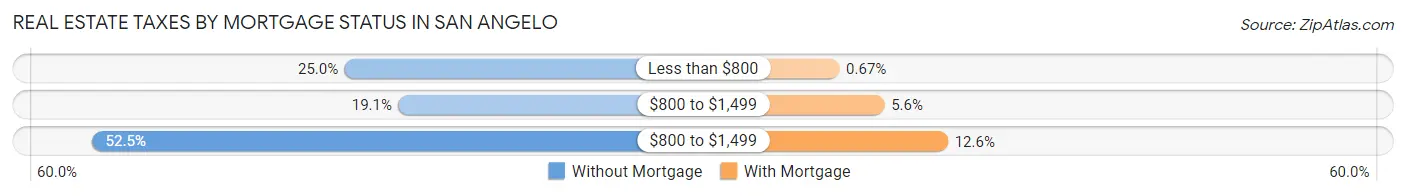
| Property Taxes | Without Mortgage | With Mortgage |
| Less than $800 | 3,084 (25.0%) | 82 (0.7%) |
| $800 to $1,499 | 2,357 (19.1%) | 687 (5.6%) |
| $800 to $1,499 | 6,484 (52.5%) | 1,540 (12.6%) |
| Total | 12,341 (100.0%) | 12,255 (100.0%) |
Health & Disability in San Angelo
Health Insurance Coverage by Age in San Angelo
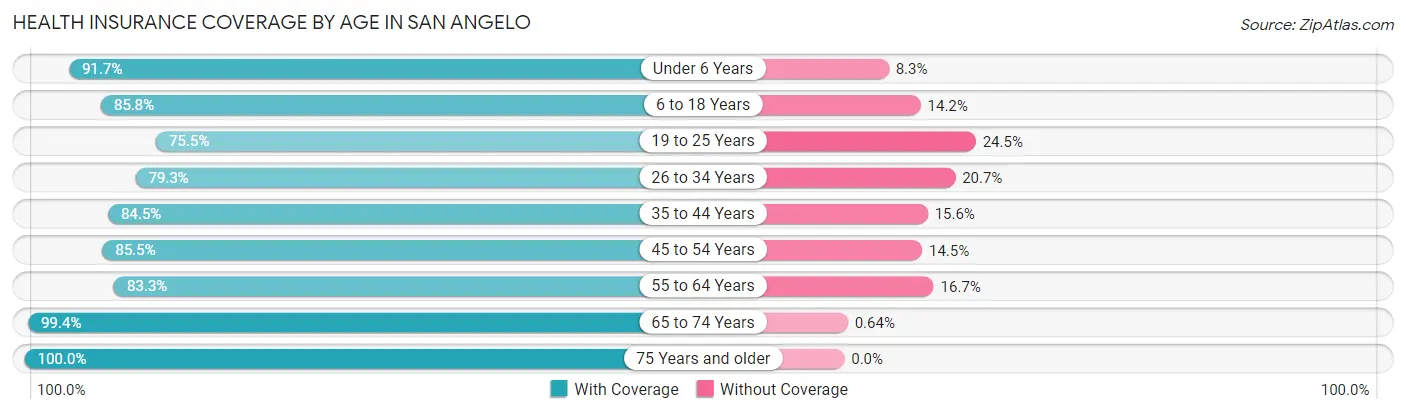
| Age Bracket | With Coverage | Without Coverage |
| Under 6 Years | 6,721 (91.7%) | 607 (8.3%) |
| 6 to 18 Years | 14,624 (85.8%) | 2,427 (14.2%) |
| 19 to 25 Years | 7,868 (75.5%) | 2,554 (24.5%) |
| 26 to 34 Years | 9,732 (79.3%) | 2,537 (20.7%) |
| 35 to 44 Years | 9,914 (84.5%) | 1,825 (15.5%) |
| 45 to 54 Years | 8,522 (85.5%) | 1,445 (14.5%) |
| 55 to 64 Years | 8,865 (83.3%) | 1,772 (16.7%) |
| 65 to 74 Years | 8,906 (99.4%) | 57 (0.6%) |
| 75 Years and older | 6,376 (100.0%) | 0 (0.0%) |
| Total | 81,528 (86.0%) | 13,224 (14.0%) |
Health Insurance Coverage by Citizenship Status in San Angelo
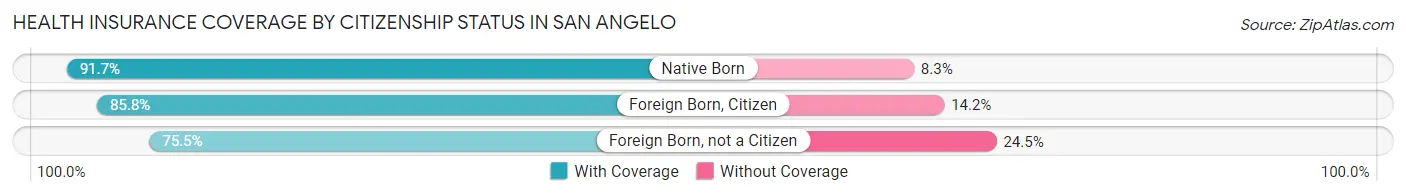
| Citizenship Status | With Coverage | Without Coverage |
| Native Born | 6,721 (91.7%) | 607 (8.3%) |
| Foreign Born, Citizen | 14,624 (85.8%) | 2,427 (14.2%) |
| Foreign Born, not a Citizen | 7,868 (75.5%) | 2,554 (24.5%) |
Health Insurance Coverage by Household Income in San Angelo
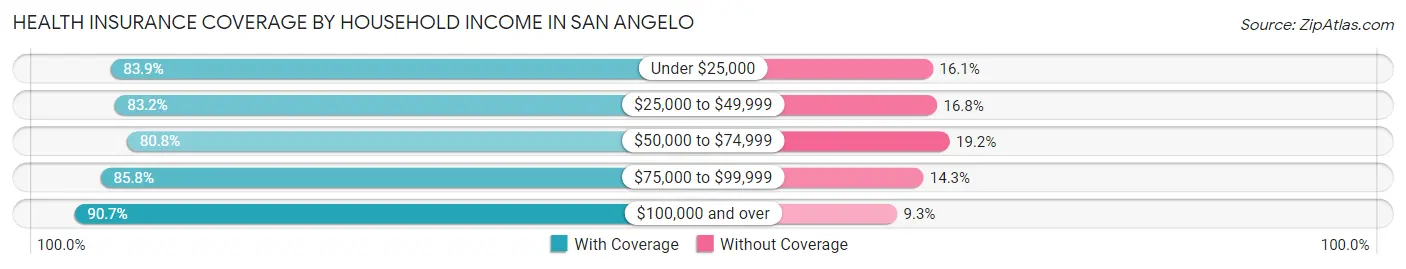
| Household Income | With Coverage | Without Coverage |
| Under $25,000 | 8,980 (83.9%) | 1,718 (16.1%) |
| $25,000 to $49,999 | 14,786 (83.2%) | 2,989 (16.8%) |
| $50,000 to $74,999 | 13,749 (80.8%) | 3,260 (19.2%) |
| $75,000 to $99,999 | 12,946 (85.8%) | 2,152 (14.2%) |
| $100,000 and over | 29,128 (90.7%) | 2,998 (9.3%) |
Public vs Private Health Insurance Coverage by Age in San Angelo
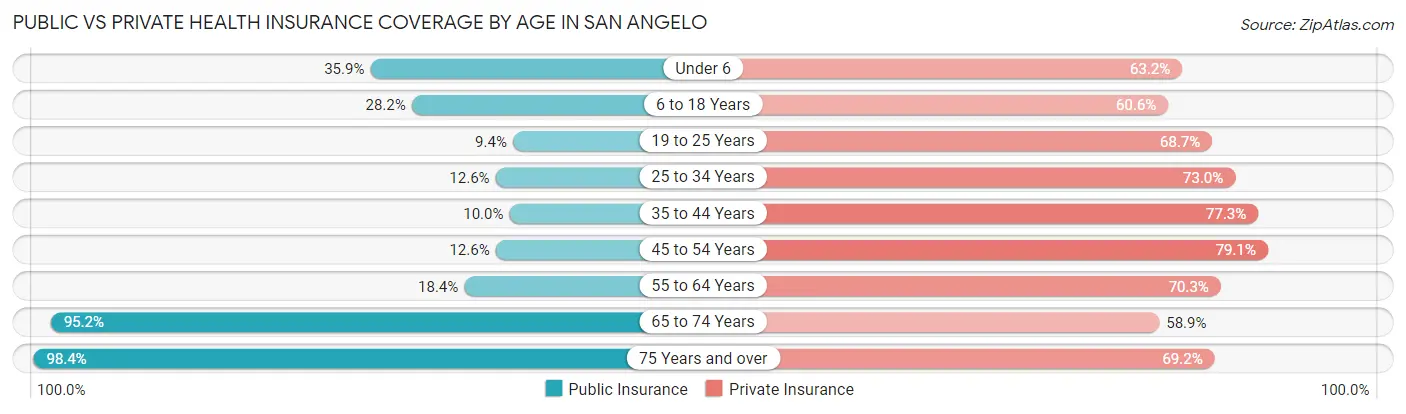
| Age Bracket | Public Insurance | Private Insurance |
| Under 6 | 2,627 (35.8%) | 4,629 (63.2%) |
| 6 to 18 Years | 4,804 (28.2%) | 10,327 (60.6%) |
| 19 to 25 Years | 979 (9.4%) | 7,164 (68.7%) |
| 25 to 34 Years | 1,547 (12.6%) | 8,956 (73.0%) |
| 35 to 44 Years | 1,179 (10.0%) | 9,071 (77.3%) |
| 45 to 54 Years | 1,256 (12.6%) | 7,879 (79.0%) |
| 55 to 64 Years | 1,959 (18.4%) | 7,480 (70.3%) |
| 65 to 74 Years | 8,528 (95.2%) | 5,282 (58.9%) |
| 75 Years and over | 6,271 (98.4%) | 4,410 (69.2%) |
| Total | 29,150 (30.8%) | 65,198 (68.8%) |
Disability Status by Sex by Age in San Angelo
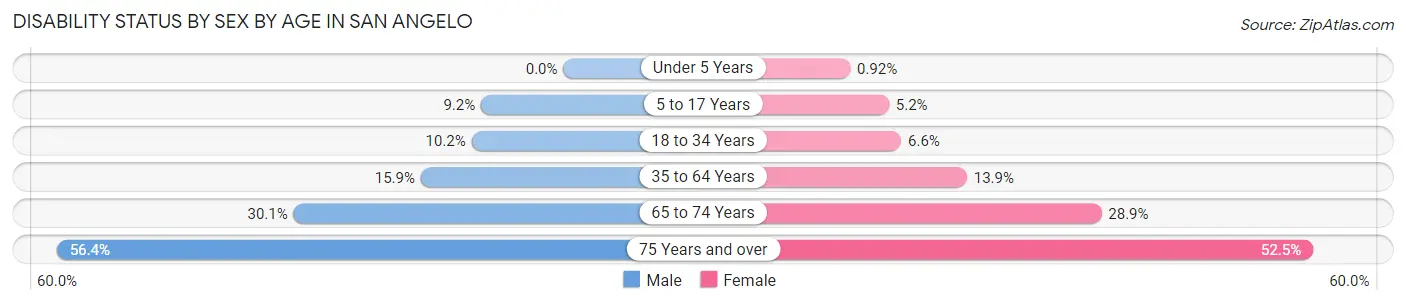
| Age Bracket | Male | Female |
| Under 5 Years | 0 (0.0%) | 28 (0.9%) |
| 5 to 17 Years | 794 (9.2%) | 438 (5.2%) |
| 18 to 34 Years | 1,262 (10.2%) | 768 (6.6%) |
| 35 to 64 Years | 2,434 (15.9%) | 2,368 (13.9%) |
| 65 to 74 Years | 1,261 (30.0%) | 1,378 (28.9%) |
| 75 Years and over | 1,503 (56.4%) | 1,948 (52.5%) |
Disability Class by Sex by Age in San Angelo
Disability Class: Hearing Difficulty
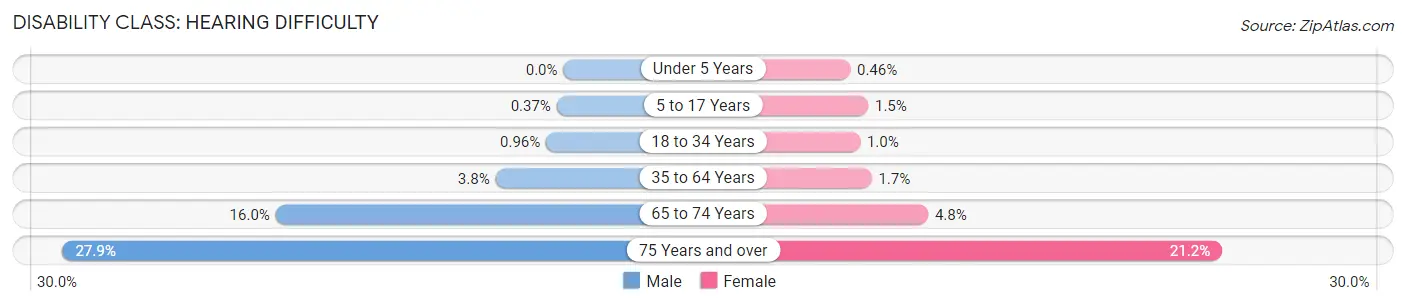
| Age Bracket | Male | Female |
| Under 5 Years | 0 (0.0%) | 14 (0.5%) |
| 5 to 17 Years | 32 (0.4%) | 122 (1.5%) |
| 18 to 34 Years | 119 (1.0%) | 117 (1.0%) |
| 35 to 64 Years | 579 (3.8%) | 281 (1.7%) |
| 65 to 74 Years | 672 (16.0%) | 229 (4.8%) |
| 75 Years and over | 743 (27.9%) | 786 (21.2%) |
Disability Class: Vision Difficulty
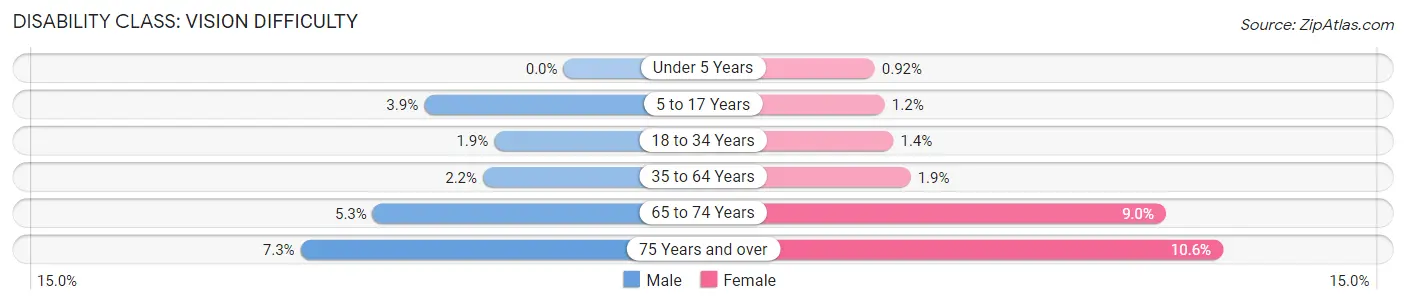
| Age Bracket | Male | Female |
| Under 5 Years | 0 (0.0%) | 28 (0.9%) |
| 5 to 17 Years | 336 (3.9%) | 100 (1.2%) |
| 18 to 34 Years | 238 (1.9%) | 168 (1.4%) |
| 35 to 64 Years | 344 (2.2%) | 327 (1.9%) |
| 65 to 74 Years | 223 (5.3%) | 430 (9.0%) |
| 75 Years and over | 195 (7.3%) | 394 (10.6%) |
Disability Class: Cognitive Difficulty
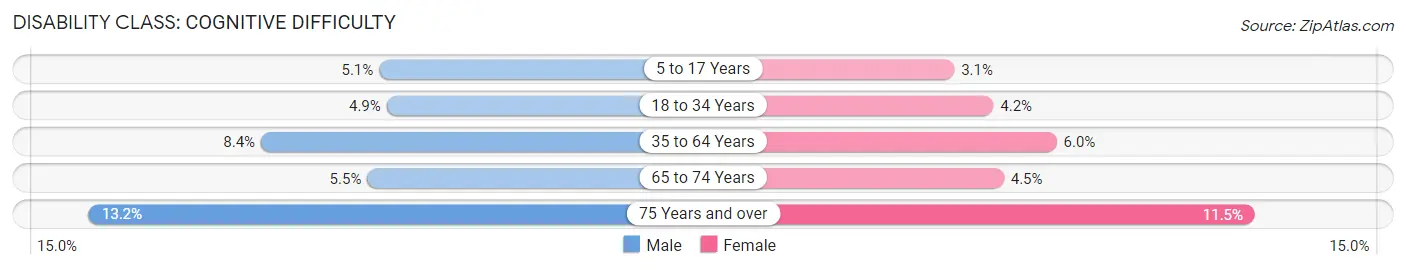
| Age Bracket | Male | Female |
| 5 to 17 Years | 444 (5.1%) | 262 (3.1%) |
| 18 to 34 Years | 607 (4.9%) | 491 (4.2%) |
| 35 to 64 Years | 1,290 (8.4%) | 1,017 (6.0%) |
| 65 to 74 Years | 229 (5.5%) | 215 (4.5%) |
| 75 Years and over | 352 (13.2%) | 427 (11.5%) |
Disability Class: Ambulatory Difficulty
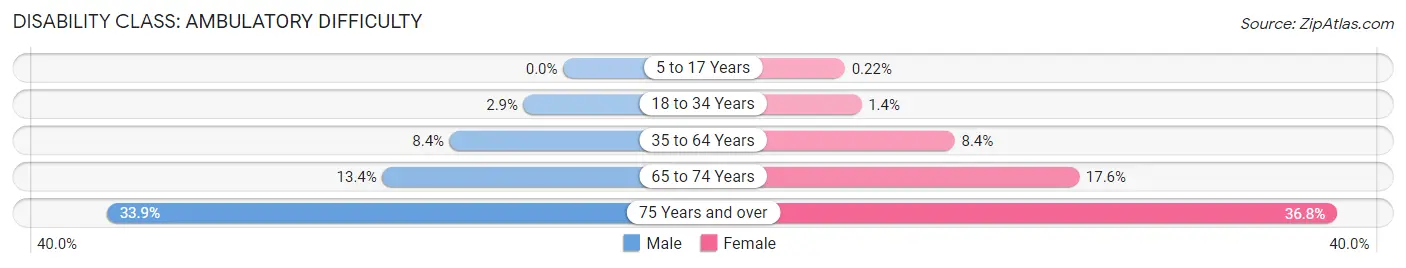
| Age Bracket | Male | Female |
| 5 to 17 Years | 0 (0.0%) | 18 (0.2%) |
| 18 to 34 Years | 362 (2.9%) | 167 (1.4%) |
| 35 to 64 Years | 1,291 (8.4%) | 1,425 (8.4%) |
| 65 to 74 Years | 563 (13.4%) | 839 (17.6%) |
| 75 Years and over | 903 (33.9%) | 1,365 (36.8%) |
Disability Class: Self-Care Difficulty
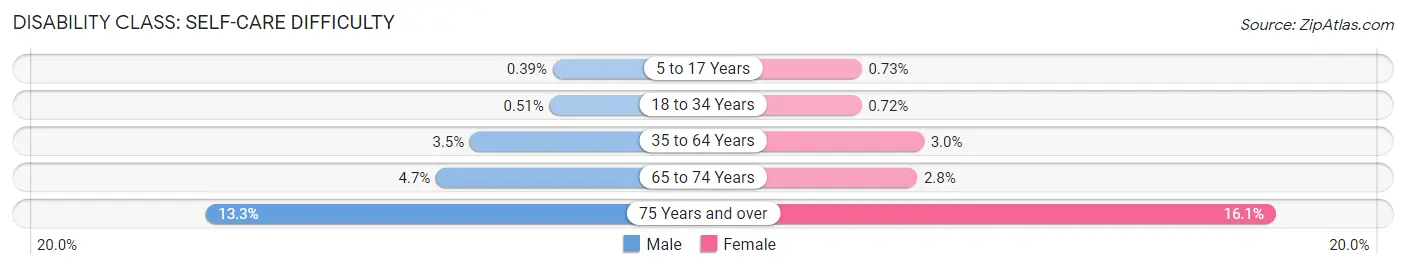
| Age Bracket | Male | Female |
| 5 to 17 Years | 34 (0.4%) | 61 (0.7%) |
| 18 to 34 Years | 63 (0.5%) | 84 (0.7%) |
| 35 to 64 Years | 530 (3.5%) | 518 (3.0%) |
| 65 to 74 Years | 198 (4.7%) | 133 (2.8%) |
| 75 Years and over | 354 (13.3%) | 598 (16.1%) |
Technology Access in San Angelo
Computing Device Access in San Angelo
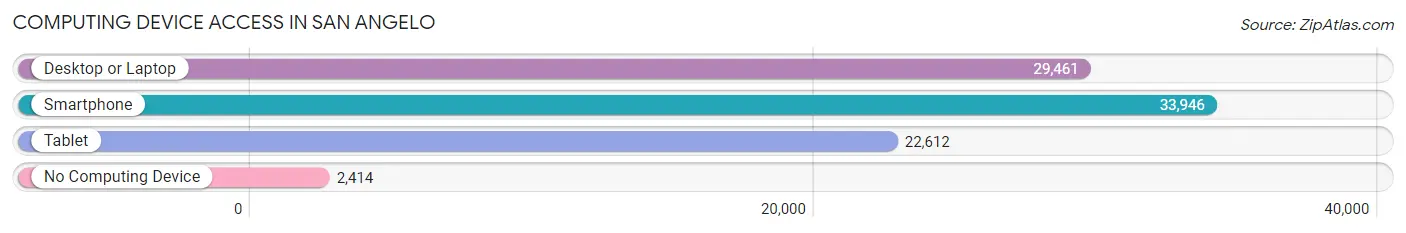
| Device Type | # Households | % Households |
| Desktop or Laptop | 29,461 | 76.6% |
| Smartphone | 33,946 | 88.3% |
| Tablet | 22,612 | 58.8% |
| No Computing Device | 2,414 | 6.3% |
| Total | 38,447 | 100.0% |
Internet Access in San Angelo
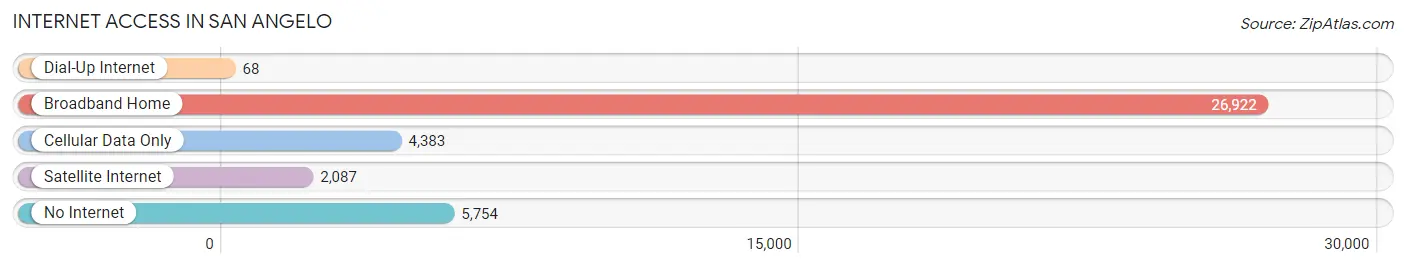
| Internet Type | # Households | % Households |
| Dial-Up Internet | 68 | 0.2% |
| Broadband Home | 26,922 | 70.0% |
| Cellular Data Only | 4,383 | 11.4% |
| Satellite Internet | 2,087 | 5.4% |
| No Internet | 5,754 | 15.0% |
| Total | 38,447 | 100.0% |
San Angelo Summary
San Angelo is a city located in the state of Texas, United States. It is the county seat of Tom Green County and is situated in the Concho Valley, a region of West Texas between the Permian Basin to the northwest, Chihuahuan Desert to the southwest, Osage Plains to the northeast, and Central Texas to the southeast. San Angelo is the principal city and center of the San Angelo metropolitan area, which has a population of 118,182. San Angelo is home to Angelo State University, historic Fort Concho, and Goodfellow Air Force Base.
History
San Angelo was founded in 1867 as a frontier military post of the United States Army. The fort was named after the angelic figure in the Bible, Saint Michael. The fort was established to protect settlers from the frequent raids of the Comanche and Apache tribes. The fort was abandoned in 1889, but the city of San Angelo was established in its place.
The city quickly grew and prospered, becoming a center of commerce and culture in the region. In the early 20th century, San Angelo was a major stop on the Texas and Pacific Railway. The city was also home to a large number of military personnel, as it was the site of Goodfellow Air Force Base.
Geography
San Angelo is located in the Concho Valley, a region of West Texas between the Permian Basin to the northwest, Chihuahuan Desert to the southwest, Osage Plains to the northeast, and Central Texas to the southeast. The city is situated along the North Concho River, a tributary of the Concho River. The city has a total area of 76.2 square miles, of which 75.9 square miles is land and 0.3 square miles is water.
Economy
San Angelo’s economy is largely based on the oil and gas industry, as well as agriculture and manufacturing. The city is home to several oil and gas companies, including Concho Resources, Apache Corporation, and Pioneer Natural Resources. San Angelo is also home to several manufacturing companies, including CMC Steel, which produces steel products, and San Angelo Machine Works, which produces industrial machinery.
Agriculture is also an important part of the local economy. The city is home to several large farms, including the San Angelo Livestock Auction, which is the largest livestock auction in the state of Texas.
Demographics
As of the 2010 census, San Angelo had a population of 93,200. The racial makeup of the city was 75.3% White, 5.2% African American, 0.9% Native American, 1.2% Asian, 0.1% Pacific Islander, 15.2% from other races, and 2.3% from two or more races. Hispanic or Latino of any race were 37.2% of the population.
The median income for a household in the city was $37,845, and the median income for a family was $45,845. The per capita income for the city was $20,845. About 17.2% of families and 21.3% of the population were below the poverty line, including 28.3% of those under age 18 and 11.2% of those age 65 or over.
Common Questions
What is Per Capita Income in San Angelo?
Per Capita income in San Angelo is $33,179.
What is the Median Family Income in San Angelo?
Median Family Income in San Angelo is $79,409.
What is the Median Household income in San Angelo?
Median Household Income in San Angelo is $65,040.
What is Income or Wage Gap in San Angelo?
Income or Wage Gap in San Angelo is 29.1%.
Women in San Angelo earn 70.9 cents for every dollar earned by a man.
What is Family Income Deficit in San Angelo?
Family Income Deficit in San Angelo is $12,168.
Families that are below poverty line in San Angelo earn $12,168 less on average than the poverty threshold level.
What is Inequality or Gini Index in San Angelo?
Inequality or Gini Index in San Angelo is 0.44.
What is the Total Population of San Angelo?
Total Population of San Angelo is 99,422.
What is the Total Male Population of San Angelo?
Total Male Population of San Angelo is 49,733.
What is the Total Female Population of San Angelo?
Total Female Population of San Angelo is 49,689.
What is the Ratio of Males per 100 Females in San Angelo?
There are 100.09 Males per 100 Females in San Angelo.
What is the Ratio of Females per 100 Males in San Angelo?
There are 99.91 Females per 100 Males in San Angelo.
What is the Median Population Age in San Angelo?
Median Population Age in San Angelo is 34.7 Years.
What is the Average Family Size in San Angelo
Average Family Size in San Angelo is 3.1 People.
What is the Average Household Size in San Angelo
Average Household Size in San Angelo is 2.4 People.
How Large is the Labor Force in San Angelo?
There are 51,648 People in the Labor Forcein in San Angelo.
What is the Percentage of People in the Labor Force in San Angelo?
65.4% of People are in the Labor Force in San Angelo.
What is the Unemployment Rate in San Angelo?
Unemployment Rate in San Angelo is 3.2%.