Flower Mound, TX Map & Demographics
Flower Mound Map
Flower Mound Overview
$65,910
PER CAPITA INCOME
$175,242
AVG FAMILY INCOME
$154,471
AVG HOUSEHOLD INCOME
45.2%
WAGE / INCOME GAP [ % ]
54.8¢/ $1
WAGE / INCOME GAP [ $ ]
0.40
INEQUALITY / GINI INDEX
76,630
TOTAL POPULATION
39,215
MALE POPULATION
37,415
FEMALE POPULATION
104.81
MALES / 100 FEMALES
95.41
FEMALES / 100 MALES
42.6
MEDIAN AGE
3.2
AVG FAMILY SIZE
2.8
AVG HOUSEHOLD SIZE
42,276
LABOR FORCE [ PEOPLE ]
71.0%
PERCENT IN LABOR FORCE
3.9%
UNEMPLOYMENT RATE
Income in Flower Mound
Income Overview in Flower Mound
Per Capita Income in Flower Mound is $65,910, while median incomes of families and households are $175,242 and $154,471 respectively.
| Characteristic | Number | Measure |
| Per Capita Income | 76,630 | $65,910 |
| Median Family Income | 22,034 | $175,242 |
| Mean Family Income | 22,034 | $204,040 |
| Median Household Income | 27,017 | $154,471 |
| Mean Household Income | 27,017 | $184,769 |
| Income Deficit | 22,034 | $0 |
| Wage / Income Gap (%) | 76,630 | 45.21% |
| Wage / Income Gap ($) | 76,630 | 54.79¢ per $1 |
| Gini / Inequality Index | 76,630 | 0.40 |
Earnings by Sex in Flower Mound
Average Earnings in Flower Mound are $71,835, $101,693 for men and $55,720 for women, a difference of 45.2%.
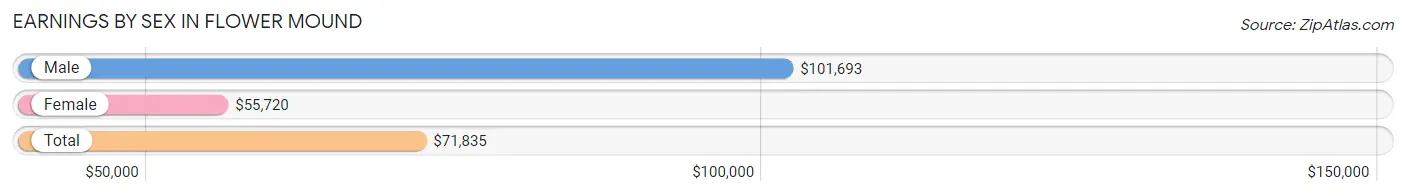
| Sex | Number | Average Earnings |
| Male | 24,272 (55.4%) | $101,693 |
| Female | 19,524 (44.6%) | $55,720 |
| Total | 43,796 (100.0%) | $71,835 |
Earnings by Sex by Income Bracket in Flower Mound
The most common earnings brackets in Flower Mound are $100,000+ for men (12,373 | 51.0%) and $100,000+ for women (5,074 | 26.0%).
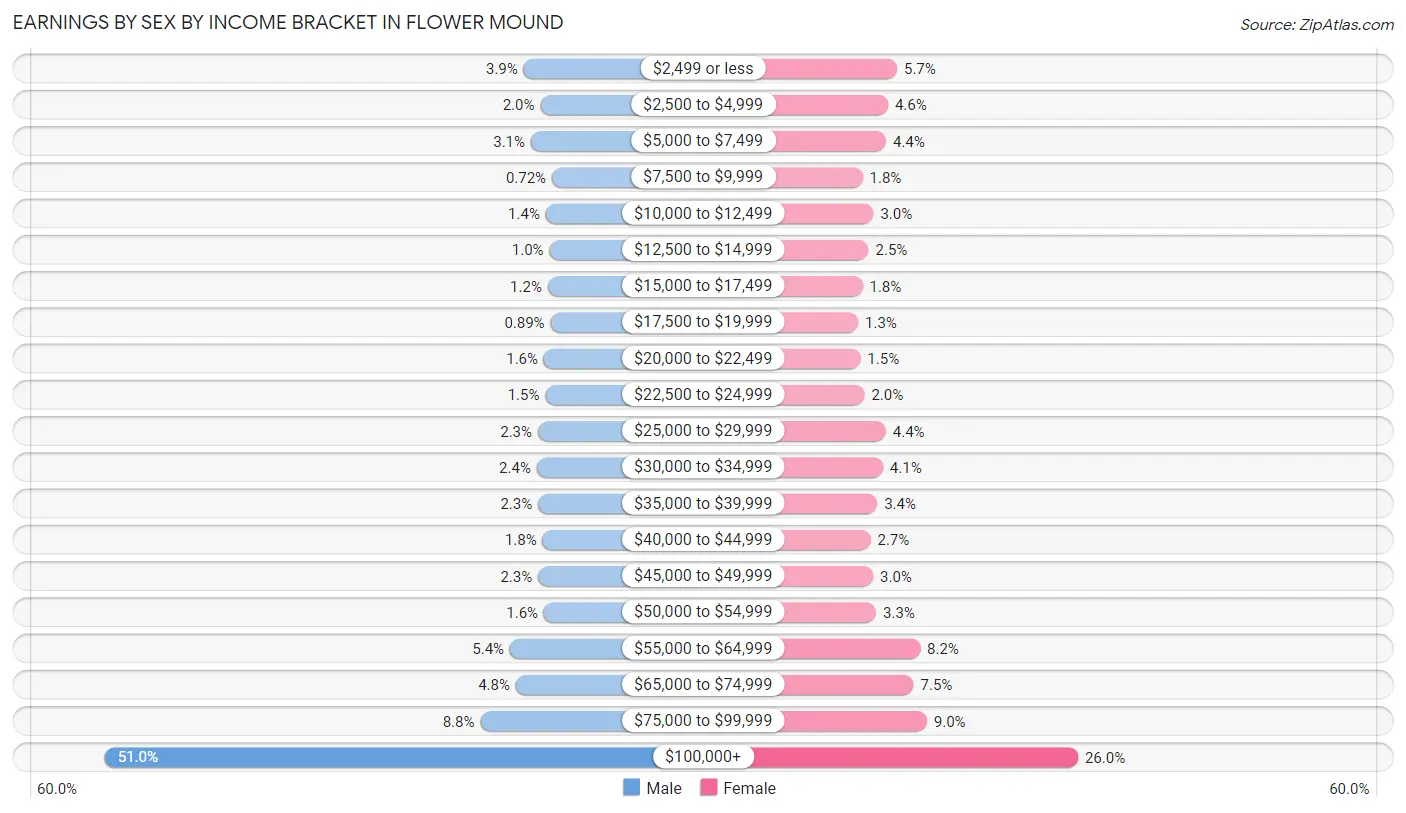
| Income | Male | Female |
| $2,499 or less | 949 (3.9%) | 1,104 (5.7%) |
| $2,500 to $4,999 | 493 (2.0%) | 904 (4.6%) |
| $5,000 to $7,499 | 749 (3.1%) | 861 (4.4%) |
| $7,500 to $9,999 | 174 (0.7%) | 347 (1.8%) |
| $10,000 to $12,499 | 345 (1.4%) | 586 (3.0%) |
| $12,500 to $14,999 | 243 (1.0%) | 478 (2.5%) |
| $15,000 to $17,499 | 290 (1.2%) | 345 (1.8%) |
| $17,500 to $19,999 | 216 (0.9%) | 248 (1.3%) |
| $20,000 to $22,499 | 396 (1.6%) | 299 (1.5%) |
| $22,500 to $24,999 | 356 (1.5%) | 389 (2.0%) |
| $25,000 to $29,999 | 558 (2.3%) | 857 (4.4%) |
| $30,000 to $34,999 | 590 (2.4%) | 792 (4.1%) |
| $35,000 to $39,999 | 554 (2.3%) | 667 (3.4%) |
| $40,000 to $44,999 | 432 (1.8%) | 522 (2.7%) |
| $45,000 to $49,999 | 554 (2.3%) | 577 (3.0%) |
| $50,000 to $54,999 | 392 (1.6%) | 642 (3.3%) |
| $55,000 to $64,999 | 1,320 (5.4%) | 1,609 (8.2%) |
| $65,000 to $74,999 | 1,159 (4.8%) | 1,466 (7.5%) |
| $75,000 to $99,999 | 2,129 (8.8%) | 1,757 (9.0%) |
| $100,000+ | 12,373 (51.0%) | 5,074 (26.0%) |
| Total | 24,272 (100.0%) | 19,524 (100.0%) |
Earnings by Sex by Educational Attainment in Flower Mound
Average earnings in Flower Mound are $116,339 for men and $61,344 for women, a difference of 47.3%. Men with an educational attainment of graduate degree enjoy the highest average annual earnings of $143,623, while those with less than high school education earn the least with $33,103. Women with an educational attainment of graduate degree earn the most with the average annual earnings of $104,022, while those with less than high school education have the smallest earnings of $27,614.
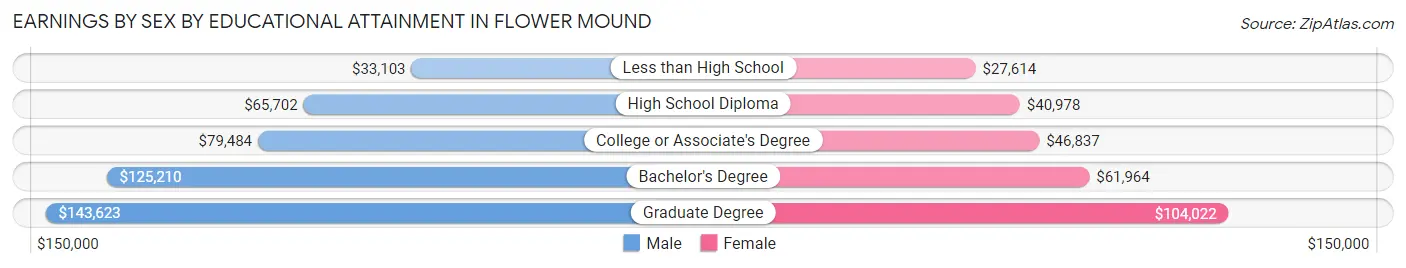
| Educational Attainment | Male Income | Female Income |
| Less than High School | $33,103 | $27,614 |
| High School Diploma | $65,702 | $40,978 |
| College or Associate's Degree | $79,484 | $46,837 |
| Bachelor's Degree | $125,210 | $61,964 |
| Graduate Degree | $143,623 | $104,022 |
| Total | $116,339 | $61,344 |
Family Income in Flower Mound
Family Income Brackets in Flower Mound
According to the Flower Mound family income data, there are 8,814 families falling into the $200,000+ income range, which is the most common income bracket and makes up 40.0% of all families. Conversely, the $10,000 to $14,999 income bracket is the least frequent group with only 66 families (0.3%) belonging to this category.
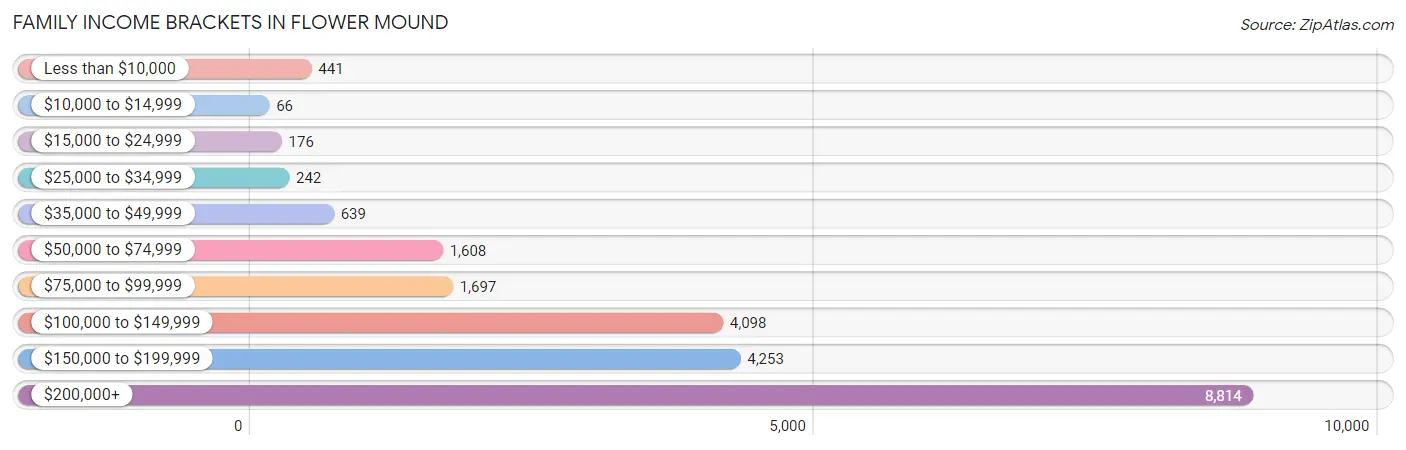
| Income Bracket | # Families | % Families |
| Less than $10,000 | 441 | 2.0% |
| $10,000 to $14,999 | 66 | 0.3% |
| $15,000 to $24,999 | 176 | 0.8% |
| $25,000 to $34,999 | 242 | 1.1% |
| $35,000 to $49,999 | 639 | 2.9% |
| $50,000 to $74,999 | 1,608 | 7.3% |
| $75,000 to $99,999 | 1,697 | 7.7% |
| $100,000 to $149,999 | 4,098 | 18.6% |
| $150,000 to $199,999 | 4,253 | 19.3% |
| $200,000+ | 8,814 | 40.0% |
Family Income by Famaliy Size in Flower Mound
6-person families (613 | 2.8%) account for the highest median family income in Flower Mound with $250,001 per family, while 2-person families (8,929 | 40.5%) have the highest median income of $71,718 per family member.
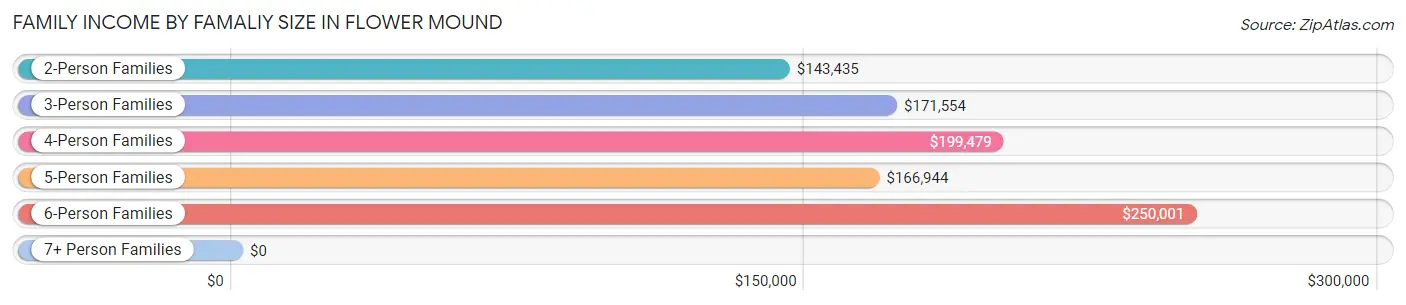
| Income Bracket | # Families | Median Income |
| 2-Person Families | 8,929 (40.5%) | $143,435 |
| 3-Person Families | 4,686 (21.3%) | $171,554 |
| 4-Person Families | 5,793 (26.3%) | $199,479 |
| 5-Person Families | 1,802 (8.2%) | $166,944 |
| 6-Person Families | 613 (2.8%) | $250,001 |
| 7+ Person Families | 211 (1.0%) | $0 |
| Total | 22,034 (100.0%) | $175,242 |
Family Income by Number of Earners in Flower Mound
The median family income in Flower Mound is $175,242, with families comprising 3+ earners (2,718) having the highest median family income of $216,352, while families with no earners (1,776) have the lowest median family income of $75,809, accounting for 12.3% and 8.1% of families, respectively.
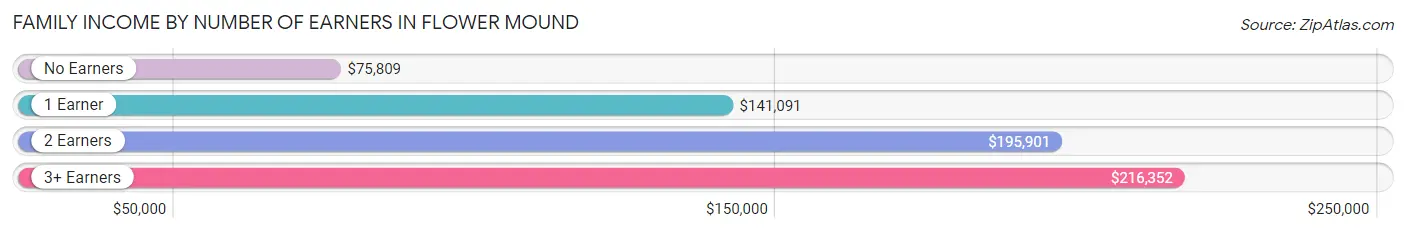
| Number of Earners | # Families | Median Income |
| No Earners | 1,776 (8.1%) | $75,809 |
| 1 Earner | 6,074 (27.6%) | $141,091 |
| 2 Earners | 11,466 (52.0%) | $195,901 |
| 3+ Earners | 2,718 (12.3%) | $216,352 |
| Total | 22,034 (100.0%) | $175,242 |
Household Income in Flower Mound
Household Income Brackets in Flower Mound
With 9,402 households falling in the category, the $200,000+ income range is the most frequent in Flower Mound, accounting for 34.8% of all households. In contrast, only 189 households (0.7%) fall into the $10,000 to $14,999 income bracket, making it the least populous group.
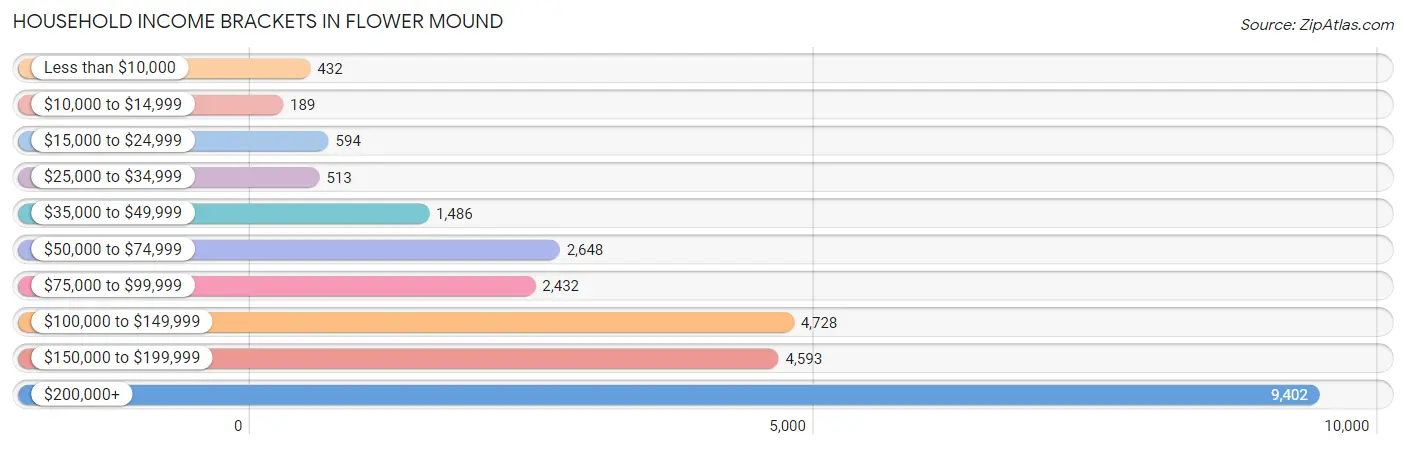
| Income Bracket | # Households | % Households |
| Less than $10,000 | 432 | 1.6% |
| $10,000 to $14,999 | 189 | 0.7% |
| $15,000 to $24,999 | 594 | 2.2% |
| $25,000 to $34,999 | 513 | 1.9% |
| $35,000 to $49,999 | 1,486 | 5.5% |
| $50,000 to $74,999 | 2,648 | 9.8% |
| $75,000 to $99,999 | 2,432 | 9.0% |
| $100,000 to $149,999 | 4,728 | 17.5% |
| $150,000 to $199,999 | 4,593 | 17.0% |
| $200,000+ | 9,402 | 34.8% |
Household Income by Householder Age in Flower Mound
The median household income in Flower Mound is $154,471, with the highest median household income of $177,263 found in the 45 to 64 years age bracket for the primary householder. A total of 14,293 households (52.9%) fall into this category. Meanwhile, the 15 to 24 years age bracket for the primary householder has the lowest median household income of $50,313, with 102 households (0.4%) in this group.
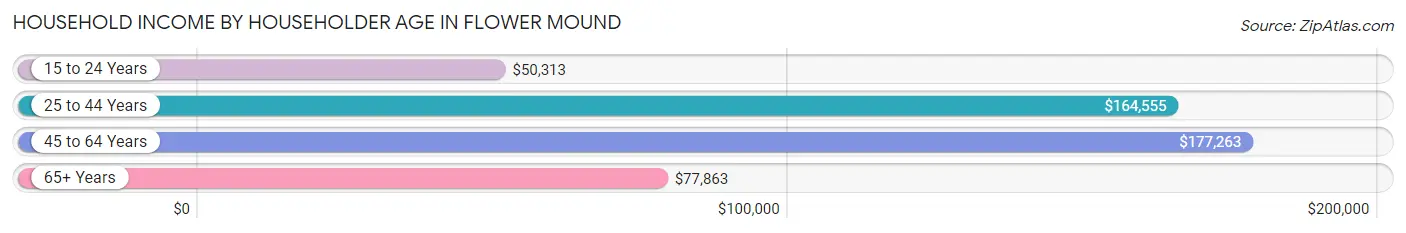
| Income Bracket | # Households | Median Income |
| 15 to 24 Years | 102 (0.4%) | $50,313 |
| 25 to 44 Years | 7,551 (28.0%) | $164,555 |
| 45 to 64 Years | 14,293 (52.9%) | $177,263 |
| 65+ Years | 5,071 (18.8%) | $77,863 |
| Total | 27,017 (100.0%) | $154,471 |
Poverty in Flower Mound
Income Below Poverty by Sex and Age in Flower Mound
With 3.3% poverty level for males and 5.2% for females among the residents of Flower Mound, under 5 year old males and 6 to 11 year old females are the most vulnerable to poverty, with 295 males (14.4%) and 427 females (12.0%) in their respective age groups living below the poverty level.
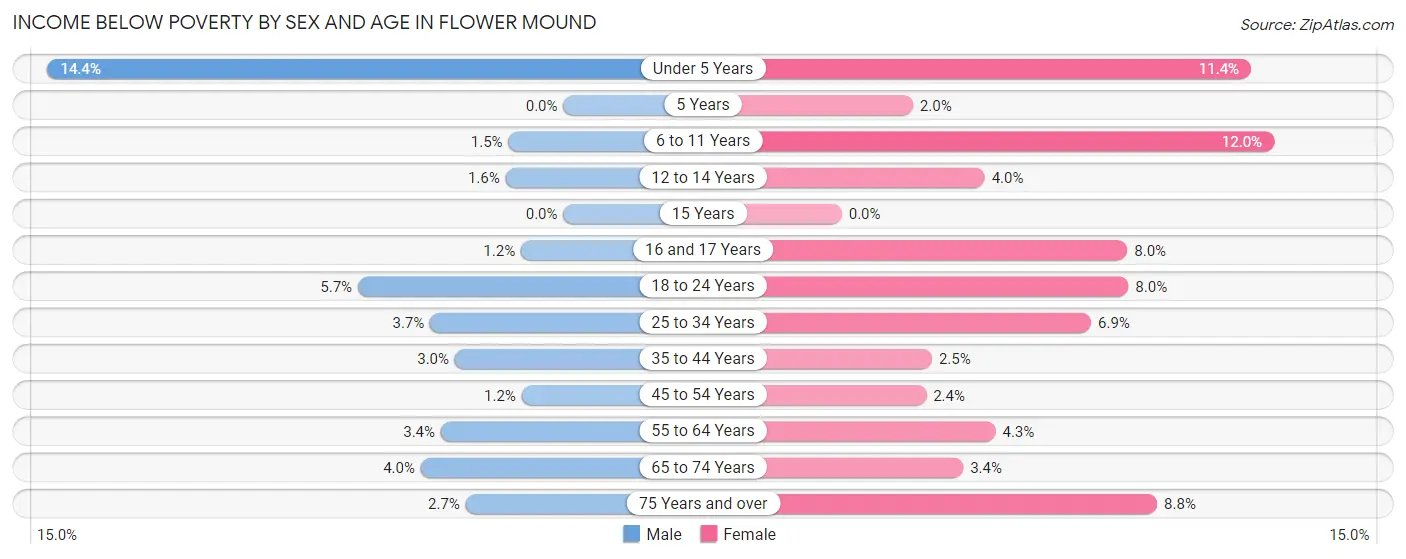
| Age Bracket | Male | Female |
| Under 5 Years | 295 (14.4%) | 182 (11.4%) |
| 5 Years | 0 (0.0%) | 10 (2.0%) |
| 6 to 11 Years | 60 (1.5%) | 427 (12.0%) |
| 12 to 14 Years | 33 (1.6%) | 66 (4.0%) |
| 15 Years | 0 (0.0%) | 0 (0.0%) |
| 16 and 17 Years | 17 (1.2%) | 126 (8.0%) |
| 18 to 24 Years | 182 (5.7%) | 145 (8.0%) |
| 25 to 34 Years | 105 (3.7%) | 212 (6.9%) |
| 35 to 44 Years | 154 (3.0%) | 139 (2.5%) |
| 45 to 54 Years | 79 (1.2%) | 163 (2.4%) |
| 55 to 64 Years | 229 (3.4%) | 236 (4.3%) |
| 65 to 74 Years | 115 (4.0%) | 109 (3.4%) |
| 75 Years and over | 30 (2.7%) | 143 (8.8%) |
| Total | 1,299 (3.3%) | 1,958 (5.2%) |
Income Above Poverty by Sex and Age in Flower Mound
According to the poverty statistics in Flower Mound, males aged 5 years and females aged 15 years are the age groups that are most secure financially, with 100.0% of males and 100.0% of females in these age groups living above the poverty line.
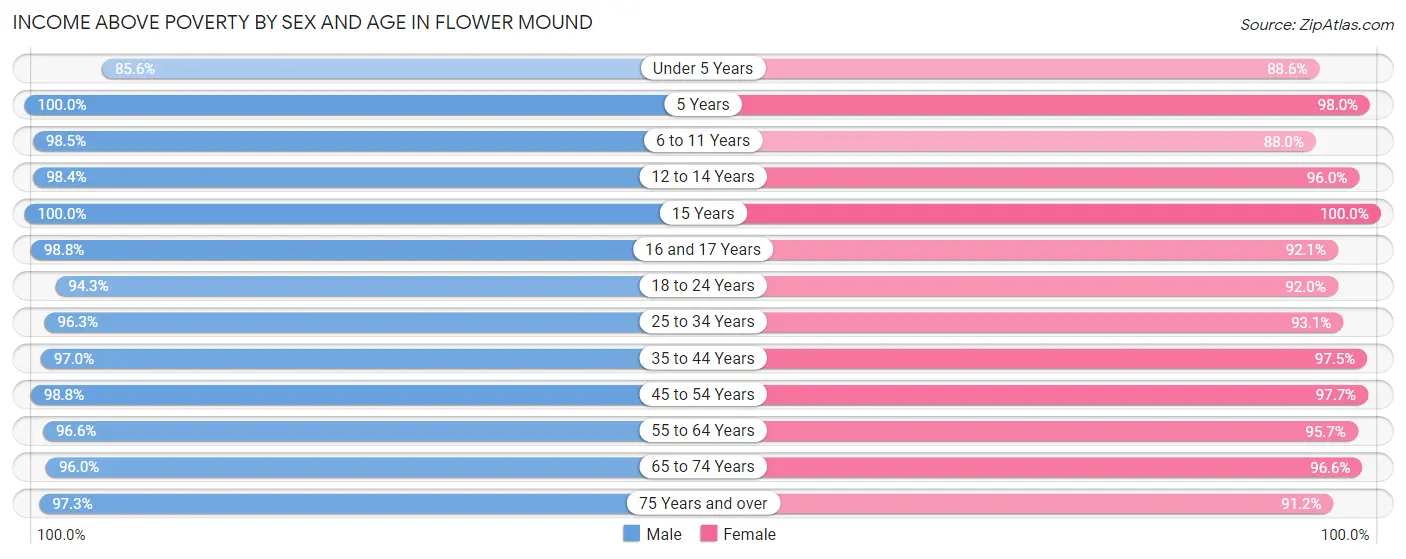
| Age Bracket | Male | Female |
| Under 5 Years | 1,759 (85.6%) | 1,416 (88.6%) |
| 5 Years | 350 (100.0%) | 496 (98.0%) |
| 6 to 11 Years | 3,861 (98.5%) | 3,122 (88.0%) |
| 12 to 14 Years | 2,018 (98.4%) | 1,592 (96.0%) |
| 15 Years | 621 (100.0%) | 712 (100.0%) |
| 16 and 17 Years | 1,420 (98.8%) | 1,458 (92.0%) |
| 18 to 24 Years | 3,002 (94.3%) | 1,673 (92.0%) |
| 25 to 34 Years | 2,726 (96.3%) | 2,842 (93.1%) |
| 35 to 44 Years | 4,944 (97.0%) | 5,405 (97.5%) |
| 45 to 54 Years | 6,711 (98.8%) | 6,787 (97.7%) |
| 55 to 64 Years | 6,491 (96.6%) | 5,273 (95.7%) |
| 65 to 74 Years | 2,783 (96.0%) | 3,115 (96.6%) |
| 75 Years and over | 1,072 (97.3%) | 1,486 (91.2%) |
| Total | 37,758 (96.7%) | 35,377 (94.8%) |
Income Below Poverty Among Married-Couple Families in Flower Mound
The poverty statistics for married-couple families in Flower Mound show that 2.4% or 477 of the total 19,622 families live below the poverty line. Families with 3 or 4 children have the highest poverty rate of 8.9%, comprising of 151 families. On the other hand, families with 5 or more children have the lowest poverty rate of 0.0%, which includes 0 families.
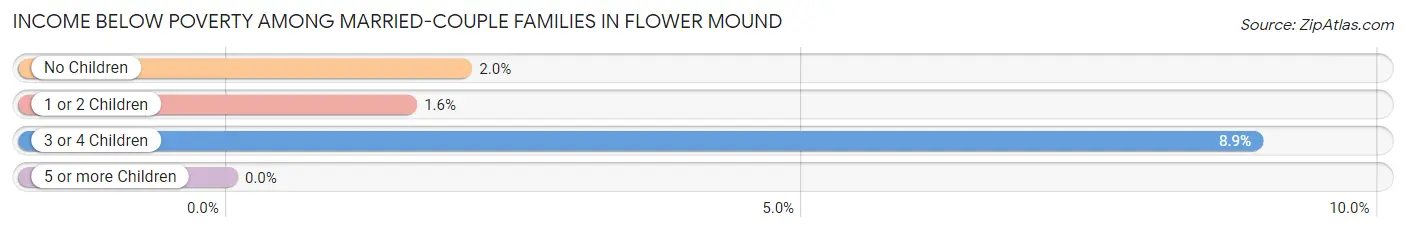
| Children | Above Poverty | Below Poverty |
| No Children | 9,779 (98.0%) | 204 (2.0%) |
| 1 or 2 Children | 7,693 (98.4%) | 122 (1.6%) |
| 3 or 4 Children | 1,541 (91.1%) | 151 (8.9%) |
| 5 or more Children | 132 (100.0%) | 0 (0.0%) |
| Total | 19,145 (97.6%) | 477 (2.4%) |
Income Below Poverty Among Single-Parent Households in Flower Mound
According to the poverty data in Flower Mound, 6.9% or 60 single-father households and 9.8% or 151 single-mother households are living below the poverty line. Among single-father households, those with 1 or 2 children have the highest poverty rate, with 60 households (11.1%) experiencing poverty. Likewise, among single-mother households, those with 5 or more children have the highest poverty rate, with 13 households (100.0%) falling below the poverty line.
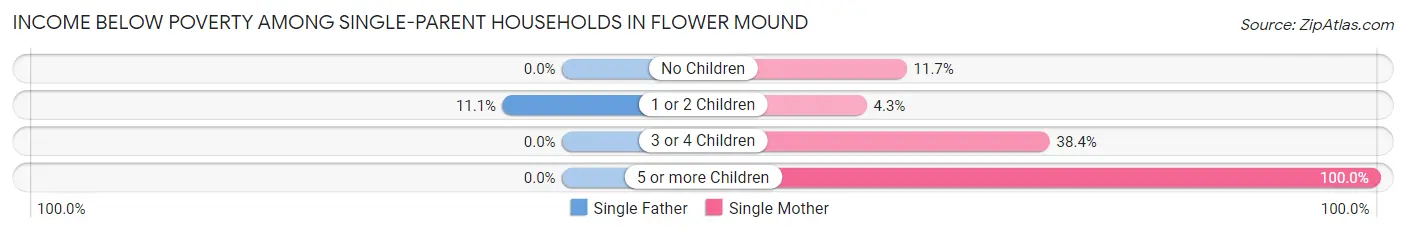
| Children | Single Father | Single Mother |
| No Children | 0 (0.0%) | 68 (11.7%) |
| 1 or 2 Children | 60 (11.1%) | 37 (4.3%) |
| 3 or 4 Children | 0 (0.0%) | 33 (38.4%) |
| 5 or more Children | 0 (0.0%) | 13 (100.0%) |
| Total | 60 (6.9%) | 151 (9.8%) |
Income Below Poverty Among Married-Couple vs Single-Parent Households in Flower Mound
The poverty data for Flower Mound shows that 477 of the married-couple family households (2.4%) and 211 of the single-parent households (8.7%) are living below the poverty level. Within the married-couple family households, those with 3 or 4 children have the highest poverty rate, with 151 households (8.9%) falling below the poverty line. Among the single-parent households, those with 5 or more children have the highest poverty rate, with 13 household (100.0%) living below poverty.
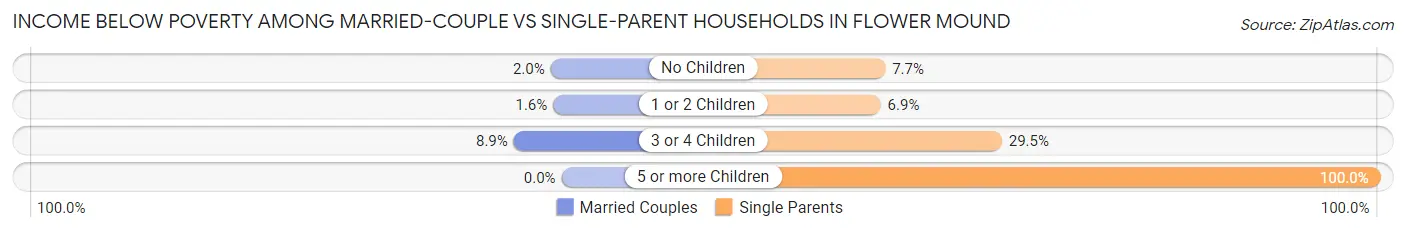
| Children | Married-Couple Families | Single-Parent Households |
| No Children | 204 (2.0%) | 68 (7.7%) |
| 1 or 2 Children | 122 (1.6%) | 97 (6.9%) |
| 3 or 4 Children | 151 (8.9%) | 33 (29.5%) |
| 5 or more Children | 0 (0.0%) | 13 (100.0%) |
| Total | 477 (2.4%) | 211 (8.7%) |
Race in Flower Mound
The most populous races in Flower Mound are White / Caucasian (56,049 | 73.1%), Asian (10,375 | 13.5%), and Hispanic or Latino (8,952 | 11.7%).
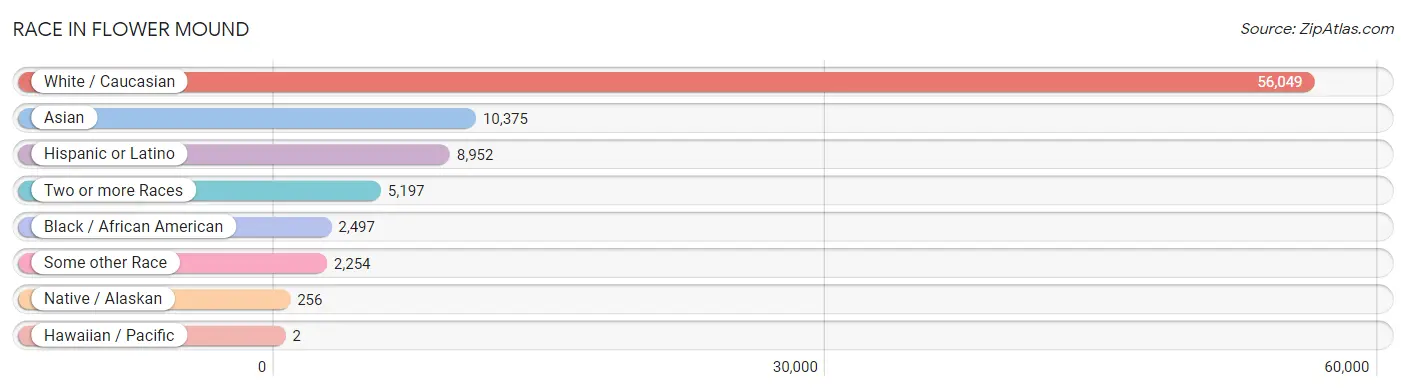
| Race | # Population | % Population |
| Asian | 10,375 | 13.5% |
| Black / African American | 2,497 | 3.3% |
| Hawaiian / Pacific | 2 | 0.0% |
| Hispanic or Latino | 8,952 | 11.7% |
| Native / Alaskan | 256 | 0.3% |
| White / Caucasian | 56,049 | 73.1% |
| Two or more Races | 5,197 | 6.8% |
| Some other Race | 2,254 | 2.9% |
| Total | 76,630 | 100.0% |
Ancestry in Flower Mound
The most populous ancestries reported in Flower Mound are German (11,471 | 15.0%), English (11,076 | 14.4%), Irish (8,343 | 10.9%), Mexican (5,808 | 7.6%), and Thai (5,704 | 7.4%), together accounting for 55.3% of all Flower Mound residents.
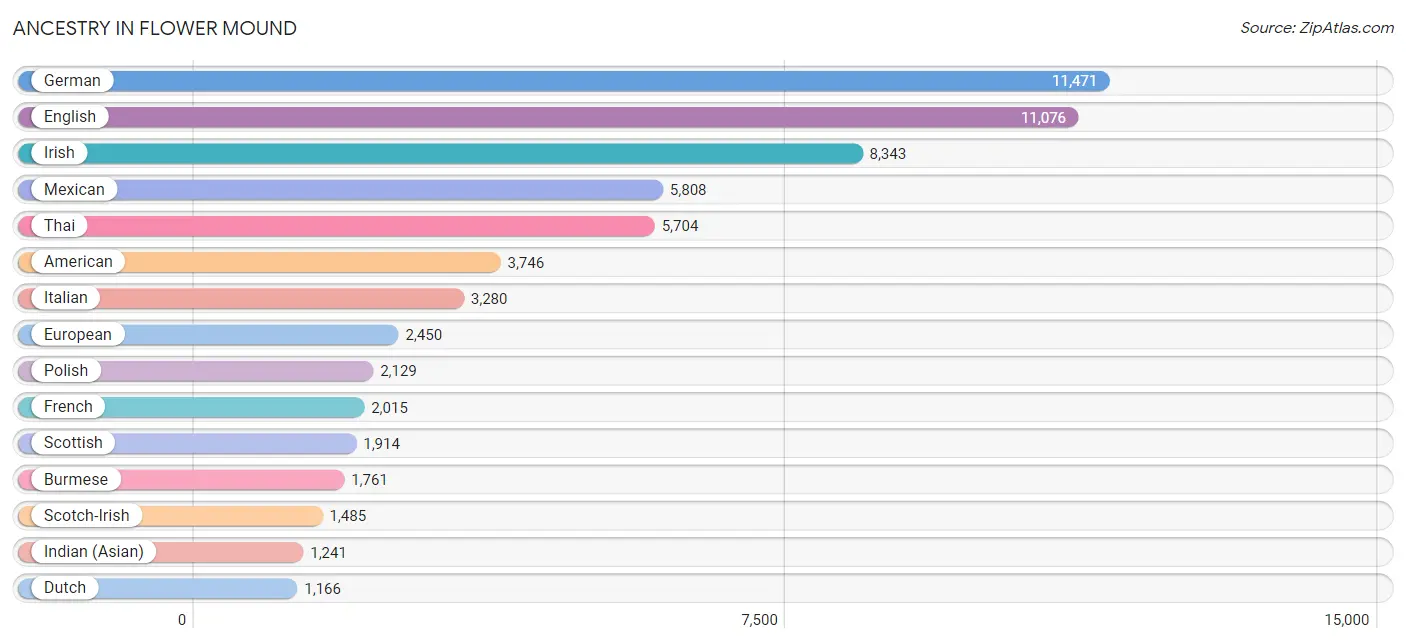
| Ancestry | # Population | % Population |
| African | 143 | 0.2% |
| Albanian | 58 | 0.1% |
| American | 3,746 | 4.9% |
| Apache | 15 | 0.0% |
| Arab | 242 | 0.3% |
| Argentinean | 178 | 0.2% |
| Armenian | 18 | 0.0% |
| Australian | 72 | 0.1% |
| Austrian | 84 | 0.1% |
| Basque | 13 | 0.0% |
| Belgian | 64 | 0.1% |
| Bhutanese | 346 | 0.4% |
| Blackfeet | 24 | 0.0% |
| Bolivian | 36 | 0.1% |
| Brazilian | 217 | 0.3% |
| British | 662 | 0.9% |
| Burmese | 1,761 | 2.3% |
| Canadian | 148 | 0.2% |
| Cape Verdean | 6 | 0.0% |
| Celtic | 18 | 0.0% |
| Central American | 389 | 0.5% |
| Central American Indian | 10 | 0.0% |
| Cherokee | 334 | 0.4% |
| Cheyenne | 14 | 0.0% |
| Chickasaw | 48 | 0.1% |
| Choctaw | 11 | 0.0% |
| Colombian | 251 | 0.3% |
| Comanche | 19 | 0.0% |
| Creek | 9 | 0.0% |
| Croatian | 45 | 0.1% |
| Cuban | 595 | 0.8% |
| Czech | 393 | 0.5% |
| Czechoslovakian | 77 | 0.1% |
| Danish | 348 | 0.4% |
| Delaware | 16 | 0.0% |
| Dominican | 108 | 0.1% |
| Dutch | 1,166 | 1.5% |
| Eastern European | 233 | 0.3% |
| Ecuadorian | 71 | 0.1% |
| Egyptian | 24 | 0.0% |
| English | 11,076 | 14.4% |
| Ethiopian | 13 | 0.0% |
| European | 2,450 | 3.2% |
| Filipino | 51 | 0.1% |
| Finnish | 88 | 0.1% |
| French | 2,015 | 2.6% |
| French Canadian | 490 | 0.6% |
| German | 11,471 | 15.0% |
| Greek | 292 | 0.4% |
| Guatemalan | 34 | 0.0% |
| Haitian | 7 | 0.0% |
| Honduran | 70 | 0.1% |
| Hungarian | 268 | 0.4% |
| Indian (Asian) | 1,241 | 1.6% |
| Indonesian | 73 | 0.1% |
| Iranian | 477 | 0.6% |
| Iraqi | 70 | 0.1% |
| Irish | 8,343 | 10.9% |
| Israeli | 11 | 0.0% |
| Italian | 3,280 | 4.3% |
| Jamaican | 73 | 0.1% |
| Japanese | 187 | 0.2% |
| Korean | 435 | 0.6% |
| Laotian | 86 | 0.1% |
| Latvian | 55 | 0.1% |
| Lebanese | 64 | 0.1% |
| Lithuanian | 183 | 0.2% |
| Malaysian | 31 | 0.0% |
| Mexican | 5,808 | 7.6% |
| Mexican American Indian | 99 | 0.1% |
| Moroccan | 10 | 0.0% |
| Native Hawaiian | 16 | 0.0% |
| New Zealander | 38 | 0.1% |
| Nigerian | 48 | 0.1% |
| Northern European | 171 | 0.2% |
| Norwegian | 1,100 | 1.4% |
| Pakistani | 82 | 0.1% |
| Palestinian | 41 | 0.1% |
| Panamanian | 54 | 0.1% |
| Pennsylvania German | 28 | 0.0% |
| Peruvian | 208 | 0.3% |
| Pima | 14 | 0.0% |
| Polish | 2,129 | 2.8% |
| Portuguese | 198 | 0.3% |
| Puerto Rican | 503 | 0.7% |
| Romanian | 20 | 0.0% |
| Russian | 745 | 1.0% |
| Salvadoran | 231 | 0.3% |
| Scandinavian | 207 | 0.3% |
| Scotch-Irish | 1,485 | 1.9% |
| Scottish | 1,914 | 2.5% |
| Seminole | 8 | 0.0% |
| Serbian | 28 | 0.0% |
| Sioux | 4 | 0.0% |
| Slovak | 82 | 0.1% |
| Slovene | 67 | 0.1% |
| Somali | 13 | 0.0% |
| South African | 20 | 0.0% |
| South American | 875 | 1.1% |
| South American Indian | 14 | 0.0% |
| Spaniard | 98 | 0.1% |
| Spanish | 277 | 0.4% |
| Spanish American | 13 | 0.0% |
| Sri Lankan | 495 | 0.6% |
| Subsaharan African | 357 | 0.5% |
| Sudanese | 59 | 0.1% |
| Swedish | 952 | 1.2% |
| Swiss | 204 | 0.3% |
| Syrian | 22 | 0.0% |
| Thai | 5,704 | 7.4% |
| Tongan | 16 | 0.0% |
| Turkish | 26 | 0.0% |
| Ugandan | 22 | 0.0% |
| Ukrainian | 149 | 0.2% |
| Uruguayan | 41 | 0.1% |
| Venezuelan | 90 | 0.1% |
| Vietnamese | 59 | 0.1% |
| Welsh | 412 | 0.5% |
| Yugoslavian | 27 | 0.0% | View All 119 Rows |
Immigrants in Flower Mound
The most numerous immigrant groups reported in Flower Mound came from Asia (7,124 | 9.3%), South Central Asia (4,142 | 5.4%), India (3,353 | 4.4%), Latin America (2,660 | 3.5%), and Eastern Asia (2,084 | 2.7%), together accounting for 25.3% of all Flower Mound residents.
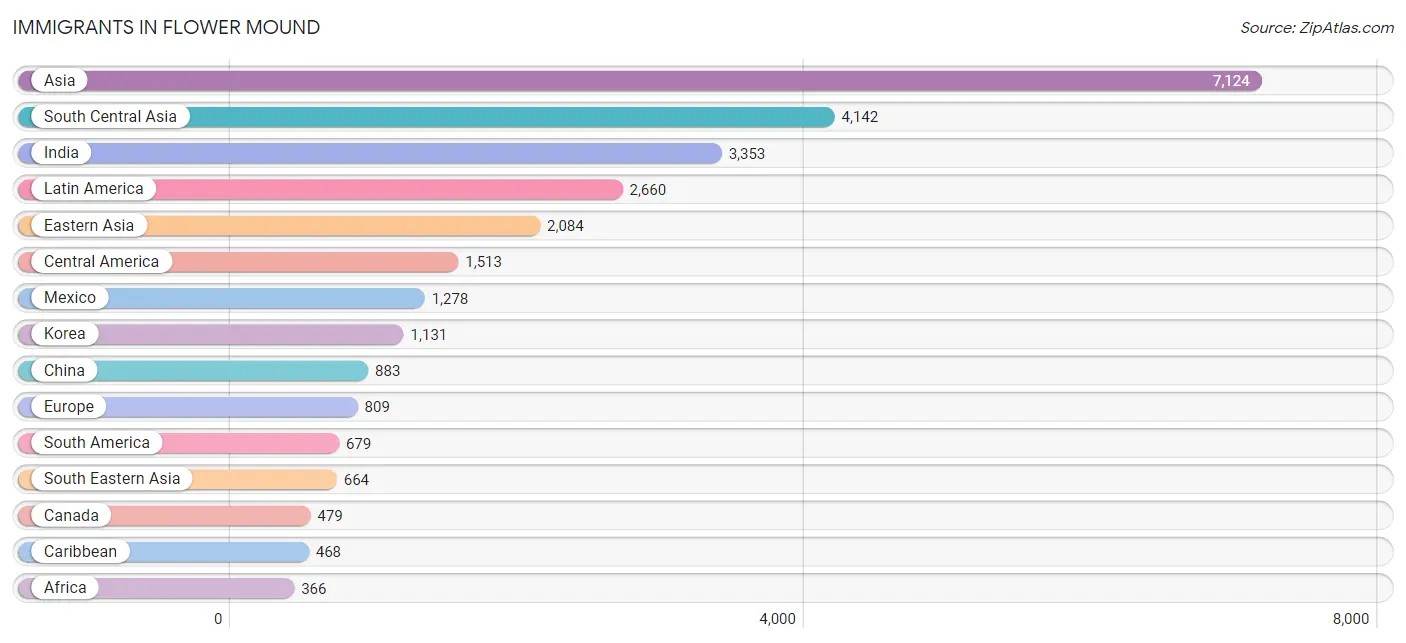
| Immigration Origin | # Population | % Population |
| Africa | 366 | 0.5% |
| Argentina | 168 | 0.2% |
| Asia | 7,124 | 9.3% |
| Australia | 38 | 0.1% |
| Bangladesh | 55 | 0.1% |
| Bosnia and Herzegovina | 17 | 0.0% |
| Brazil | 152 | 0.2% |
| Cambodia | 80 | 0.1% |
| Canada | 479 | 0.6% |
| Caribbean | 468 | 0.6% |
| Central America | 1,513 | 2.0% |
| China | 883 | 1.1% |
| Colombia | 109 | 0.1% |
| Cuba | 329 | 0.4% |
| Denmark | 70 | 0.1% |
| Dominican Republic | 96 | 0.1% |
| Eastern Africa | 156 | 0.2% |
| Eastern Asia | 2,084 | 2.7% |
| Eastern Europe | 262 | 0.3% |
| Ecuador | 48 | 0.1% |
| Egypt | 12 | 0.0% |
| El Salvador | 156 | 0.2% |
| England | 64 | 0.1% |
| Ethiopia | 7 | 0.0% |
| Europe | 809 | 1.1% |
| France | 16 | 0.0% |
| Germany | 116 | 0.2% |
| Greece | 30 | 0.0% |
| Guatemala | 11 | 0.0% |
| Haiti | 7 | 0.0% |
| Honduras | 41 | 0.1% |
| Hong Kong | 3 | 0.0% |
| India | 3,353 | 4.4% |
| Indonesia | 42 | 0.1% |
| Iran | 356 | 0.5% |
| Iraq | 46 | 0.1% |
| Israel | 10 | 0.0% |
| Italy | 62 | 0.1% |
| Jamaica | 36 | 0.1% |
| Japan | 70 | 0.1% |
| Jordan | 16 | 0.0% |
| Kenya | 83 | 0.1% |
| Korea | 1,131 | 1.5% |
| Latin America | 2,660 | 3.5% |
| Lebanon | 43 | 0.1% |
| Lithuania | 13 | 0.0% |
| Malaysia | 32 | 0.0% |
| Mexico | 1,278 | 1.7% |
| Morocco | 10 | 0.0% |
| Nepal | 192 | 0.3% |
| Netherlands | 19 | 0.0% |
| Nigeria | 61 | 0.1% |
| Northern Africa | 72 | 0.1% |
| Northern Europe | 297 | 0.4% |
| Norway | 12 | 0.0% |
| Oceania | 38 | 0.1% |
| Pakistan | 39 | 0.1% |
| Panama | 27 | 0.0% |
| Peru | 100 | 0.1% |
| Philippines | 163 | 0.2% |
| Poland | 21 | 0.0% |
| Romania | 12 | 0.0% |
| Russia | 119 | 0.2% |
| Singapore | 7 | 0.0% |
| Somalia | 6 | 0.0% |
| South Africa | 55 | 0.1% |
| South America | 679 | 0.9% |
| South Central Asia | 4,142 | 5.4% |
| South Eastern Asia | 664 | 0.9% |
| Southern Europe | 92 | 0.1% |
| Sri Lanka | 147 | 0.2% |
| Sudan | 39 | 0.1% |
| Sweden | 17 | 0.0% |
| Switzerland | 7 | 0.0% |
| Syria | 22 | 0.0% |
| Taiwan | 88 | 0.1% |
| Thailand | 49 | 0.1% |
| Turkey | 21 | 0.0% |
| Ukraine | 65 | 0.1% |
| Uruguay | 17 | 0.0% |
| Venezuela | 77 | 0.1% |
| Vietnam | 258 | 0.3% |
| Western Africa | 61 | 0.1% |
| Western Asia | 234 | 0.3% |
| Western Europe | 158 | 0.2% | View All 85 Rows |
Sex and Age in Flower Mound
Sex and Age in Flower Mound
The most populous age groups in Flower Mound are 55 to 59 Years (3,875 | 9.9%) for men and 50 to 54 Years (3,654 | 9.8%) for women.
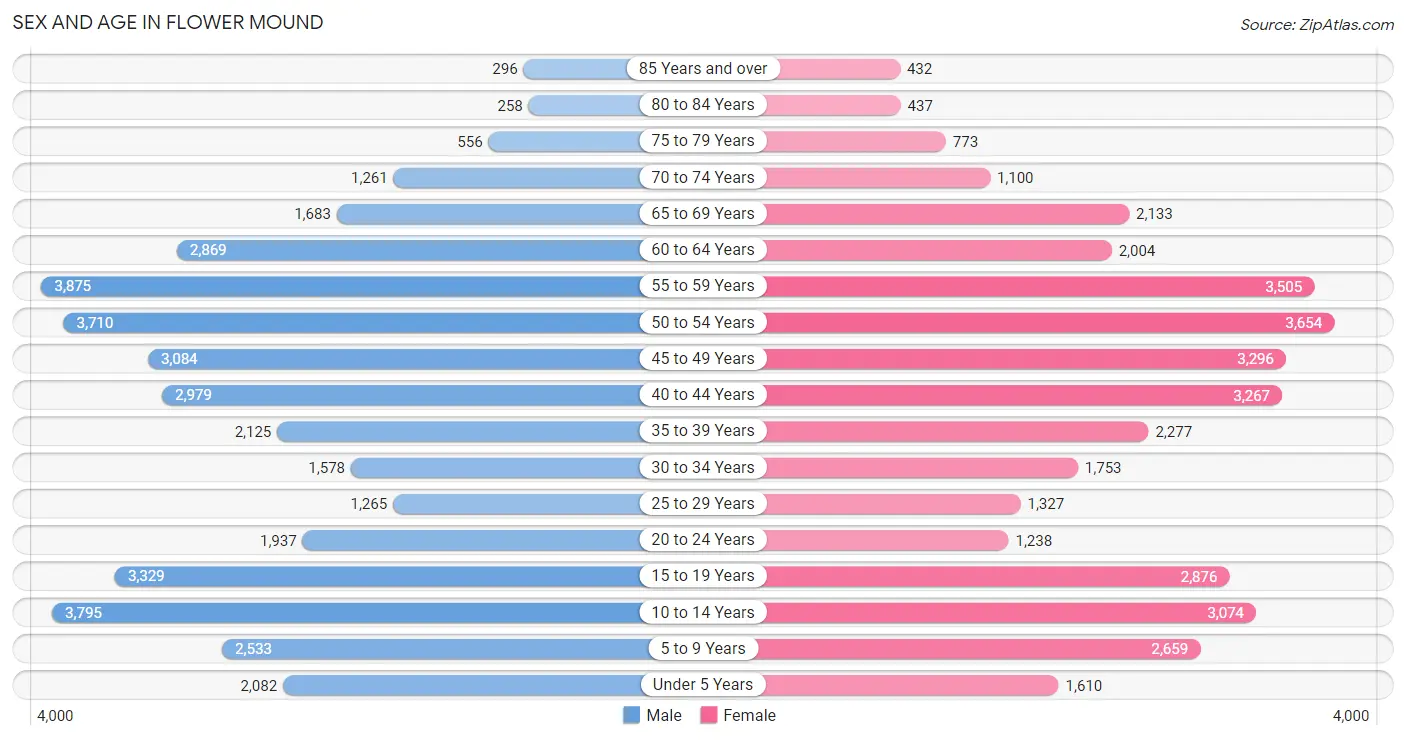
| Age Bracket | Male | Female |
| Under 5 Years | 2,082 (5.3%) | 1,610 (4.3%) |
| 5 to 9 Years | 2,533 (6.5%) | 2,659 (7.1%) |
| 10 to 14 Years | 3,795 (9.7%) | 3,074 (8.2%) |
| 15 to 19 Years | 3,329 (8.5%) | 2,876 (7.7%) |
| 20 to 24 Years | 1,937 (4.9%) | 1,238 (3.3%) |
| 25 to 29 Years | 1,265 (3.2%) | 1,327 (3.5%) |
| 30 to 34 Years | 1,578 (4.0%) | 1,753 (4.7%) |
| 35 to 39 Years | 2,125 (5.4%) | 2,277 (6.1%) |
| 40 to 44 Years | 2,979 (7.6%) | 3,267 (8.7%) |
| 45 to 49 Years | 3,084 (7.9%) | 3,296 (8.8%) |
| 50 to 54 Years | 3,710 (9.5%) | 3,654 (9.8%) |
| 55 to 59 Years | 3,875 (9.9%) | 3,505 (9.4%) |
| 60 to 64 Years | 2,869 (7.3%) | 2,004 (5.4%) |
| 65 to 69 Years | 1,683 (4.3%) | 2,133 (5.7%) |
| 70 to 74 Years | 1,261 (3.2%) | 1,100 (2.9%) |
| 75 to 79 Years | 556 (1.4%) | 773 (2.1%) |
| 80 to 84 Years | 258 (0.7%) | 437 (1.2%) |
| 85 Years and over | 296 (0.7%) | 432 (1.1%) |
| Total | 39,215 (100.0%) | 37,415 (100.0%) |
Families and Households in Flower Mound
Median Family Size in Flower Mound
The median family size in Flower Mound is 3.16 persons per family, with married-couple families (19,622 | 89.0%) accounting for the largest median family size of 3.21 persons per family. On the other hand, single male/father families (866 | 3.9%) represent the smallest median family size with 2.42 persons per family.
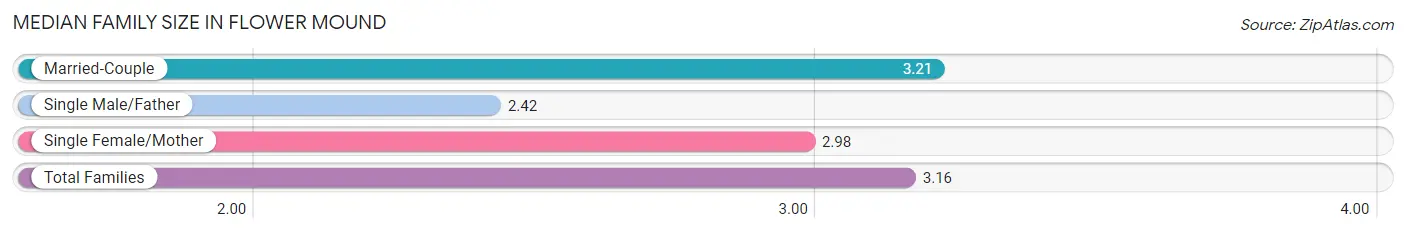
| Family Type | # Families | Family Size |
| Married-Couple | 19,622 (89.0%) | 3.21 |
| Single Male/Father | 866 (3.9%) | 2.42 |
| Single Female/Mother | 1,546 (7.0%) | 2.98 |
| Total Families | 22,034 (100.0%) | 3.16 |
Median Household Size in Flower Mound
The median household size in Flower Mound is 2.83 persons per household, with married-couple households (19,622 | 72.6%) accounting for the largest median household size of 3.23 persons per household. non-family households (4,983 | 18.4%) represent the smallest median household size with 1.18 persons per household.
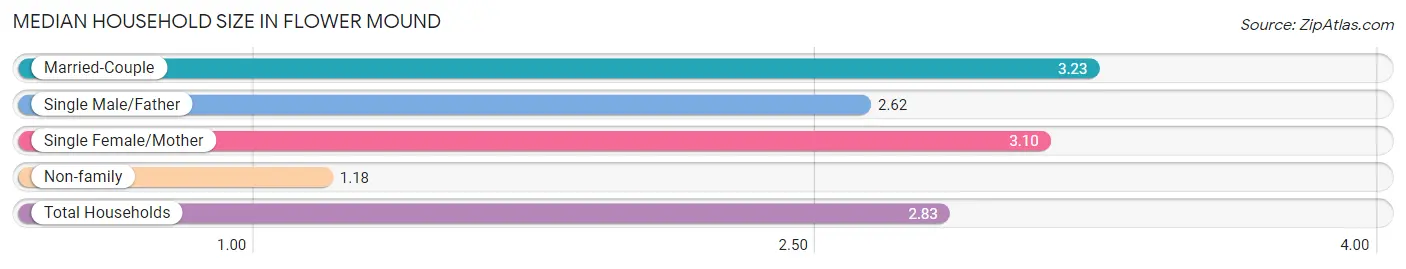
| Household Type | # Households | Household Size |
| Married-Couple | 19,622 (72.6%) | 3.23 |
| Single Male/Father | 866 (3.2%) | 2.62 |
| Single Female/Mother | 1,546 (5.7%) | 3.10 |
| Non-family | 4,983 (18.4%) | 1.18 |
| Total Households | 27,017 (100.0%) | 2.83 |
Household Size by Marriage Status in Flower Mound
Out of a total of 27,017 households in Flower Mound, 22,034 (81.6%) are family households, while 4,983 (18.4%) are nonfamily households. The most numerous type of family households are 2-person households, comprising 8,702, and the most common type of nonfamily households are 1-person households, comprising 4,307.
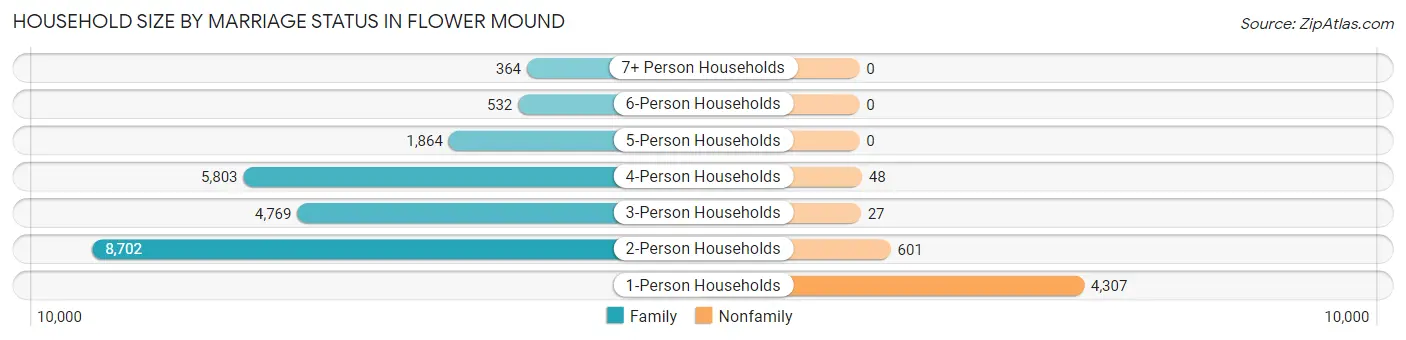
| Household Size | Family Households | Nonfamily Households |
| 1-Person Households | - | 4,307 (15.9%) |
| 2-Person Households | 8,702 (32.2%) | 601 (2.2%) |
| 3-Person Households | 4,769 (17.6%) | 27 (0.1%) |
| 4-Person Households | 5,803 (21.5%) | 48 (0.2%) |
| 5-Person Households | 1,864 (6.9%) | 0 (0.0%) |
| 6-Person Households | 532 (2.0%) | 0 (0.0%) |
| 7+ Person Households | 364 (1.3%) | 0 (0.0%) |
| Total | 22,034 (81.6%) | 4,983 (18.4%) |
Female Fertility in Flower Mound
Fertility by Age in Flower Mound
Average fertility rate in Flower Mound is 44.0 births per 1,000 women. Women in the age bracket of 20 to 34 years have the highest fertility rate with 95.0 births per 1,000 women. Women in the age bracket of 20 to 34 years acount for 55.9% of all women with births.
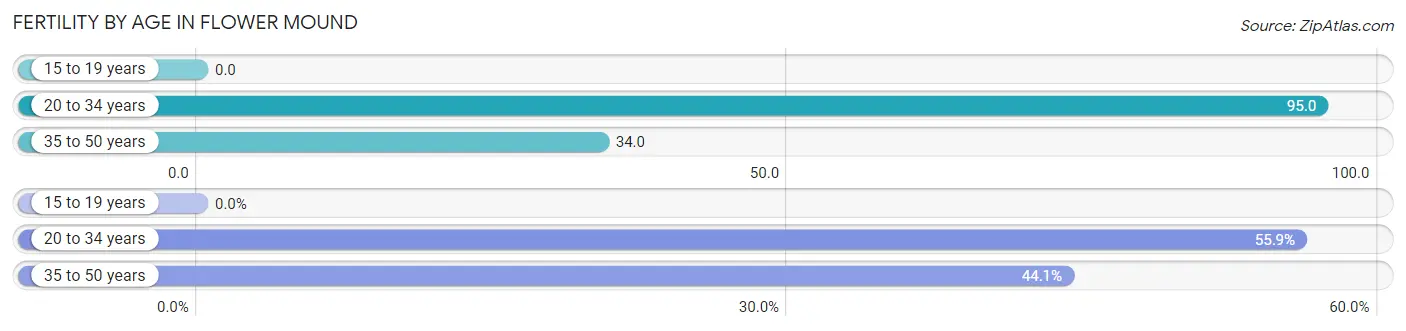
| Age Bracket | Women with Births | Births / 1,000 Women |
| 15 to 19 years | 0 (0.0%) | 0.0 |
| 20 to 34 years | 410 (55.9%) | 95.0 |
| 35 to 50 years | 323 (44.1%) | 34.0 |
| Total | 733 (100.0%) | 44.0 |
Fertility by Age by Marriage Status in Flower Mound
95.0% of women with births (733) in Flower Mound are married. The highest percentage of unmarried women with births falls into 35 to 50 years age bracket with 11.5% of them unmarried at the time of birth, while the lowest percentage of unmarried women with births belong to 20 to 34 years age bracket with 0.0% of them unmarried.
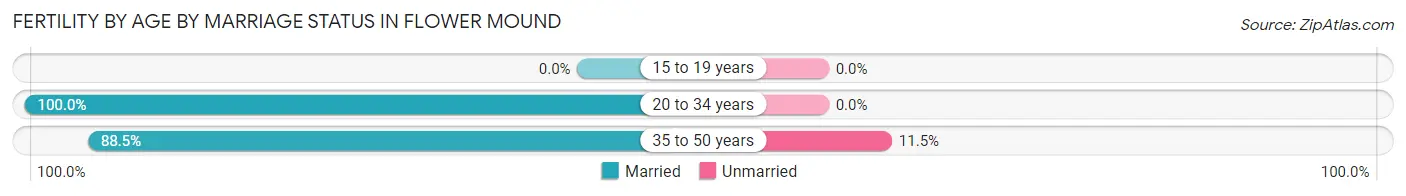
| Age Bracket | Married | Unmarried |
| 15 to 19 years | 0 (0.0%) | 0 (0.0%) |
| 20 to 34 years | 410 (100.0%) | 0 (0.0%) |
| 35 to 50 years | 286 (88.5%) | 37 (11.5%) |
| Total | 696 (95.0%) | 37 (5.1%) |
Fertility by Education in Flower Mound
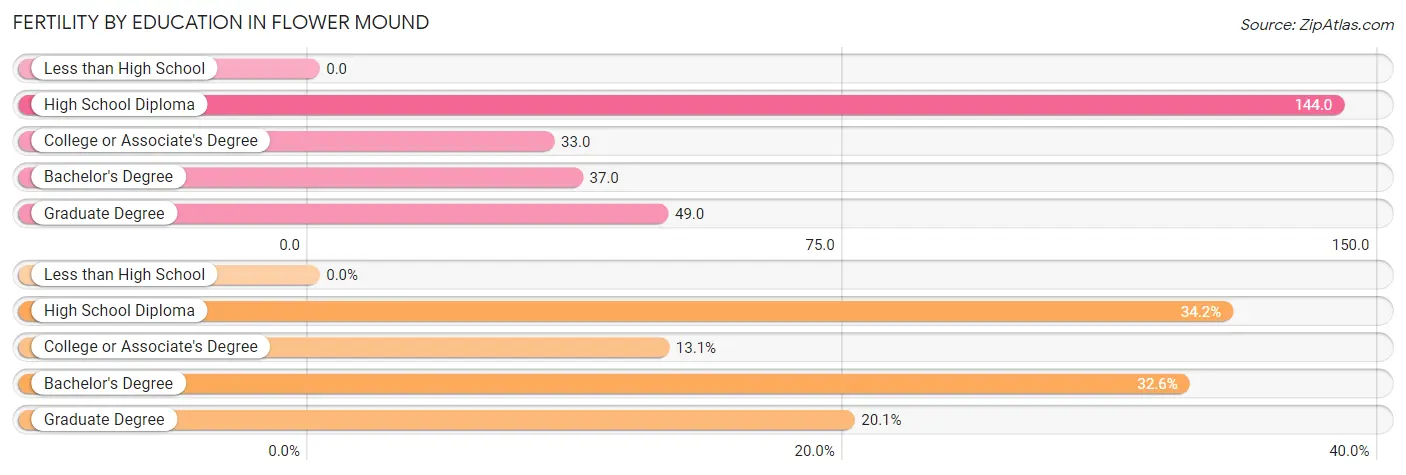
| Educational Attainment | Women with Births | Births / 1,000 Women |
| Less than High School | 0 (0.0%) | 0.0 |
| High School Diploma | 251 (34.2%) | 144.0 |
| College or Associate's Degree | 96 (13.1%) | 33.0 |
| Bachelor's Degree | 239 (32.6%) | 37.0 |
| Graduate Degree | 147 (20.1%) | 49.0 |
| Total | 733 (100.0%) | 44.0 |
Fertility by Education by Marriage Status in Flower Mound
5.1% of women with births in Flower Mound are unmarried. Women with the educational attainment of high school diploma are most likely to be married with 100.0% of them married at childbirth, while women with the educational attainment of college or associate's degree are least likely to be married with 38.5% of them unmarried at childbirth.
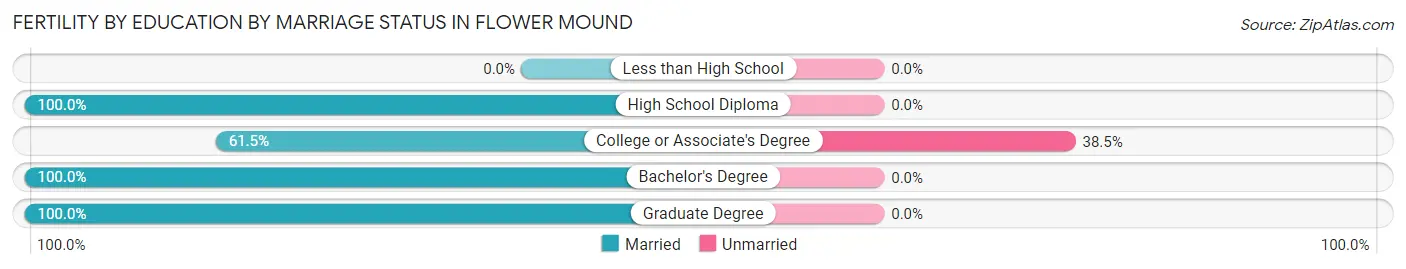
| Educational Attainment | Married | Unmarried |
| Less than High School | 0 (0.0%) | 0 (0.0%) |
| High School Diploma | 251 (100.0%) | 0 (0.0%) |
| College or Associate's Degree | 59 (61.5%) | 37 (38.5%) |
| Bachelor's Degree | 239 (100.0%) | 0 (0.0%) |
| Graduate Degree | 147 (100.0%) | 0 (0.0%) |
| Total | 696 (95.0%) | 37 (5.1%) |
Employment Characteristics in Flower Mound
Employment by Class of Employer in Flower Mound
Among the 40,263 employed individuals in Flower Mound, private company employees (29,254 | 72.7%), local government employees (2,920 | 7.2%), and not-for-profit organizations (2,251 | 5.6%) make up the most common classes of employment.
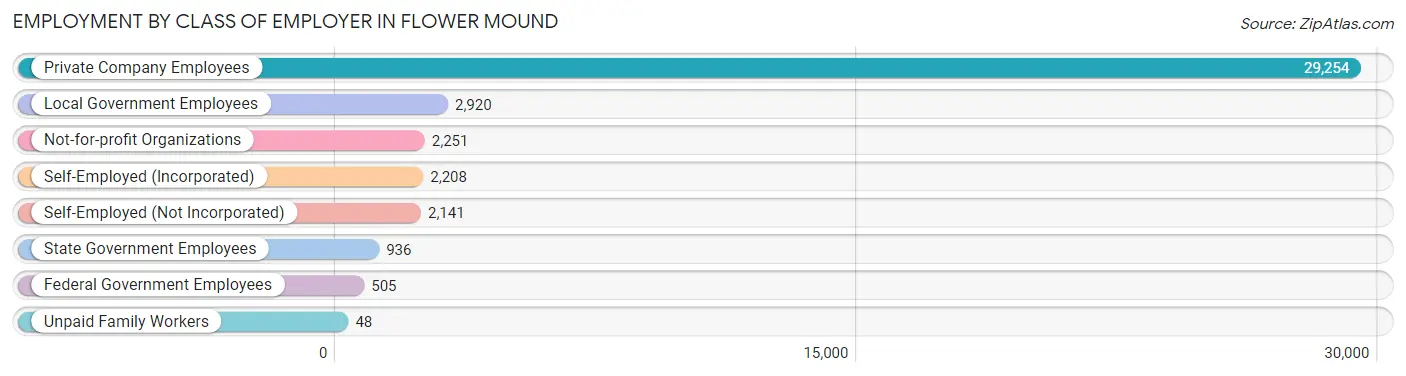
| Employer Class | # Employees | % Employees |
| Private Company Employees | 29,254 | 72.7% |
| Self-Employed (Incorporated) | 2,208 | 5.5% |
| Self-Employed (Not Incorporated) | 2,141 | 5.3% |
| Not-for-profit Organizations | 2,251 | 5.6% |
| Local Government Employees | 2,920 | 7.2% |
| State Government Employees | 936 | 2.3% |
| Federal Government Employees | 505 | 1.3% |
| Unpaid Family Workers | 48 | 0.1% |
| Total | 40,263 | 100.0% |
Employment Status by Age in Flower Mound
According to the labor force statistics for Flower Mound, out of the total population over 16 years of age (59,544), 71.0% or 42,276 individuals are in the labor force, with 3.9% or 1,649 of them unemployed. The age group with the highest labor force participation rate is 45 to 54 years, with 88.0% or 12,095 individuals in the labor force. Within the labor force, the 16 to 19 years age range has the highest percentage of unemployed individuals, with 10.1% or 164 of them being unemployed.
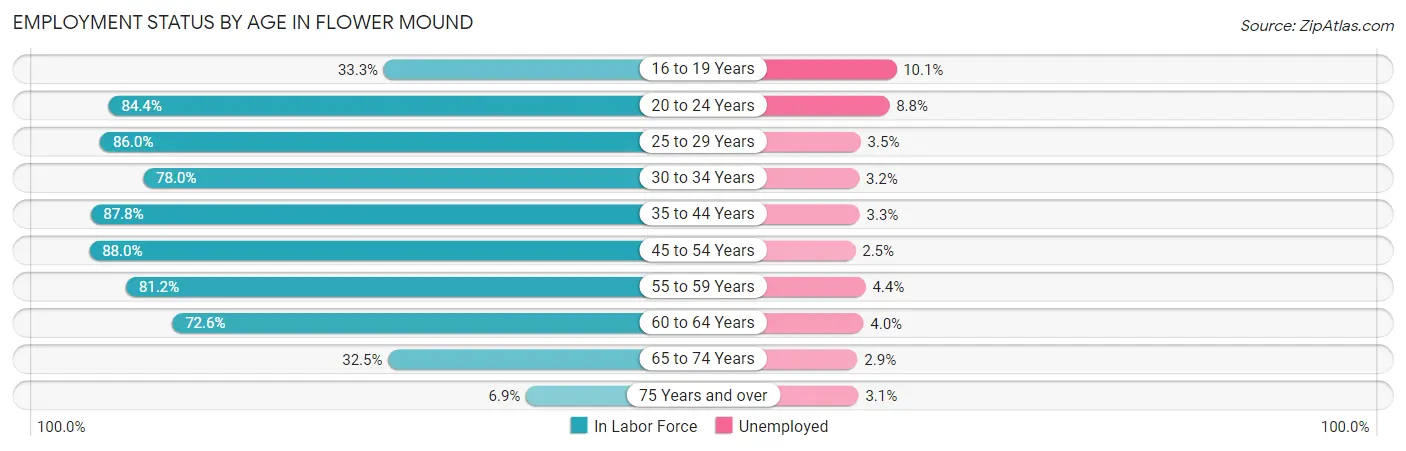
| Age Bracket | In Labor Force | Unemployed |
| 16 to 19 Years | 1,622 (33.3%) | 164 (10.1%) |
| 20 to 24 Years | 2,680 (84.4%) | 236 (8.8%) |
| 25 to 29 Years | 2,229 (86.0%) | 78 (3.5%) |
| 30 to 34 Years | 2,598 (78.0%) | 83 (3.2%) |
| 35 to 44 Years | 9,349 (87.8%) | 309 (3.3%) |
| 45 to 54 Years | 12,095 (88.0%) | 302 (2.5%) |
| 55 to 59 Years | 5,993 (81.2%) | 264 (4.4%) |
| 60 to 64 Years | 3,538 (72.6%) | 142 (4.0%) |
| 65 to 74 Years | 2,008 (32.5%) | 58 (2.9%) |
| 75 Years and over | 190 (6.9%) | 6 (3.1%) |
| Total | 42,276 (71.0%) | 1,649 (3.9%) |
Employment Status by Educational Attainment in Flower Mound
According to labor force statistics for Flower Mound, 84.1% of individuals (35,800) out of the total population between 25 and 64 years of age (42,568) are in the labor force, with 3.3% or 1,181 of them being unemployed. The group with the highest labor force participation rate are those with the educational attainment of bachelor's degree or higher, with 87.3% or 25,265 individuals in the labor force. Within the labor force, individuals with less than high school education have the highest percentage of unemployment, with 10.5% or 75 of them being unemployed.
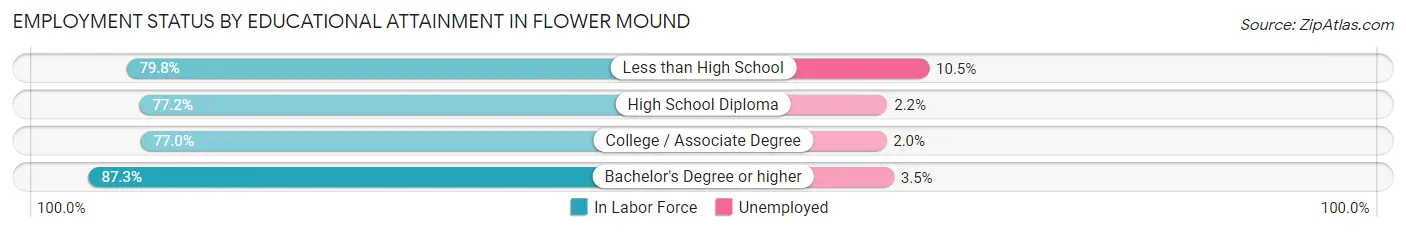
| Educational Attainment | In Labor Force | Unemployed |
| Less than High School | 713 (79.8%) | 94 (10.5%) |
| High School Diploma | 3,192 (77.2%) | 91 (2.2%) |
| College / Associate Degree | 6,621 (77.0%) | 172 (2.0%) |
| Bachelor's Degree or higher | 25,265 (87.3%) | 1,013 (3.5%) |
| Total | 35,800 (84.1%) | 1,405 (3.3%) |
Employment Occupations by Sex in Flower Mound
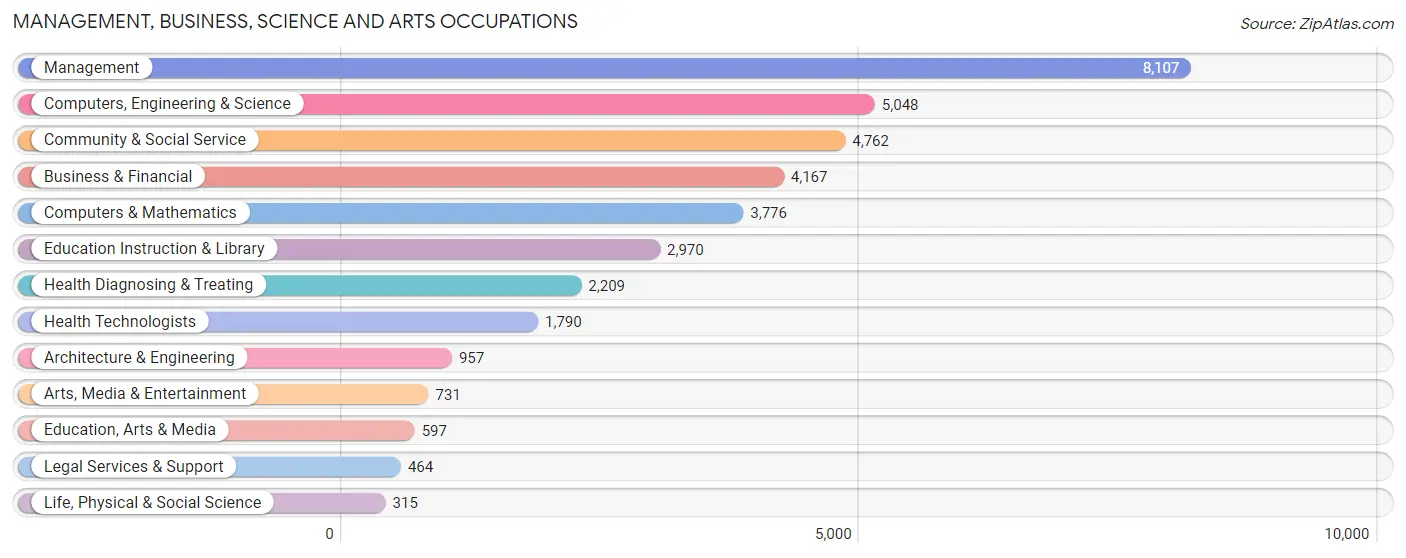
Management, Business, Science and Arts Occupations
The most common Management, Business, Science and Arts occupations in Flower Mound are Management (8,107 | 19.9%), Computers, Engineering & Science (5,048 | 12.4%), Community & Social Service (4,762 | 11.7%), Business & Financial (4,167 | 10.2%), and Computers & Mathematics (3,776 | 9.3%).
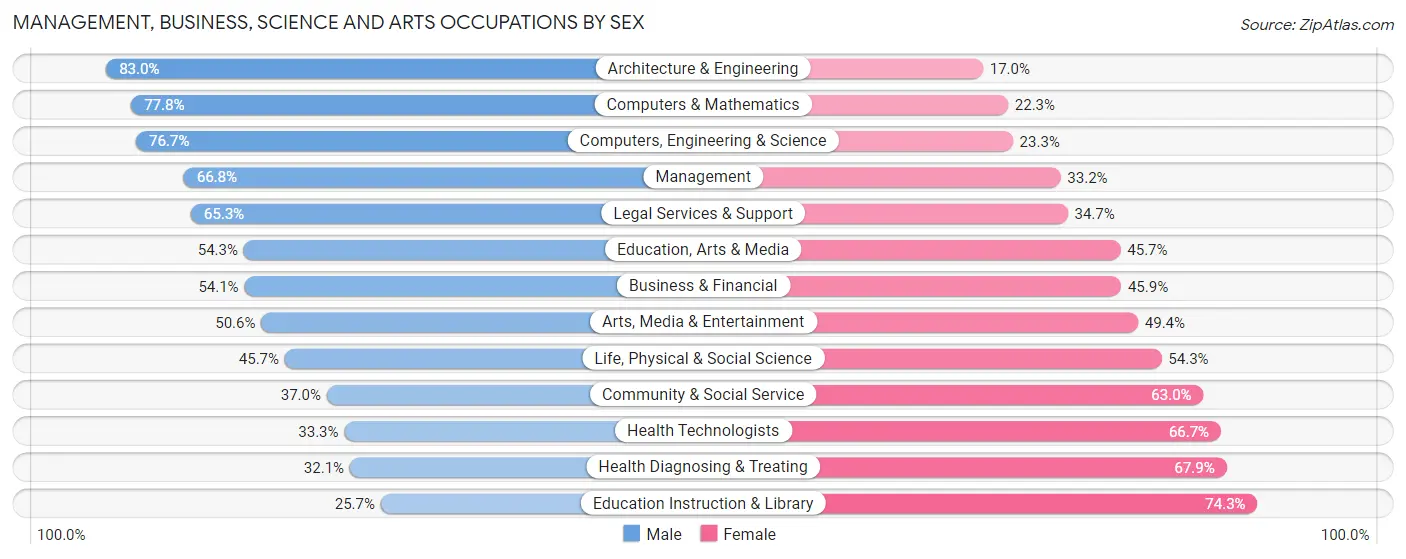
Management, Business, Science and Arts Occupations by Sex
Within the Management, Business, Science and Arts occupations in Flower Mound, the most male-oriented occupations are Architecture & Engineering (83.0%), Computers & Mathematics (77.7%), and Computers, Engineering & Science (76.7%), while the most female-oriented occupations are Education Instruction & Library (74.3%), Health Diagnosing & Treating (67.9%), and Health Technologists (66.7%).
| Occupation | Male | Female |
| Management | 5,414 (66.8%) | 2,693 (33.2%) |
| Business & Financial | 2,256 (54.1%) | 1,911 (45.9%) |
| Computers, Engineering & Science | 3,874 (76.7%) | 1,174 (23.3%) |
| Computers & Mathematics | 2,936 (77.7%) | 840 (22.3%) |
| Architecture & Engineering | 794 (83.0%) | 163 (17.0%) |
| Life, Physical & Social Science | 144 (45.7%) | 171 (54.3%) |
| Community & Social Service | 1,760 (37.0%) | 3,002 (63.0%) |
| Education, Arts & Media | 324 (54.3%) | 273 (45.7%) |
| Legal Services & Support | 303 (65.3%) | 161 (34.7%) |
| Education Instruction & Library | 763 (25.7%) | 2,207 (74.3%) |
| Arts, Media & Entertainment | 370 (50.6%) | 361 (49.4%) |
| Health Diagnosing & Treating | 710 (32.1%) | 1,499 (67.9%) |
| Health Technologists | 596 (33.3%) | 1,194 (66.7%) |
| Total (Category) | 14,014 (57.7%) | 10,279 (42.3%) |
| Total (Overall) | 22,649 (55.7%) | 18,015 (44.3%) |
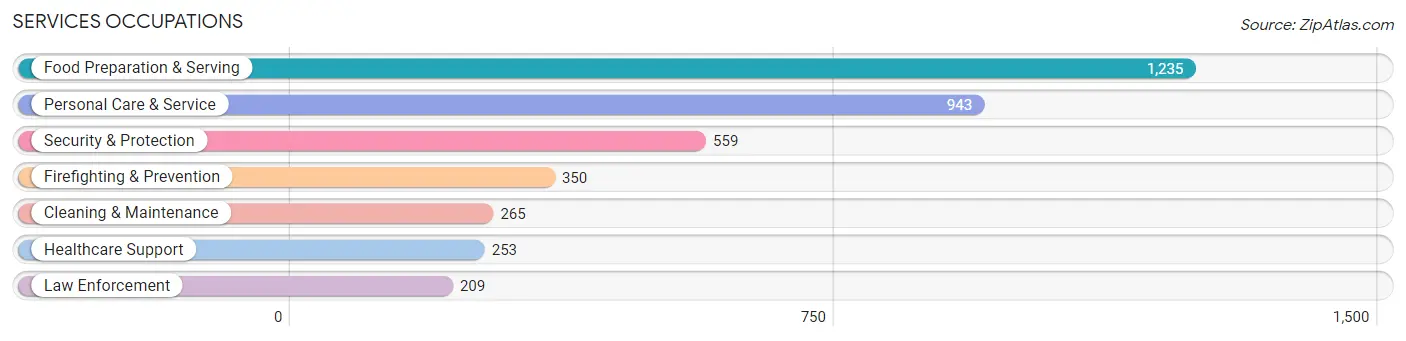
Services Occupations
The most common Services occupations in Flower Mound are Food Preparation & Serving (1,235 | 3.0%), Personal Care & Service (943 | 2.3%), Security & Protection (559 | 1.4%), Firefighting & Prevention (350 | 0.9%), and Cleaning & Maintenance (265 | 0.6%).
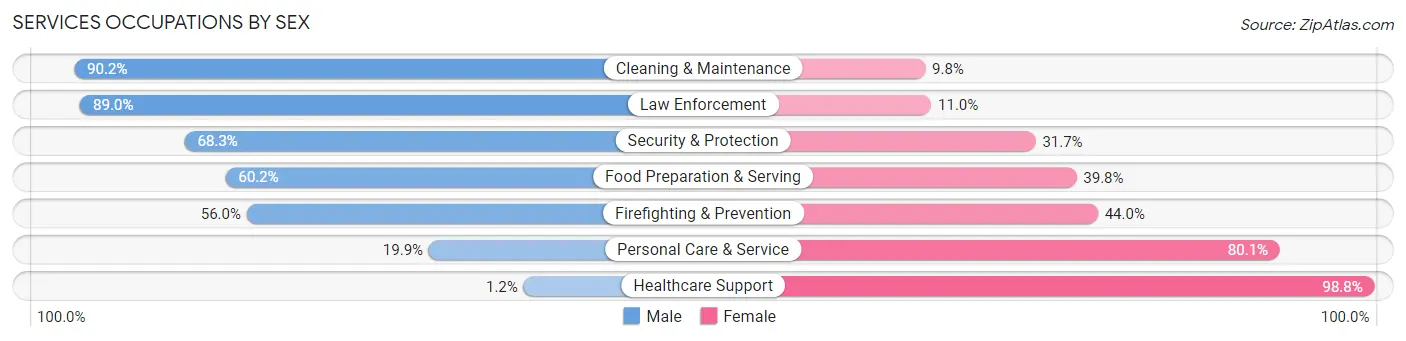
Services Occupations by Sex
Within the Services occupations in Flower Mound, the most male-oriented occupations are Cleaning & Maintenance (90.2%), Law Enforcement (89.0%), and Security & Protection (68.3%), while the most female-oriented occupations are Healthcare Support (98.8%), Personal Care & Service (80.1%), and Firefighting & Prevention (44.0%).
| Occupation | Male | Female |
| Healthcare Support | 3 (1.2%) | 250 (98.8%) |
| Security & Protection | 382 (68.3%) | 177 (31.7%) |
| Firefighting & Prevention | 196 (56.0%) | 154 (44.0%) |
| Law Enforcement | 186 (89.0%) | 23 (11.0%) |
| Food Preparation & Serving | 744 (60.2%) | 491 (39.8%) |
| Cleaning & Maintenance | 239 (90.2%) | 26 (9.8%) |
| Personal Care & Service | 188 (19.9%) | 755 (80.1%) |
| Total (Category) | 1,556 (47.8%) | 1,699 (52.2%) |
| Total (Overall) | 22,649 (55.7%) | 18,015 (44.3%) |
Sales and Office Occupations
The most common Sales and Office occupations in Flower Mound are Sales & Related (4,828 | 11.9%), and Office & Administration (4,304 | 10.6%).

Sales and Office Occupations by Sex
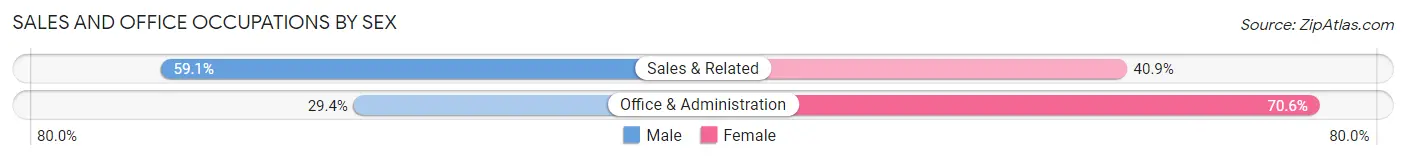
| Occupation | Male | Female |
| Sales & Related | 2,852 (59.1%) | 1,976 (40.9%) |
| Office & Administration | 1,264 (29.4%) | 3,040 (70.6%) |
| Total (Category) | 4,116 (45.1%) | 5,016 (54.9%) |
| Total (Overall) | 22,649 (55.7%) | 18,015 (44.3%) |
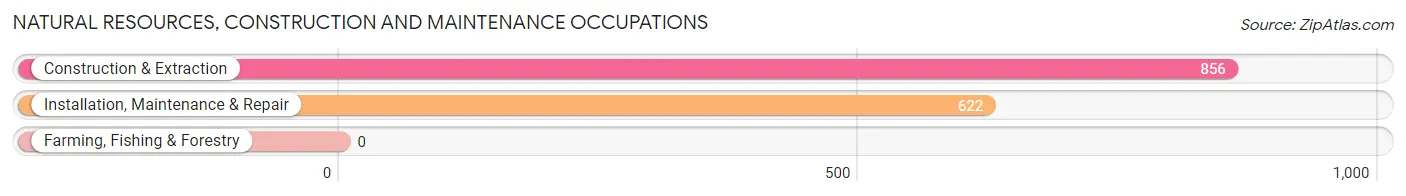
Natural Resources, Construction and Maintenance Occupations
The most common Natural Resources, Construction and Maintenance occupations in Flower Mound are Construction & Extraction (856 | 2.1%), and Installation, Maintenance & Repair (622 | 1.5%).
Natural Resources, Construction and Maintenance Occupations by Sex
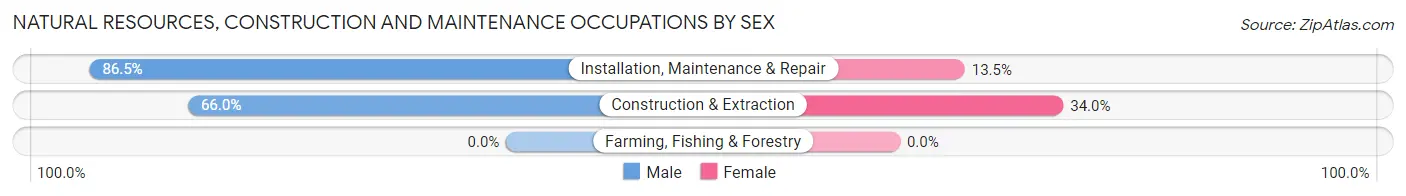
| Occupation | Male | Female |
| Farming, Fishing & Forestry | 0 (0.0%) | 0 (0.0%) |
| Construction & Extraction | 565 (66.0%) | 291 (34.0%) |
| Installation, Maintenance & Repair | 538 (86.5%) | 84 (13.5%) |
| Total (Category) | 1,103 (74.6%) | 375 (25.4%) |
| Total (Overall) | 22,649 (55.7%) | 18,015 (44.3%) |
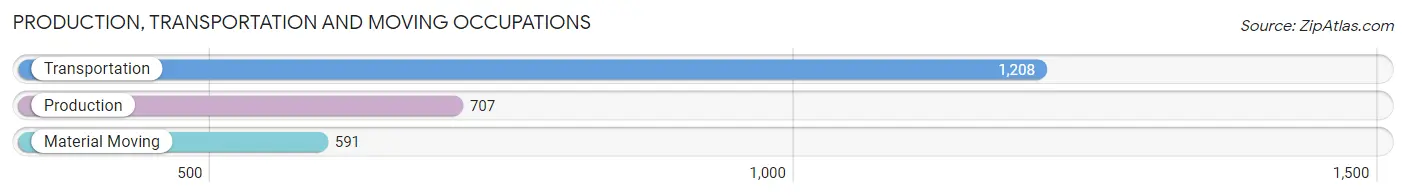
Production, Transportation and Moving Occupations
The most common Production, Transportation and Moving occupations in Flower Mound are Transportation (1,208 | 3.0%), Production (707 | 1.7%), and Material Moving (591 | 1.5%).
Production, Transportation and Moving Occupations by Sex
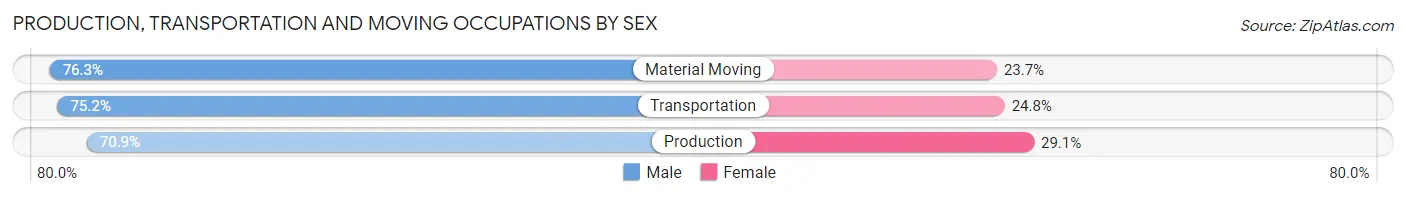
| Occupation | Male | Female |
| Production | 501 (70.9%) | 206 (29.1%) |
| Transportation | 908 (75.2%) | 300 (24.8%) |
| Material Moving | 451 (76.3%) | 140 (23.7%) |
| Total (Category) | 1,860 (74.2%) | 646 (25.8%) |
| Total (Overall) | 22,649 (55.7%) | 18,015 (44.3%) |
Employment Industries by Sex in Flower Mound
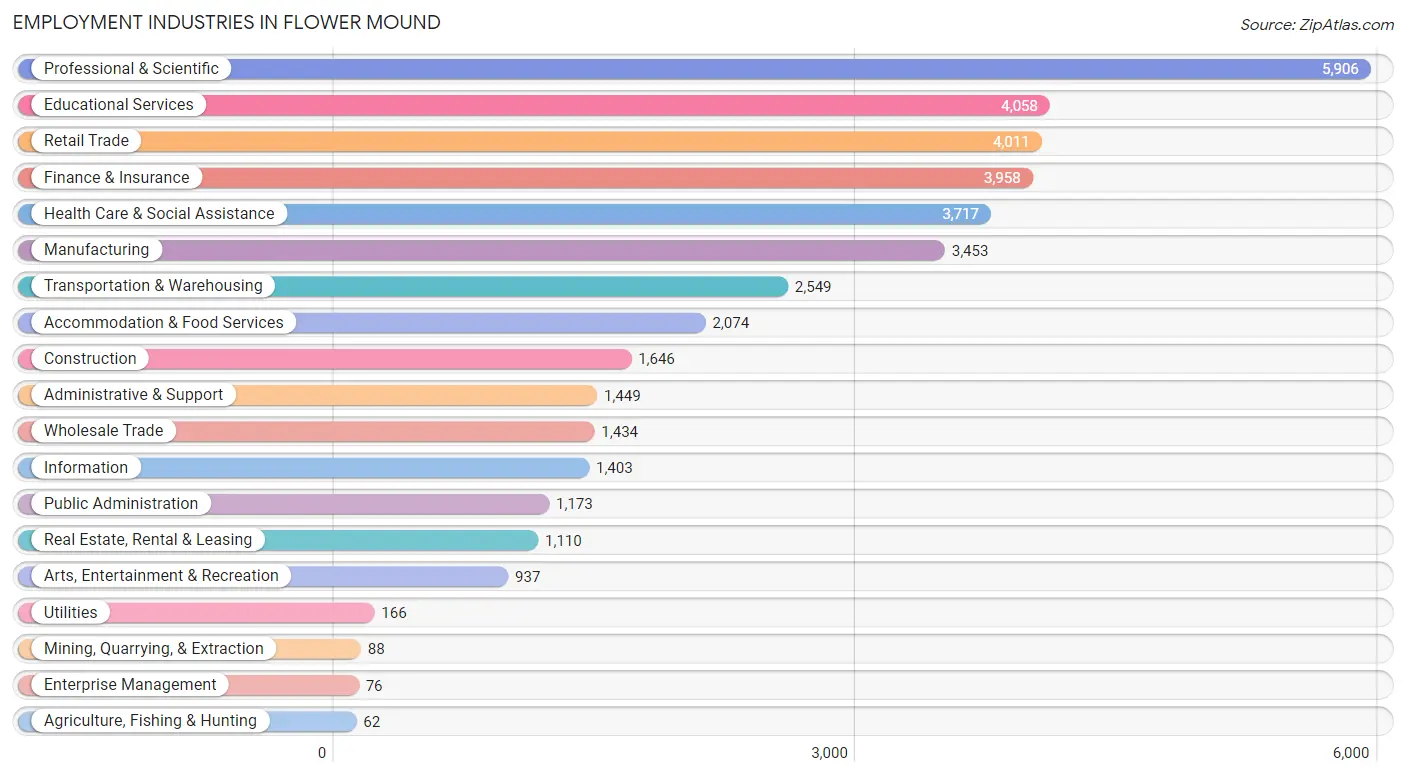
Employment Industries in Flower Mound
The major employment industries in Flower Mound include Professional & Scientific (5,906 | 14.5%), Educational Services (4,058 | 10.0%), Retail Trade (4,011 | 9.9%), Finance & Insurance (3,958 | 9.7%), and Health Care & Social Assistance (3,717 | 9.1%).
Employment Industries by Sex in Flower Mound
The Flower Mound industries that see more men than women are Construction (88.8%), Manufacturing (73.6%), and Information (73.3%), whereas the industries that tend to have a higher number of women are Educational Services (76.2%), Health Care & Social Assistance (73.0%), and Public Administration (57.5%).
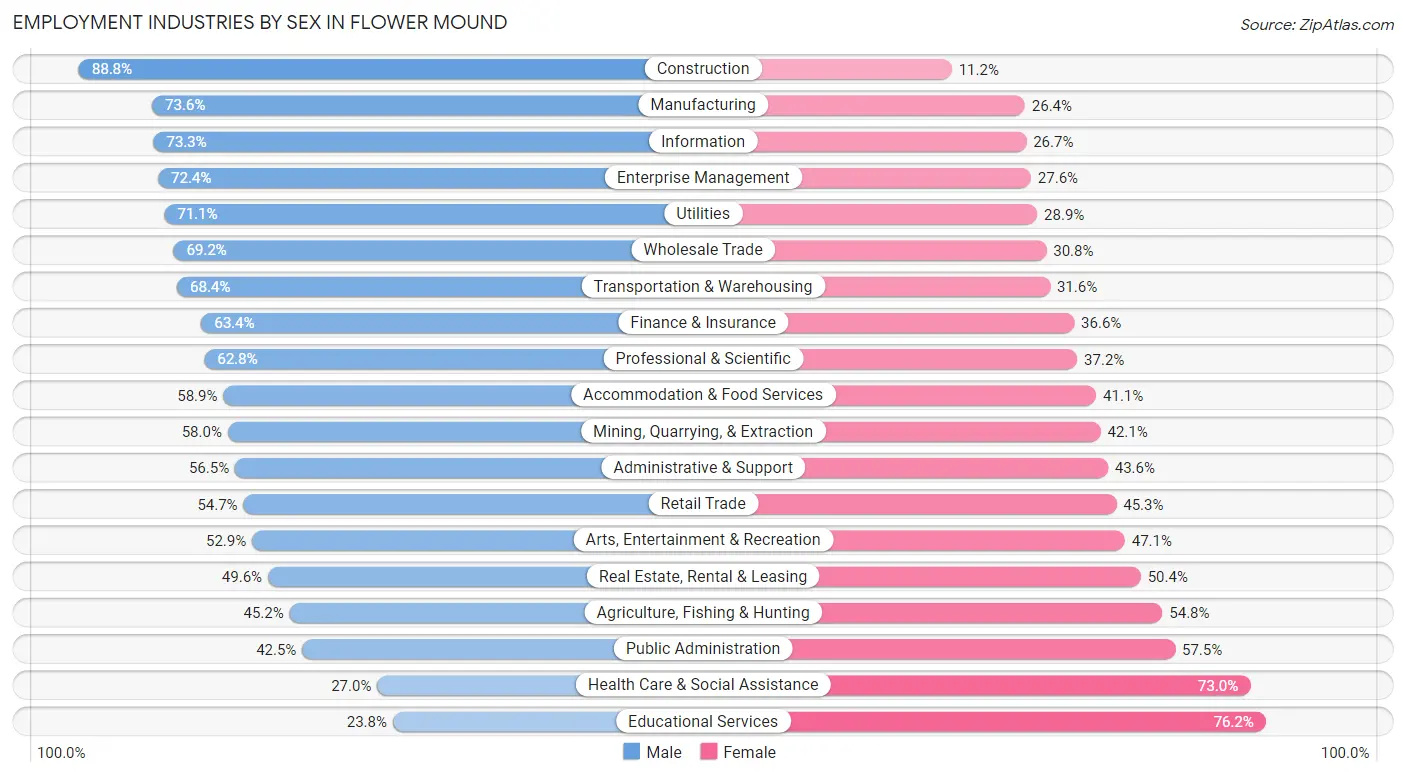
| Industry | Male | Female |
| Agriculture, Fishing & Hunting | 28 (45.2%) | 34 (54.8%) |
| Mining, Quarrying, & Extraction | 51 (58.0%) | 37 (42.0%) |
| Construction | 1,461 (88.8%) | 185 (11.2%) |
| Manufacturing | 2,542 (73.6%) | 911 (26.4%) |
| Wholesale Trade | 992 (69.2%) | 442 (30.8%) |
| Retail Trade | 2,194 (54.7%) | 1,817 (45.3%) |
| Transportation & Warehousing | 1,744 (68.4%) | 805 (31.6%) |
| Utilities | 118 (71.1%) | 48 (28.9%) |
| Information | 1,029 (73.3%) | 374 (26.7%) |
| Finance & Insurance | 2,510 (63.4%) | 1,448 (36.6%) |
| Real Estate, Rental & Leasing | 551 (49.6%) | 559 (50.4%) |
| Professional & Scientific | 3,709 (62.8%) | 2,197 (37.2%) |
| Enterprise Management | 55 (72.4%) | 21 (27.6%) |
| Administrative & Support | 818 (56.5%) | 631 (43.5%) |
| Educational Services | 965 (23.8%) | 3,093 (76.2%) |
| Health Care & Social Assistance | 1,004 (27.0%) | 2,713 (73.0%) |
| Arts, Entertainment & Recreation | 496 (52.9%) | 441 (47.1%) |
| Accommodation & Food Services | 1,221 (58.9%) | 853 (41.1%) |
| Public Administration | 499 (42.5%) | 674 (57.5%) |
| Total | 22,649 (55.7%) | 18,015 (44.3%) |
Education in Flower Mound
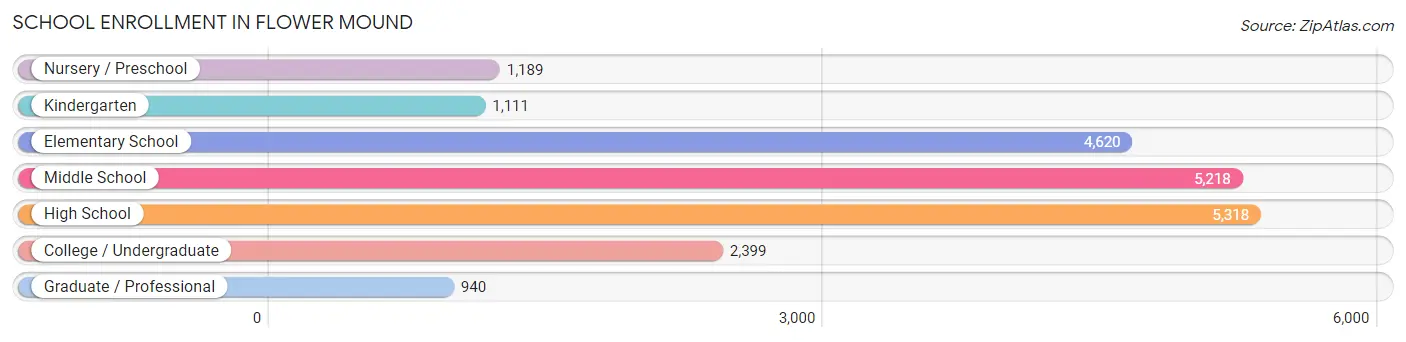
School Enrollment in Flower Mound
The most common levels of schooling among the 20,795 students in Flower Mound are high school (5,318 | 25.6%), middle school (5,218 | 25.1%), and elementary school (4,620 | 22.2%).
| School Level | # Students | % Students |
| Nursery / Preschool | 1,189 | 5.7% |
| Kindergarten | 1,111 | 5.3% |
| Elementary School | 4,620 | 22.2% |
| Middle School | 5,218 | 25.1% |
| High School | 5,318 | 25.6% |
| College / Undergraduate | 2,399 | 11.5% |
| Graduate / Professional | 940 | 4.5% |
| Total | 20,795 | 100.0% |
School Enrollment by Age by Funding Source in Flower Mound
Out of a total of 20,795 students who are enrolled in schools in Flower Mound, 3,098 (14.9%) attend a private institution, while the remaining 17,697 (85.1%) are enrolled in public schools. The age group of 3 to 4 year olds has the highest likelihood of being enrolled in private schools, with 553 (66.0% in the age bracket) enrolled. Conversely, the age group of 15 to 17 year olds has the lowest likelihood of being enrolled in a private school, with 3,857 (92.6% in the age bracket) attending a public institution.
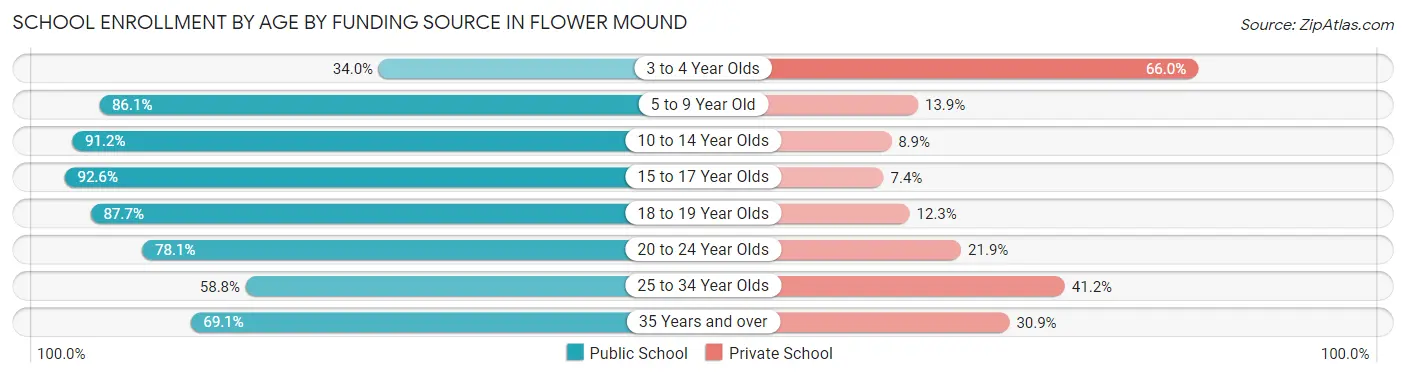
| Age Bracket | Public School | Private School |
| 3 to 4 Year Olds | 285 (34.0%) | 553 (66.0%) |
| 5 to 9 Year Old | 4,259 (86.1%) | 685 (13.9%) |
| 10 to 14 Year Olds | 6,200 (91.1%) | 602 (8.8%) |
| 15 to 17 Year Olds | 3,857 (92.6%) | 310 (7.4%) |
| 18 to 19 Year Olds | 1,186 (87.7%) | 166 (12.3%) |
| 20 to 24 Year Olds | 896 (78.1%) | 251 (21.9%) |
| 25 to 34 Year Olds | 301 (58.8%) | 211 (41.2%) |
| 35 Years and over | 714 (69.1%) | 319 (30.9%) |
| Total | 17,697 (85.1%) | 3,098 (14.9%) |
Educational Attainment by Field of Study in Flower Mound
Business (10,946 | 30.4%), engineering (4,055 | 11.3%), science & technology (2,699 | 7.5%), education (2,488 | 6.9%), and social sciences (2,484 | 6.9%) are the most common fields of study among 36,015 individuals in Flower Mound who have obtained a bachelor's degree or higher.
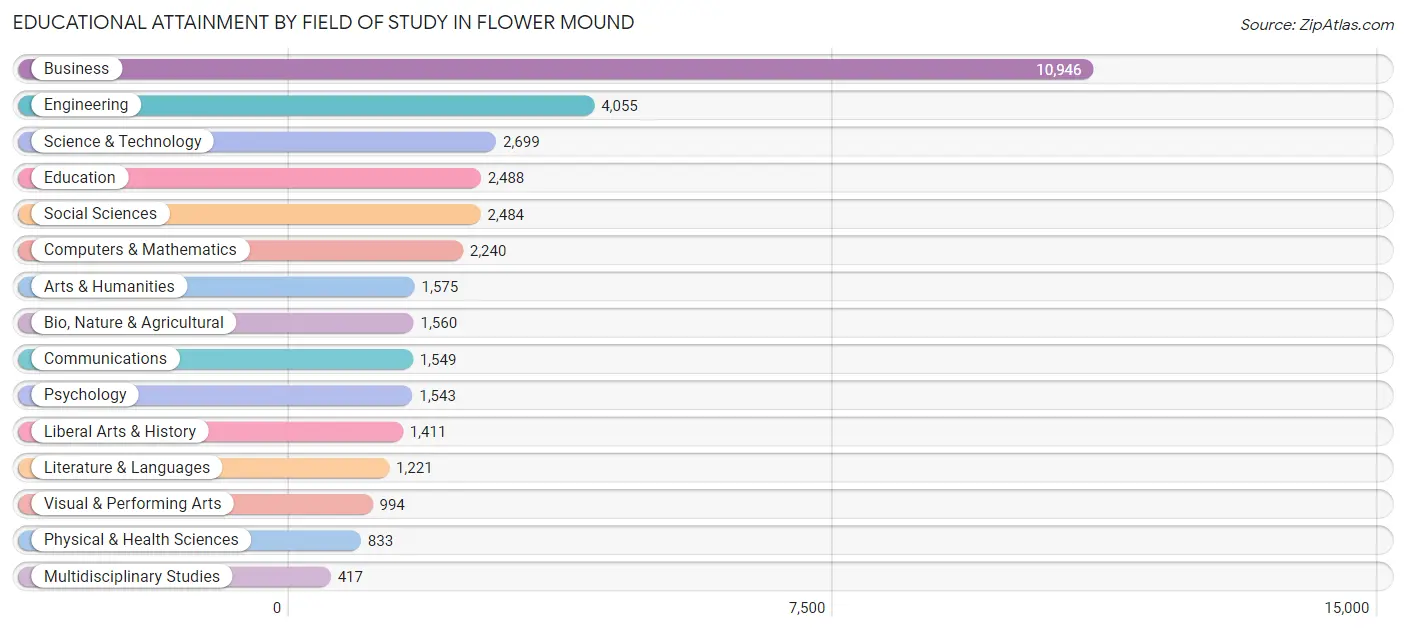
| Field of Study | # Graduates | % Graduates |
| Computers & Mathematics | 2,240 | 6.2% |
| Bio, Nature & Agricultural | 1,560 | 4.3% |
| Physical & Health Sciences | 833 | 2.3% |
| Psychology | 1,543 | 4.3% |
| Social Sciences | 2,484 | 6.9% |
| Engineering | 4,055 | 11.3% |
| Multidisciplinary Studies | 417 | 1.2% |
| Science & Technology | 2,699 | 7.5% |
| Business | 10,946 | 30.4% |
| Education | 2,488 | 6.9% |
| Literature & Languages | 1,221 | 3.4% |
| Liberal Arts & History | 1,411 | 3.9% |
| Visual & Performing Arts | 994 | 2.8% |
| Communications | 1,549 | 4.3% |
| Arts & Humanities | 1,575 | 4.4% |
| Total | 36,015 | 100.0% |
Transportation & Commute in Flower Mound
Vehicle Availability by Sex in Flower Mound
The most prevalent vehicle ownership categories in Flower Mound are males with 2 vehicles (11,751, accounting for 52.2%) and females with 2 vehicles (8,557, making up 66.3%).
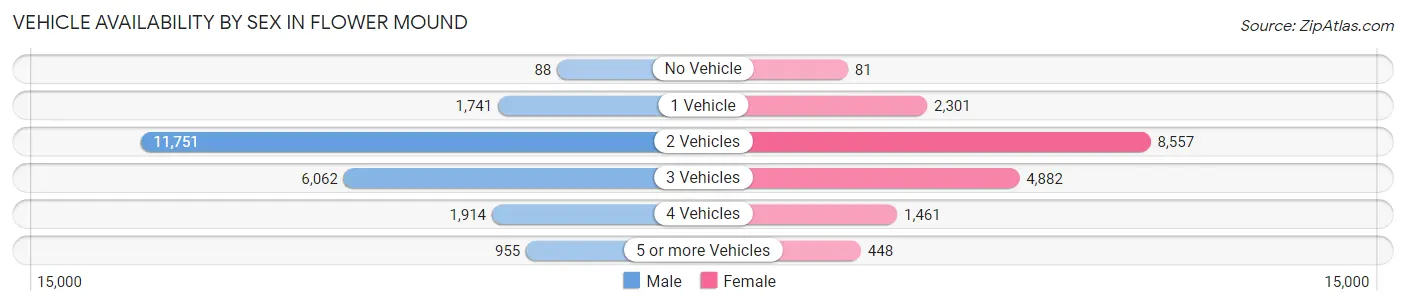
| Vehicles Available | Male | Female |
| No Vehicle | 88 (0.4%) | 81 (0.5%) |
| 1 Vehicle | 1,741 (7.7%) | 2,301 (13.0%) |
| 2 Vehicles | 11,751 (52.2%) | 8,557 (48.3%) |
| 3 Vehicles | 6,062 (26.9%) | 4,882 (27.5%) |
| 4 Vehicles | 1,914 (8.5%) | 1,461 (8.2%) |
| 5 or more Vehicles | 955 (4.2%) | 448 (2.5%) |
| Total | 22,511 (100.0%) | 17,730 (100.0%) |
Commute Time in Flower Mound
The most frequently occuring commute durations in Flower Mound are 30 to 34 minutes (5,591 commuters, 18.3%), 20 to 24 minutes (4,092 commuters, 13.4%), and 10 to 14 minutes (3,482 commuters, 11.4%).
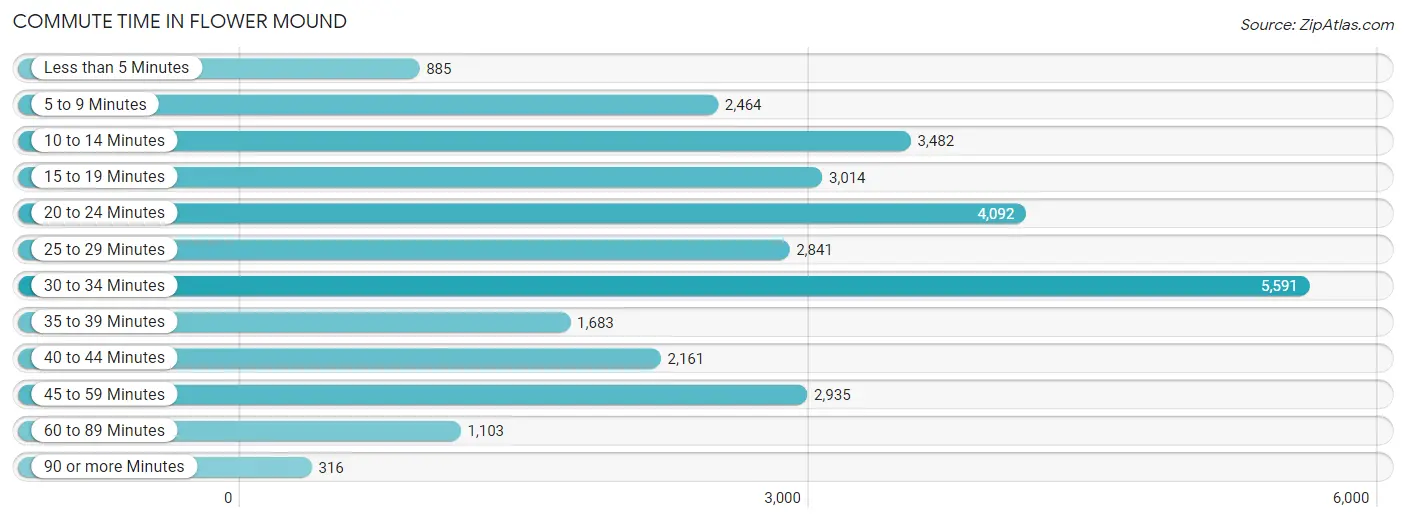
| Commute Time | # Commuters | % Commuters |
| Less than 5 Minutes | 885 | 2.9% |
| 5 to 9 Minutes | 2,464 | 8.1% |
| 10 to 14 Minutes | 3,482 | 11.4% |
| 15 to 19 Minutes | 3,014 | 9.9% |
| 20 to 24 Minutes | 4,092 | 13.4% |
| 25 to 29 Minutes | 2,841 | 9.3% |
| 30 to 34 Minutes | 5,591 | 18.3% |
| 35 to 39 Minutes | 1,683 | 5.5% |
| 40 to 44 Minutes | 2,161 | 7.1% |
| 45 to 59 Minutes | 2,935 | 9.6% |
| 60 to 89 Minutes | 1,103 | 3.6% |
| 90 or more Minutes | 316 | 1.0% |
Commute Time by Sex in Flower Mound
The most common commute times in Flower Mound are 30 to 34 minutes (3,358 commuters, 19.5%) for males and 30 to 34 minutes (2,233 commuters, 16.8%) for females.
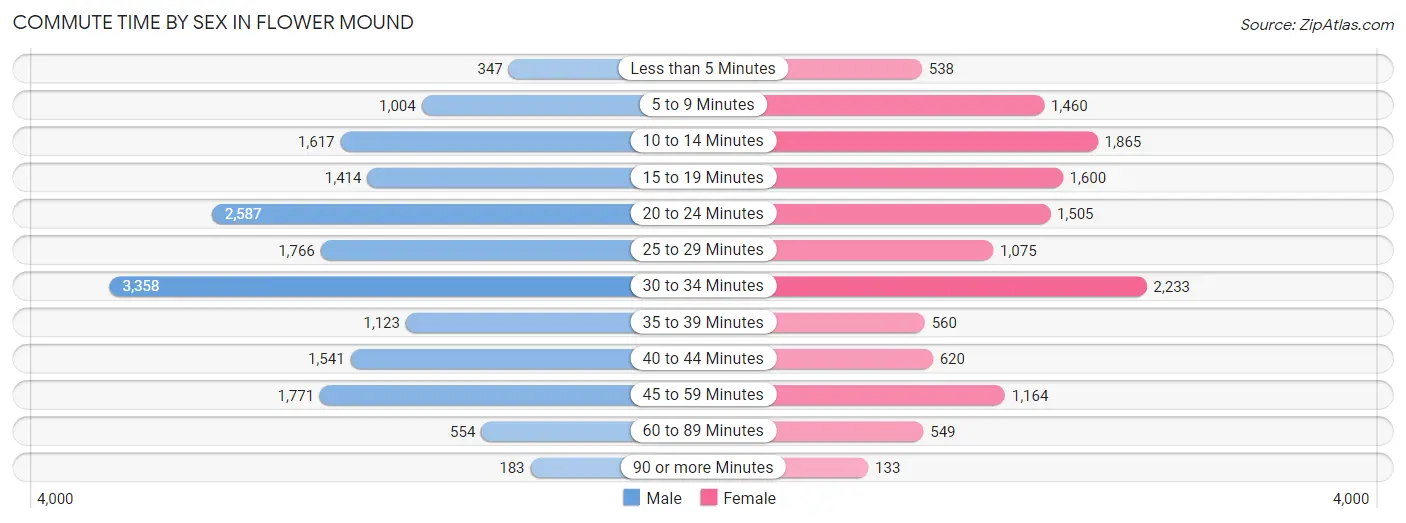
| Commute Time | Male | Female |
| Less than 5 Minutes | 347 (2.0%) | 538 (4.0%) |
| 5 to 9 Minutes | 1,004 (5.8%) | 1,460 (11.0%) |
| 10 to 14 Minutes | 1,617 (9.4%) | 1,865 (14.0%) |
| 15 to 19 Minutes | 1,414 (8.2%) | 1,600 (12.0%) |
| 20 to 24 Minutes | 2,587 (15.0%) | 1,505 (11.3%) |
| 25 to 29 Minutes | 1,766 (10.2%) | 1,075 (8.1%) |
| 30 to 34 Minutes | 3,358 (19.5%) | 2,233 (16.8%) |
| 35 to 39 Minutes | 1,123 (6.5%) | 560 (4.2%) |
| 40 to 44 Minutes | 1,541 (8.9%) | 620 (4.7%) |
| 45 to 59 Minutes | 1,771 (10.3%) | 1,164 (8.7%) |
| 60 to 89 Minutes | 554 (3.2%) | 549 (4.1%) |
| 90 or more Minutes | 183 (1.1%) | 133 (1.0%) |
Time of Departure to Work by Sex in Flower Mound
The most frequent times of departure to work in Flower Mound are 7:00 AM to 7:29 AM (2,986, 17.3%) for males and 7:30 AM to 7:59 AM (2,395, 18.0%) for females.
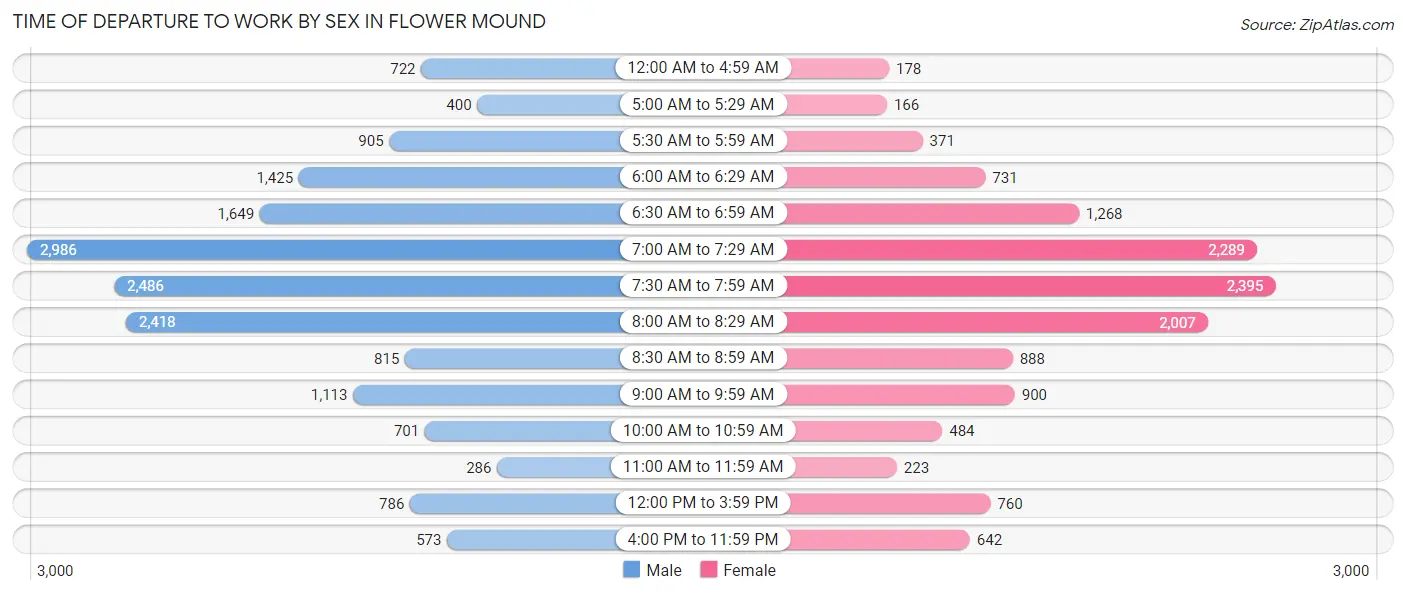
| Time of Departure | Male | Female |
| 12:00 AM to 4:59 AM | 722 (4.2%) | 178 (1.3%) |
| 5:00 AM to 5:29 AM | 400 (2.3%) | 166 (1.3%) |
| 5:30 AM to 5:59 AM | 905 (5.2%) | 371 (2.8%) |
| 6:00 AM to 6:29 AM | 1,425 (8.3%) | 731 (5.5%) |
| 6:30 AM to 6:59 AM | 1,649 (9.6%) | 1,268 (9.5%) |
| 7:00 AM to 7:29 AM | 2,986 (17.3%) | 2,289 (17.2%) |
| 7:30 AM to 7:59 AM | 2,486 (14.4%) | 2,395 (18.0%) |
| 8:00 AM to 8:29 AM | 2,418 (14.0%) | 2,007 (15.1%) |
| 8:30 AM to 8:59 AM | 815 (4.7%) | 888 (6.7%) |
| 9:00 AM to 9:59 AM | 1,113 (6.5%) | 900 (6.8%) |
| 10:00 AM to 10:59 AM | 701 (4.1%) | 484 (3.6%) |
| 11:00 AM to 11:59 AM | 286 (1.7%) | 223 (1.7%) |
| 12:00 PM to 3:59 PM | 786 (4.5%) | 760 (5.7%) |
| 4:00 PM to 11:59 PM | 573 (3.3%) | 642 (4.8%) |
| Total | 17,265 (100.0%) | 13,302 (100.0%) |
Housing Occupancy in Flower Mound
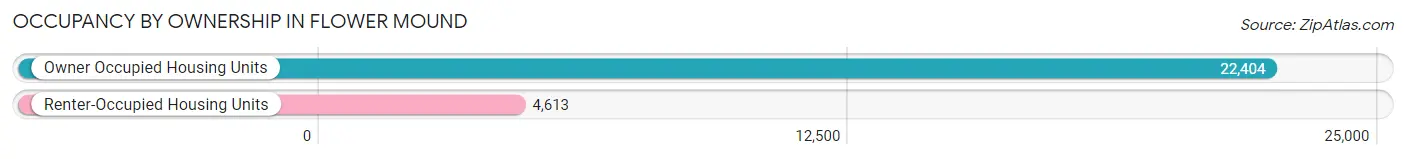
Occupancy by Ownership in Flower Mound
Of the total 27,017 dwellings in Flower Mound, owner-occupied units account for 22,404 (82.9%), while renter-occupied units make up 4,613 (17.1%).
| Occupancy | # Housing Units | % Housing Units |
| Owner Occupied Housing Units | 22,404 | 82.9% |
| Renter-Occupied Housing Units | 4,613 | 17.1% |
| Total Occupied Housing Units | 27,017 | 100.0% |
Occupancy by Household Size in Flower Mound
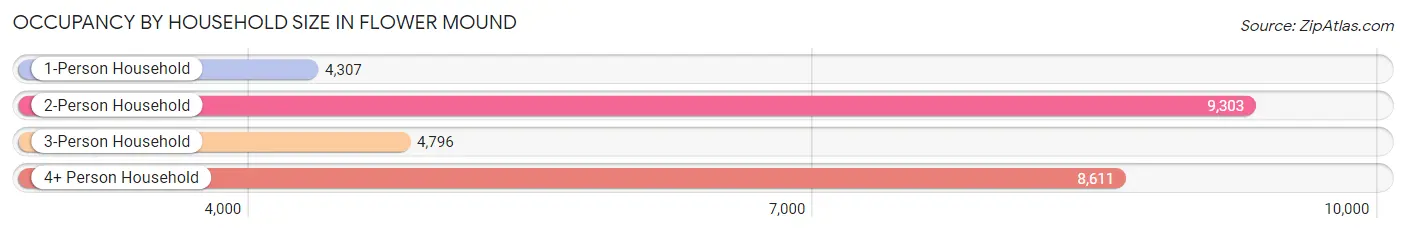
| Household Size | # Housing Units | % Housing Units |
| 1-Person Household | 4,307 | 15.9% |
| 2-Person Household | 9,303 | 34.4% |
| 3-Person Household | 4,796 | 17.7% |
| 4+ Person Household | 8,611 | 31.9% |
| Total Housing Units | 27,017 | 100.0% |
Occupancy by Ownership by Household Size in Flower Mound
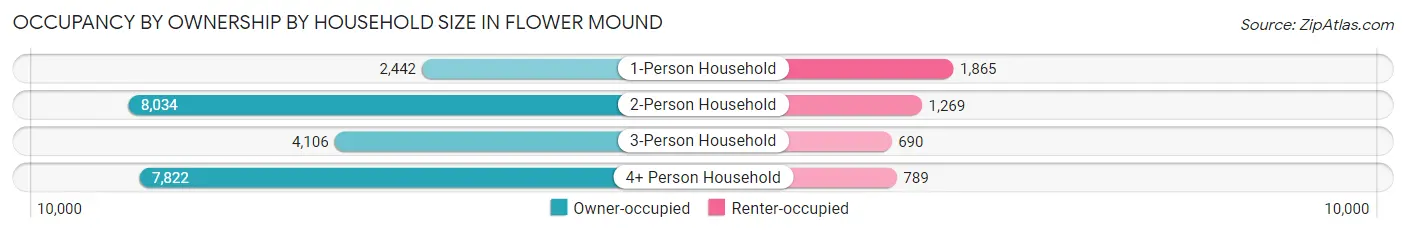
| Household Size | Owner-occupied | Renter-occupied |
| 1-Person Household | 2,442 (56.7%) | 1,865 (43.3%) |
| 2-Person Household | 8,034 (86.4%) | 1,269 (13.6%) |
| 3-Person Household | 4,106 (85.6%) | 690 (14.4%) |
| 4+ Person Household | 7,822 (90.8%) | 789 (9.2%) |
| Total Housing Units | 22,404 (82.9%) | 4,613 (17.1%) |
Occupancy by Educational Attainment in Flower Mound
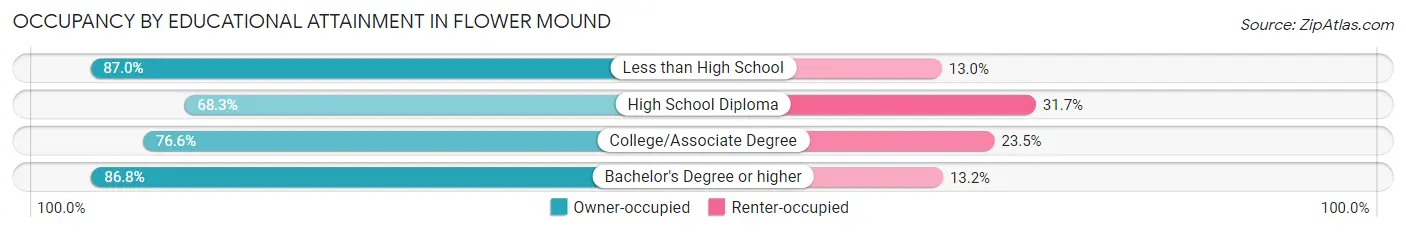
| Household Size | Owner-occupied | Renter-occupied |
| Less than High School | 361 (87.0%) | 54 (13.0%) |
| High School Diploma | 1,601 (68.3%) | 742 (31.7%) |
| College/Associate Degree | 4,530 (76.5%) | 1,388 (23.4%) |
| Bachelor's Degree or higher | 15,912 (86.8%) | 2,429 (13.2%) |
Occupancy by Age of Householder in Flower Mound
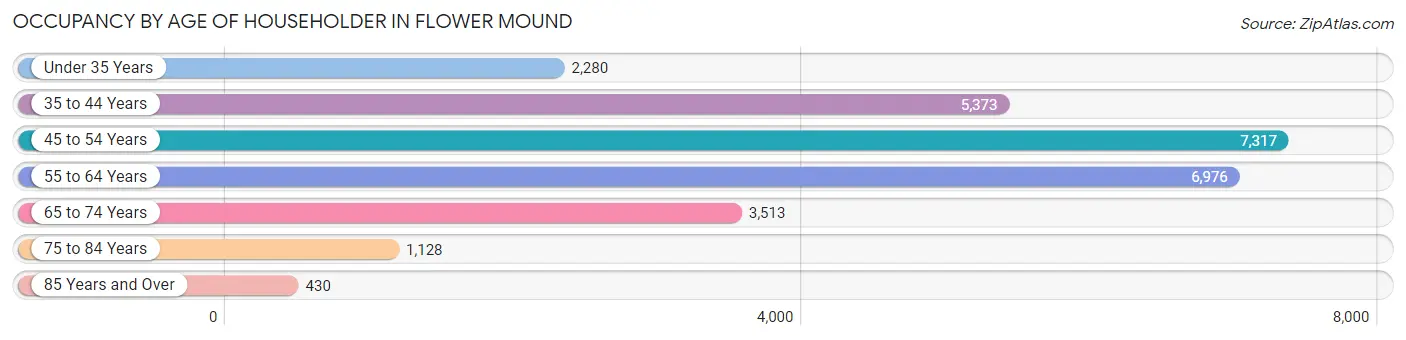
| Age Bracket | # Households | % Households |
| Under 35 Years | 2,280 | 8.4% |
| 35 to 44 Years | 5,373 | 19.9% |
| 45 to 54 Years | 7,317 | 27.1% |
| 55 to 64 Years | 6,976 | 25.8% |
| 65 to 74 Years | 3,513 | 13.0% |
| 75 to 84 Years | 1,128 | 4.2% |
| 85 Years and Over | 430 | 1.6% |
| Total | 27,017 | 100.0% |
Housing Finances in Flower Mound
Median Income by Occupancy in Flower Mound
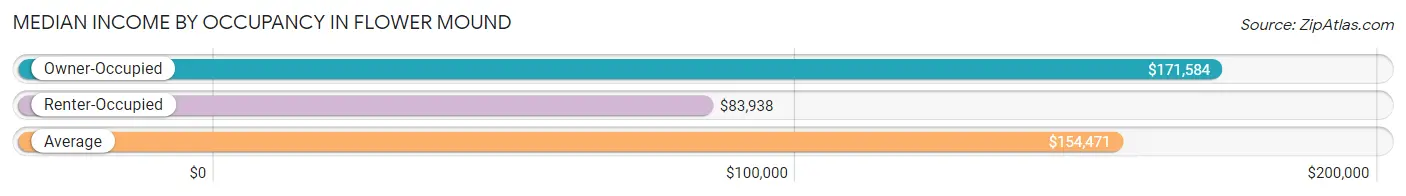
| Occupancy Type | # Households | Median Income |
| Owner-Occupied | 22,404 (82.9%) | $171,584 |
| Renter-Occupied | 4,613 (17.1%) | $83,938 |
| Average | 27,017 (100.0%) | $154,471 |
Occupancy by Householder Income Bracket in Flower Mound
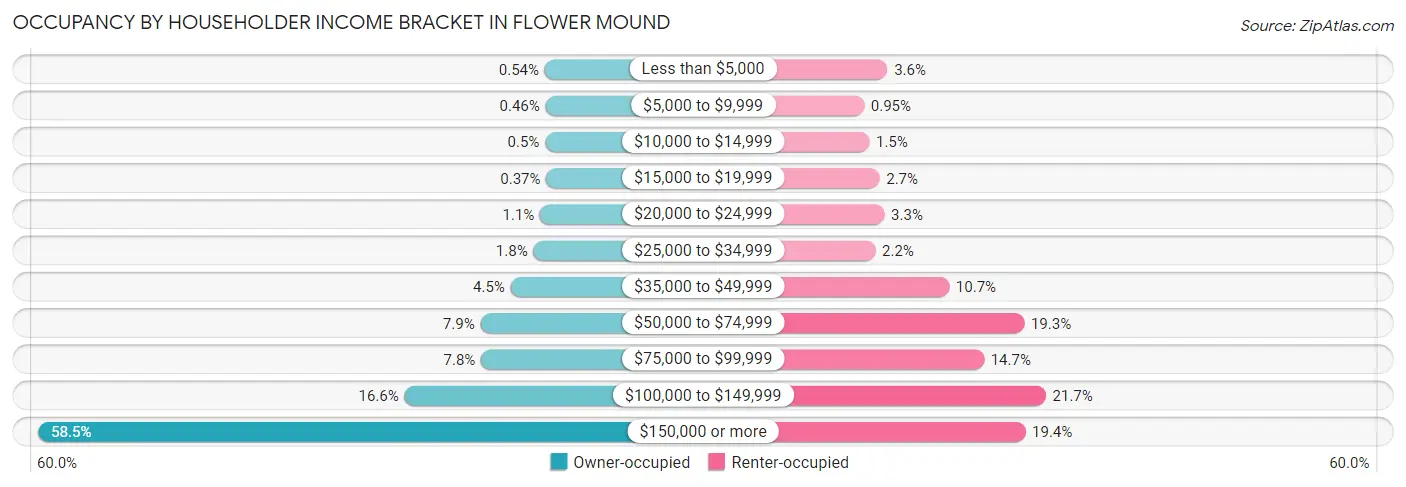
| Income Bracket | Owner-occupied | Renter-occupied |
| Less than $5,000 | 121 (0.5%) | 167 (3.6%) |
| $5,000 to $9,999 | 103 (0.5%) | 44 (0.9%) |
| $10,000 to $14,999 | 111 (0.5%) | 71 (1.5%) |
| $15,000 to $19,999 | 84 (0.4%) | 125 (2.7%) |
| $20,000 to $24,999 | 241 (1.1%) | 151 (3.3%) |
| $25,000 to $34,999 | 412 (1.8%) | 103 (2.2%) |
| $35,000 to $49,999 | 998 (4.4%) | 492 (10.7%) |
| $50,000 to $74,999 | 1,771 (7.9%) | 888 (19.3%) |
| $75,000 to $99,999 | 1,752 (7.8%) | 676 (14.6%) |
| $100,000 to $149,999 | 3,714 (16.6%) | 1,002 (21.7%) |
| $150,000 or more | 13,097 (58.5%) | 894 (19.4%) |
| Total | 22,404 (100.0%) | 4,613 (100.0%) |
Monthly Housing Cost Tiers in Flower Mound
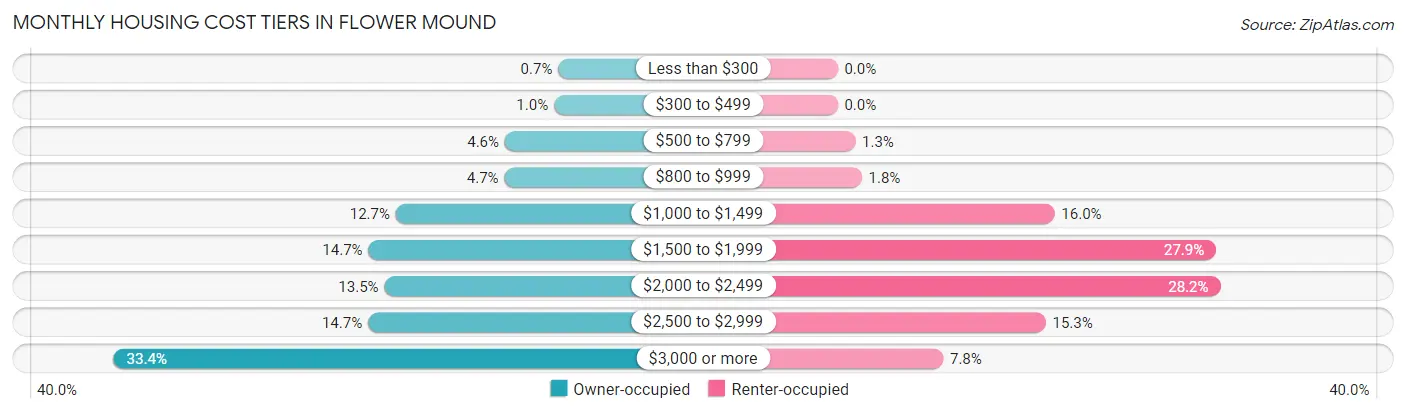
| Monthly Cost | Owner-occupied | Renter-occupied |
| Less than $300 | 157 (0.7%) | 0 (0.0%) |
| $300 to $499 | 227 (1.0%) | 0 (0.0%) |
| $500 to $799 | 1,037 (4.6%) | 60 (1.3%) |
| $800 to $999 | 1,044 (4.7%) | 82 (1.8%) |
| $1,000 to $1,499 | 2,836 (12.7%) | 737 (16.0%) |
| $1,500 to $1,999 | 3,290 (14.7%) | 1,286 (27.9%) |
| $2,000 to $2,499 | 3,025 (13.5%) | 1,301 (28.2%) |
| $2,500 to $2,999 | 3,296 (14.7%) | 707 (15.3%) |
| $3,000 or more | 7,492 (33.4%) | 359 (7.8%) |
| Total | 22,404 (100.0%) | 4,613 (100.0%) |
Physical Housing Characteristics in Flower Mound
Housing Structures in Flower Mound
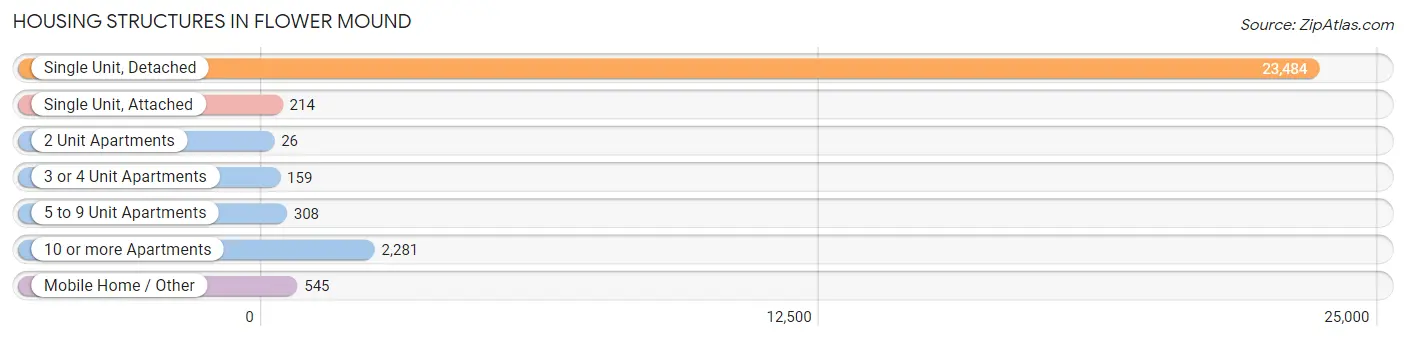
| Structure Type | # Housing Units | % Housing Units |
| Single Unit, Detached | 23,484 | 86.9% |
| Single Unit, Attached | 214 | 0.8% |
| 2 Unit Apartments | 26 | 0.1% |
| 3 or 4 Unit Apartments | 159 | 0.6% |
| 5 to 9 Unit Apartments | 308 | 1.1% |
| 10 or more Apartments | 2,281 | 8.4% |
| Mobile Home / Other | 545 | 2.0% |
| Total | 27,017 | 100.0% |
Housing Structures by Occupancy in Flower Mound
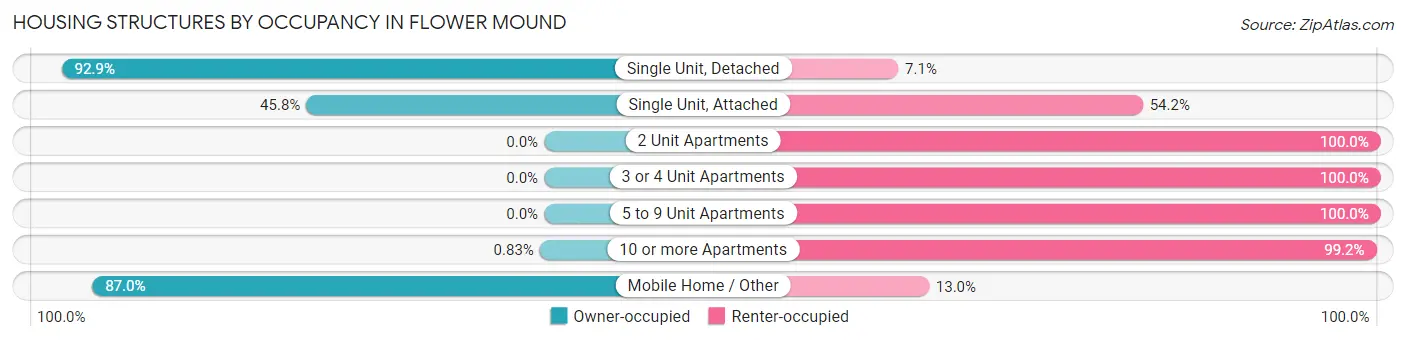
| Structure Type | Owner-occupied | Renter-occupied |
| Single Unit, Detached | 21,813 (92.9%) | 1,671 (7.1%) |
| Single Unit, Attached | 98 (45.8%) | 116 (54.2%) |
| 2 Unit Apartments | 0 (0.0%) | 26 (100.0%) |
| 3 or 4 Unit Apartments | 0 (0.0%) | 159 (100.0%) |
| 5 to 9 Unit Apartments | 0 (0.0%) | 308 (100.0%) |
| 10 or more Apartments | 19 (0.8%) | 2,262 (99.2%) |
| Mobile Home / Other | 474 (87.0%) | 71 (13.0%) |
| Total | 22,404 (82.9%) | 4,613 (17.1%) |
Housing Structures by Number of Rooms in Flower Mound
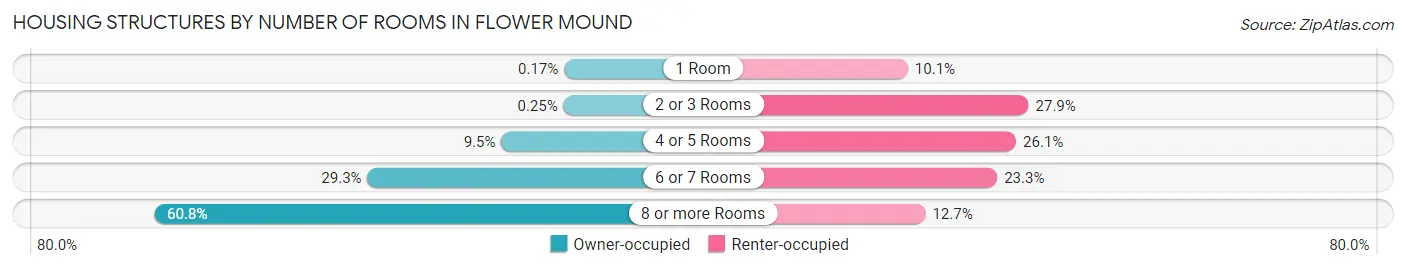
| Number of Rooms | Owner-occupied | Renter-occupied |
| 1 Room | 39 (0.2%) | 464 (10.1%) |
| 2 or 3 Rooms | 57 (0.3%) | 1,288 (27.9%) |
| 4 or 5 Rooms | 2,120 (9.5%) | 1,203 (26.1%) |
| 6 or 7 Rooms | 6,557 (29.3%) | 1,074 (23.3%) |
| 8 or more Rooms | 13,631 (60.8%) | 584 (12.7%) |
| Total | 22,404 (100.0%) | 4,613 (100.0%) |
Housing Structure by Heating Type in Flower Mound
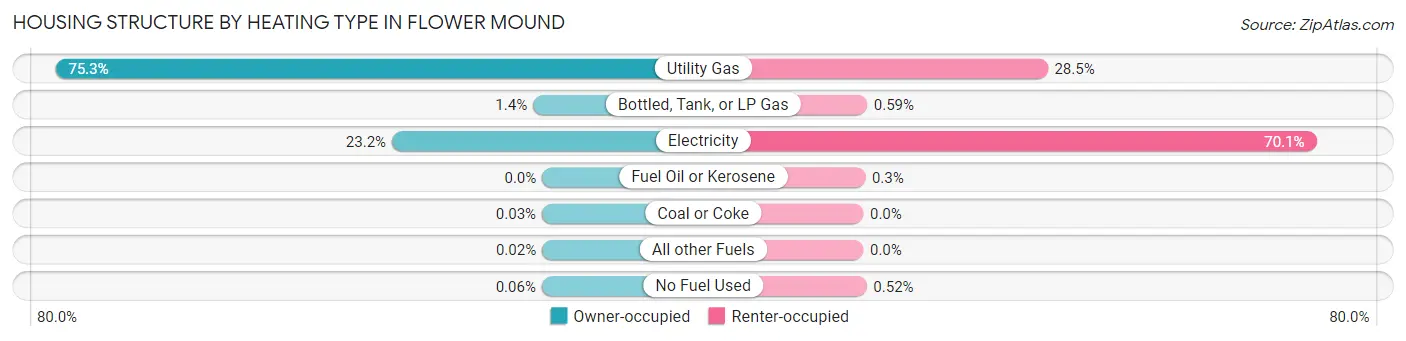
| Heating Type | Owner-occupied | Renter-occupied |
| Utility Gas | 16,860 (75.2%) | 1,315 (28.5%) |
| Bottled, Tank, or LP Gas | 315 (1.4%) | 27 (0.6%) |
| Electricity | 5,203 (23.2%) | 3,233 (70.1%) |
| Fuel Oil or Kerosene | 0 (0.0%) | 14 (0.3%) |
| Coal or Coke | 7 (0.0%) | 0 (0.0%) |
| All other Fuels | 5 (0.0%) | 0 (0.0%) |
| No Fuel Used | 14 (0.1%) | 24 (0.5%) |
| Total | 22,404 (100.0%) | 4,613 (100.0%) |
Household Vehicle Usage in Flower Mound
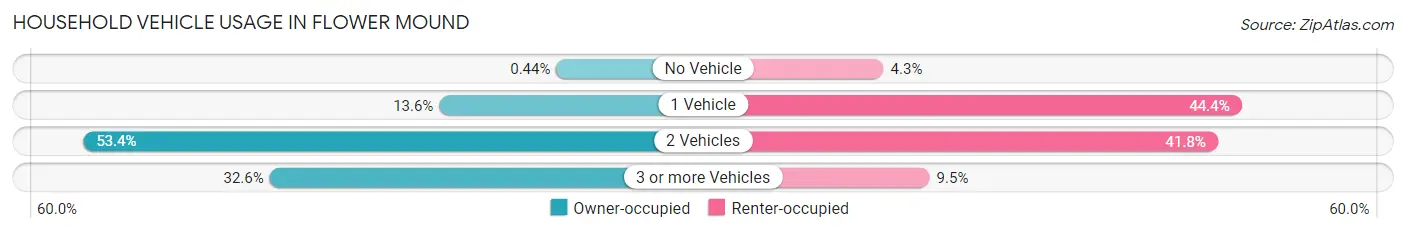
| Vehicles per Household | Owner-occupied | Renter-occupied |
| No Vehicle | 99 (0.4%) | 200 (4.3%) |
| 1 Vehicle | 3,039 (13.6%) | 2,049 (44.4%) |
| 2 Vehicles | 11,971 (53.4%) | 1,926 (41.7%) |
| 3 or more Vehicles | 7,295 (32.6%) | 438 (9.5%) |
| Total | 22,404 (100.0%) | 4,613 (100.0%) |
Real Estate & Mortgages in Flower Mound
Real Estate and Mortgage Overview in Flower Mound
| Characteristic | Without Mortgage | With Mortgage |
| Housing Units | 6,182 | 16,222 |
| Median Property Value | $457,300 | $470,800 |
| Median Household Income | $126,038 | $10,440 |
| Monthly Housing Costs | $1,151 | $7,277 |
| Real Estate Taxes | $7,194 | $52 |
Property Value by Mortgage Status in Flower Mound
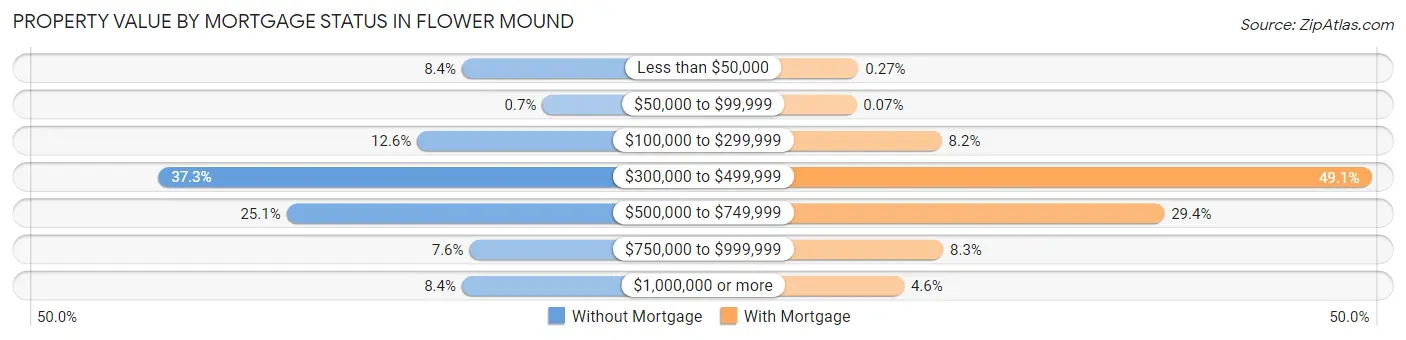
| Property Value | Without Mortgage | With Mortgage |
| Less than $50,000 | 517 (8.4%) | 43 (0.3%) |
| $50,000 to $99,999 | 43 (0.7%) | 12 (0.1%) |
| $100,000 to $299,999 | 780 (12.6%) | 1,330 (8.2%) |
| $300,000 to $499,999 | 2,304 (37.3%) | 7,966 (49.1%) |
| $500,000 to $749,999 | 1,549 (25.1%) | 4,770 (29.4%) |
| $750,000 to $999,999 | 472 (7.6%) | 1,353 (8.3%) |
| $1,000,000 or more | 517 (8.4%) | 748 (4.6%) |
| Total | 6,182 (100.0%) | 16,222 (100.0%) |
Household Income by Mortgage Status in Flower Mound
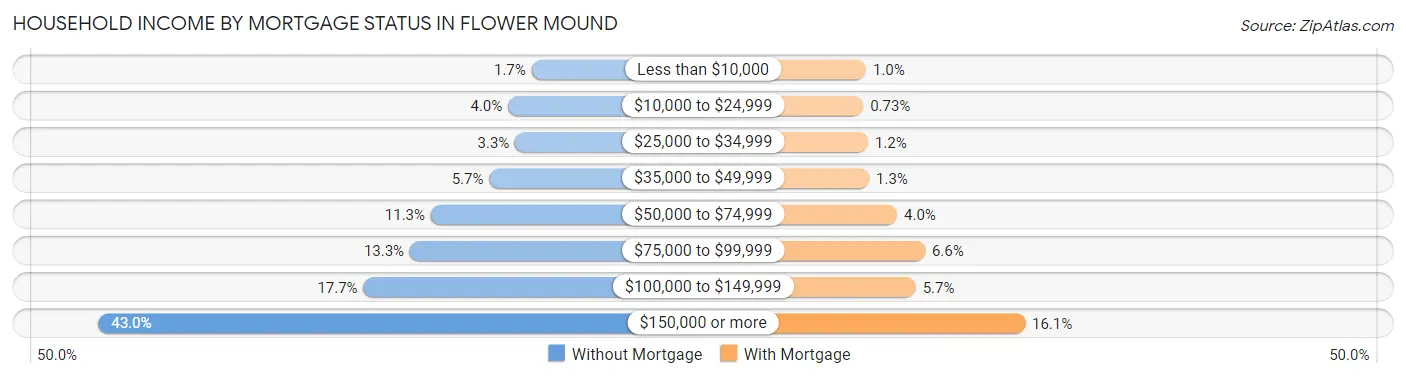
| Household Income | Without Mortgage | With Mortgage |
| Less than $10,000 | 106 (1.7%) | 163 (1.0%) |
| $10,000 to $24,999 | 244 (4.0%) | 118 (0.7%) |
| $25,000 to $34,999 | 203 (3.3%) | 192 (1.2%) |
| $35,000 to $49,999 | 355 (5.7%) | 209 (1.3%) |
| $50,000 to $74,999 | 699 (11.3%) | 643 (4.0%) |
| $75,000 to $99,999 | 822 (13.3%) | 1,072 (6.6%) |
| $100,000 to $149,999 | 1,096 (17.7%) | 930 (5.7%) |
| $150,000 or more | 2,657 (43.0%) | 2,618 (16.1%) |
| Total | 6,182 (100.0%) | 16,222 (100.0%) |
Property Value to Household Income Ratio in Flower Mound
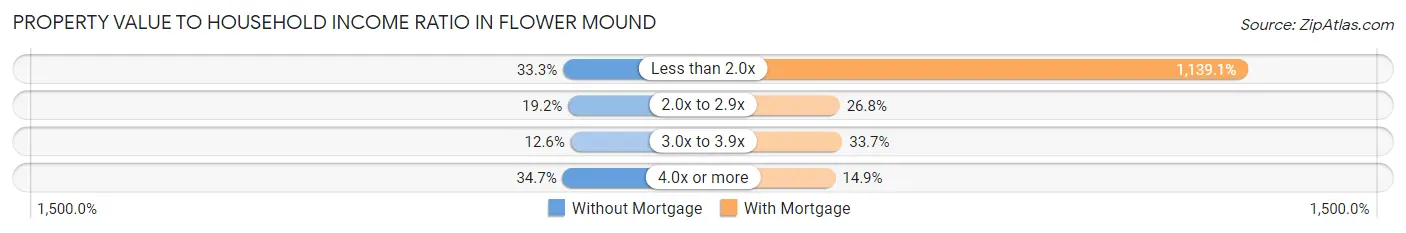
| Value-to-Income Ratio | Without Mortgage | With Mortgage |
| Less than 2.0x | 2,059 (33.3%) | 184,776 (1,139.0%) |
| 2.0x to 2.9x | 1,188 (19.2%) | 4,342 (26.8%) |
| 3.0x to 3.9x | 781 (12.6%) | 5,469 (33.7%) |
| 4.0x or more | 2,144 (34.7%) | 2,416 (14.9%) |
| Total | 6,182 (100.0%) | 16,222 (100.0%) |
Real Estate Taxes by Mortgage Status in Flower Mound
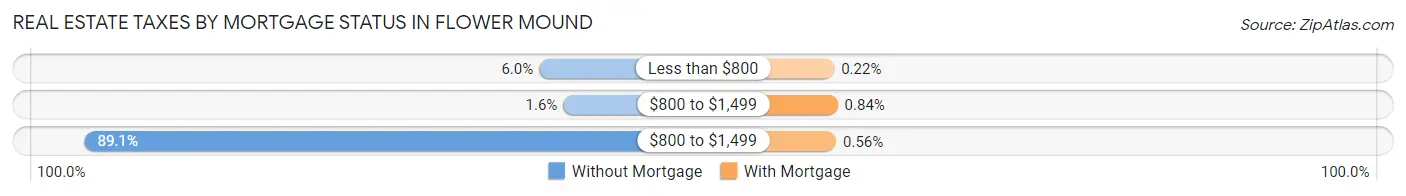
| Property Taxes | Without Mortgage | With Mortgage |
| Less than $800 | 373 (6.0%) | 36 (0.2%) |
| $800 to $1,499 | 101 (1.6%) | 137 (0.8%) |
| $800 to $1,499 | 5,505 (89.0%) | 91 (0.6%) |
| Total | 6,182 (100.0%) | 16,222 (100.0%) |
Health & Disability in Flower Mound
Health Insurance Coverage by Age in Flower Mound
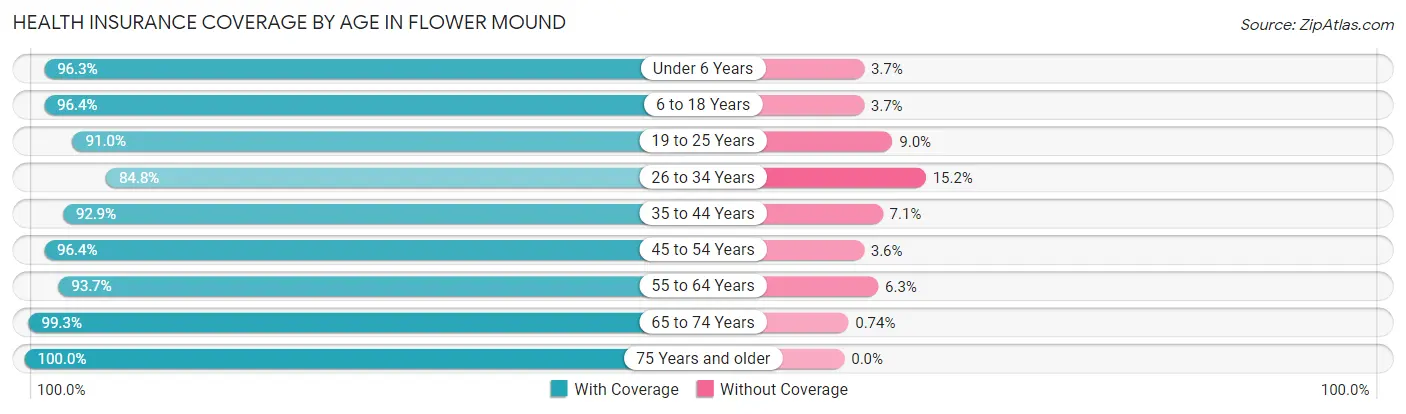
| Age Bracket | With Coverage | Without Coverage |
| Under 6 Years | 4,381 (96.3%) | 167 (3.7%) |
| 6 to 18 Years | 15,884 (96.4%) | 601 (3.6%) |
| 19 to 25 Years | 4,187 (91.0%) | 412 (9.0%) |
| 26 to 34 Years | 4,548 (84.8%) | 814 (15.2%) |
| 35 to 44 Years | 9,882 (92.9%) | 760 (7.1%) |
| 45 to 54 Years | 13,241 (96.4%) | 499 (3.6%) |
| 55 to 64 Years | 11,458 (93.7%) | 771 (6.3%) |
| 65 to 74 Years | 6,077 (99.3%) | 45 (0.7%) |
| 75 Years and older | 2,731 (100.0%) | 0 (0.0%) |
| Total | 72,389 (94.7%) | 4,069 (5.3%) |
Health Insurance Coverage by Citizenship Status in Flower Mound
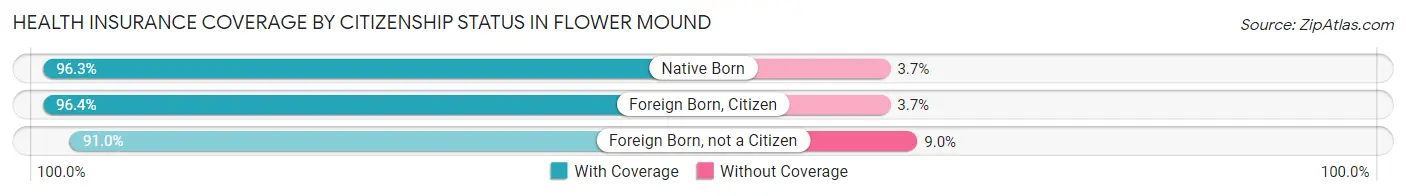
| Citizenship Status | With Coverage | Without Coverage |
| Native Born | 4,381 (96.3%) | 167 (3.7%) |
| Foreign Born, Citizen | 15,884 (96.4%) | 601 (3.6%) |
| Foreign Born, not a Citizen | 4,187 (91.0%) | 412 (9.0%) |
Health Insurance Coverage by Household Income in Flower Mound
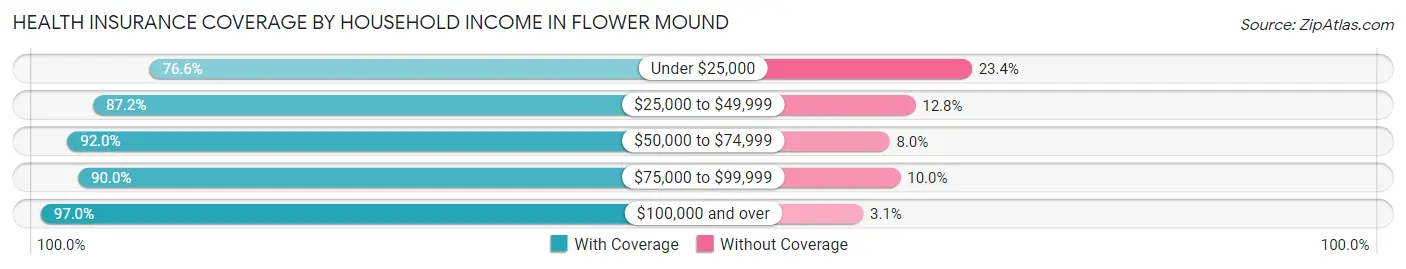
| Household Income | With Coverage | Without Coverage |
| Under $25,000 | 2,439 (76.6%) | 745 (23.4%) |
| $25,000 to $49,999 | 3,024 (87.2%) | 445 (12.8%) |
| $50,000 to $74,999 | 4,788 (92.0%) | 417 (8.0%) |
| $75,000 to $99,999 | 6,024 (90.0%) | 671 (10.0%) |
| $100,000 and over | 56,072 (97.0%) | 1,765 (3.0%) |
Public vs Private Health Insurance Coverage by Age in Flower Mound
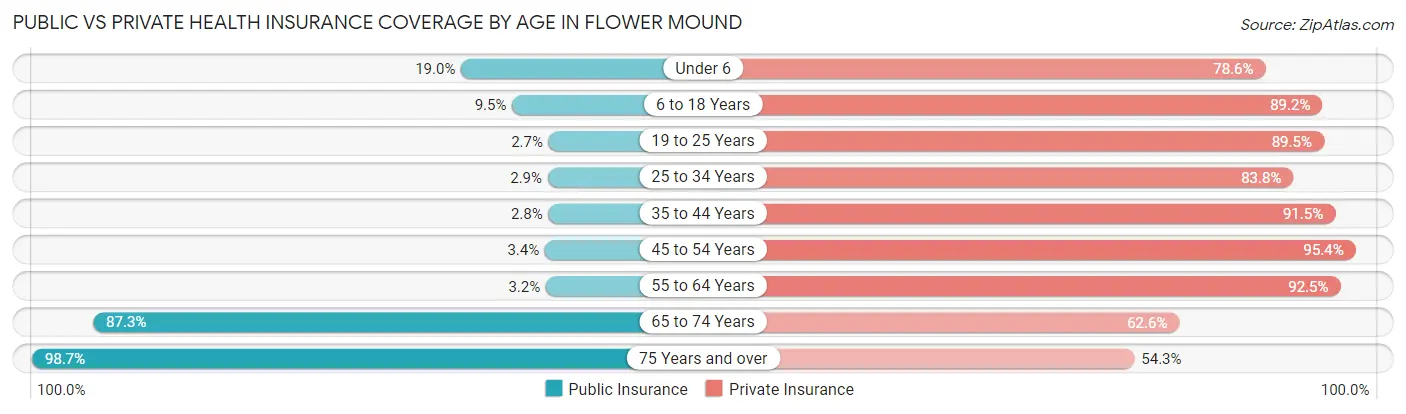
| Age Bracket | Public Insurance | Private Insurance |
| Under 6 | 862 (19.0%) | 3,575 (78.6%) |
| 6 to 18 Years | 1,561 (9.5%) | 14,699 (89.2%) |
| 19 to 25 Years | 124 (2.7%) | 4,114 (89.4%) |
| 25 to 34 Years | 154 (2.9%) | 4,493 (83.8%) |
| 35 to 44 Years | 293 (2.8%) | 9,742 (91.5%) |
| 45 to 54 Years | 467 (3.4%) | 13,102 (95.4%) |
| 55 to 64 Years | 392 (3.2%) | 11,315 (92.5%) |
| 65 to 74 Years | 5,343 (87.3%) | 3,834 (62.6%) |
| 75 Years and over | 2,694 (98.7%) | 1,483 (54.3%) |
| Total | 11,890 (15.5%) | 66,357 (86.8%) |
Disability Status by Sex by Age in Flower Mound

| Age Bracket | Male | Female |
| Under 5 Years | 0 (0.0%) | 0 (0.0%) |
| 5 to 17 Years | 351 (4.2%) | 277 (3.5%) |
| 18 to 34 Years | 231 (3.8%) | 205 (4.2%) |
| 35 to 64 Years | 1,101 (5.9%) | 829 (4.6%) |
| 65 to 74 Years | 462 (15.9%) | 655 (20.3%) |
| 75 Years and over | 339 (30.8%) | 610 (37.4%) |
Disability Class by Sex by Age in Flower Mound
Disability Class: Hearing Difficulty
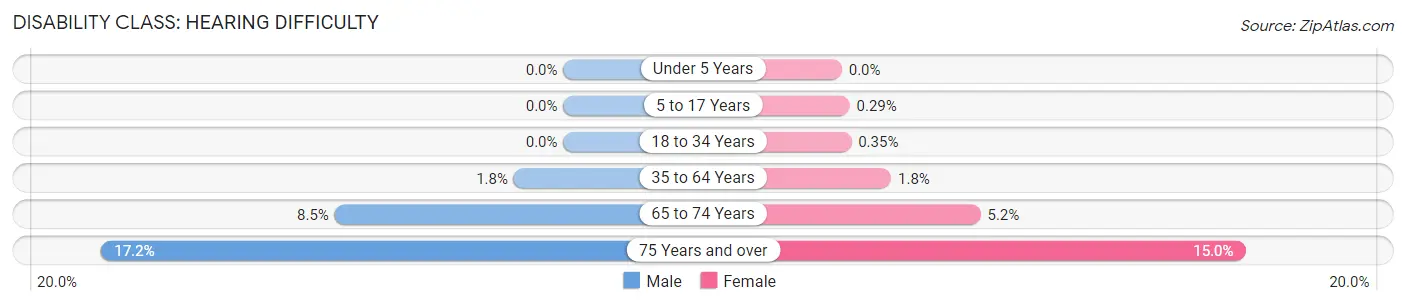
| Age Bracket | Male | Female |
| Under 5 Years | 0 (0.0%) | 0 (0.0%) |
| 5 to 17 Years | 0 (0.0%) | 23 (0.3%) |
| 18 to 34 Years | 0 (0.0%) | 17 (0.4%) |
| 35 to 64 Years | 342 (1.8%) | 329 (1.8%) |
| 65 to 74 Years | 246 (8.5%) | 166 (5.1%) |
| 75 Years and over | 189 (17.2%) | 244 (15.0%) |
Disability Class: Vision Difficulty
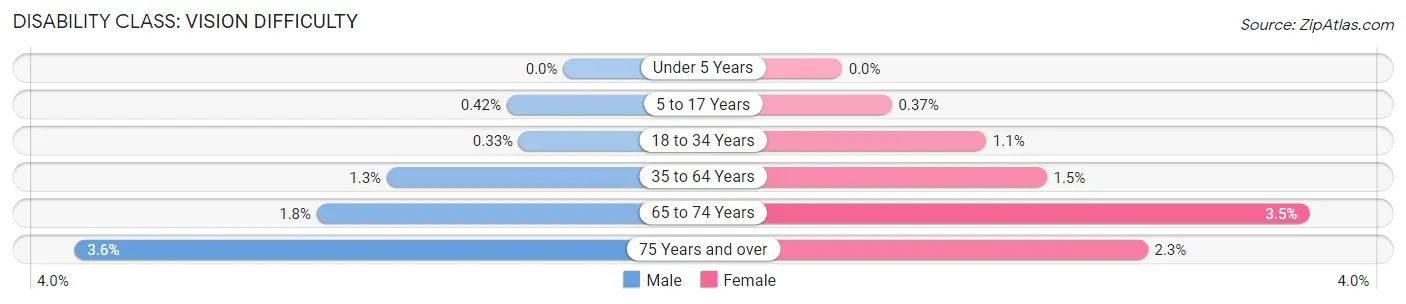
| Age Bracket | Male | Female |
| Under 5 Years | 0 (0.0%) | 0 (0.0%) |
| 5 to 17 Years | 35 (0.4%) | 30 (0.4%) |
| 18 to 34 Years | 20 (0.3%) | 52 (1.1%) |
| 35 to 64 Years | 243 (1.3%) | 273 (1.5%) |
| 65 to 74 Years | 53 (1.8%) | 112 (3.5%) |
| 75 Years and over | 40 (3.6%) | 37 (2.3%) |
Disability Class: Cognitive Difficulty
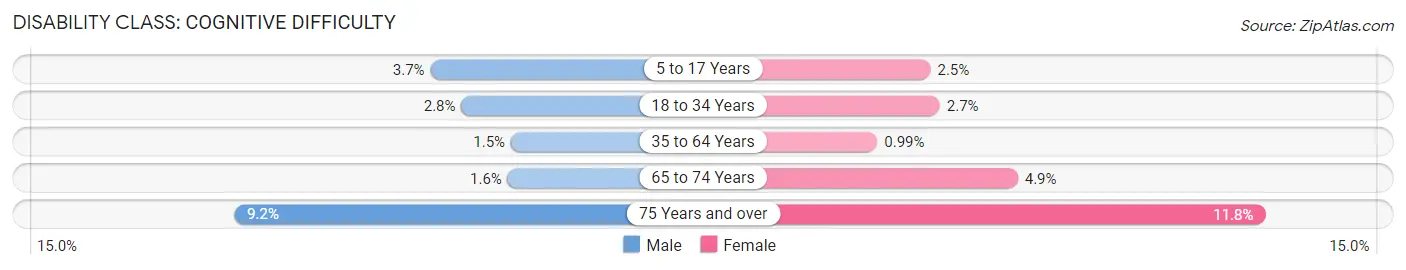
| Age Bracket | Male | Female |
| 5 to 17 Years | 310 (3.7%) | 198 (2.5%) |
| 18 to 34 Years | 171 (2.8%) | 133 (2.7%) |
| 35 to 64 Years | 271 (1.5%) | 178 (1.0%) |
| 65 to 74 Years | 45 (1.5%) | 158 (4.9%) |
| 75 Years and over | 101 (9.2%) | 192 (11.8%) |
Disability Class: Ambulatory Difficulty
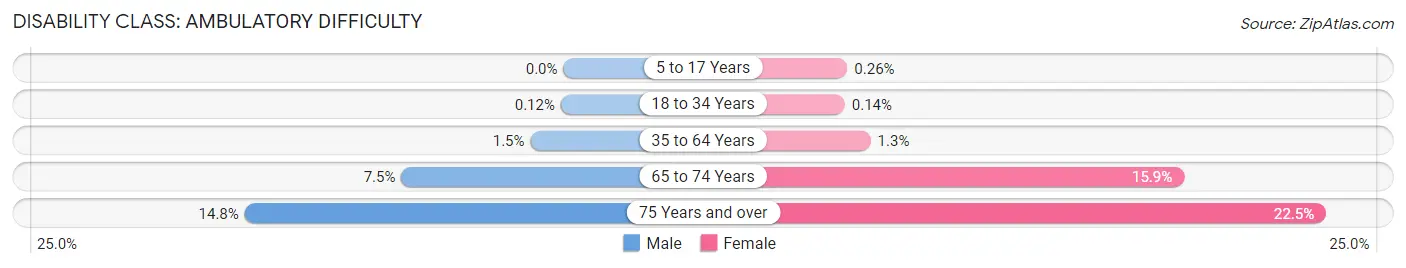
| Age Bracket | Male | Female |
| 5 to 17 Years | 0 (0.0%) | 21 (0.3%) |
| 18 to 34 Years | 7 (0.1%) | 7 (0.1%) |
| 35 to 64 Years | 285 (1.5%) | 241 (1.3%) |
| 65 to 74 Years | 218 (7.5%) | 512 (15.9%) |
| 75 Years and over | 163 (14.8%) | 366 (22.5%) |
Disability Class: Self-Care Difficulty
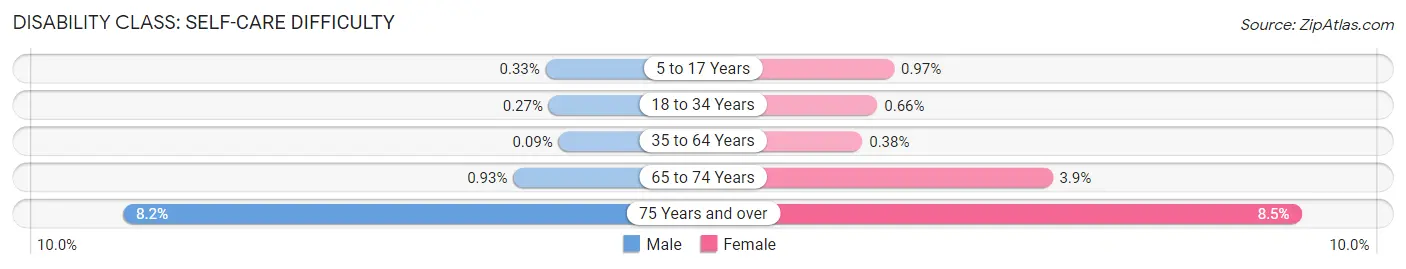
| Age Bracket | Male | Female |
| 5 to 17 Years | 28 (0.3%) | 78 (1.0%) |
| 18 to 34 Years | 16 (0.3%) | 32 (0.7%) |
| 35 to 64 Years | 16 (0.1%) | 68 (0.4%) |
| 65 to 74 Years | 27 (0.9%) | 126 (3.9%) |
| 75 Years and over | 90 (8.2%) | 139 (8.5%) |
Technology Access in Flower Mound
Computing Device Access in Flower Mound
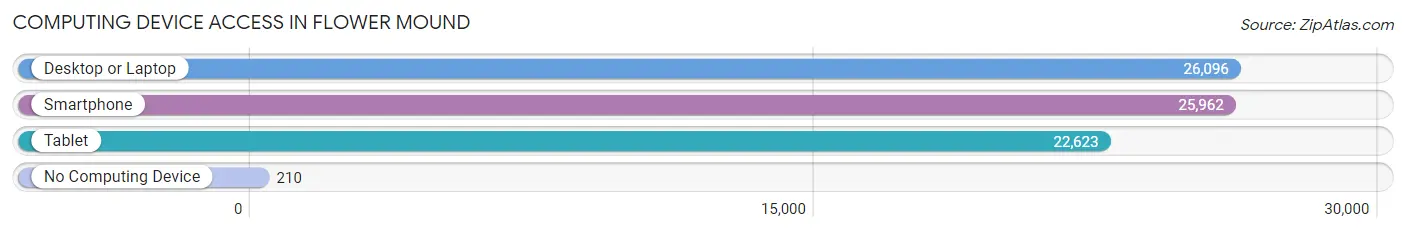
| Device Type | # Households | % Households |
| Desktop or Laptop | 26,096 | 96.6% |
| Smartphone | 25,962 | 96.1% |
| Tablet | 22,623 | 83.7% |
| No Computing Device | 210 | 0.8% |
| Total | 27,017 | 100.0% |
Internet Access in Flower Mound
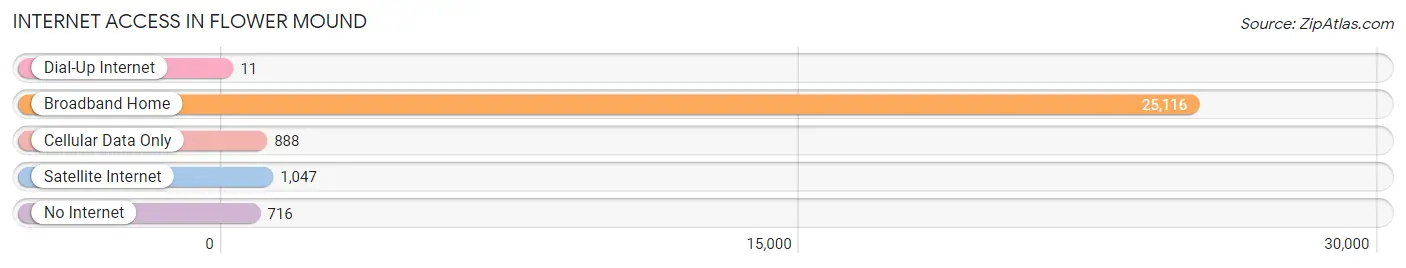
| Internet Type | # Households | % Households |
| Dial-Up Internet | 11 | 0.0% |
| Broadband Home | 25,116 | 93.0% |
| Cellular Data Only | 888 | 3.3% |
| Satellite Internet | 1,047 | 3.9% |
| No Internet | 716 | 2.6% |
| Total | 27,017 | 100.0% |
Flower Mound Summary
Flower Mound is a town located in Denton and Tarrant counties in the U.S. state of Texas. It is a suburb of Dallas and Fort Worth and is located in the Dallas-Fort Worth metroplex. As of the 2010 census, the town population was 64,669, making it the largest town in Denton County.
History
Flower Mound was first settled in the 1840s by settlers from Tennessee and Kentucky. The town was named for a 12.5-acre mound located in the center of town that was covered in wildflowers. The mound was used as a landmark by Native Americans and early settlers.
In the late 19th century, the town was a stop on the Texas and Pacific Railway. The town was incorporated in 1961 and has since grown rapidly.
Geography
Flower Mound is located at 33°04′N 97°06′W (33.07, -97.10). According to the United States Census Bureau, the town has a total area of 22.2 square miles (57.5 km2), of which 22.1 square miles (57.3 km2) is land and 0.1 square miles (0.2 km2) (0.45%) is water.
Economy
Flower Mound is home to a variety of businesses, including technology, healthcare, retail, and manufacturing. The town is home to several corporate headquarters, including J.C. Penney, Frito-Lay, and Dr Pepper Snapple Group.
Demographics
As of the 2010 census, there were 64,669 people, 22,845 households, and 18,845 families residing in the town. The population density was 2,919.2 people per square mile (1,127.3/km2). The racial makeup of the town was 79.2% White, 5.2% African American, 0.3% Native American, 8.2% Asian, 0.1% Pacific Islander, 4.2% from other races, and 2.9% from two or more races. Hispanic or Latino of any race were 11.2% of the population.
The median income for a household in the town was $95,837, and the median income for a family was $106,837. Males had a median income of $76,837 versus $50,837 for females. The per capita income for the town was $41,837. About 2.2% of families and 3.2% of the population were below the poverty line, including 3.2% of those under age 18 and 4.2% of those age 65 or over.
Common Questions
What is Per Capita Income in Flower Mound?
Per Capita income in Flower Mound is $65,910.
What is the Median Family Income in Flower Mound?
Median Family Income in Flower Mound is $175,242.
What is the Median Household income in Flower Mound?
Median Household Income in Flower Mound is $154,471.
What is Income or Wage Gap in Flower Mound?
Income or Wage Gap in Flower Mound is 45.2%.
Women in Flower Mound earn 54.8 cents for every dollar earned by a man.
What is Inequality or Gini Index in Flower Mound?
Inequality or Gini Index in Flower Mound is 0.40.
What is the Total Population of Flower Mound?
Total Population of Flower Mound is 76,630.
What is the Total Male Population of Flower Mound?
Total Male Population of Flower Mound is 39,215.
What is the Total Female Population of Flower Mound?
Total Female Population of Flower Mound is 37,415.
What is the Ratio of Males per 100 Females in Flower Mound?
There are 104.81 Males per 100 Females in Flower Mound.
What is the Ratio of Females per 100 Males in Flower Mound?
There are 95.41 Females per 100 Males in Flower Mound.
What is the Median Population Age in Flower Mound?
Median Population Age in Flower Mound is 42.6 Years.
What is the Average Family Size in Flower Mound
Average Family Size in Flower Mound is 3.2 People.
What is the Average Household Size in Flower Mound
Average Household Size in Flower Mound is 2.8 People.
How Large is the Labor Force in Flower Mound?
There are 42,276 People in the Labor Forcein in Flower Mound.
What is the Percentage of People in the Labor Force in Flower Mound?
71.0% of People are in the Labor Force in Flower Mound.
What is the Unemployment Rate in Flower Mound?
Unemployment Rate in Flower Mound is 3.9%.