Bartonville, TX Map & Demographics
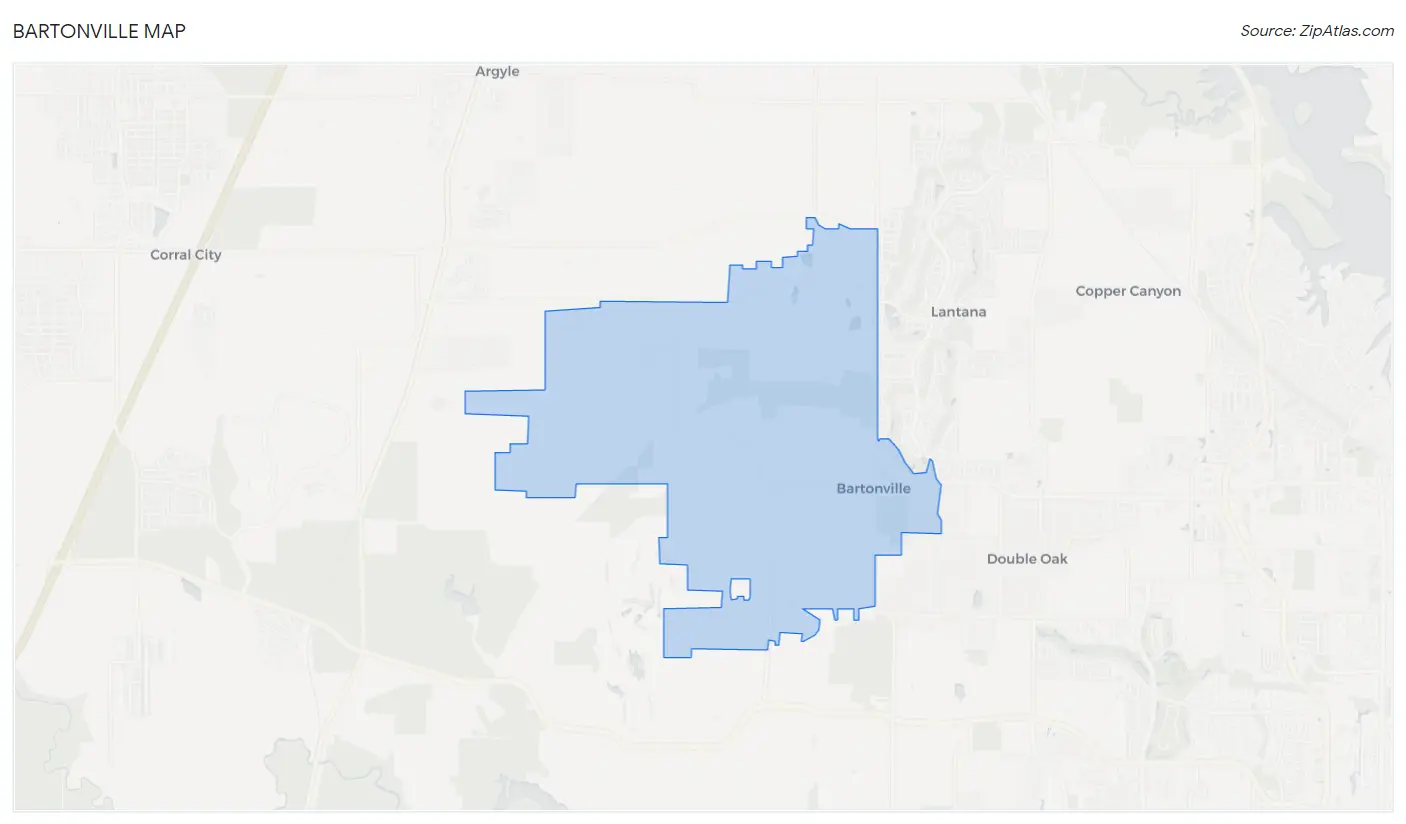
Bartonville Map
Bartonville Overview
$77,285
PER CAPITA INCOME
$171,250
AVG FAMILY INCOME
$143,333
AVG HOUSEHOLD INCOME
37.0%
WAGE / INCOME GAP [ % ]
63.0¢/ $1
WAGE / INCOME GAP [ $ ]
0.52
INEQUALITY / GINI INDEX
1,957
TOTAL POPULATION
925
MALE POPULATION
1,032
FEMALE POPULATION
89.63
MALES / 100 FEMALES
111.57
FEMALES / 100 MALES
46.7
MEDIAN AGE
3.2
AVG FAMILY SIZE
3.0
AVG HOUSEHOLD SIZE
898
LABOR FORCE [ PEOPLE ]
59.3%
PERCENT IN LABOR FORCE
2.4%
UNEMPLOYMENT RATE
Bartonville Area Codes
Income in Bartonville
Income Overview in Bartonville
Per Capita Income in Bartonville is $77,285, while median incomes of families and households are $171,250 and $143,333 respectively.
| Characteristic | Number | Measure |
| Per Capita Income | 1,957 | $77,285 |
| Median Family Income | 542 | $171,250 |
| Mean Family Income | 542 | $235,734 |
| Median Household Income | 664 | $143,333 |
| Mean Household Income | 664 | $218,089 |
| Income Deficit | 542 | $0 |
| Wage / Income Gap (%) | 1,957 | 37.05% |
| Wage / Income Gap ($) | 1,957 | 62.95¢ per $1 |
| Gini / Inequality Index | 1,957 | 0.52 |
Earnings by Sex in Bartonville
Average Earnings in Bartonville are $59,375, $80,833 for men and $50,885 for women, a difference of 37.0%.
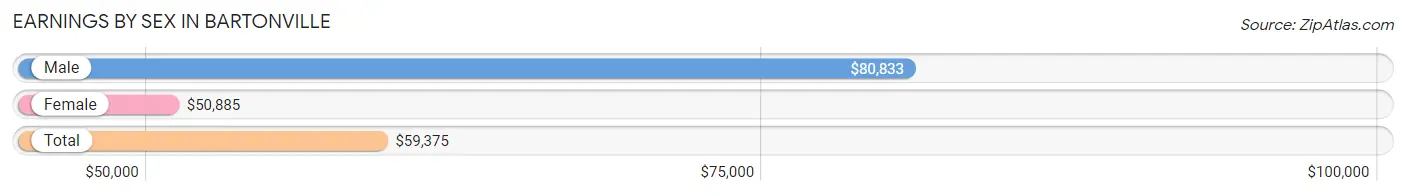
| Sex | Number | Average Earnings |
| Male | 558 (54.0%) | $80,833 |
| Female | 475 (46.0%) | $50,885 |
| Total | 1,033 (100.0%) | $59,375 |
Earnings by Sex by Income Bracket in Bartonville
The most common earnings brackets in Bartonville are $100,000+ for men (230 | 41.2%) and $100,000+ for women (126 | 26.5%).
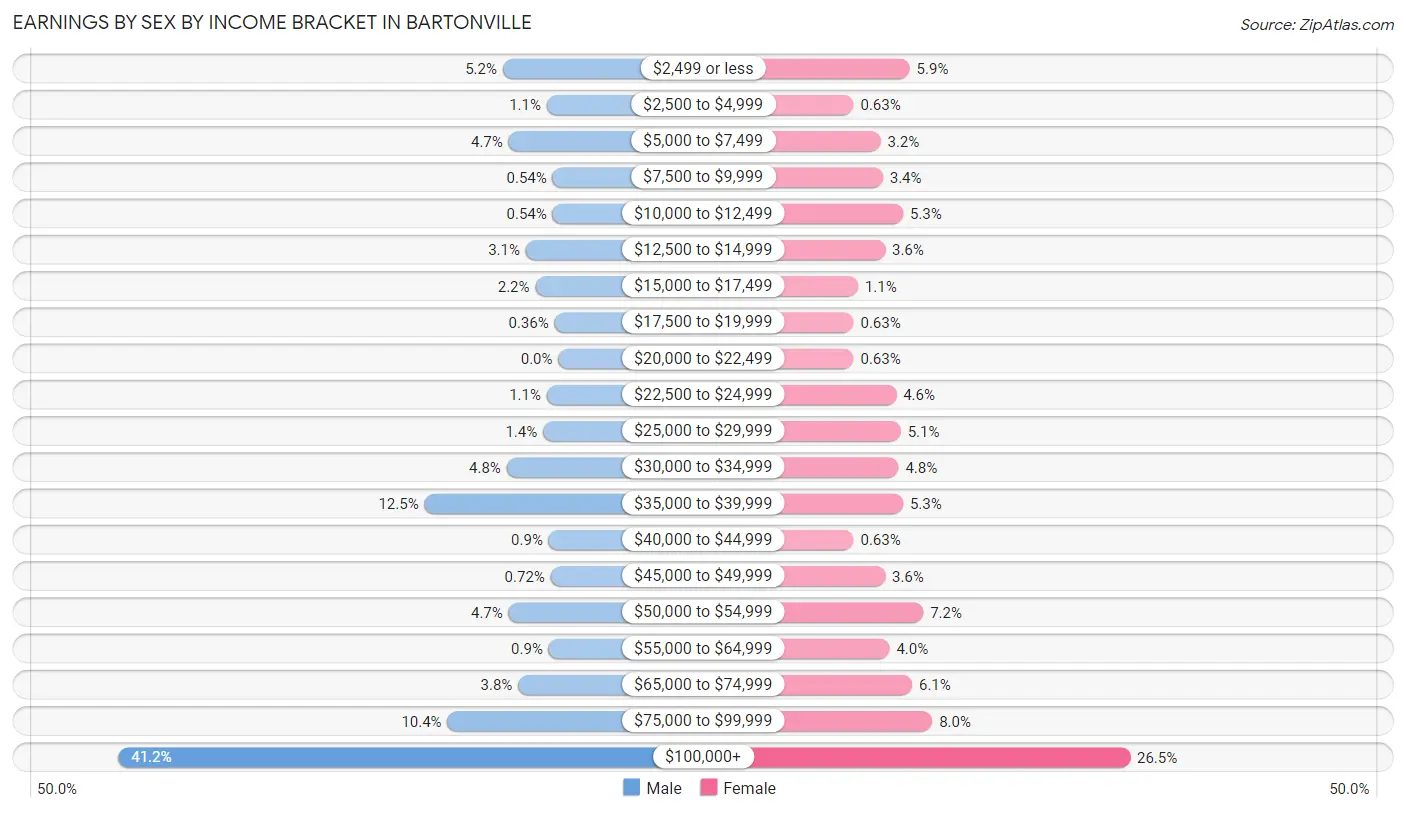
| Income | Male | Female |
| $2,499 or less | 29 (5.2%) | 28 (5.9%) |
| $2,500 to $4,999 | 6 (1.1%) | 3 (0.6%) |
| $5,000 to $7,499 | 26 (4.7%) | 15 (3.2%) |
| $7,500 to $9,999 | 3 (0.5%) | 16 (3.4%) |
| $10,000 to $12,499 | 3 (0.5%) | 25 (5.3%) |
| $12,500 to $14,999 | 17 (3.0%) | 17 (3.6%) |
| $15,000 to $17,499 | 12 (2.1%) | 5 (1.1%) |
| $17,500 to $19,999 | 2 (0.4%) | 3 (0.6%) |
| $20,000 to $22,499 | 0 (0.0%) | 3 (0.6%) |
| $22,500 to $24,999 | 6 (1.1%) | 22 (4.6%) |
| $25,000 to $29,999 | 8 (1.4%) | 24 (5.1%) |
| $30,000 to $34,999 | 27 (4.8%) | 23 (4.8%) |
| $35,000 to $39,999 | 70 (12.5%) | 25 (5.3%) |
| $40,000 to $44,999 | 5 (0.9%) | 3 (0.6%) |
| $45,000 to $49,999 | 4 (0.7%) | 17 (3.6%) |
| $50,000 to $54,999 | 26 (4.7%) | 34 (7.2%) |
| $55,000 to $64,999 | 5 (0.9%) | 19 (4.0%) |
| $65,000 to $74,999 | 21 (3.8%) | 29 (6.1%) |
| $75,000 to $99,999 | 58 (10.4%) | 38 (8.0%) |
| $100,000+ | 230 (41.2%) | 126 (26.5%) |
| Total | 558 (100.0%) | 475 (100.0%) |
Earnings by Sex by Educational Attainment in Bartonville
Average earnings in Bartonville are $84,917 for men and $54,250 for women, a difference of 36.1%. Men with an educational attainment of graduate degree enjoy the highest average annual earnings of $148,750, while those with less than high school education earn the least with $36,506. Women with an educational attainment of graduate degree earn the most with the average annual earnings of $73,654, while those with less than high school education have the smallest earnings of $25,625.
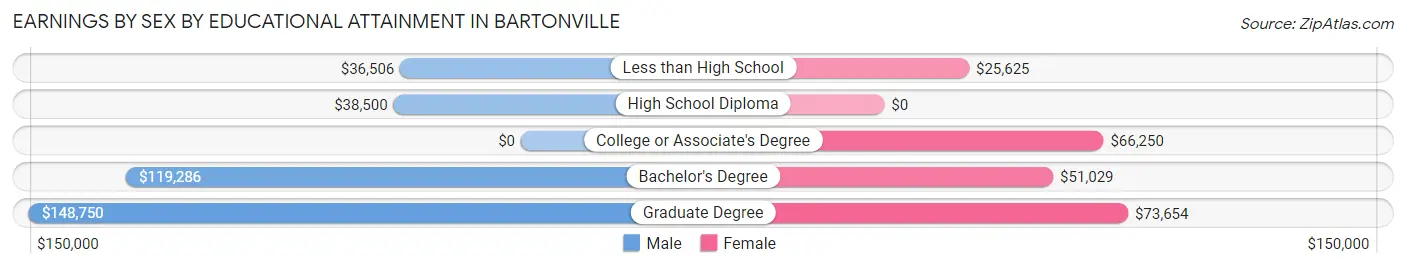
| Educational Attainment | Male Income | Female Income |
| Less than High School | $36,506 | $25,625 |
| High School Diploma | $38,500 | $0 |
| College or Associate's Degree | - | - |
| Bachelor's Degree | $119,286 | $51,029 |
| Graduate Degree | $148,750 | $73,654 |
| Total | $84,917 | $54,250 |
Family Income in Bartonville
Family Income Brackets in Bartonville
According to the Bartonville family income data, there are 217 families falling into the $200,000+ income range, which is the most common income bracket and makes up 40.0% of all families. Conversely, the $25,000 to $34,999 income bracket is the least frequent group with only 2 families (0.4%) belonging to this category.
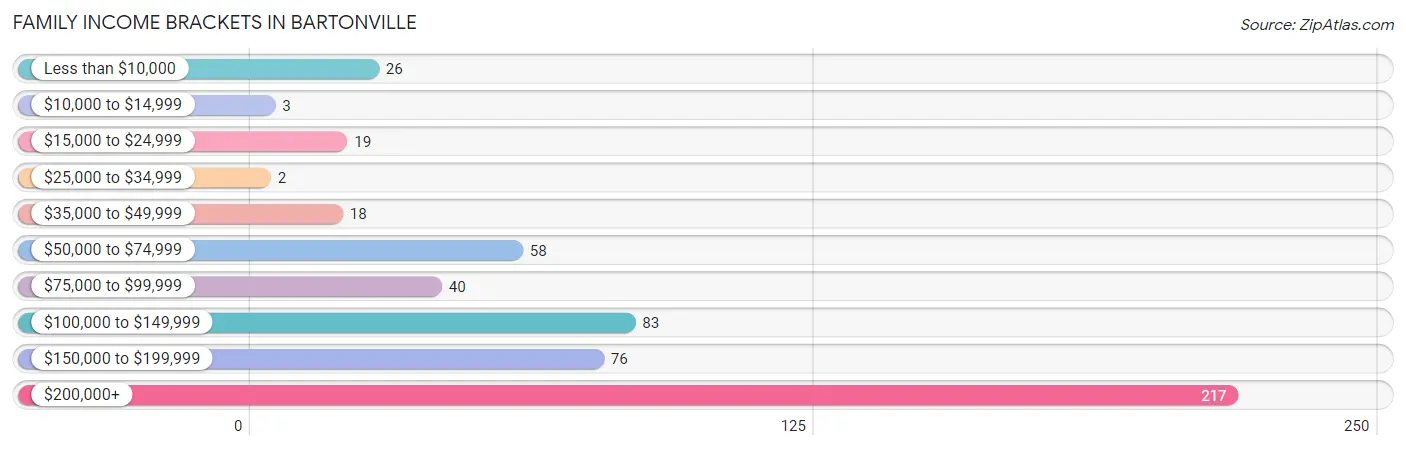
| Income Bracket | # Families | % Families |
| Less than $10,000 | 26 | 4.8% |
| $10,000 to $14,999 | 3 | 0.6% |
| $15,000 to $24,999 | 19 | 3.5% |
| $25,000 to $34,999 | 2 | 0.4% |
| $35,000 to $49,999 | 18 | 3.3% |
| $50,000 to $74,999 | 58 | 10.7% |
| $75,000 to $99,999 | 40 | 7.4% |
| $100,000 to $149,999 | 83 | 15.3% |
| $150,000 to $199,999 | 76 | 14.0% |
| $200,000+ | 217 | 40.0% |
Family Income by Famaliy Size in Bartonville
5-person families (62 | 11.4%) account for the highest median family income in Bartonville with $250,001 per family, while 4-person families (106 | 19.6%) have the highest median income of $59,844 per family member.
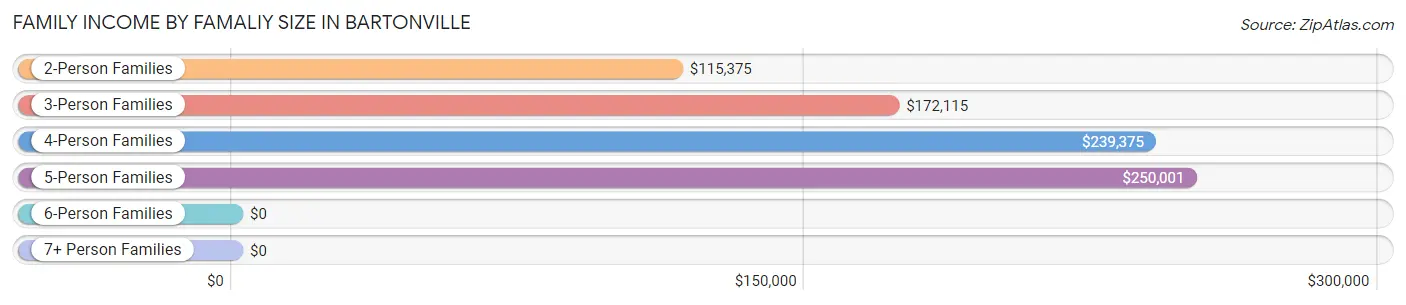
| Income Bracket | # Families | Median Income |
| 2-Person Families | 277 (51.1%) | $115,375 |
| 3-Person Families | 72 (13.3%) | $172,115 |
| 4-Person Families | 106 (19.6%) | $239,375 |
| 5-Person Families | 62 (11.4%) | $250,001 |
| 6-Person Families | 8 (1.5%) | $0 |
| 7+ Person Families | 17 (3.1%) | $0 |
| Total | 542 (100.0%) | $171,250 |
Family Income by Number of Earners in Bartonville
The median family income in Bartonville is $171,250, with families comprising 3+ earners (52) having the highest median family income of $226,250, while families with no earners (75) have the lowest median family income of $66,875, accounting for 9.6% and 13.8% of families, respectively.
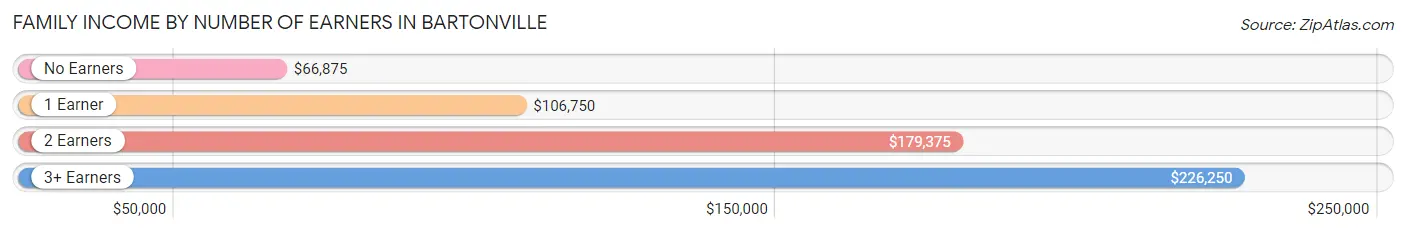
| Number of Earners | # Families | Median Income |
| No Earners | 75 (13.8%) | $66,875 |
| 1 Earner | 169 (31.2%) | $106,750 |
| 2 Earners | 246 (45.4%) | $179,375 |
| 3+ Earners | 52 (9.6%) | $226,250 |
| Total | 542 (100.0%) | $171,250 |
Household Income in Bartonville
Household Income Brackets in Bartonville
With 233 households falling in the category, the $200,000+ income range is the most frequent in Bartonville, accounting for 35.1% of all households. In contrast, only 4 households (0.6%) fall into the $10,000 to $14,999 income bracket, making it the least populous group.
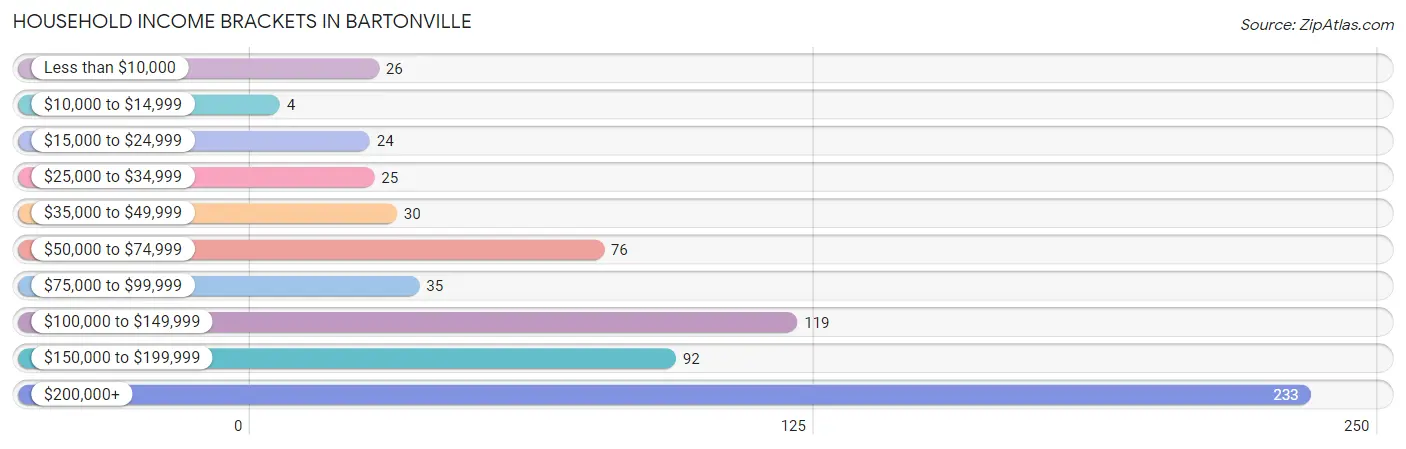
| Income Bracket | # Households | % Households |
| Less than $10,000 | 26 | 3.9% |
| $10,000 to $14,999 | 4 | 0.6% |
| $15,000 to $24,999 | 24 | 3.6% |
| $25,000 to $34,999 | 25 | 3.8% |
| $35,000 to $49,999 | 30 | 4.5% |
| $50,000 to $74,999 | 76 | 11.4% |
| $75,000 to $99,999 | 35 | 5.3% |
| $100,000 to $149,999 | 119 | 17.9% |
| $150,000 to $199,999 | 92 | 13.9% |
| $200,000+ | 233 | 35.1% |
Household Income by Householder Age in Bartonville
The median household income in Bartonville is $143,333, with the highest median household income of $173,750 found in the 45 to 64 years age bracket for the primary householder. A total of 358 households (53.9%) fall into this category. Meanwhile, the 15 to 24 years age bracket for the primary householder has the lowest median household income of $0, with 4 households (0.6%) in this group.
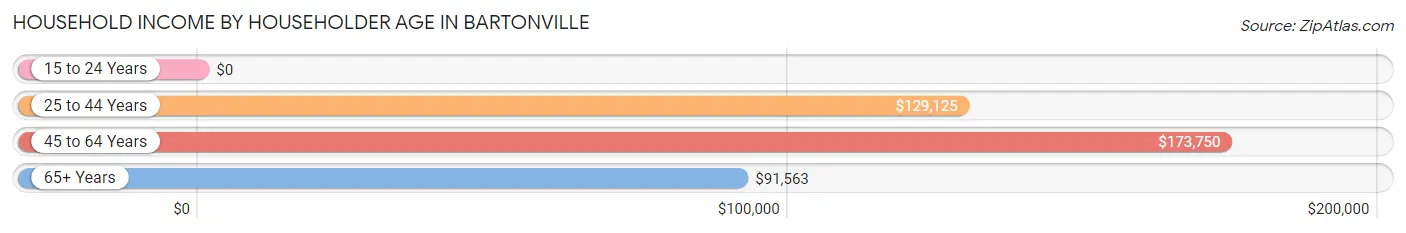
| Income Bracket | # Households | Median Income |
| 15 to 24 Years | 4 (0.6%) | $0 |
| 25 to 44 Years | 159 (23.9%) | $129,125 |
| 45 to 64 Years | 358 (53.9%) | $173,750 |
| 65+ Years | 143 (21.5%) | $91,563 |
| Total | 664 (100.0%) | $143,333 |
Poverty in Bartonville
Income Below Poverty by Sex and Age in Bartonville
With 5.0% poverty level for males and 7.2% for females among the residents of Bartonville, 45 to 54 year old males and 55 to 64 year old females are the most vulnerable to poverty, with 26 males (12.7%) and 42 females (20.2%) in their respective age groups living below the poverty level.
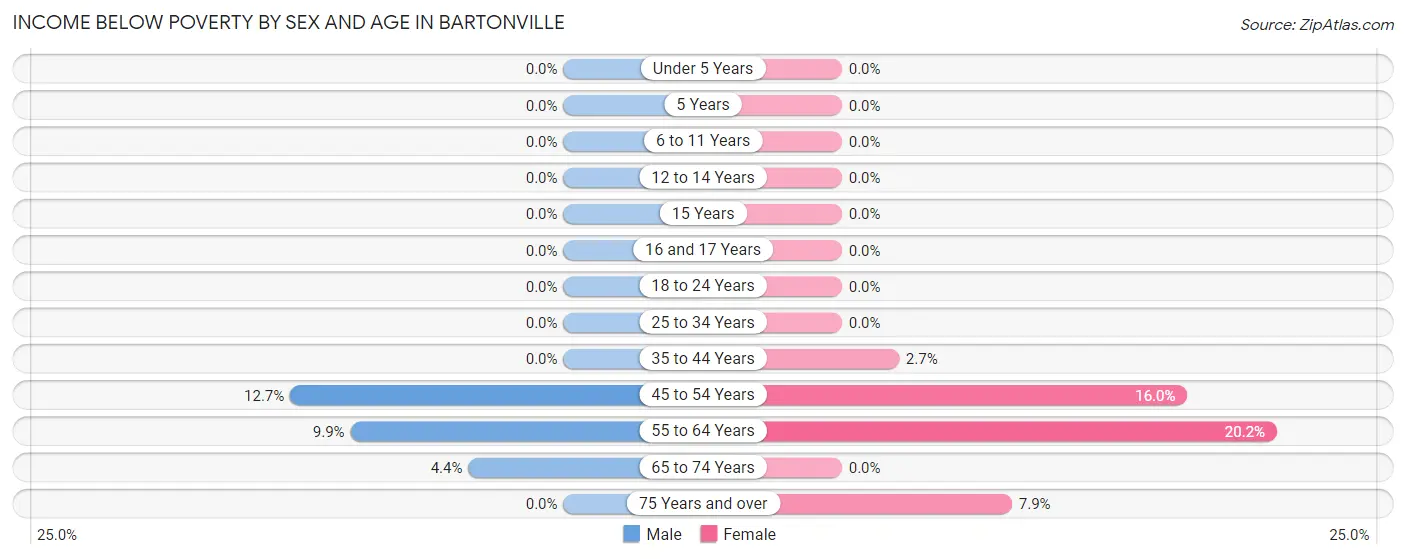
| Age Bracket | Male | Female |
| Under 5 Years | 0 (0.0%) | 0 (0.0%) |
| 5 Years | 0 (0.0%) | 0 (0.0%) |
| 6 to 11 Years | 0 (0.0%) | 0 (0.0%) |
| 12 to 14 Years | 0 (0.0%) | 0 (0.0%) |
| 15 Years | 0 (0.0%) | 0 (0.0%) |
| 16 and 17 Years | 0 (0.0%) | 0 (0.0%) |
| 18 to 24 Years | 0 (0.0%) | 0 (0.0%) |
| 25 to 34 Years | 0 (0.0%) | 0 (0.0%) |
| 35 to 44 Years | 0 (0.0%) | 4 (2.6%) |
| 45 to 54 Years | 26 (12.7%) | 25 (16.0%) |
| 55 to 64 Years | 17 (9.9%) | 42 (20.2%) |
| 65 to 74 Years | 3 (4.4%) | 0 (0.0%) |
| 75 Years and over | 0 (0.0%) | 3 (7.9%) |
| Total | 46 (5.0%) | 74 (7.2%) |
Income Above Poverty by Sex and Age in Bartonville
According to the poverty statistics in Bartonville, males aged under 5 years and females aged under 5 years are the age groups that are most secure financially, with 100.0% of males and 100.0% of females in these age groups living above the poverty line.
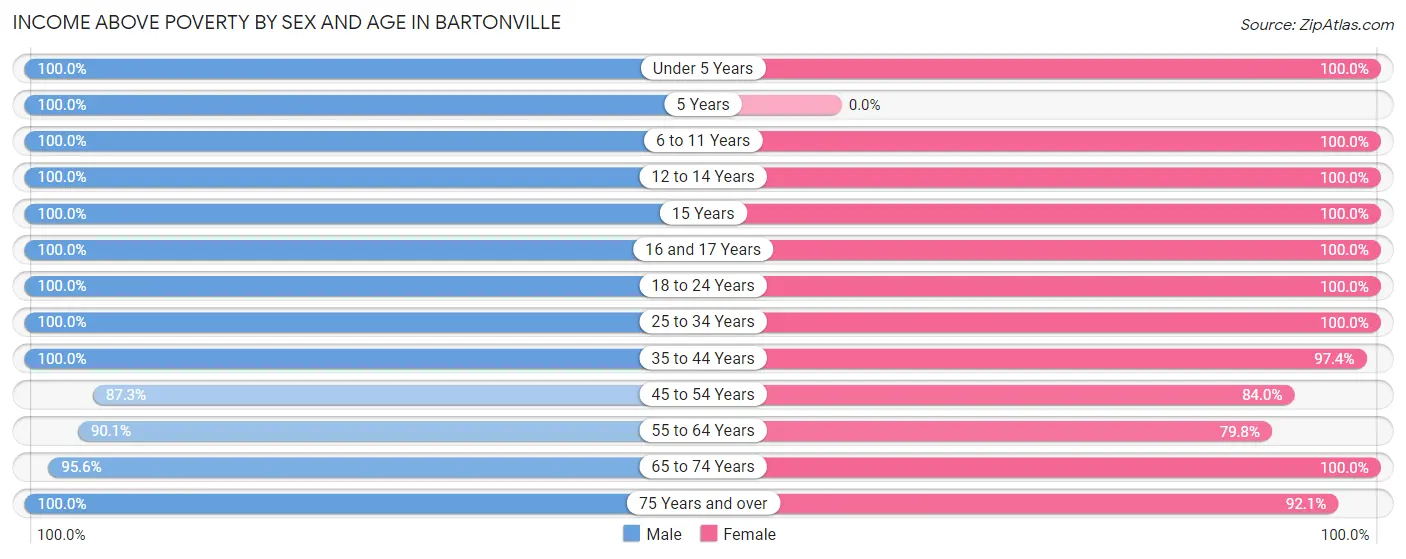
| Age Bracket | Male | Female |
| Under 5 Years | 65 (100.0%) | 84 (100.0%) |
| 5 Years | 13 (100.0%) | 0 (0.0%) |
| 6 to 11 Years | 41 (100.0%) | 105 (100.0%) |
| 12 to 14 Years | 55 (100.0%) | 24 (100.0%) |
| 15 Years | 28 (100.0%) | 27 (100.0%) |
| 16 and 17 Years | 40 (100.0%) | 36 (100.0%) |
| 18 to 24 Years | 20 (100.0%) | 61 (100.0%) |
| 25 to 34 Years | 28 (100.0%) | 47 (100.0%) |
| 35 to 44 Years | 132 (100.0%) | 147 (97.4%) |
| 45 to 54 Years | 179 (87.3%) | 131 (84.0%) |
| 55 to 64 Years | 155 (90.1%) | 166 (79.8%) |
| 65 to 74 Years | 65 (95.6%) | 95 (100.0%) |
| 75 Years and over | 58 (100.0%) | 35 (92.1%) |
| Total | 879 (95.0%) | 958 (92.8%) |
Income Below Poverty Among Married-Couple Families in Bartonville
The poverty statistics for married-couple families in Bartonville show that 9.0% or 45 of the total 501 families live below the poverty line. Families with no children have the highest poverty rate of 14.8%, comprising of 45 families. On the other hand, families with 1 or 2 children have the lowest poverty rate of 0.0%, which includes 0 families.
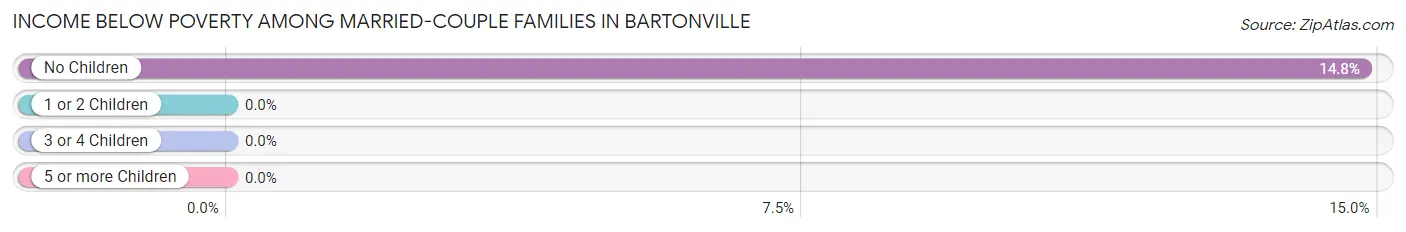
| Children | Above Poverty | Below Poverty |
| No Children | 259 (85.2%) | 45 (14.8%) |
| 1 or 2 Children | 126 (100.0%) | 0 (0.0%) |
| 3 or 4 Children | 58 (100.0%) | 0 (0.0%) |
| 5 or more Children | 13 (100.0%) | 0 (0.0%) |
| Total | 456 (91.0%) | 45 (9.0%) |
Income Below Poverty Among Single-Parent Households in Bartonville
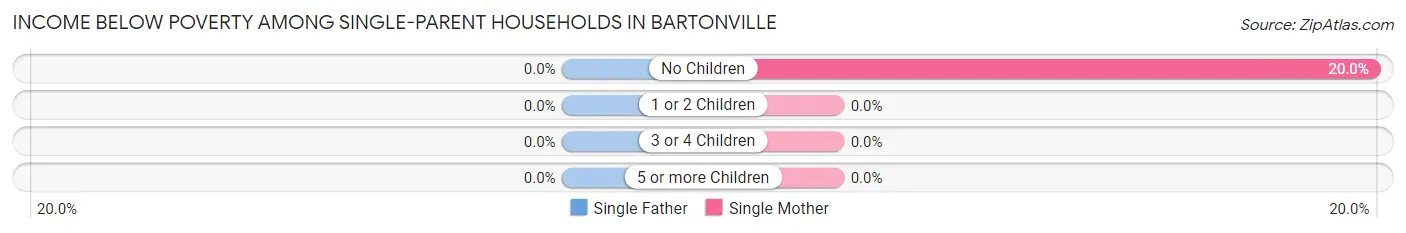
| Children | Single Father | Single Mother |
| No Children | 0 (0.0%) | 3 (20.0%) |
| 1 or 2 Children | 0 (0.0%) | 0 (0.0%) |
| 3 or 4 Children | 0 (0.0%) | 0 (0.0%) |
| 5 or more Children | 0 (0.0%) | 0 (0.0%) |
| Total | 0 (0.0%) | 3 (15.0%) |
Income Below Poverty Among Married-Couple vs Single-Parent Households in Bartonville
The poverty data for Bartonville shows that 45 of the married-couple family households (9.0%) and 3 of the single-parent households (7.3%) are living below the poverty level. Within the married-couple family households, those with no children have the highest poverty rate, with 45 households (14.8%) falling below the poverty line. Among the single-parent households, those with no children have the highest poverty rate, with 3 household (10.0%) living below poverty.
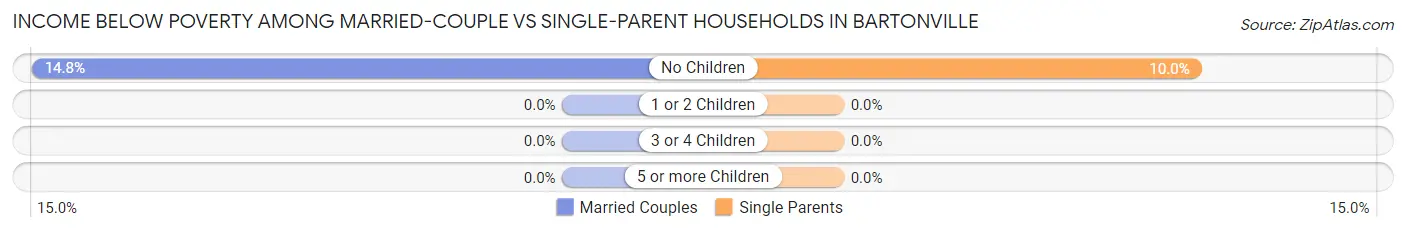
| Children | Married-Couple Families | Single-Parent Households |
| No Children | 45 (14.8%) | 3 (10.0%) |
| 1 or 2 Children | 0 (0.0%) | 0 (0.0%) |
| 3 or 4 Children | 0 (0.0%) | 0 (0.0%) |
| 5 or more Children | 0 (0.0%) | 0 (0.0%) |
| Total | 45 (9.0%) | 3 (7.3%) |
Race in Bartonville
The most populous races in Bartonville are White / Caucasian (1,644 | 84.0%), Hispanic or Latino (256 | 13.1%), and Two or more Races (251 | 12.8%).
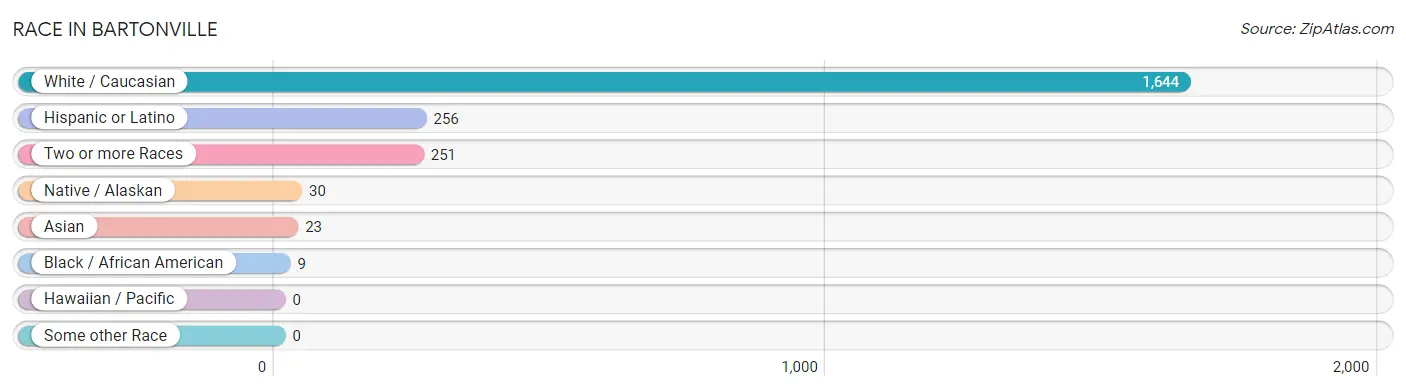
| Race | # Population | % Population |
| Asian | 23 | 1.2% |
| Black / African American | 9 | 0.5% |
| Hawaiian / Pacific | 0 | 0.0% |
| Hispanic or Latino | 256 | 13.1% |
| Native / Alaskan | 30 | 1.5% |
| White / Caucasian | 1,644 | 84.0% |
| Two or more Races | 251 | 12.8% |
| Some other Race | 0 | 0.0% |
| Total | 1,957 | 100.0% |
Ancestry in Bartonville
The most populous ancestries reported in Bartonville are German (348 | 17.8%), English (327 | 16.7%), Mexican (245 | 12.5%), Irish (231 | 11.8%), and Swedish (85 | 4.3%), together accounting for 63.1% of all Bartonville residents.
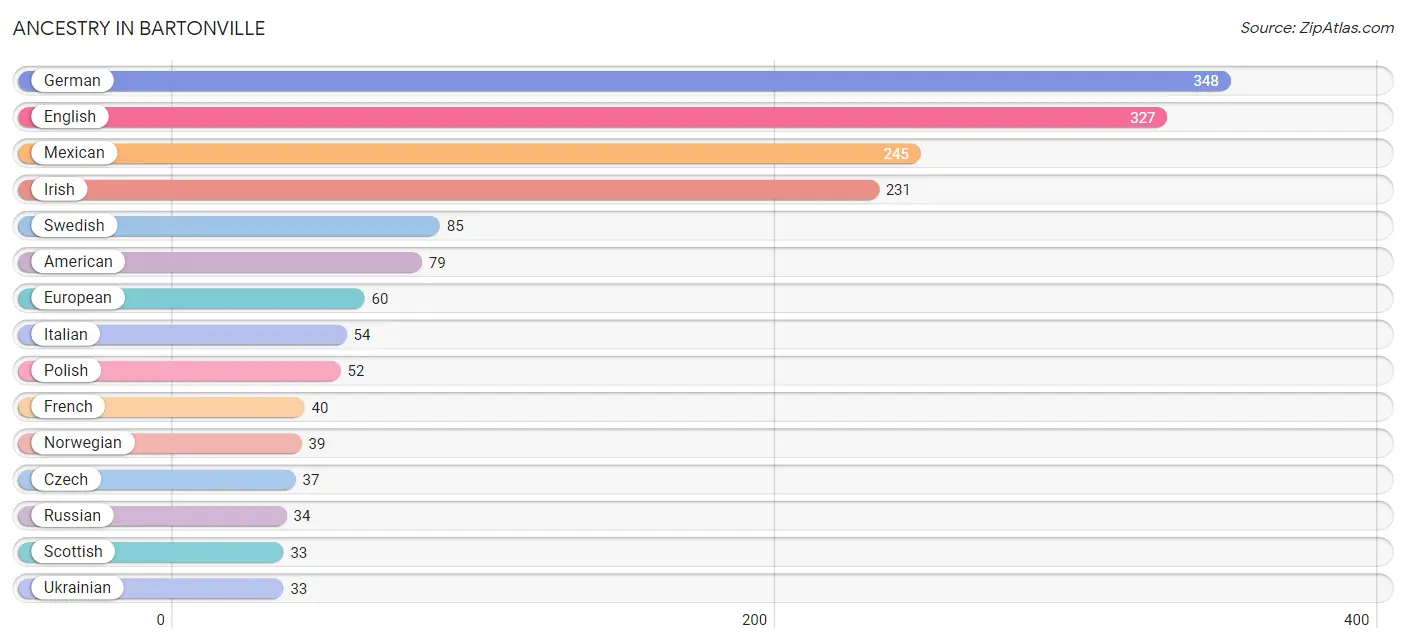
| Ancestry | # Population | % Population |
| American | 79 | 4.0% |
| Arab | 6 | 0.3% |
| British | 20 | 1.0% |
| Burmese | 5 | 0.3% |
| Canadian | 15 | 0.8% |
| Central American | 5 | 0.3% |
| Cherokee | 4 | 0.2% |
| Chickasaw | 10 | 0.5% |
| Chippewa | 19 | 1.0% |
| Choctaw | 7 | 0.4% |
| Comanche | 1 | 0.1% |
| Costa Rican | 5 | 0.3% |
| Creek | 19 | 1.0% |
| Czech | 37 | 1.9% |
| Danish | 15 | 0.8% |
| Dutch | 7 | 0.4% |
| English | 327 | 16.7% |
| European | 60 | 3.1% |
| French | 40 | 2.0% |
| French Canadian | 2 | 0.1% |
| German | 348 | 17.8% |
| Greek | 8 | 0.4% |
| Indian (Asian) | 3 | 0.2% |
| Iranian | 6 | 0.3% |
| Iraqi | 6 | 0.3% |
| Irish | 231 | 11.8% |
| Italian | 54 | 2.8% |
| Korean | 2 | 0.1% |
| Lithuanian | 3 | 0.2% |
| Mexican | 245 | 12.5% |
| Northern European | 4 | 0.2% |
| Norwegian | 39 | 2.0% |
| Polish | 52 | 2.7% |
| Portuguese | 6 | 0.3% |
| Russian | 34 | 1.7% |
| Scotch-Irish | 9 | 0.5% |
| Scottish | 33 | 1.7% |
| Slavic | 5 | 0.3% |
| Spaniard | 6 | 0.3% |
| Sri Lankan | 10 | 0.5% |
| Swedish | 85 | 4.3% |
| Swiss | 3 | 0.2% |
| Thai | 5 | 0.3% |
| Ukrainian | 33 | 1.7% |
| Welsh | 11 | 0.6% |
| Yugoslavian | 3 | 0.2% | View All 46 Rows |
Immigrants in Bartonville
The most numerous immigrant groups reported in Bartonville came from Central America (83 | 4.2%), Latin America (83 | 4.2%), Mexico (83 | 4.2%), Asia (27 | 1.4%), and Europe (22 | 1.1%), together accounting for 15.2% of all Bartonville residents.
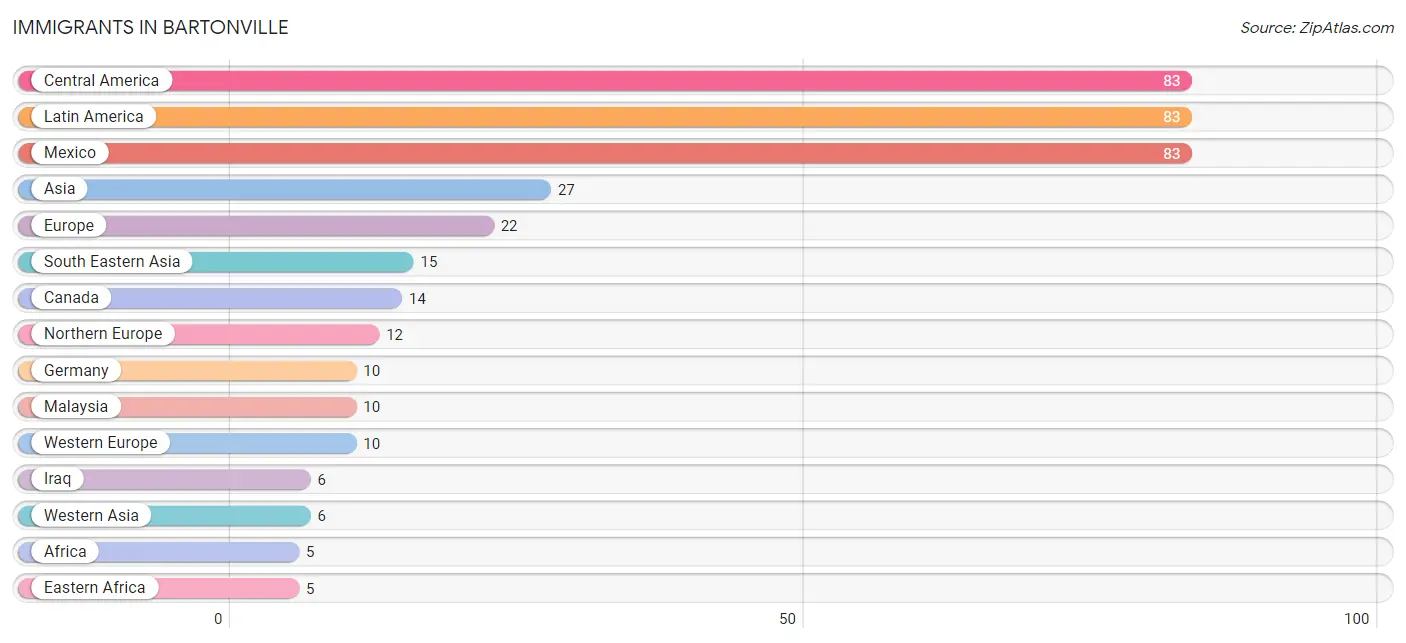
| Immigration Origin | # Population | % Population |
| Africa | 5 | 0.3% |
| Asia | 27 | 1.4% |
| Canada | 14 | 0.7% |
| Central America | 83 | 4.2% |
| China | 3 | 0.2% |
| Eastern Africa | 5 | 0.3% |
| Eastern Asia | 3 | 0.2% |
| England | 4 | 0.2% |
| Europe | 22 | 1.1% |
| Germany | 10 | 0.5% |
| Iran | 3 | 0.2% |
| Iraq | 6 | 0.3% |
| Ireland | 4 | 0.2% |
| Latin America | 83 | 4.2% |
| Malaysia | 10 | 0.5% |
| Mexico | 83 | 4.2% |
| Northern Europe | 12 | 0.6% |
| South Central Asia | 3 | 0.2% |
| South Eastern Asia | 15 | 0.8% |
| Vietnam | 5 | 0.3% |
| Western Asia | 6 | 0.3% |
| Western Europe | 10 | 0.5% |
| Zimbabwe | 5 | 0.3% | View All 23 Rows |
Sex and Age in Bartonville
Sex and Age in Bartonville
The most populous age groups in Bartonville are 50 to 54 Years (158 | 17.1%) for men and 60 to 64 Years (123 | 11.9%) for women.
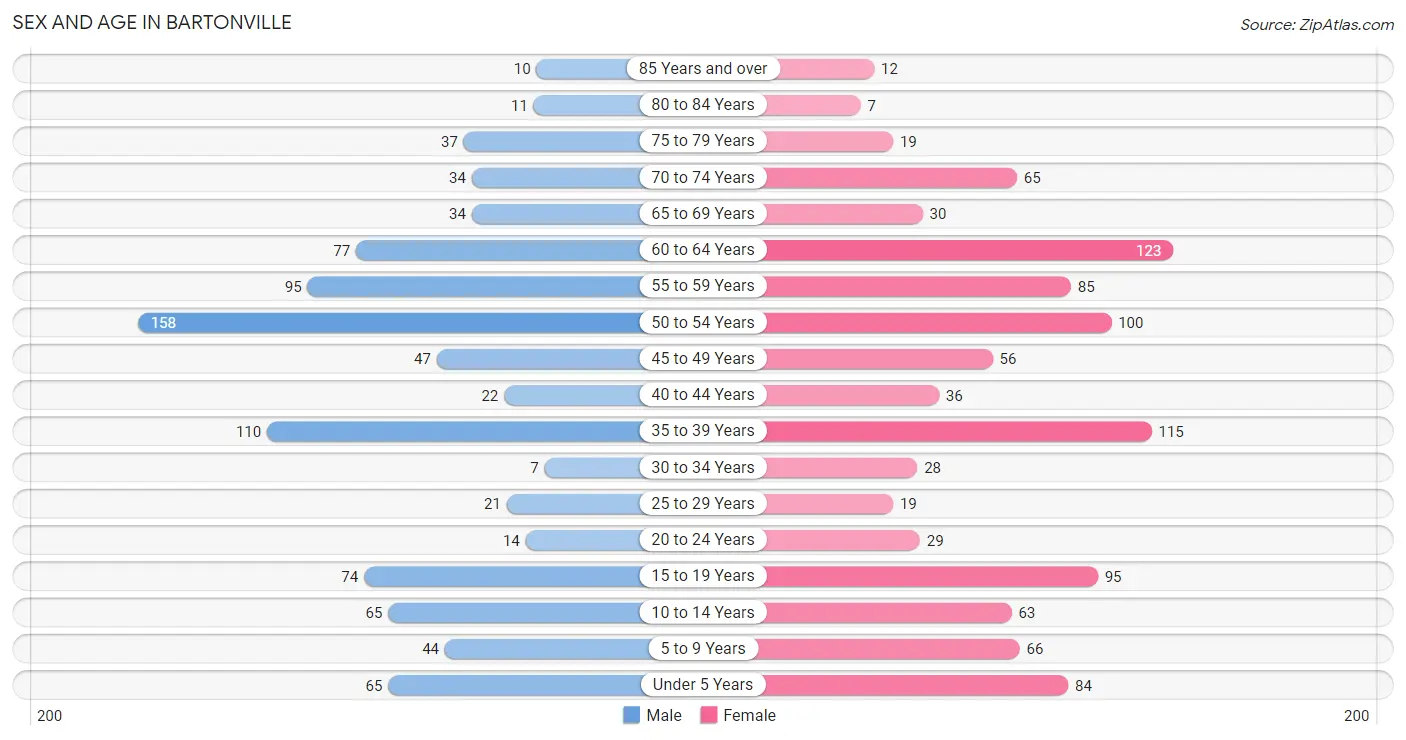
| Age Bracket | Male | Female |
| Under 5 Years | 65 (7.0%) | 84 (8.1%) |
| 5 to 9 Years | 44 (4.8%) | 66 (6.4%) |
| 10 to 14 Years | 65 (7.0%) | 63 (6.1%) |
| 15 to 19 Years | 74 (8.0%) | 95 (9.2%) |
| 20 to 24 Years | 14 (1.5%) | 29 (2.8%) |
| 25 to 29 Years | 21 (2.3%) | 19 (1.8%) |
| 30 to 34 Years | 7 (0.8%) | 28 (2.7%) |
| 35 to 39 Years | 110 (11.9%) | 115 (11.1%) |
| 40 to 44 Years | 22 (2.4%) | 36 (3.5%) |
| 45 to 49 Years | 47 (5.1%) | 56 (5.4%) |
| 50 to 54 Years | 158 (17.1%) | 100 (9.7%) |
| 55 to 59 Years | 95 (10.3%) | 85 (8.2%) |
| 60 to 64 Years | 77 (8.3%) | 123 (11.9%) |
| 65 to 69 Years | 34 (3.7%) | 30 (2.9%) |
| 70 to 74 Years | 34 (3.7%) | 65 (6.3%) |
| 75 to 79 Years | 37 (4.0%) | 19 (1.8%) |
| 80 to 84 Years | 11 (1.2%) | 7 (0.7%) |
| 85 Years and over | 10 (1.1%) | 12 (1.2%) |
| Total | 925 (100.0%) | 1,032 (100.0%) |
Families and Households in Bartonville
Median Family Size in Bartonville
The median family size in Bartonville is 3.25 persons per family, with married-couple families (501 | 92.4%) accounting for the largest median family size of 3.31 persons per family. On the other hand, single female/mother families (20 | 3.7%) represent the smallest median family size with 2.45 persons per family.
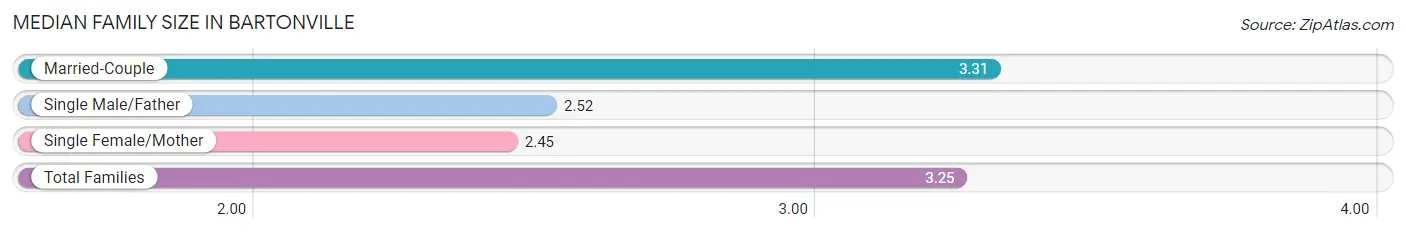
| Family Type | # Families | Family Size |
| Married-Couple | 501 (92.4%) | 3.31 |
| Single Male/Father | 21 (3.9%) | 2.52 |
| Single Female/Mother | 20 (3.7%) | 2.45 |
| Total Families | 542 (100.0%) | 3.25 |
Median Household Size in Bartonville
The median household size in Bartonville is 2.95 persons per household, with married-couple households (501 | 75.4%) accounting for the largest median household size of 3.35 persons per household. non-family households (122 | 18.4%) represent the smallest median household size with 1.38 persons per household.
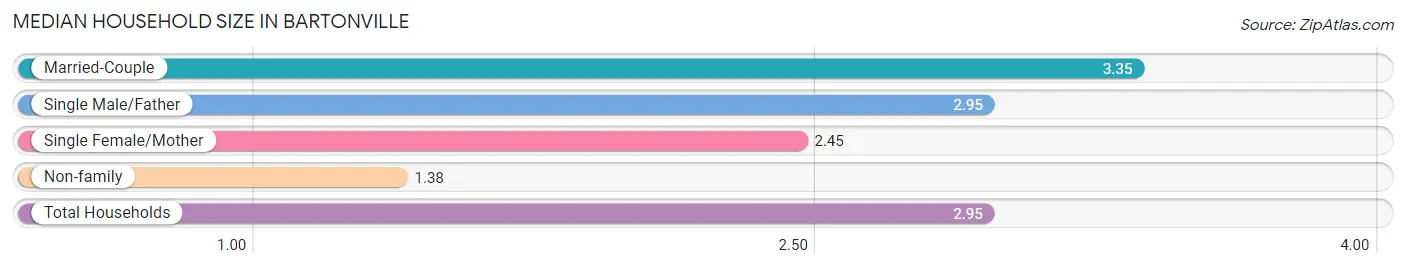
| Household Type | # Households | Household Size |
| Married-Couple | 501 (75.4%) | 3.35 |
| Single Male/Father | 21 (3.2%) | 2.95 |
| Single Female/Mother | 20 (3.0%) | 2.45 |
| Non-family | 122 (18.4%) | 1.38 |
| Total Households | 664 (100.0%) | 2.95 |
Household Size by Marriage Status in Bartonville
Out of a total of 664 households in Bartonville, 542 (81.6%) are family households, while 122 (18.4%) are nonfamily households. The most numerous type of family households are 2-person households, comprising 256, and the most common type of nonfamily households are 1-person households, comprising 88.
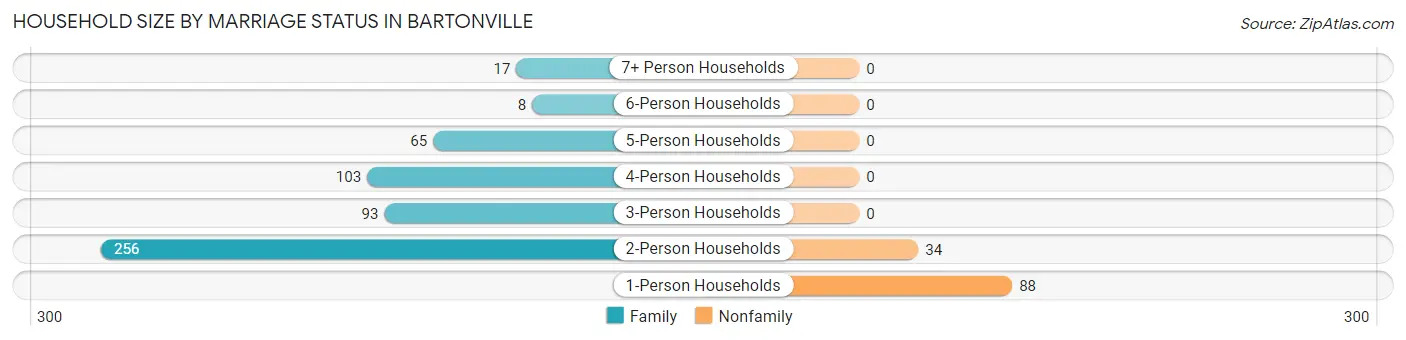
| Household Size | Family Households | Nonfamily Households |
| 1-Person Households | - | 88 (13.3%) |
| 2-Person Households | 256 (38.6%) | 34 (5.1%) |
| 3-Person Households | 93 (14.0%) | 0 (0.0%) |
| 4-Person Households | 103 (15.5%) | 0 (0.0%) |
| 5-Person Households | 65 (9.8%) | 0 (0.0%) |
| 6-Person Households | 8 (1.2%) | 0 (0.0%) |
| 7+ Person Households | 17 (2.6%) | 0 (0.0%) |
| Total | 542 (81.6%) | 122 (18.4%) |
Female Fertility in Bartonville
Fertility by Age in Bartonville
Average fertility rate in Bartonville is 36.0 births per 1,000 women. Women in the age bracket of 20 to 34 years have the highest fertility rate with 53.0 births per 1,000 women. Women in the age bracket of 35 to 50 years acount for 71.4% of all women with births.
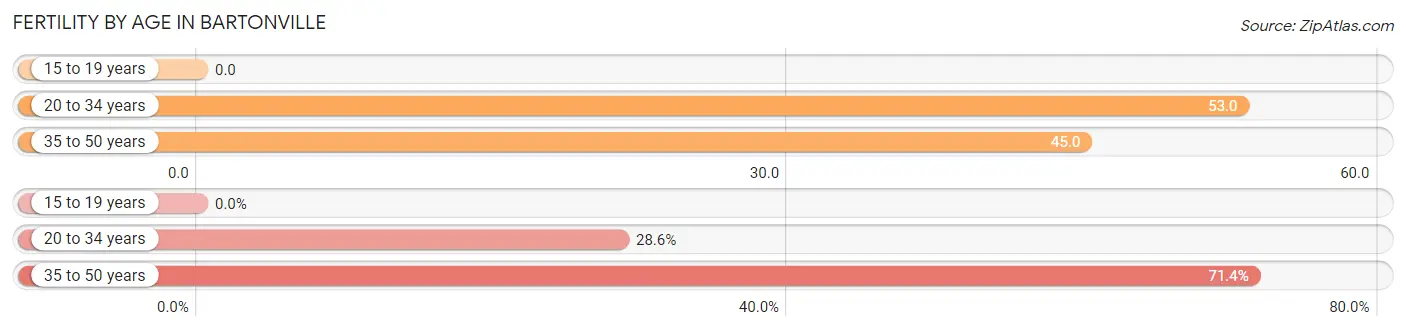
| Age Bracket | Women with Births | Births / 1,000 Women |
| 15 to 19 years | 0 (0.0%) | 0.0 |
| 20 to 34 years | 4 (28.6%) | 53.0 |
| 35 to 50 years | 10 (71.4%) | 45.0 |
| Total | 14 (100.0%) | 36.0 |
Fertility by Age by Marriage Status in Bartonville
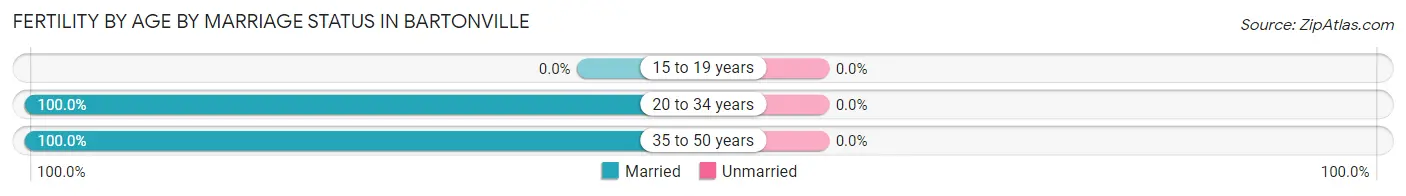
| Age Bracket | Married | Unmarried |
| 15 to 19 years | 0 (0.0%) | 0 (0.0%) |
| 20 to 34 years | 4 (100.0%) | 0 (0.0%) |
| 35 to 50 years | 10 (100.0%) | 0 (0.0%) |
| Total | 14 (100.0%) | 0 (0.0%) |
Fertility by Education in Bartonville
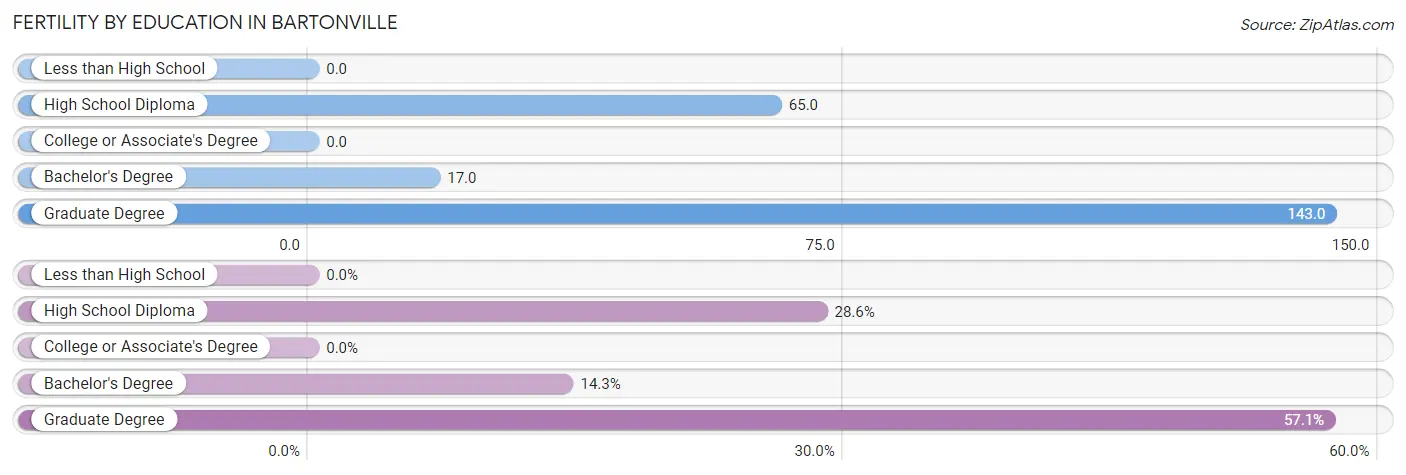
| Educational Attainment | Women with Births | Births / 1,000 Women |
| Less than High School | 0 (0.0%) | 0.0 |
| High School Diploma | 4 (28.6%) | 65.0 |
| College or Associate's Degree | 0 (0.0%) | 0.0 |
| Bachelor's Degree | 2 (14.3%) | 17.0 |
| Graduate Degree | 8 (57.1%) | 143.0 |
| Total | 14 (100.0%) | 36.0 |
Fertility by Education by Marriage Status in Bartonville
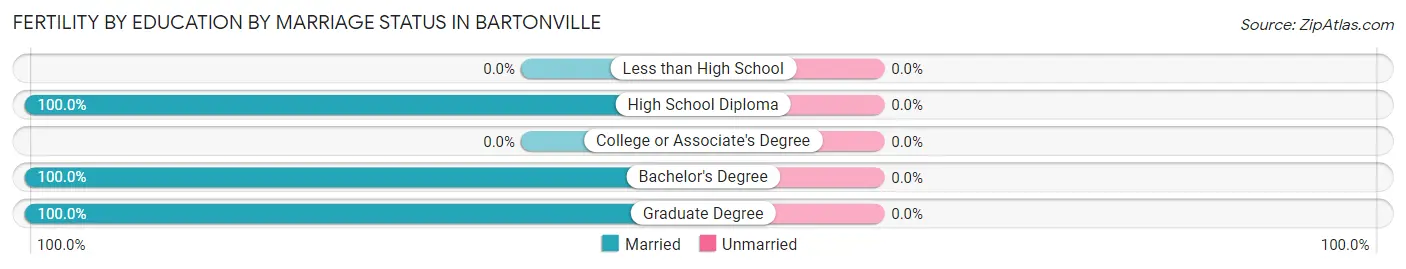
| Educational Attainment | Married | Unmarried |
| Less than High School | 0 (0.0%) | 0 (0.0%) |
| High School Diploma | 4 (100.0%) | 0 (0.0%) |
| College or Associate's Degree | 0 (0.0%) | 0 (0.0%) |
| Bachelor's Degree | 2 (100.0%) | 0 (0.0%) |
| Graduate Degree | 8 (100.0%) | 0 (0.0%) |
| Total | 14 (100.0%) | 0 (0.0%) |
Employment Characteristics in Bartonville
Employment by Class of Employer in Bartonville
Among the 854 employed individuals in Bartonville, private company employees (452 | 52.9%), self-employed (not incorporated) (182 | 21.3%), and self-employed (incorporated) (113 | 13.2%) make up the most common classes of employment.
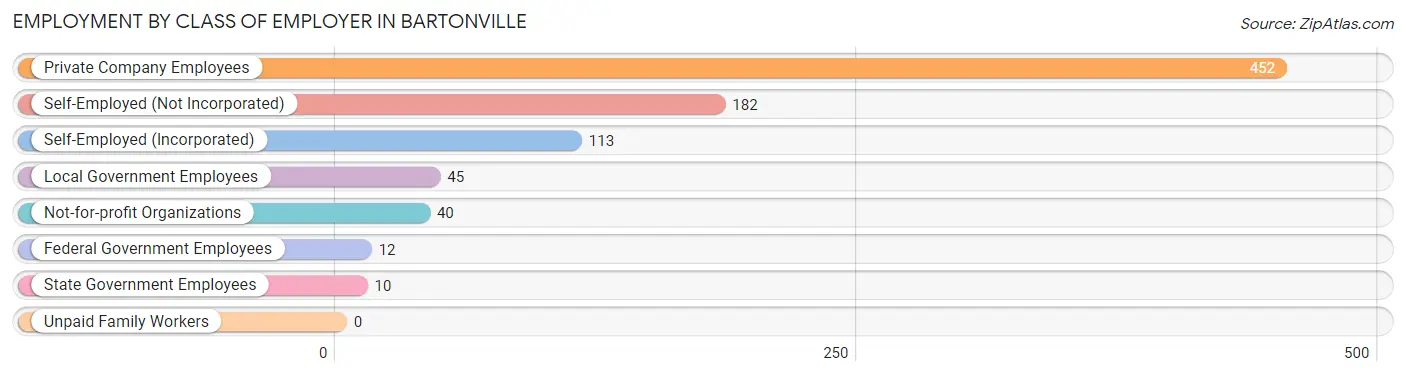
| Employer Class | # Employees | % Employees |
| Private Company Employees | 452 | 52.9% |
| Self-Employed (Incorporated) | 113 | 13.2% |
| Self-Employed (Not Incorporated) | 182 | 21.3% |
| Not-for-profit Organizations | 40 | 4.7% |
| Local Government Employees | 45 | 5.3% |
| State Government Employees | 10 | 1.2% |
| Federal Government Employees | 12 | 1.4% |
| Unpaid Family Workers | 0 | 0.0% |
| Total | 854 | 100.0% |
Employment Status by Age in Bartonville
According to the labor force statistics for Bartonville, out of the total population over 16 years of age (1,515), 59.3% or 898 individuals are in the labor force, with 2.4% or 22 of them unemployed. The age group with the highest labor force participation rate is 20 to 24 years, with 86.0% or 37 individuals in the labor force. Within the labor force, the 20 to 24 years age range has the highest percentage of unemployed individuals, with 29.7% or 11 of them being unemployed.
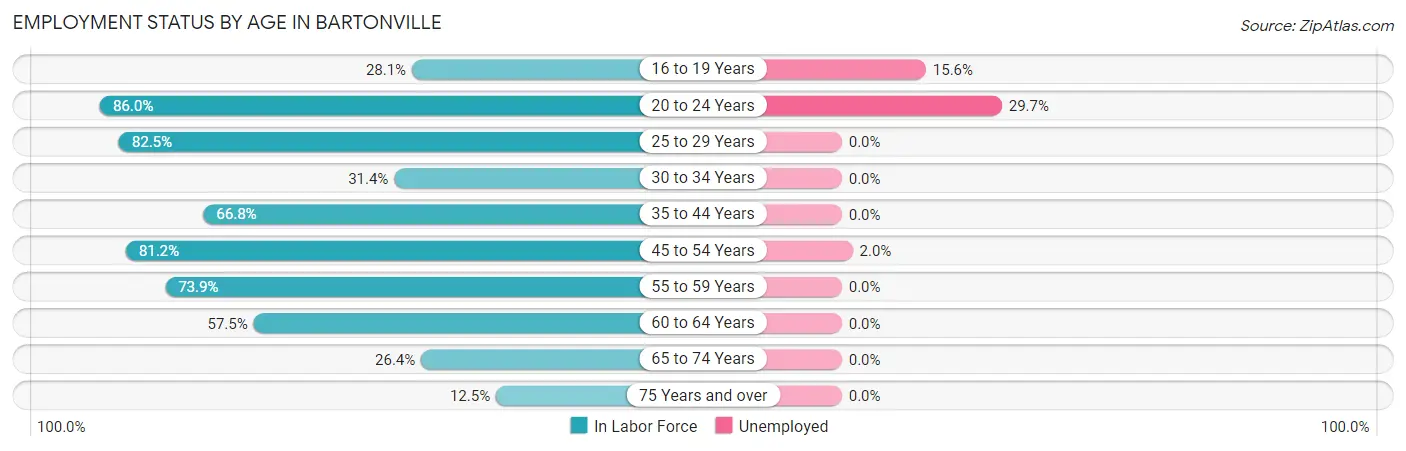
| Age Bracket | In Labor Force | Unemployed |
| 16 to 19 Years | 32 (28.1%) | 5 (15.6%) |
| 20 to 24 Years | 37 (86.0%) | 11 (29.7%) |
| 25 to 29 Years | 33 (82.5%) | 0 (0.0%) |
| 30 to 34 Years | 11 (31.4%) | 0 (0.0%) |
| 35 to 44 Years | 189 (66.8%) | 0 (0.0%) |
| 45 to 54 Years | 293 (81.2%) | 6 (2.0%) |
| 55 to 59 Years | 133 (73.9%) | 0 (0.0%) |
| 60 to 64 Years | 115 (57.5%) | 0 (0.0%) |
| 65 to 74 Years | 43 (26.4%) | 0 (0.0%) |
| 75 Years and over | 12 (12.5%) | 0 (0.0%) |
| Total | 898 (59.3%) | 22 (2.4%) |
Employment Status by Educational Attainment in Bartonville
According to labor force statistics for Bartonville, 70.4% of individuals (774) out of the total population between 25 and 64 years of age (1,099) are in the labor force, with 0.8% or 6 of them being unemployed. The group with the highest labor force participation rate are those with the educational attainment of college / associate degree, with 75.0% or 207 individuals in the labor force. Within the labor force, individuals with bachelor's degree or higher education have the highest percentage of unemployment, with 1.5% or 6 of them being unemployed.
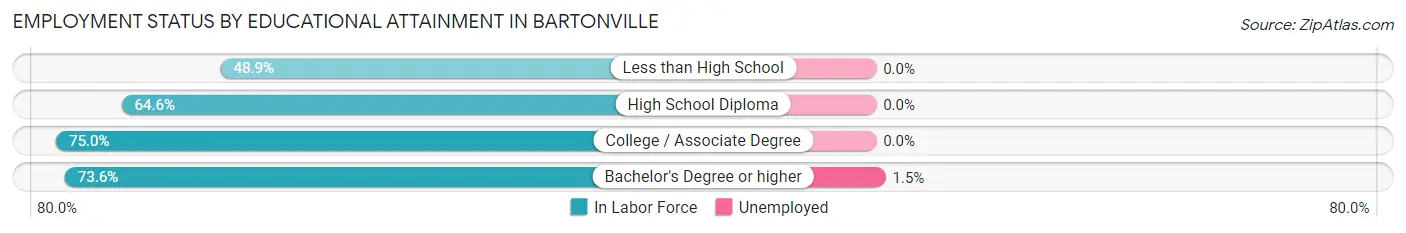
| Educational Attainment | In Labor Force | Unemployed |
| Less than High School | 45 (48.9%) | 0 (0.0%) |
| High School Diploma | 117 (64.6%) | 0 (0.0%) |
| College / Associate Degree | 207 (75.0%) | 0 (0.0%) |
| Bachelor's Degree or higher | 405 (73.6%) | 8 (1.5%) |
| Total | 774 (70.4%) | 9 (0.8%) |
Employment Occupations by Sex in Bartonville
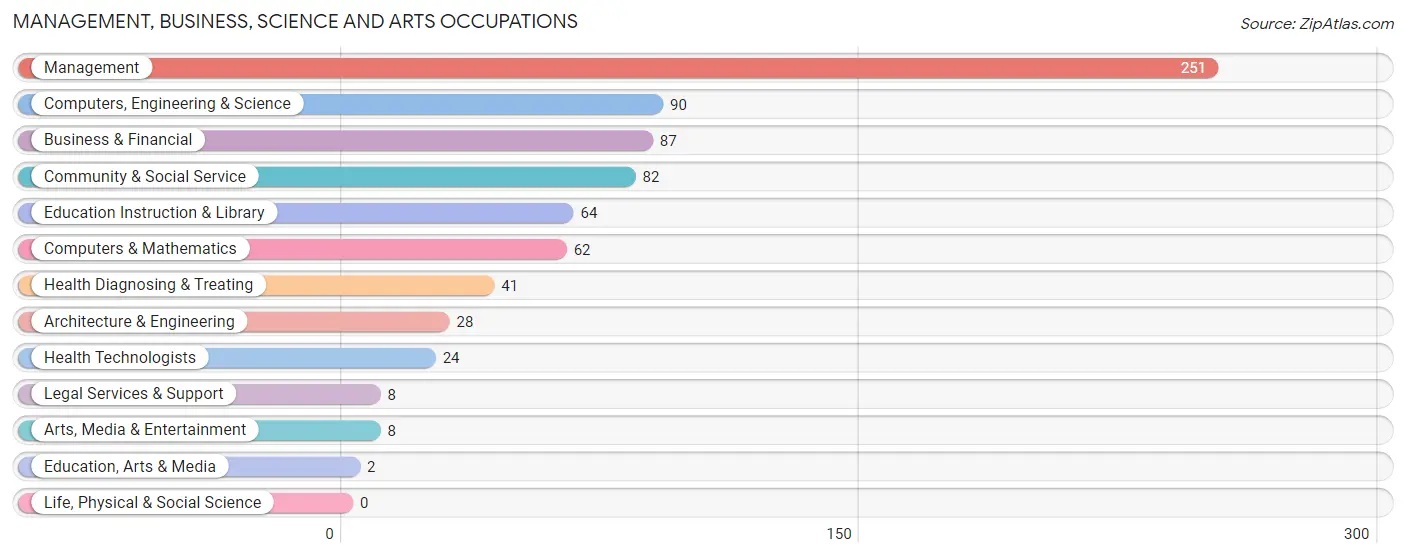
Management, Business, Science and Arts Occupations
The most common Management, Business, Science and Arts occupations in Bartonville are Management (251 | 28.6%), Computers, Engineering & Science (90 | 10.3%), Business & Financial (87 | 9.9%), Community & Social Service (82 | 9.4%), and Education Instruction & Library (64 | 7.3%).
Management, Business, Science and Arts Occupations by Sex
Within the Management, Business, Science and Arts occupations in Bartonville, the most male-oriented occupations are Computers & Mathematics (88.7%), Computers, Engineering & Science (75.6%), and Management (74.1%), while the most female-oriented occupations are Education, Arts & Media (100.0%), Education Instruction & Library (95.3%), and Community & Social Service (87.8%).
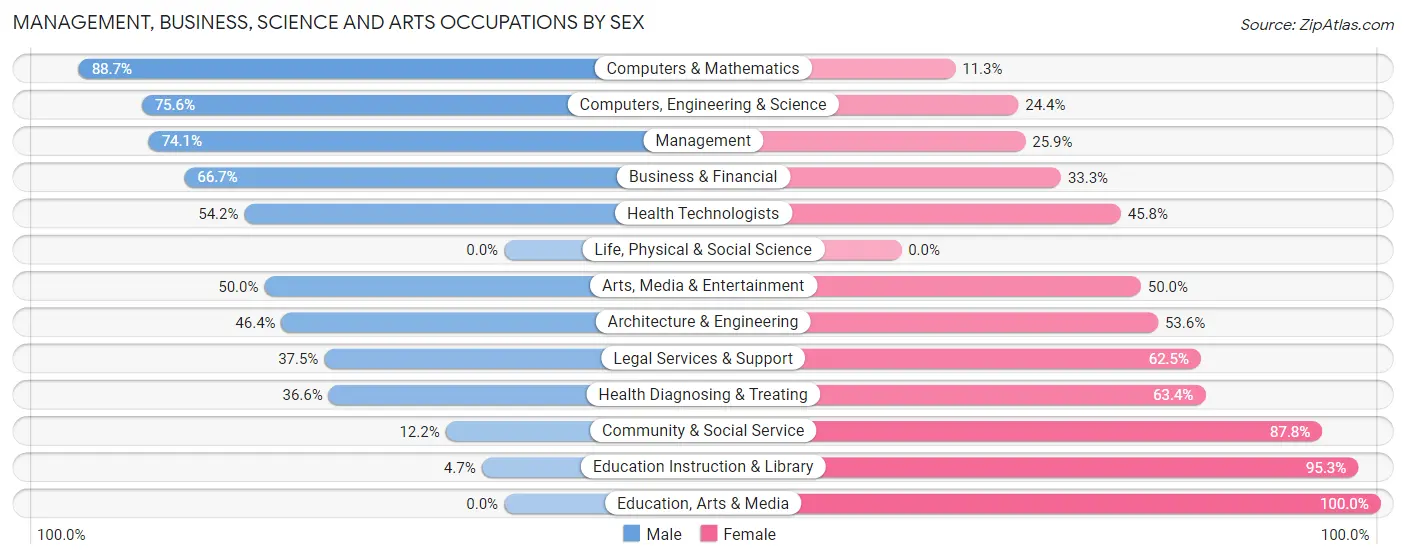
| Occupation | Male | Female |
| Management | 186 (74.1%) | 65 (25.9%) |
| Business & Financial | 58 (66.7%) | 29 (33.3%) |
| Computers, Engineering & Science | 68 (75.6%) | 22 (24.4%) |
| Computers & Mathematics | 55 (88.7%) | 7 (11.3%) |
| Architecture & Engineering | 13 (46.4%) | 15 (53.6%) |
| Life, Physical & Social Science | 0 (0.0%) | 0 (0.0%) |
| Community & Social Service | 10 (12.2%) | 72 (87.8%) |
| Education, Arts & Media | 0 (0.0%) | 2 (100.0%) |
| Legal Services & Support | 3 (37.5%) | 5 (62.5%) |
| Education Instruction & Library | 3 (4.7%) | 61 (95.3%) |
| Arts, Media & Entertainment | 4 (50.0%) | 4 (50.0%) |
| Health Diagnosing & Treating | 15 (36.6%) | 26 (63.4%) |
| Health Technologists | 13 (54.2%) | 11 (45.8%) |
| Total (Category) | 337 (61.2%) | 214 (38.8%) |
| Total (Overall) | 472 (53.9%) | 404 (46.1%) |
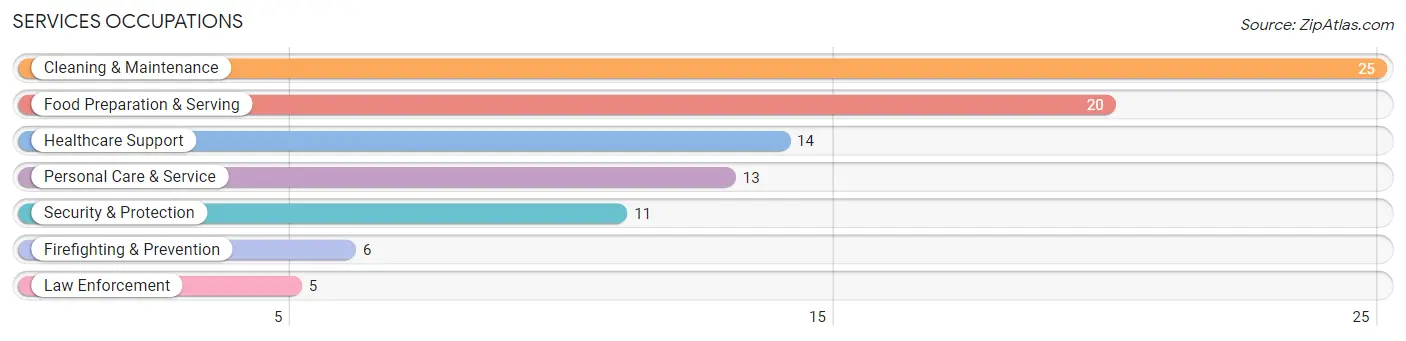
Services Occupations
The most common Services occupations in Bartonville are Cleaning & Maintenance (25 | 2.9%), Food Preparation & Serving (20 | 2.3%), Healthcare Support (14 | 1.6%), Personal Care & Service (13 | 1.5%), and Security & Protection (11 | 1.3%).
Services Occupations by Sex
Within the Services occupations in Bartonville, the most male-oriented occupations are Security & Protection (100.0%), Firefighting & Prevention (100.0%), and Law Enforcement (100.0%), while the most female-oriented occupations are Healthcare Support (100.0%), Food Preparation & Serving (100.0%), and Personal Care & Service (100.0%).
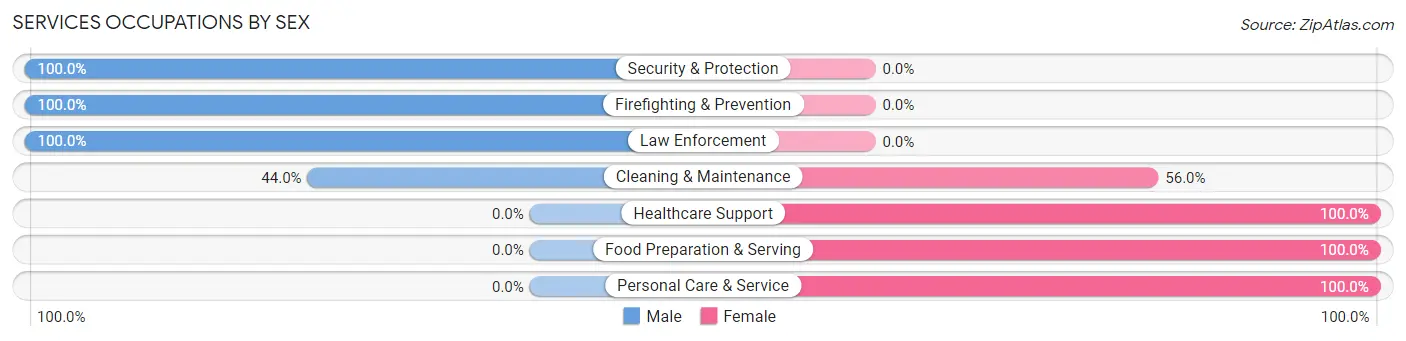
| Occupation | Male | Female |
| Healthcare Support | 0 (0.0%) | 14 (100.0%) |
| Security & Protection | 11 (100.0%) | 0 (0.0%) |
| Firefighting & Prevention | 6 (100.0%) | 0 (0.0%) |
| Law Enforcement | 5 (100.0%) | 0 (0.0%) |
| Food Preparation & Serving | 0 (0.0%) | 20 (100.0%) |
| Cleaning & Maintenance | 11 (44.0%) | 14 (56.0%) |
| Personal Care & Service | 0 (0.0%) | 13 (100.0%) |
| Total (Category) | 22 (26.5%) | 61 (73.5%) |
| Total (Overall) | 472 (53.9%) | 404 (46.1%) |
Sales and Office Occupations
The most common Sales and Office occupations in Bartonville are Sales & Related (89 | 10.2%), and Office & Administration (38 | 4.3%).
Sales and Office Occupations by Sex
| Occupation | Male | Female |
| Sales & Related | 47 (52.8%) | 42 (47.2%) |
| Office & Administration | 0 (0.0%) | 38 (100.0%) |
| Total (Category) | 47 (37.0%) | 80 (63.0%) |
| Total (Overall) | 472 (53.9%) | 404 (46.1%) |
Natural Resources, Construction and Maintenance Occupations
The most common Natural Resources, Construction and Maintenance occupations in Bartonville are Construction & Extraction (37 | 4.2%), Farming, Fishing & Forestry (26 | 3.0%), and Installation, Maintenance & Repair (10 | 1.1%).
Natural Resources, Construction and Maintenance Occupations by Sex
| Occupation | Male | Female |
| Farming, Fishing & Forestry | 0 (0.0%) | 26 (100.0%) |
| Construction & Extraction | 37 (100.0%) | 0 (0.0%) |
| Installation, Maintenance & Repair | 10 (100.0%) | 0 (0.0%) |
| Total (Category) | 47 (64.4%) | 26 (35.6%) |
| Total (Overall) | 472 (53.9%) | 404 (46.1%) |
Production, Transportation and Moving Occupations
The most common Production, Transportation and Moving occupations in Bartonville are Transportation (32 | 3.6%), and Material Moving (10 | 1.1%).
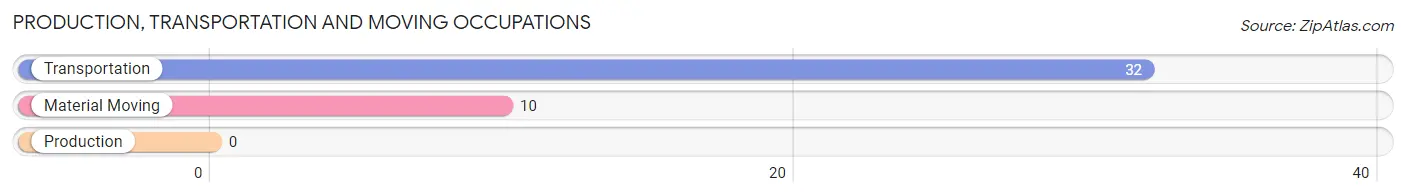
Production, Transportation and Moving Occupations by Sex
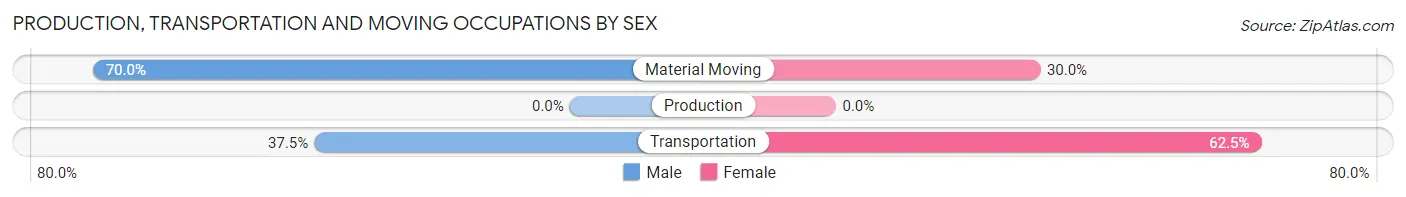
| Occupation | Male | Female |
| Production | 0 (0.0%) | 0 (0.0%) |
| Transportation | 12 (37.5%) | 20 (62.5%) |
| Material Moving | 7 (70.0%) | 3 (30.0%) |
| Total (Category) | 19 (45.2%) | 23 (54.8%) |
| Total (Overall) | 472 (53.9%) | 404 (46.1%) |
Employment Industries by Sex in Bartonville
Employment Industries in Bartonville
The major employment industries in Bartonville include Agriculture, Fishing & Hunting (94 | 10.7%), Professional & Scientific (94 | 10.7%), Health Care & Social Assistance (83 | 9.5%), Retail Trade (80 | 9.1%), and Manufacturing (75 | 8.6%).
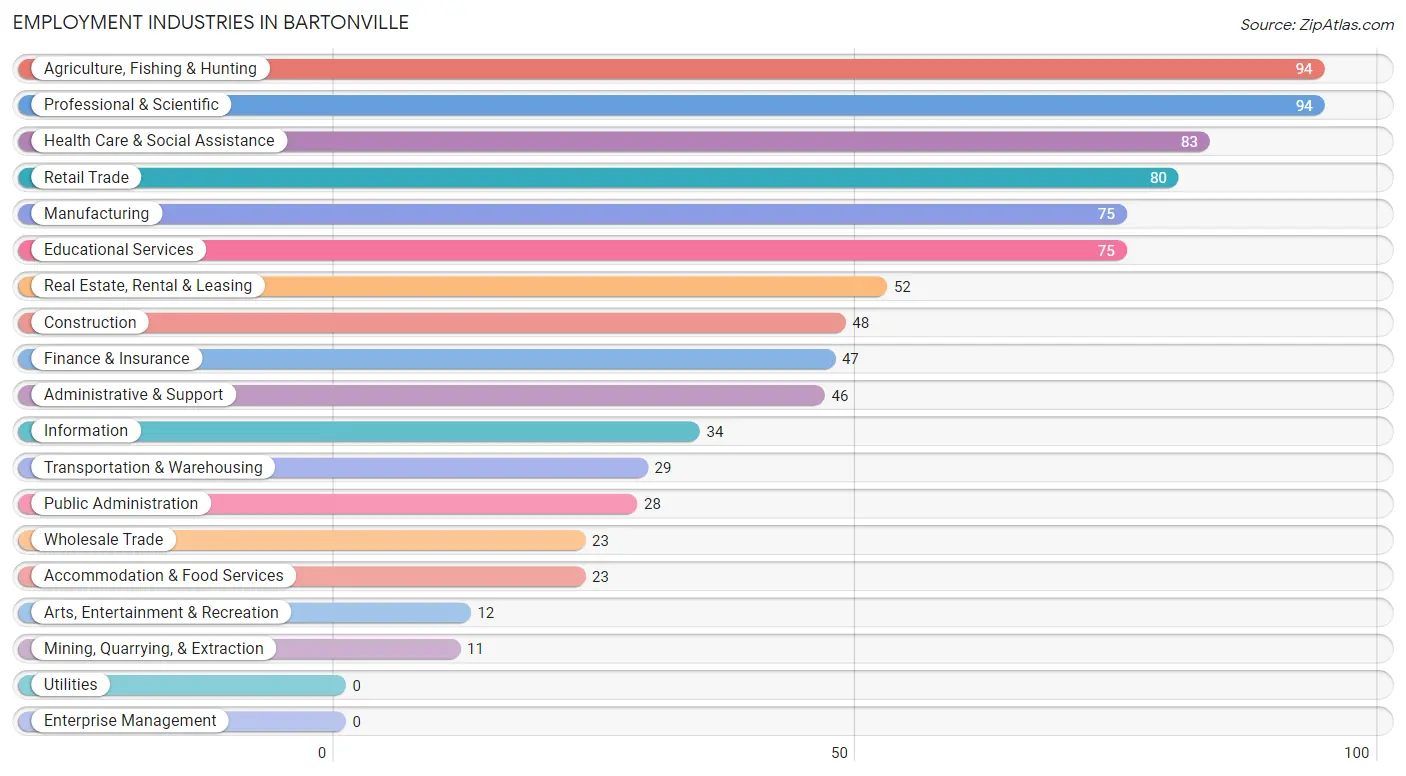
Employment Industries by Sex in Bartonville
The Bartonville industries that see more men than women are Mining, Quarrying, & Extraction (100.0%), Construction (100.0%), and Wholesale Trade (87.0%), whereas the industries that tend to have a higher number of women are Accommodation & Food Services (87.0%), Health Care & Social Assistance (83.1%), and Educational Services (76.0%).
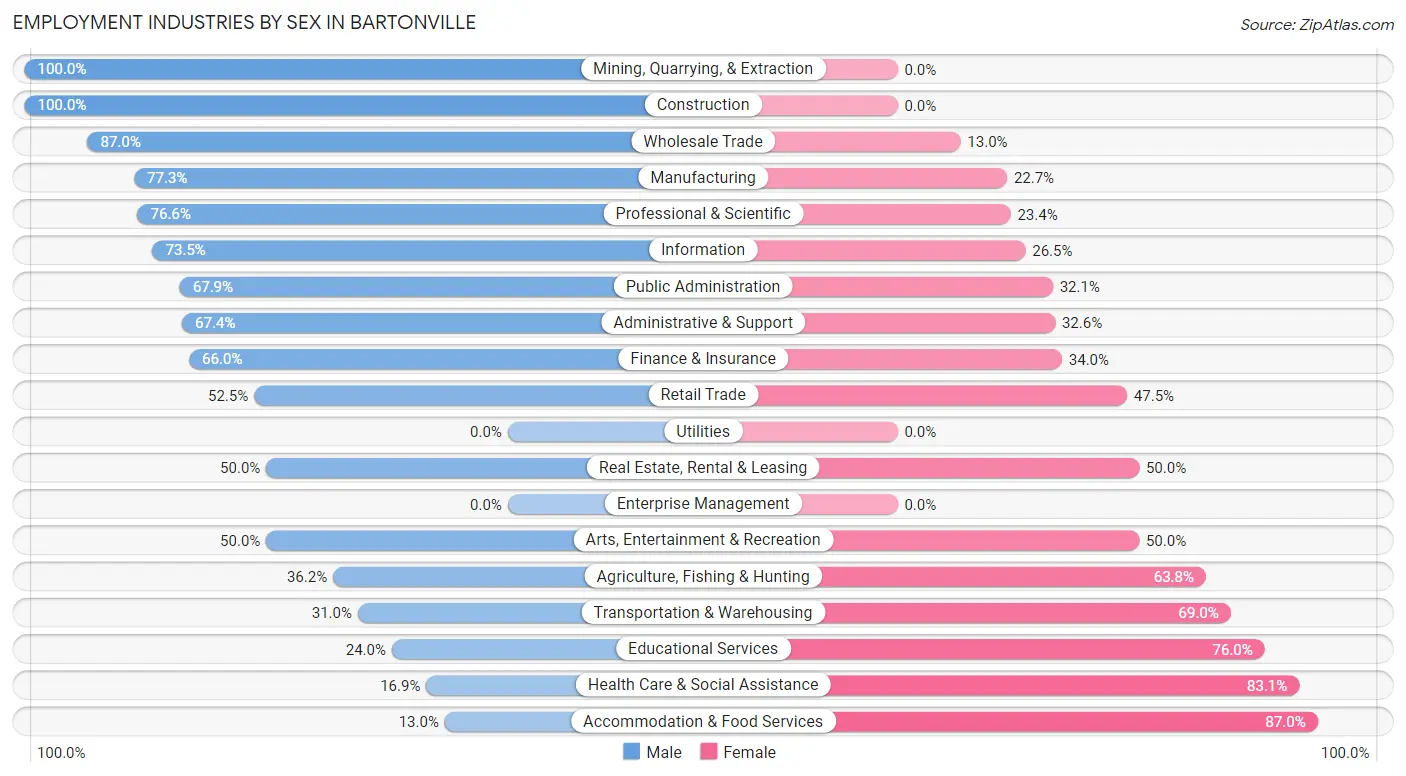
| Industry | Male | Female |
| Agriculture, Fishing & Hunting | 34 (36.2%) | 60 (63.8%) |
| Mining, Quarrying, & Extraction | 11 (100.0%) | 0 (0.0%) |
| Construction | 48 (100.0%) | 0 (0.0%) |
| Manufacturing | 58 (77.3%) | 17 (22.7%) |
| Wholesale Trade | 20 (87.0%) | 3 (13.0%) |
| Retail Trade | 42 (52.5%) | 38 (47.5%) |
| Transportation & Warehousing | 9 (31.0%) | 20 (69.0%) |
| Utilities | 0 (0.0%) | 0 (0.0%) |
| Information | 25 (73.5%) | 9 (26.5%) |
| Finance & Insurance | 31 (66.0%) | 16 (34.0%) |
| Real Estate, Rental & Leasing | 26 (50.0%) | 26 (50.0%) |
| Professional & Scientific | 72 (76.6%) | 22 (23.4%) |
| Enterprise Management | 0 (0.0%) | 0 (0.0%) |
| Administrative & Support | 31 (67.4%) | 15 (32.6%) |
| Educational Services | 18 (24.0%) | 57 (76.0%) |
| Health Care & Social Assistance | 14 (16.9%) | 69 (83.1%) |
| Arts, Entertainment & Recreation | 6 (50.0%) | 6 (50.0%) |
| Accommodation & Food Services | 3 (13.0%) | 20 (87.0%) |
| Public Administration | 19 (67.9%) | 9 (32.1%) |
| Total | 472 (53.9%) | 404 (46.1%) |
Education in Bartonville
School Enrollment in Bartonville
The most common levels of schooling among the 465 students in Bartonville are high school (169 | 36.3%), middle school (114 | 24.5%), and elementary school (95 | 20.4%).
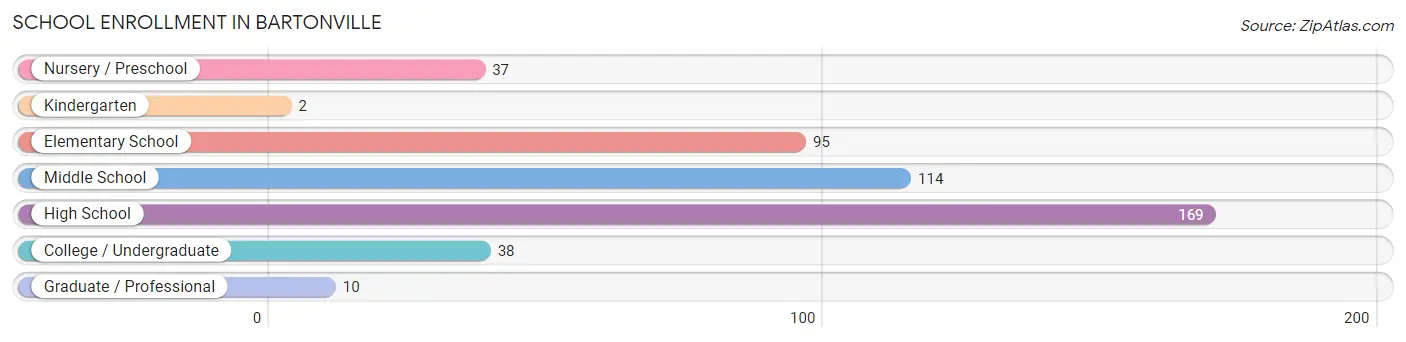
| School Level | # Students | % Students |
| Nursery / Preschool | 37 | 8.0% |
| Kindergarten | 2 | 0.4% |
| Elementary School | 95 | 20.4% |
| Middle School | 114 | 24.5% |
| High School | 169 | 36.3% |
| College / Undergraduate | 38 | 8.2% |
| Graduate / Professional | 10 | 2.1% |
| Total | 465 | 100.0% |
School Enrollment by Age by Funding Source in Bartonville
Out of a total of 465 students who are enrolled in schools in Bartonville, 160 (34.4%) attend a private institution, while the remaining 305 (65.6%) are enrolled in public schools. The age group of 3 to 4 year olds has the highest likelihood of being enrolled in private schools, with 24 (100.0% in the age bracket) enrolled. Conversely, the age group of 20 to 24 year olds has the lowest likelihood of being enrolled in a private school, with 14 (100.0% in the age bracket) attending a public institution.
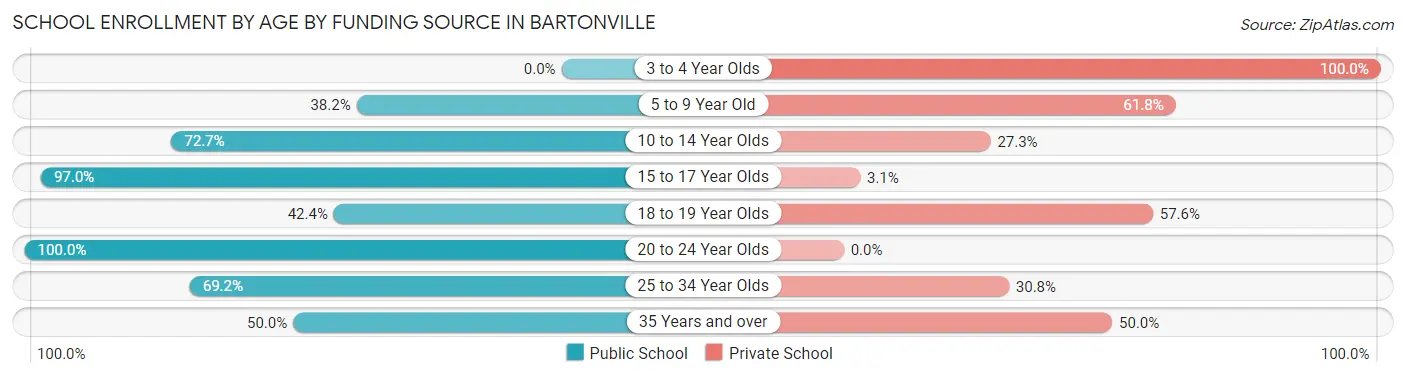
| Age Bracket | Public School | Private School |
| 3 to 4 Year Olds | 0 (0.0%) | 24 (100.0%) |
| 5 to 9 Year Old | 42 (38.2%) | 68 (61.8%) |
| 10 to 14 Year Olds | 93 (72.7%) | 35 (27.3%) |
| 15 to 17 Year Olds | 127 (97.0%) | 4 (3.0%) |
| 18 to 19 Year Olds | 14 (42.4%) | 19 (57.6%) |
| 20 to 24 Year Olds | 14 (100.0%) | 0 (0.0%) |
| 25 to 34 Year Olds | 9 (69.2%) | 4 (30.8%) |
| 35 Years and over | 6 (50.0%) | 6 (50.0%) |
| Total | 305 (65.6%) | 160 (34.4%) |
Educational Attainment by Field of Study in Bartonville
Business (256 | 36.3%), education (83 | 11.8%), engineering (58 | 8.2%), computers & mathematics (53 | 7.5%), and science & technology (53 | 7.5%) are the most common fields of study among 706 individuals in Bartonville who have obtained a bachelor's degree or higher.
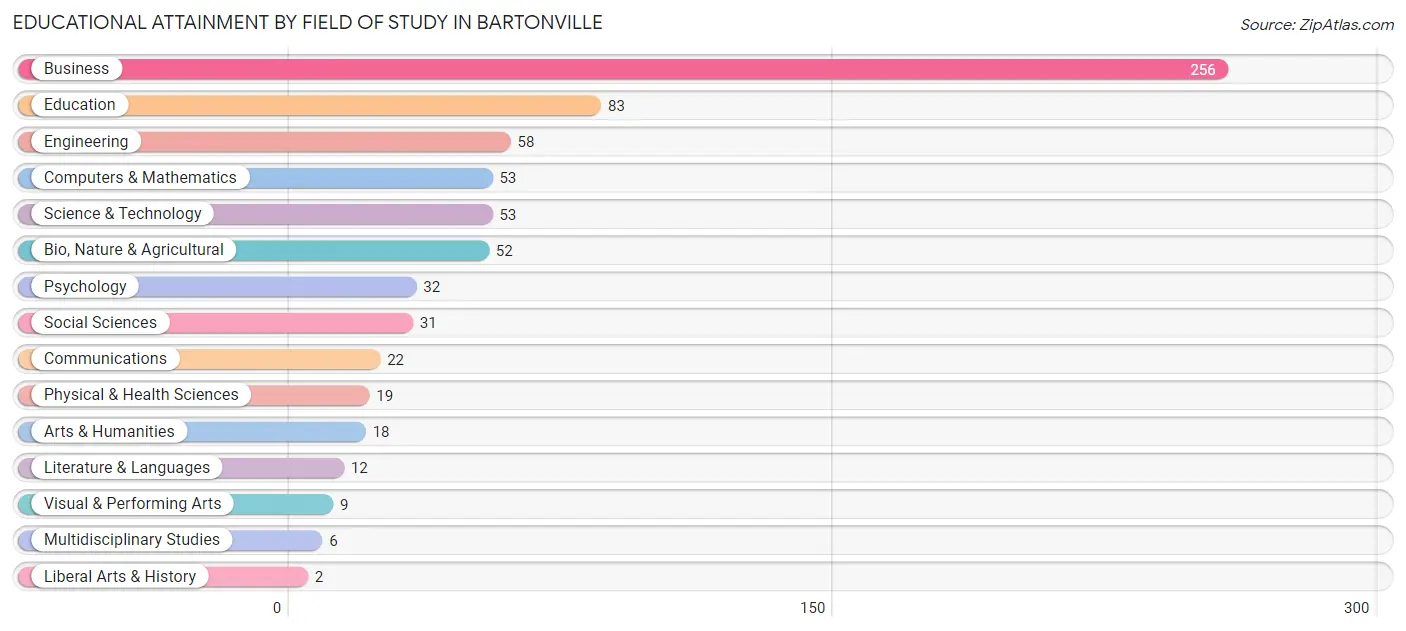
| Field of Study | # Graduates | % Graduates |
| Computers & Mathematics | 53 | 7.5% |
| Bio, Nature & Agricultural | 52 | 7.4% |
| Physical & Health Sciences | 19 | 2.7% |
| Psychology | 32 | 4.5% |
| Social Sciences | 31 | 4.4% |
| Engineering | 58 | 8.2% |
| Multidisciplinary Studies | 6 | 0.9% |
| Science & Technology | 53 | 7.5% |
| Business | 256 | 36.3% |
| Education | 83 | 11.8% |
| Literature & Languages | 12 | 1.7% |
| Liberal Arts & History | 2 | 0.3% |
| Visual & Performing Arts | 9 | 1.3% |
| Communications | 22 | 3.1% |
| Arts & Humanities | 18 | 2.5% |
| Total | 706 | 100.0% |
Transportation & Commute in Bartonville
Vehicle Availability by Sex in Bartonville
The most prevalent vehicle ownership categories in Bartonville are males with 2 vehicles (169, accounting for 35.8%) and females with 2 vehicles (155, making up 44.2%).
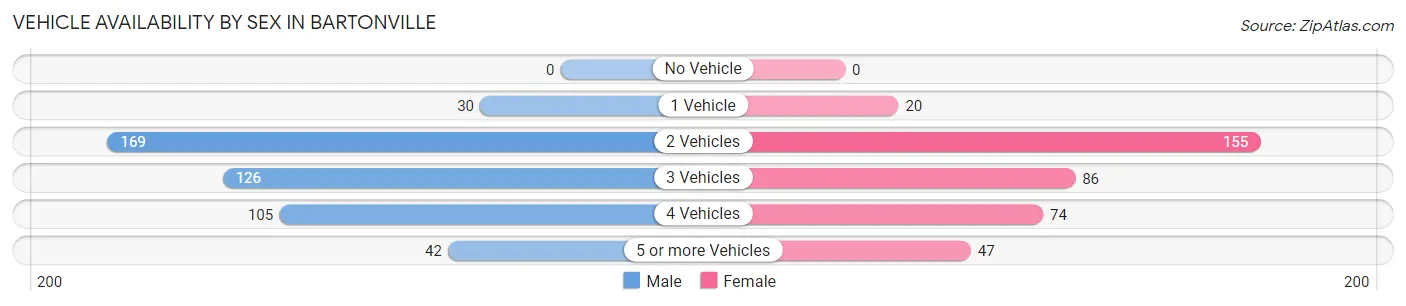
| Vehicles Available | Male | Female |
| No Vehicle | 0 (0.0%) | 0 (0.0%) |
| 1 Vehicle | 30 (6.4%) | 20 (5.2%) |
| 2 Vehicles | 169 (35.8%) | 155 (40.6%) |
| 3 Vehicles | 126 (26.7%) | 86 (22.5%) |
| 4 Vehicles | 105 (22.3%) | 74 (19.4%) |
| 5 or more Vehicles | 42 (8.9%) | 47 (12.3%) |
| Total | 472 (100.0%) | 382 (100.0%) |
Commute Time in Bartonville
The most frequently occuring commute durations in Bartonville are 30 to 34 minutes (113 commuters, 19.3%), 45 to 59 minutes (105 commuters, 17.9%), and 20 to 24 minutes (81 commuters, 13.8%).
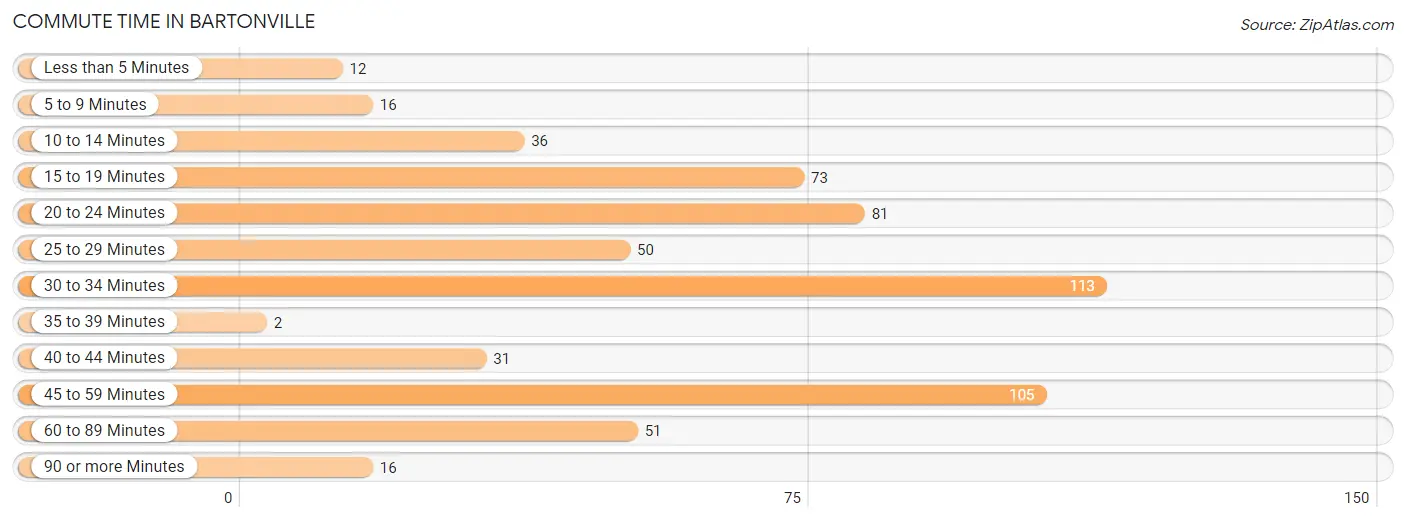
| Commute Time | # Commuters | % Commuters |
| Less than 5 Minutes | 12 | 2.1% |
| 5 to 9 Minutes | 16 | 2.7% |
| 10 to 14 Minutes | 36 | 6.1% |
| 15 to 19 Minutes | 73 | 12.5% |
| 20 to 24 Minutes | 81 | 13.8% |
| 25 to 29 Minutes | 50 | 8.5% |
| 30 to 34 Minutes | 113 | 19.3% |
| 35 to 39 Minutes | 2 | 0.3% |
| 40 to 44 Minutes | 31 | 5.3% |
| 45 to 59 Minutes | 105 | 17.9% |
| 60 to 89 Minutes | 51 | 8.7% |
| 90 or more Minutes | 16 | 2.7% |
Commute Time by Sex in Bartonville
The most common commute times in Bartonville are 45 to 59 minutes (78 commuters, 24.0%) for males and 15 to 19 minutes (54 commuters, 20.7%) for females.
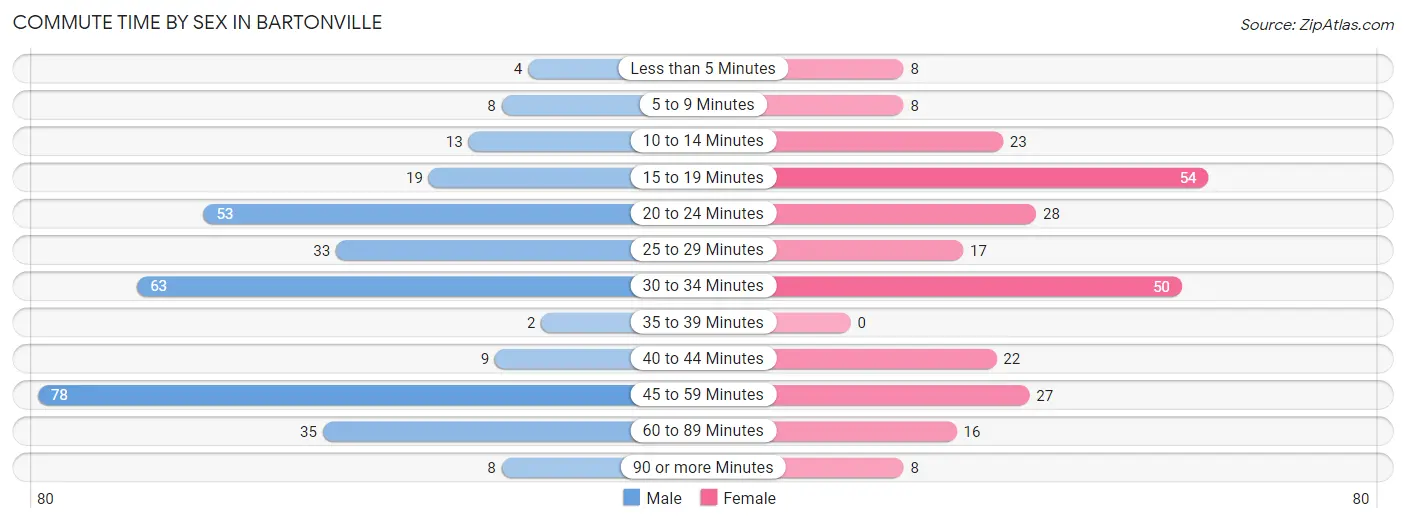
| Commute Time | Male | Female |
| Less than 5 Minutes | 4 (1.2%) | 8 (3.1%) |
| 5 to 9 Minutes | 8 (2.5%) | 8 (3.1%) |
| 10 to 14 Minutes | 13 (4.0%) | 23 (8.8%) |
| 15 to 19 Minutes | 19 (5.9%) | 54 (20.7%) |
| 20 to 24 Minutes | 53 (16.3%) | 28 (10.7%) |
| 25 to 29 Minutes | 33 (10.2%) | 17 (6.5%) |
| 30 to 34 Minutes | 63 (19.4%) | 50 (19.2%) |
| 35 to 39 Minutes | 2 (0.6%) | 0 (0.0%) |
| 40 to 44 Minutes | 9 (2.8%) | 22 (8.4%) |
| 45 to 59 Minutes | 78 (24.0%) | 27 (10.3%) |
| 60 to 89 Minutes | 35 (10.8%) | 16 (6.1%) |
| 90 or more Minutes | 8 (2.5%) | 8 (3.1%) |
Time of Departure to Work by Sex in Bartonville
The most frequent times of departure to work in Bartonville are 8:00 AM to 8:29 AM (74, 22.8%) for males and 6:00 AM to 6:29 AM (57, 21.8%) for females.
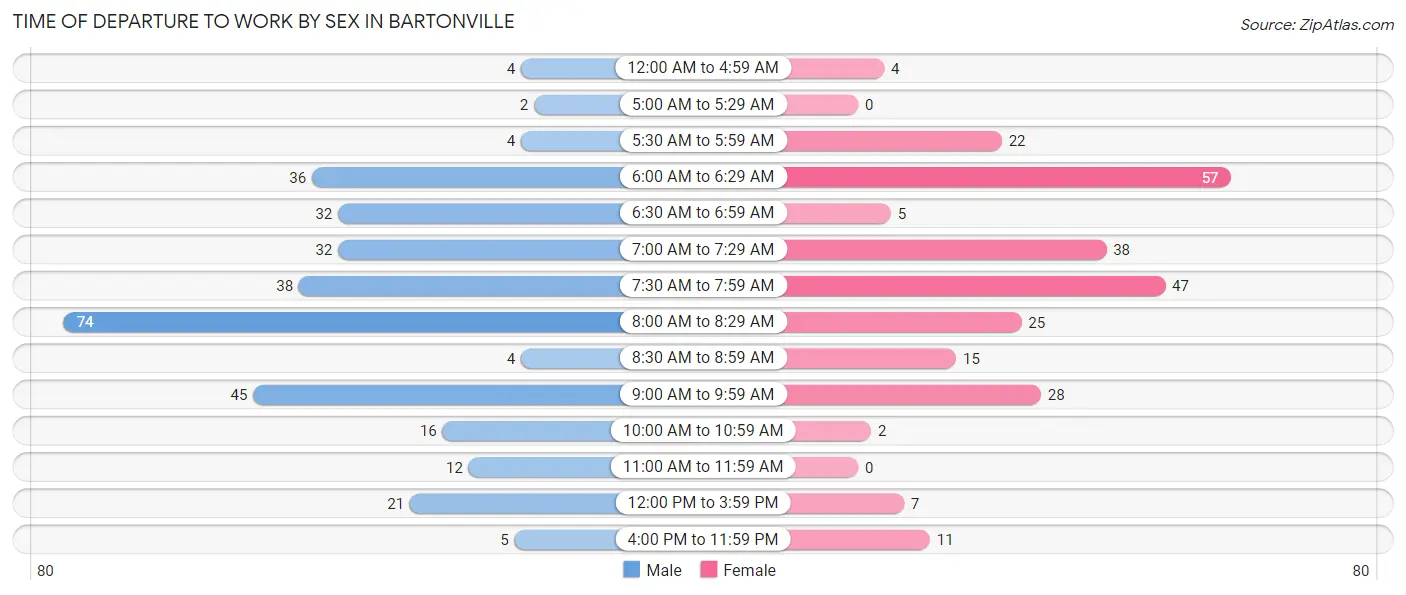
| Time of Departure | Male | Female |
| 12:00 AM to 4:59 AM | 4 (1.2%) | 4 (1.5%) |
| 5:00 AM to 5:29 AM | 2 (0.6%) | 0 (0.0%) |
| 5:30 AM to 5:59 AM | 4 (1.2%) | 22 (8.4%) |
| 6:00 AM to 6:29 AM | 36 (11.1%) | 57 (21.8%) |
| 6:30 AM to 6:59 AM | 32 (9.9%) | 5 (1.9%) |
| 7:00 AM to 7:29 AM | 32 (9.9%) | 38 (14.6%) |
| 7:30 AM to 7:59 AM | 38 (11.7%) | 47 (18.0%) |
| 8:00 AM to 8:29 AM | 74 (22.8%) | 25 (9.6%) |
| 8:30 AM to 8:59 AM | 4 (1.2%) | 15 (5.8%) |
| 9:00 AM to 9:59 AM | 45 (13.9%) | 28 (10.7%) |
| 10:00 AM to 10:59 AM | 16 (4.9%) | 2 (0.8%) |
| 11:00 AM to 11:59 AM | 12 (3.7%) | 0 (0.0%) |
| 12:00 PM to 3:59 PM | 21 (6.5%) | 7 (2.7%) |
| 4:00 PM to 11:59 PM | 5 (1.5%) | 11 (4.2%) |
| Total | 325 (100.0%) | 261 (100.0%) |
Housing Occupancy in Bartonville
Occupancy by Ownership in Bartonville
Of the total 664 dwellings in Bartonville, owner-occupied units account for 607 (91.4%), while renter-occupied units make up 57 (8.6%).
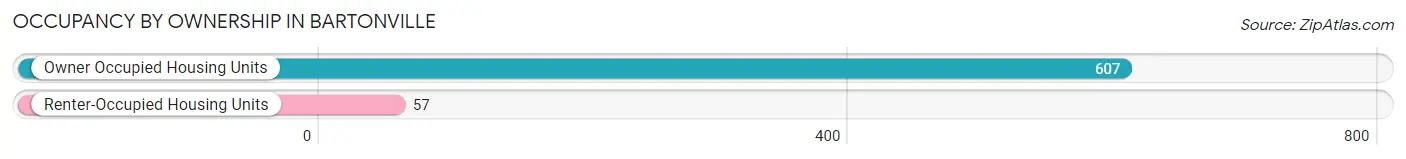
| Occupancy | # Housing Units | % Housing Units |
| Owner Occupied Housing Units | 607 | 91.4% |
| Renter-Occupied Housing Units | 57 | 8.6% |
| Total Occupied Housing Units | 664 | 100.0% |
Occupancy by Household Size in Bartonville
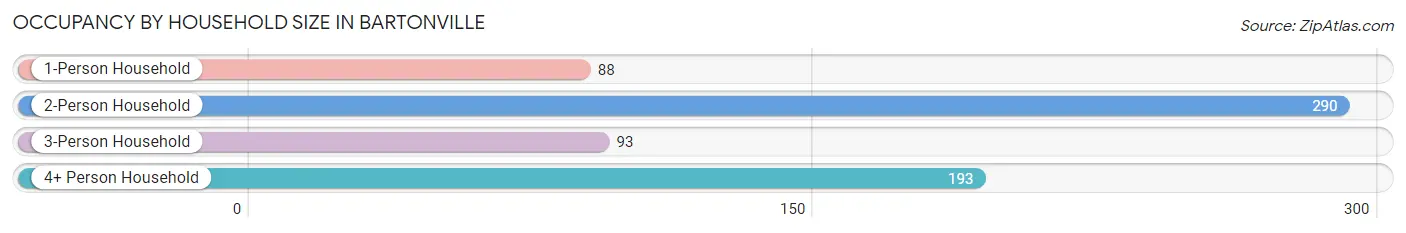
| Household Size | # Housing Units | % Housing Units |
| 1-Person Household | 88 | 13.3% |
| 2-Person Household | 290 | 43.7% |
| 3-Person Household | 93 | 14.0% |
| 4+ Person Household | 193 | 29.1% |
| Total Housing Units | 664 | 100.0% |
Occupancy by Ownership by Household Size in Bartonville
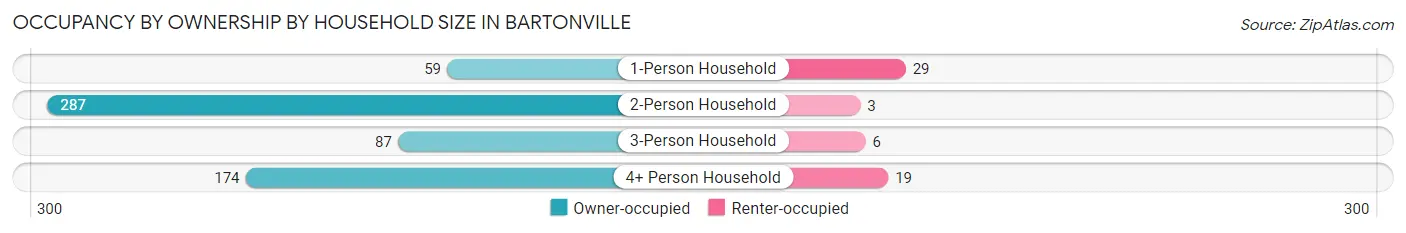
| Household Size | Owner-occupied | Renter-occupied |
| 1-Person Household | 59 (67.0%) | 29 (33.0%) |
| 2-Person Household | 287 (99.0%) | 3 (1.0%) |
| 3-Person Household | 87 (93.5%) | 6 (6.5%) |
| 4+ Person Household | 174 (90.2%) | 19 (9.8%) |
| Total Housing Units | 607 (91.4%) | 57 (8.6%) |
Occupancy by Educational Attainment in Bartonville
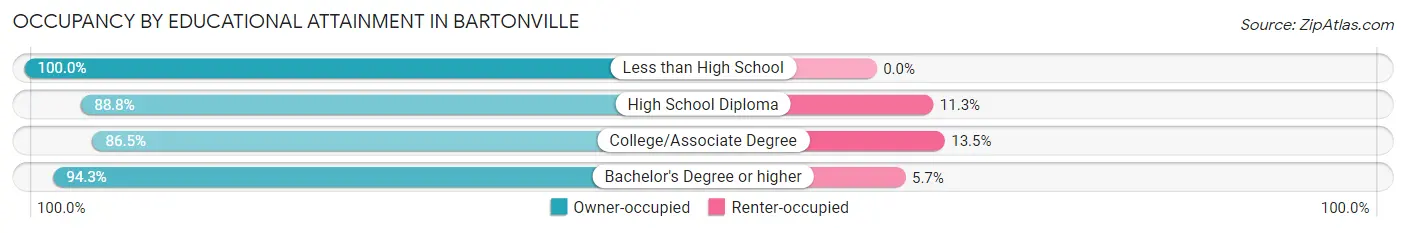
| Household Size | Owner-occupied | Renter-occupied |
| Less than High School | 17 (100.0%) | 0 (0.0%) |
| High School Diploma | 71 (88.7%) | 9 (11.3%) |
| College/Associate Degree | 173 (86.5%) | 27 (13.5%) |
| Bachelor's Degree or higher | 346 (94.3%) | 21 (5.7%) |
Occupancy by Age of Householder in Bartonville
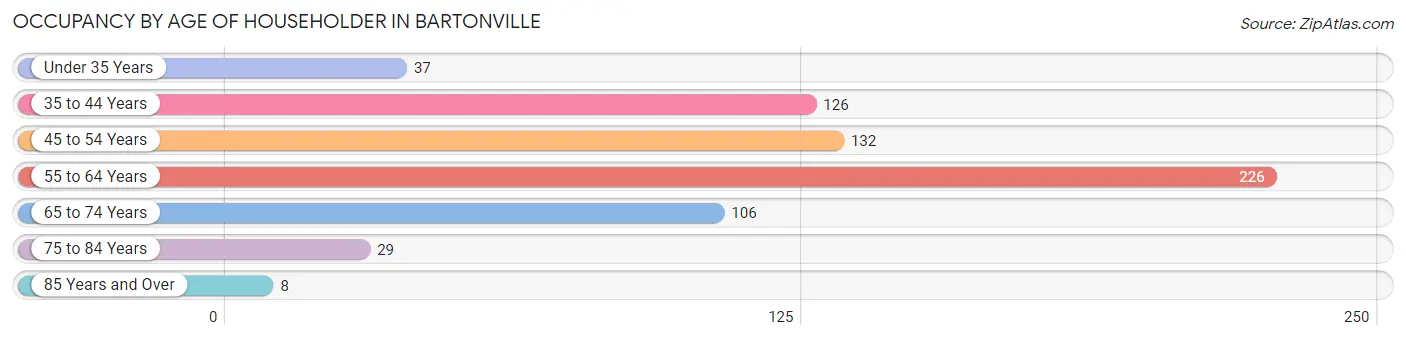
| Age Bracket | # Households | % Households |
| Under 35 Years | 37 | 5.6% |
| 35 to 44 Years | 126 | 19.0% |
| 45 to 54 Years | 132 | 19.9% |
| 55 to 64 Years | 226 | 34.0% |
| 65 to 74 Years | 106 | 16.0% |
| 75 to 84 Years | 29 | 4.4% |
| 85 Years and Over | 8 | 1.2% |
| Total | 664 | 100.0% |
Housing Finances in Bartonville
Median Income by Occupancy in Bartonville
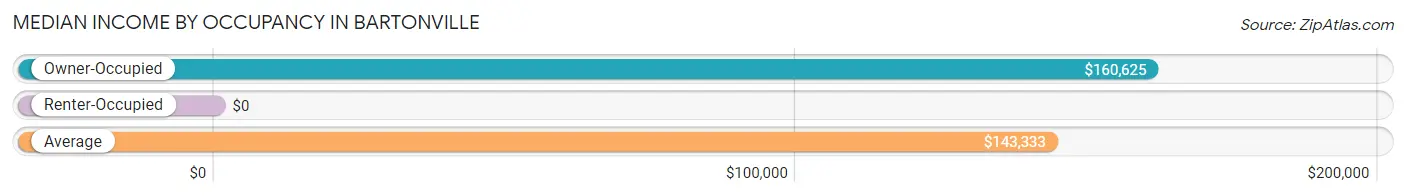
| Occupancy Type | # Households | Median Income |
| Owner-Occupied | 607 (91.4%) | $160,625 |
| Renter-Occupied | 57 (8.6%) | $0 |
| Average | 664 (100.0%) | $143,333 |
Occupancy by Householder Income Bracket in Bartonville
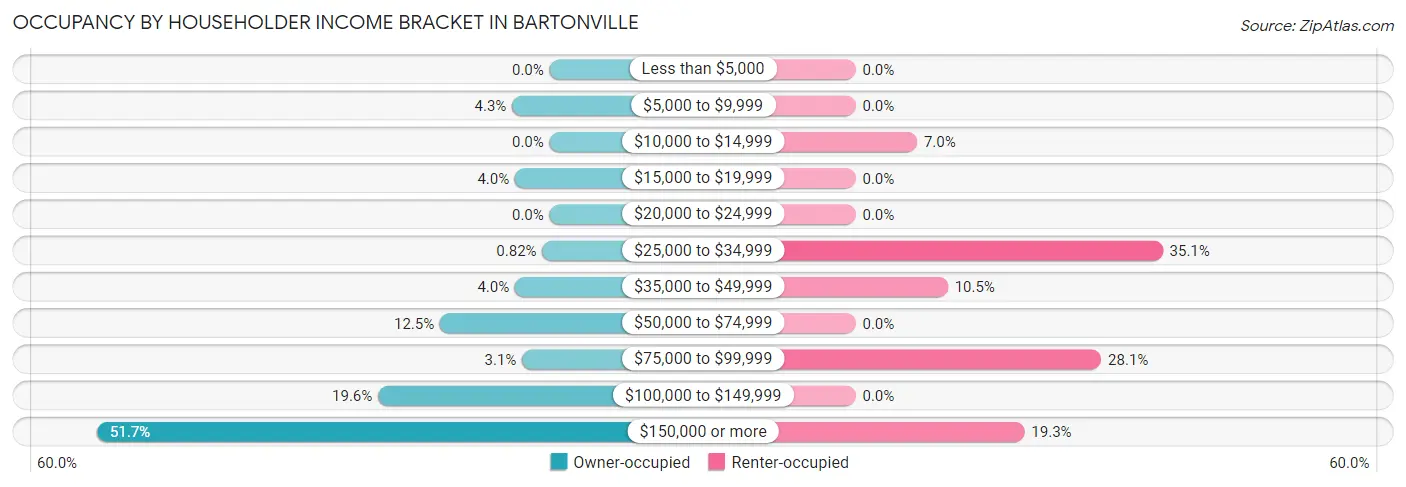
| Income Bracket | Owner-occupied | Renter-occupied |
| Less than $5,000 | 0 (0.0%) | 0 (0.0%) |
| $5,000 to $9,999 | 26 (4.3%) | 0 (0.0%) |
| $10,000 to $14,999 | 0 (0.0%) | 4 (7.0%) |
| $15,000 to $19,999 | 24 (4.0%) | 0 (0.0%) |
| $20,000 to $24,999 | 0 (0.0%) | 0 (0.0%) |
| $25,000 to $34,999 | 5 (0.8%) | 20 (35.1%) |
| $35,000 to $49,999 | 24 (4.0%) | 6 (10.5%) |
| $50,000 to $74,999 | 76 (12.5%) | 0 (0.0%) |
| $75,000 to $99,999 | 19 (3.1%) | 16 (28.1%) |
| $100,000 to $149,999 | 119 (19.6%) | 0 (0.0%) |
| $150,000 or more | 314 (51.7%) | 11 (19.3%) |
| Total | 607 (100.0%) | 57 (100.0%) |
Monthly Housing Cost Tiers in Bartonville
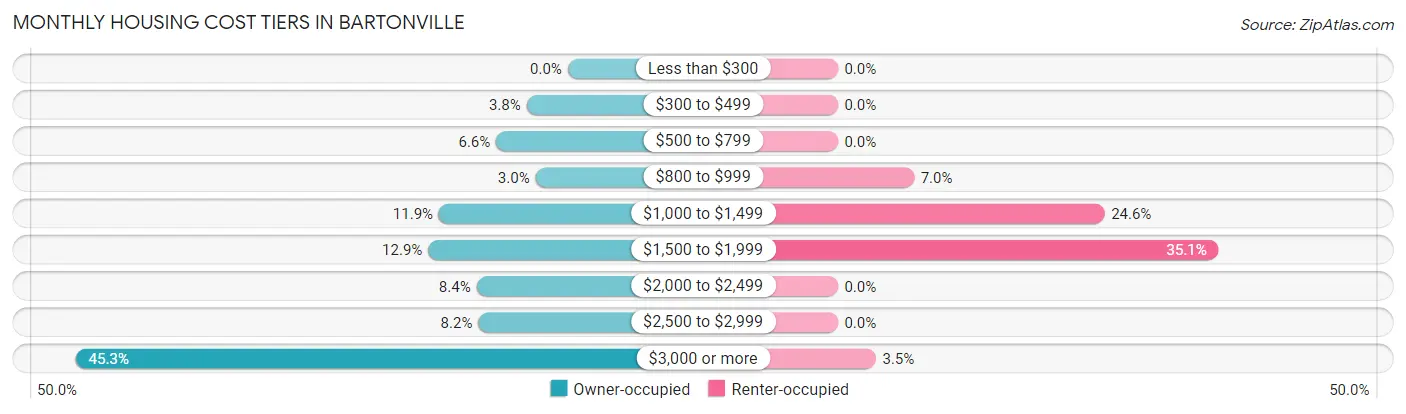
| Monthly Cost | Owner-occupied | Renter-occupied |
| Less than $300 | 0 (0.0%) | 0 (0.0%) |
| $300 to $499 | 23 (3.8%) | 0 (0.0%) |
| $500 to $799 | 40 (6.6%) | 0 (0.0%) |
| $800 to $999 | 18 (3.0%) | 4 (7.0%) |
| $1,000 to $1,499 | 72 (11.9%) | 14 (24.6%) |
| $1,500 to $1,999 | 78 (12.9%) | 20 (35.1%) |
| $2,000 to $2,499 | 51 (8.4%) | 0 (0.0%) |
| $2,500 to $2,999 | 50 (8.2%) | 0 (0.0%) |
| $3,000 or more | 275 (45.3%) | 2 (3.5%) |
| Total | 607 (100.0%) | 57 (100.0%) |
Physical Housing Characteristics in Bartonville
Housing Structures in Bartonville
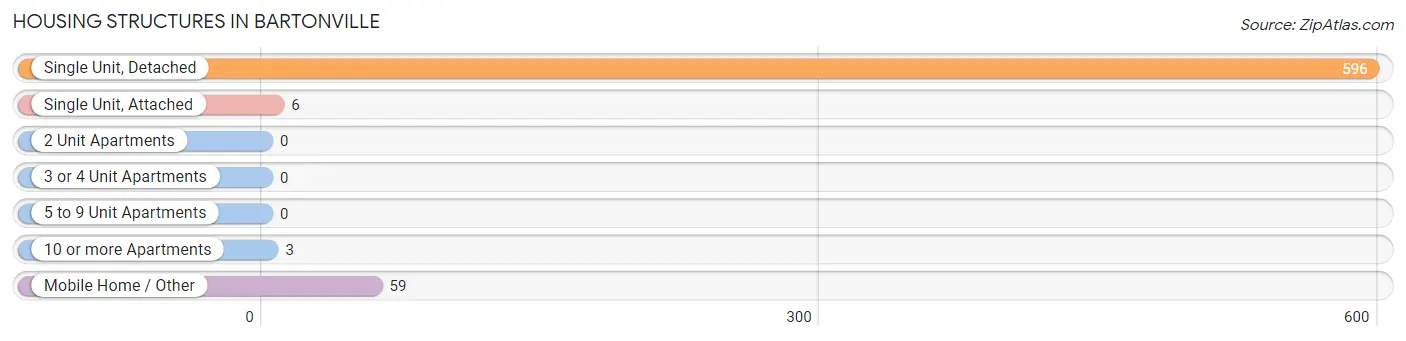
| Structure Type | # Housing Units | % Housing Units |
| Single Unit, Detached | 596 | 89.8% |
| Single Unit, Attached | 6 | 0.9% |
| 2 Unit Apartments | 0 | 0.0% |
| 3 or 4 Unit Apartments | 0 | 0.0% |
| 5 to 9 Unit Apartments | 0 | 0.0% |
| 10 or more Apartments | 3 | 0.4% |
| Mobile Home / Other | 59 | 8.9% |
| Total | 664 | 100.0% |
Housing Structures by Occupancy in Bartonville
| Structure Type | Owner-occupied | Renter-occupied |
| Single Unit, Detached | 548 (91.9%) | 48 (8.1%) |
| Single Unit, Attached | 3 (50.0%) | 3 (50.0%) |
| 2 Unit Apartments | 0 (0.0%) | 0 (0.0%) |
| 3 or 4 Unit Apartments | 0 (0.0%) | 0 (0.0%) |
| 5 to 9 Unit Apartments | 0 (0.0%) | 0 (0.0%) |
| 10 or more Apartments | 0 (0.0%) | 3 (100.0%) |
| Mobile Home / Other | 56 (94.9%) | 3 (5.1%) |
| Total | 607 (91.4%) | 57 (8.6%) |
Housing Structures by Number of Rooms in Bartonville
| Number of Rooms | Owner-occupied | Renter-occupied |
| 1 Room | 0 (0.0%) | 0 (0.0%) |
| 2 or 3 Rooms | 5 (0.8%) | 23 (40.4%) |
| 4 or 5 Rooms | 68 (11.2%) | 25 (43.9%) |
| 6 or 7 Rooms | 122 (20.1%) | 7 (12.3%) |
| 8 or more Rooms | 412 (67.9%) | 2 (3.5%) |
| Total | 607 (100.0%) | 57 (100.0%) |
Housing Structure by Heating Type in Bartonville
| Heating Type | Owner-occupied | Renter-occupied |
| Utility Gas | 123 (20.3%) | 6 (10.5%) |
| Bottled, Tank, or LP Gas | 158 (26.0%) | 8 (14.0%) |
| Electricity | 322 (53.0%) | 43 (75.4%) |
| Fuel Oil or Kerosene | 0 (0.0%) | 0 (0.0%) |
| Coal or Coke | 0 (0.0%) | 0 (0.0%) |
| All other Fuels | 4 (0.7%) | 0 (0.0%) |
| No Fuel Used | 0 (0.0%) | 0 (0.0%) |
| Total | 607 (100.0%) | 57 (100.0%) |
Household Vehicle Usage in Bartonville
| Vehicles per Household | Owner-occupied | Renter-occupied |
| No Vehicle | 0 (0.0%) | 0 (0.0%) |
| 1 Vehicle | 37 (6.1%) | 29 (50.9%) |
| 2 Vehicles | 282 (46.5%) | 17 (29.8%) |
| 3 or more Vehicles | 288 (47.4%) | 11 (19.3%) |
| Total | 607 (100.0%) | 57 (100.0%) |
Real Estate & Mortgages in Bartonville
Real Estate and Mortgage Overview in Bartonville
| Characteristic | Without Mortgage | With Mortgage |
| Housing Units | 266 | 341 |
| Median Property Value | $797,600 | $973,800 |
| Median Household Income | $150,833 | $180 |
| Monthly Housing Costs | $1,442 | $235 |
| Real Estate Taxes | $9,500 | $0 |
Property Value by Mortgage Status in Bartonville
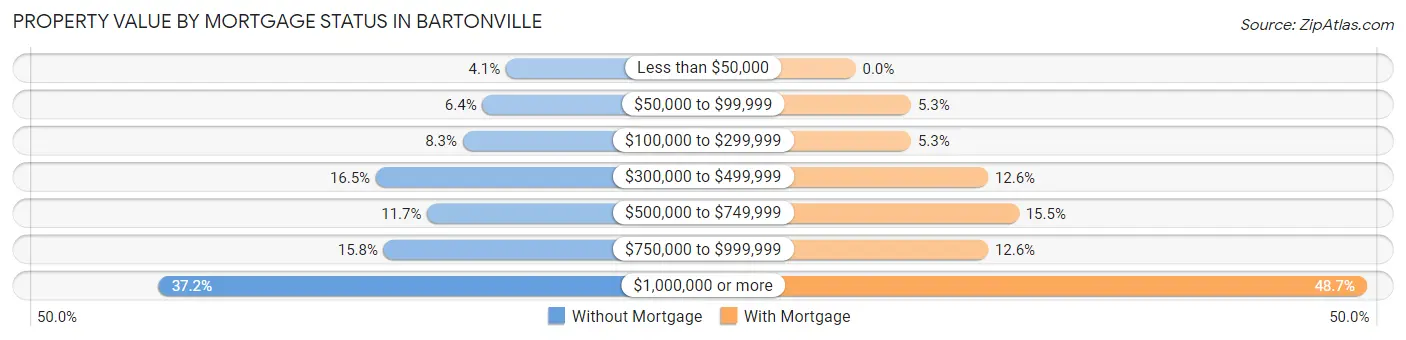
| Property Value | Without Mortgage | With Mortgage |
| Less than $50,000 | 11 (4.1%) | 0 (0.0%) |
| $50,000 to $99,999 | 17 (6.4%) | 18 (5.3%) |
| $100,000 to $299,999 | 22 (8.3%) | 18 (5.3%) |
| $300,000 to $499,999 | 44 (16.5%) | 43 (12.6%) |
| $500,000 to $749,999 | 31 (11.7%) | 53 (15.5%) |
| $750,000 to $999,999 | 42 (15.8%) | 43 (12.6%) |
| $1,000,000 or more | 99 (37.2%) | 166 (48.7%) |
| Total | 266 (100.0%) | 341 (100.0%) |
Household Income by Mortgage Status in Bartonville
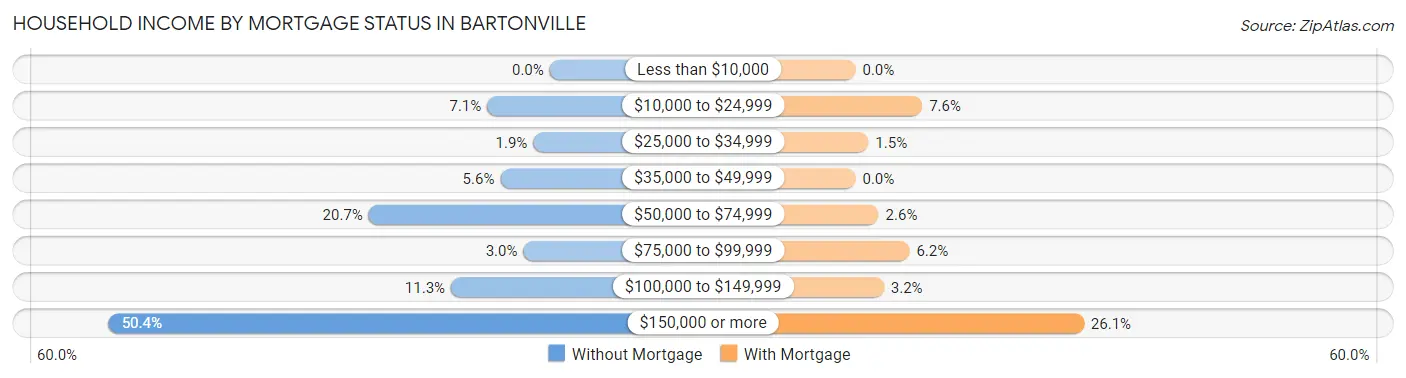
| Household Income | Without Mortgage | With Mortgage |
| Less than $10,000 | 0 (0.0%) | 0 (0.0%) |
| $10,000 to $24,999 | 19 (7.1%) | 26 (7.6%) |
| $25,000 to $34,999 | 5 (1.9%) | 5 (1.5%) |
| $35,000 to $49,999 | 15 (5.6%) | 0 (0.0%) |
| $50,000 to $74,999 | 55 (20.7%) | 9 (2.6%) |
| $75,000 to $99,999 | 8 (3.0%) | 21 (6.2%) |
| $100,000 to $149,999 | 30 (11.3%) | 11 (3.2%) |
| $150,000 or more | 134 (50.4%) | 89 (26.1%) |
| Total | 266 (100.0%) | 341 (100.0%) |
Property Value to Household Income Ratio in Bartonville
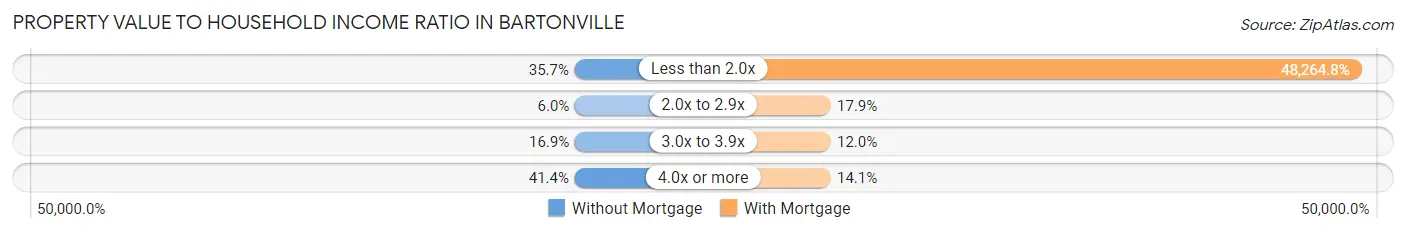
| Value-to-Income Ratio | Without Mortgage | With Mortgage |
| Less than 2.0x | 95 (35.7%) | 164,583 (48,264.8%) |
| 2.0x to 2.9x | 16 (6.0%) | 61 (17.9%) |
| 3.0x to 3.9x | 45 (16.9%) | 41 (12.0%) |
| 4.0x or more | 110 (41.3%) | 48 (14.1%) |
| Total | 266 (100.0%) | 341 (100.0%) |
Real Estate Taxes by Mortgage Status in Bartonville
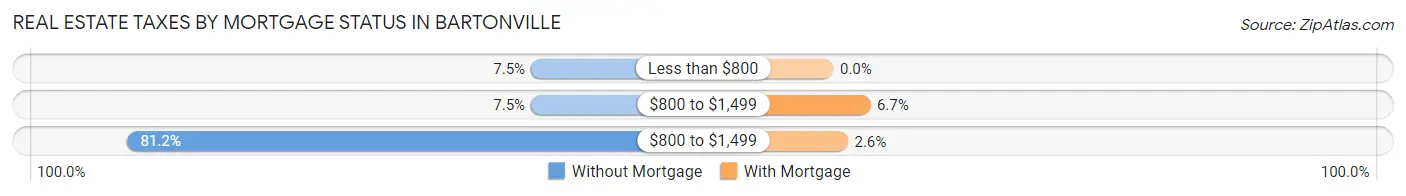
| Property Taxes | Without Mortgage | With Mortgage |
| Less than $800 | 20 (7.5%) | 0 (0.0%) |
| $800 to $1,499 | 20 (7.5%) | 23 (6.7%) |
| $800 to $1,499 | 216 (81.2%) | 9 (2.6%) |
| Total | 266 (100.0%) | 341 (100.0%) |
Health & Disability in Bartonville
Health Insurance Coverage by Age in Bartonville
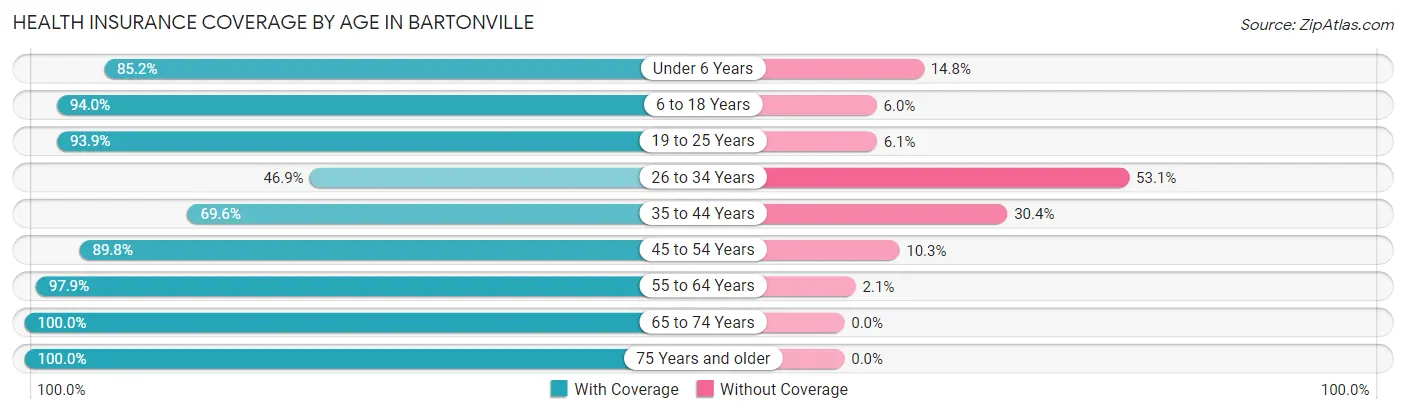
| Age Bracket | With Coverage | Without Coverage |
| Under 6 Years | 138 (85.2%) | 24 (14.8%) |
| 6 to 18 Years | 359 (94.0%) | 23 (6.0%) |
| 19 to 25 Years | 62 (93.9%) | 4 (6.1%) |
| 26 to 34 Years | 30 (46.9%) | 34 (53.1%) |
| 35 to 44 Years | 197 (69.6%) | 86 (30.4%) |
| 45 to 54 Years | 324 (89.7%) | 37 (10.2%) |
| 55 to 64 Years | 372 (97.9%) | 8 (2.1%) |
| 65 to 74 Years | 163 (100.0%) | 0 (0.0%) |
| 75 Years and older | 96 (100.0%) | 0 (0.0%) |
| Total | 1,741 (89.0%) | 216 (11.0%) |
Health Insurance Coverage by Citizenship Status in Bartonville
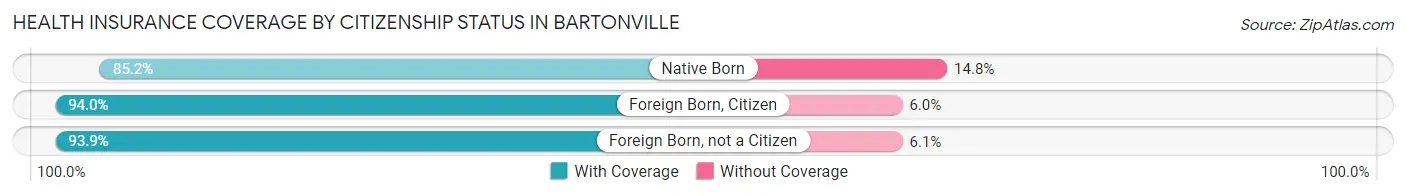
| Citizenship Status | With Coverage | Without Coverage |
| Native Born | 138 (85.2%) | 24 (14.8%) |
| Foreign Born, Citizen | 359 (94.0%) | 23 (6.0%) |
| Foreign Born, not a Citizen | 62 (93.9%) | 4 (6.1%) |
Health Insurance Coverage by Household Income in Bartonville
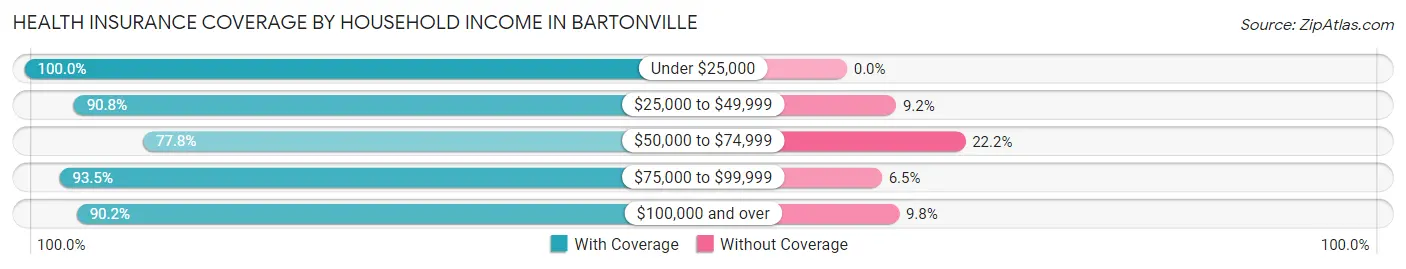
| Household Income | With Coverage | Without Coverage |
| Under $25,000 | 101 (100.0%) | 0 (0.0%) |
| $25,000 to $49,999 | 69 (90.8%) | 7 (9.2%) |
| $50,000 to $74,999 | 242 (77.8%) | 69 (22.2%) |
| $75,000 to $99,999 | 100 (93.5%) | 7 (6.5%) |
| $100,000 and over | 1,229 (90.2%) | 133 (9.8%) |
Public vs Private Health Insurance Coverage by Age in Bartonville
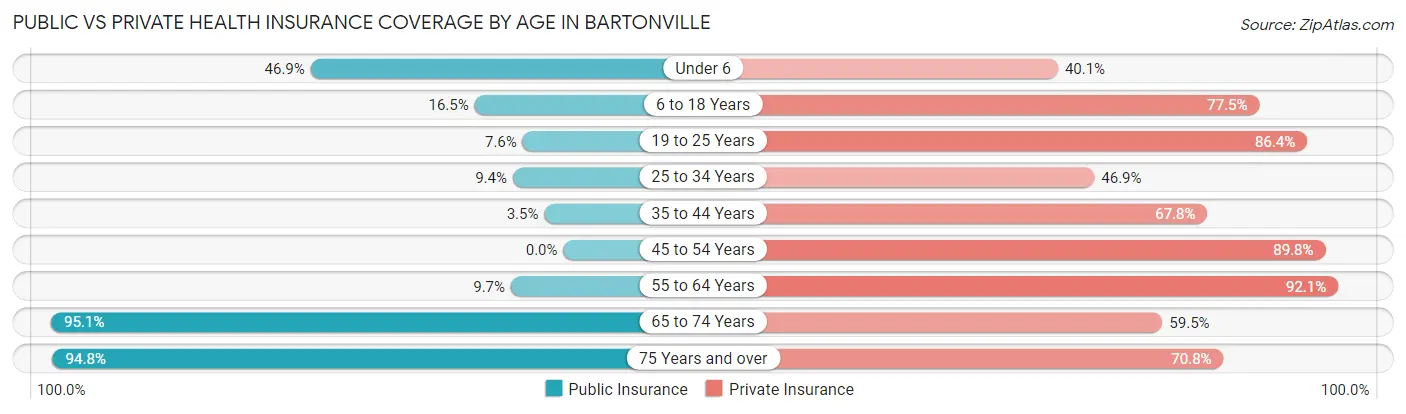
| Age Bracket | Public Insurance | Private Insurance |
| Under 6 | 76 (46.9%) | 65 (40.1%) |
| 6 to 18 Years | 63 (16.5%) | 296 (77.5%) |
| 19 to 25 Years | 5 (7.6%) | 57 (86.4%) |
| 25 to 34 Years | 6 (9.4%) | 30 (46.9%) |
| 35 to 44 Years | 10 (3.5%) | 192 (67.8%) |
| 45 to 54 Years | 0 (0.0%) | 324 (89.7%) |
| 55 to 64 Years | 37 (9.7%) | 350 (92.1%) |
| 65 to 74 Years | 155 (95.1%) | 97 (59.5%) |
| 75 Years and over | 91 (94.8%) | 68 (70.8%) |
| Total | 443 (22.6%) | 1,479 (75.6%) |
Disability Status by Sex by Age in Bartonville
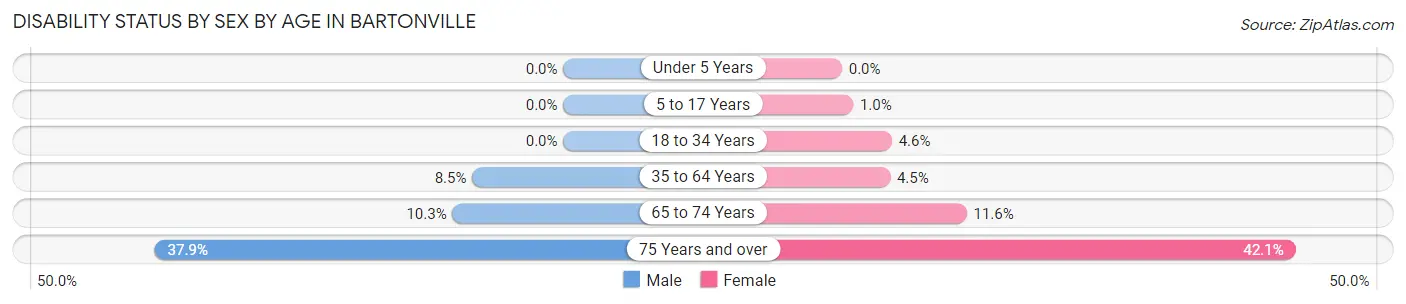
| Age Bracket | Male | Female |
| Under 5 Years | 0 (0.0%) | 0 (0.0%) |
| 5 to 17 Years | 0 (0.0%) | 2 (1.0%) |
| 18 to 34 Years | 0 (0.0%) | 5 (4.6%) |
| 35 to 64 Years | 43 (8.5%) | 23 (4.5%) |
| 65 to 74 Years | 7 (10.3%) | 11 (11.6%) |
| 75 Years and over | 22 (37.9%) | 16 (42.1%) |
Disability Class by Sex by Age in Bartonville
Disability Class: Hearing Difficulty
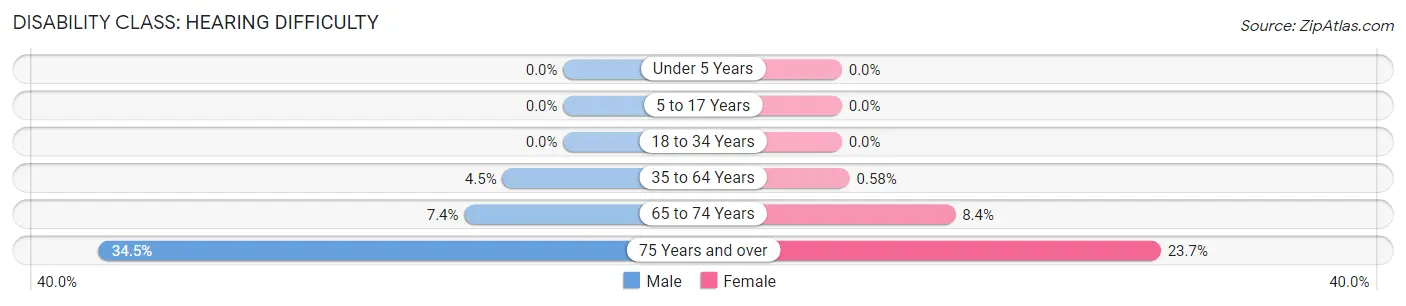
| Age Bracket | Male | Female |
| Under 5 Years | 0 (0.0%) | 0 (0.0%) |
| 5 to 17 Years | 0 (0.0%) | 0 (0.0%) |
| 18 to 34 Years | 0 (0.0%) | 0 (0.0%) |
| 35 to 64 Years | 23 (4.5%) | 3 (0.6%) |
| 65 to 74 Years | 5 (7.3%) | 8 (8.4%) |
| 75 Years and over | 20 (34.5%) | 9 (23.7%) |
Disability Class: Vision Difficulty
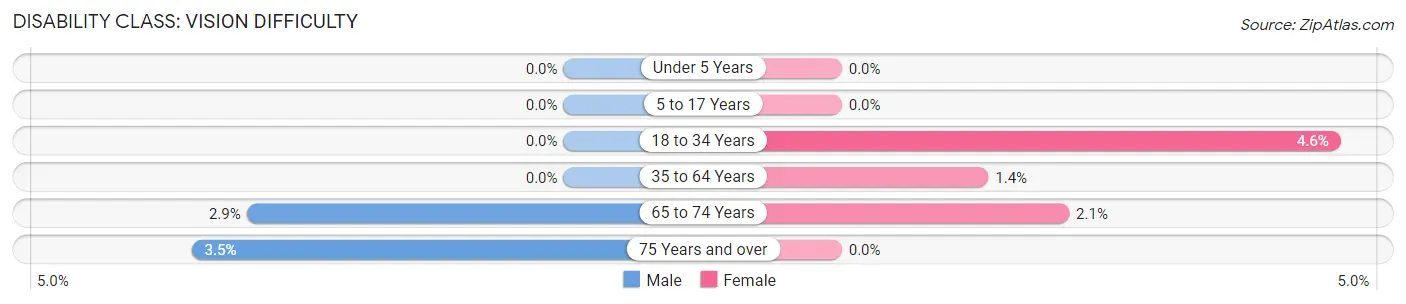
| Age Bracket | Male | Female |
| Under 5 Years | 0 (0.0%) | 0 (0.0%) |
| 5 to 17 Years | 0 (0.0%) | 0 (0.0%) |
| 18 to 34 Years | 0 (0.0%) | 5 (4.6%) |
| 35 to 64 Years | 0 (0.0%) | 7 (1.4%) |
| 65 to 74 Years | 2 (2.9%) | 2 (2.1%) |
| 75 Years and over | 2 (3.5%) | 0 (0.0%) |
Disability Class: Cognitive Difficulty
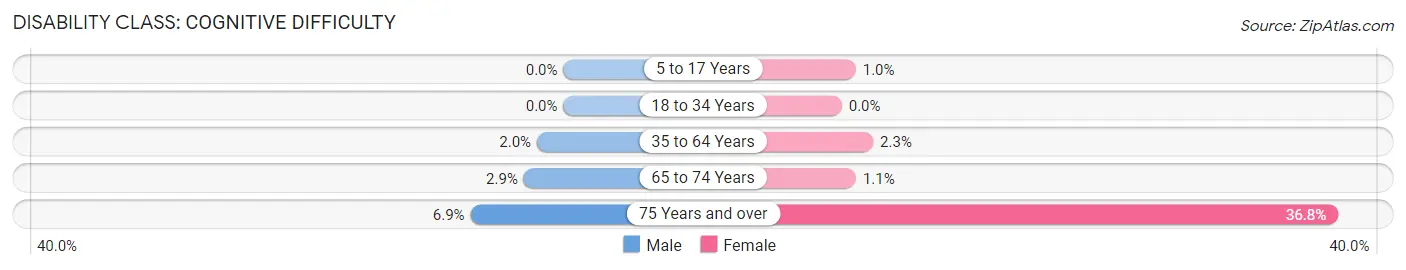
| Age Bracket | Male | Female |
| 5 to 17 Years | 0 (0.0%) | 2 (1.0%) |
| 18 to 34 Years | 0 (0.0%) | 0 (0.0%) |
| 35 to 64 Years | 10 (2.0%) | 12 (2.3%) |
| 65 to 74 Years | 2 (2.9%) | 1 (1.1%) |
| 75 Years and over | 4 (6.9%) | 14 (36.8%) |
Disability Class: Ambulatory Difficulty
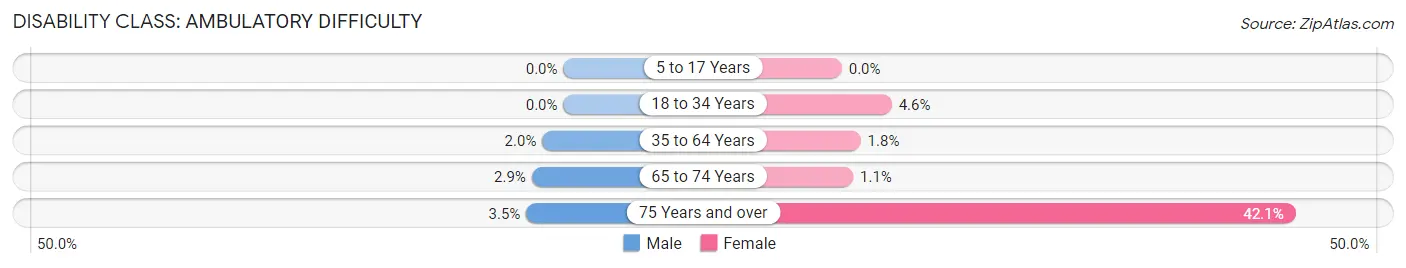
| Age Bracket | Male | Female |
| 5 to 17 Years | 0 (0.0%) | 0 (0.0%) |
| 18 to 34 Years | 0 (0.0%) | 5 (4.6%) |
| 35 to 64 Years | 10 (2.0%) | 9 (1.8%) |
| 65 to 74 Years | 2 (2.9%) | 1 (1.1%) |
| 75 Years and over | 2 (3.5%) | 16 (42.1%) |
Disability Class: Self-Care Difficulty
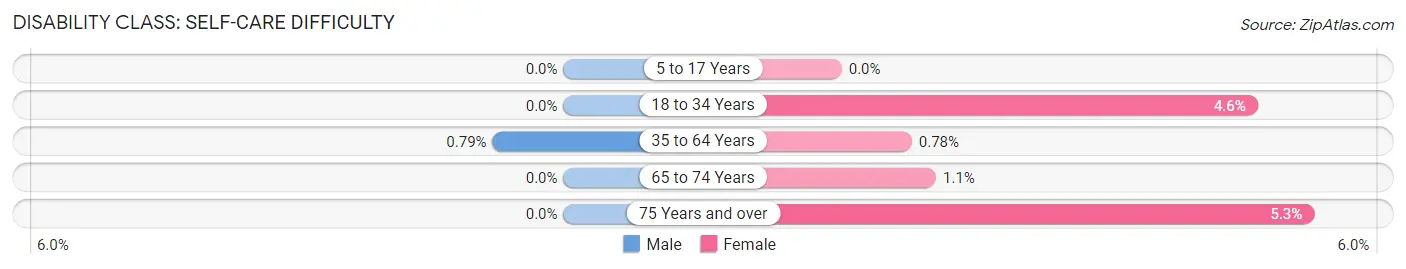
| Age Bracket | Male | Female |
| 5 to 17 Years | 0 (0.0%) | 0 (0.0%) |
| 18 to 34 Years | 0 (0.0%) | 5 (4.6%) |
| 35 to 64 Years | 4 (0.8%) | 4 (0.8%) |
| 65 to 74 Years | 0 (0.0%) | 1 (1.1%) |
| 75 Years and over | 0 (0.0%) | 2 (5.3%) |
Technology Access in Bartonville
Computing Device Access in Bartonville
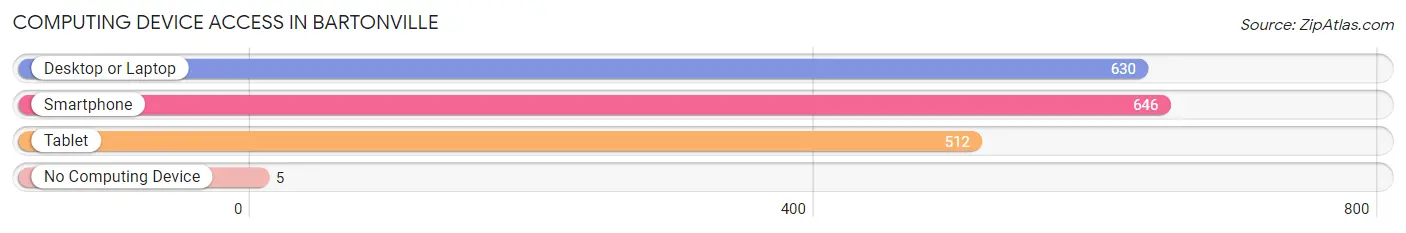
| Device Type | # Households | % Households |
| Desktop or Laptop | 630 | 94.9% |
| Smartphone | 646 | 97.3% |
| Tablet | 512 | 77.1% |
| No Computing Device | 5 | 0.7% |
| Total | 664 | 100.0% |
Internet Access in Bartonville
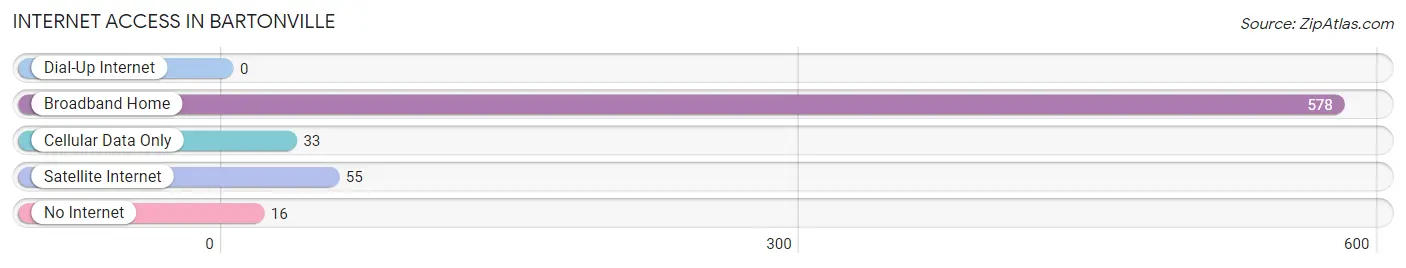
| Internet Type | # Households | % Households |
| Dial-Up Internet | 0 | 0.0% |
| Broadband Home | 578 | 87.1% |
| Cellular Data Only | 33 | 5.0% |
| Satellite Internet | 55 | 8.3% |
| No Internet | 16 | 2.4% |
| Total | 664 | 100.0% |
Bartonville Summary
Bartonville is a small town located in Denton County, Texas, United States. It is situated in the northern part of the county, about 20 miles northwest of the city of Dallas. The town was founded in 1881 and incorporated in 1983. As of the 2010 census, the population of Bartonville was 1,634.
History
The area that is now Bartonville was first settled in the late 1850s by a group of German immigrants. The town was originally known as “Dry Creek”, but was later renamed “Bartonville” in honor of William Barton, who was a prominent local landowner.
In 1881, the town was officially incorporated and the first post office was established. The town grew slowly over the next few decades, but experienced a period of rapid growth in the 1950s and 1960s. During this time, the population of Bartonville increased from just over 500 to nearly 1,000.
Geography
Bartonville is located in northern Denton County, about 20 miles northwest of the city of Dallas. The town is situated on the western edge of the Dallas-Fort Worth Metroplex. The town is bordered to the north by the city of Flower Mound, to the east by the city of Double Oak, to the south by the city of Argyle, and to the west by the city of Copper Canyon.
The town covers an area of approximately 4.5 square miles, with a total population of 1,634 as of the 2010 census. The town is served by the Denton County Transportation Authority, which provides bus service to the surrounding area.
Economy
The economy of Bartonville is largely based on agriculture and light industry. The town is home to several small businesses, including a feed store, a hardware store, and a grocery store. The town is also home to several wineries, which produce a variety of wines.
The town is also home to several large employers, including the Bartonville Town Center, a shopping center that features a variety of stores and restaurants. The town is also home to several medical facilities, including the Bartonville Medical Center and the Bartonville Family Practice.
Demographics
As of the 2010 census, the population of Bartonville was 1,634. The racial makeup of the town was 94.3% White, 0.9% African American, 0.3% Native American, 0.7% Asian, 0.1% Pacific Islander, 1.7% from other races, and 2.0% from two or more races. Hispanic or Latino of any race were 5.2% of the population.
The median income for a household in Bartonville was $68,750, and the median income for a family was $76,250. The per capita income for the town was $30,945. About 4.3% of families and 5.2% of the population were below the poverty line, including 6.2% of those under age 18 and 4.3% of those age 65 or over.
Conclusion
Bartonville is a small town located in Denton County, Texas, United States. It was founded in 1881 and incorporated in 1983. The town has a population of 1,634 as of the 2010 census. The economy of Bartonville is largely based on agriculture and light industry, and the town is home to several small businesses, wineries, and large employers. The racial makeup of the town is 94.3% White, 0.9% African American, 0.3% Native American, 0.7% Asian, 0.1% Pacific Islander, 1.7% from other races, and 2.0% from two or more races. The median income for a household in Bartonville was $68,750, and the median income for a family was $76,250.
Common Questions
What is Per Capita Income in Bartonville?
Per Capita income in Bartonville is $77,285.
What is the Median Family Income in Bartonville?
Median Family Income in Bartonville is $171,250.
What is the Median Household income in Bartonville?
Median Household Income in Bartonville is $143,333.
What is Income or Wage Gap in Bartonville?
Income or Wage Gap in Bartonville is 37.0%.
Women in Bartonville earn 63.0 cents for every dollar earned by a man.
What is Inequality or Gini Index in Bartonville?
Inequality or Gini Index in Bartonville is 0.52.
What is the Total Population of Bartonville?
Total Population of Bartonville is 1,957.
What is the Total Male Population of Bartonville?
Total Male Population of Bartonville is 925.
What is the Total Female Population of Bartonville?
Total Female Population of Bartonville is 1,032.
What is the Ratio of Males per 100 Females in Bartonville?
There are 89.63 Males per 100 Females in Bartonville.
What is the Ratio of Females per 100 Males in Bartonville?
There are 111.57 Females per 100 Males in Bartonville.
What is the Median Population Age in Bartonville?
Median Population Age in Bartonville is 46.7 Years.
What is the Average Family Size in Bartonville
Average Family Size in Bartonville is 3.2 People.
What is the Average Household Size in Bartonville
Average Household Size in Bartonville is 3.0 People.
How Large is the Labor Force in Bartonville?
There are 898 People in the Labor Forcein in Bartonville.
What is the Percentage of People in the Labor Force in Bartonville?
59.3% of People are in the Labor Force in Bartonville.
What is the Unemployment Rate in Bartonville?
Unemployment Rate in Bartonville is 2.4%.