Farmers Branch, TX Map & Demographics
Farmers Branch Map
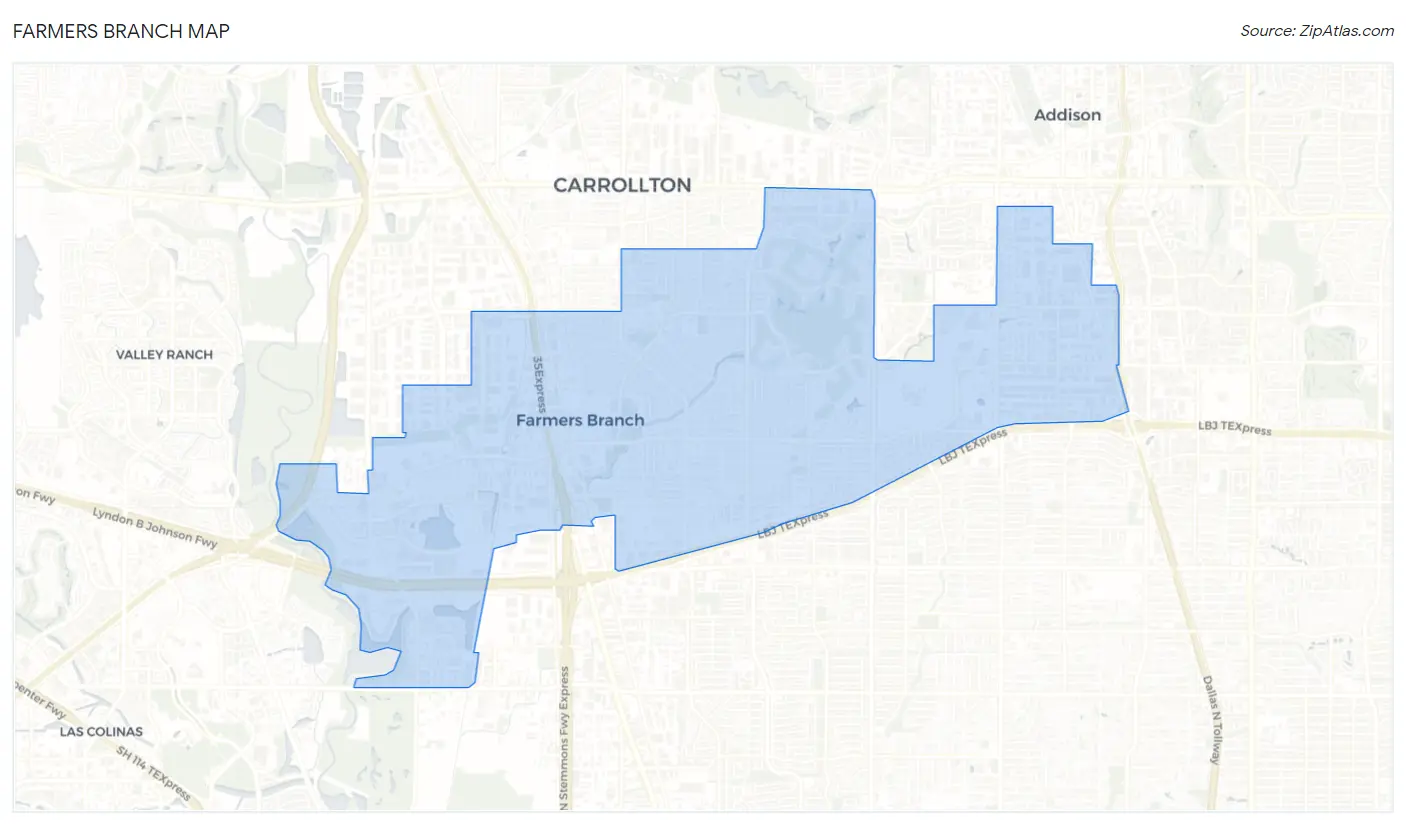
Farmers Branch Overview
$43,681
PER CAPITA INCOME
$100,452
AVG FAMILY INCOME
$88,282
AVG HOUSEHOLD INCOME
13.6%
WAGE / INCOME GAP [ % ]
86.4¢/ $1
WAGE / INCOME GAP [ $ ]
$11,356
FAMILY INCOME DEFICIT
0.39
INEQUALITY / GINI INDEX
35,985
TOTAL POPULATION
18,003
MALE POPULATION
17,982
FEMALE POPULATION
100.12
MALES / 100 FEMALES
99.88
FEMALES / 100 MALES
34.1
MEDIAN AGE
3.2
AVG FAMILY SIZE
2.5
AVG HOUSEHOLD SIZE
22,542
LABOR FORCE [ PEOPLE ]
77.1%
PERCENT IN LABOR FORCE
2.9%
UNEMPLOYMENT RATE
Income in Farmers Branch
Income Overview in Farmers Branch
Per Capita Income in Farmers Branch is $43,681, while median incomes of families and households are $100,452 and $88,282 respectively.
| Characteristic | Number | Measure |
| Per Capita Income | 35,985 | $43,681 |
| Median Family Income | 8,454 | $100,452 |
| Mean Family Income | 8,454 | $119,041 |
| Median Household Income | 14,463 | $88,282 |
| Mean Household Income | 14,463 | $107,993 |
| Income Deficit | 8,454 | $11,356 |
| Wage / Income Gap (%) | 35,985 | 13.59% |
| Wage / Income Gap ($) | 35,985 | 86.41¢ per $1 |
| Gini / Inequality Index | 35,985 | 0.39 |
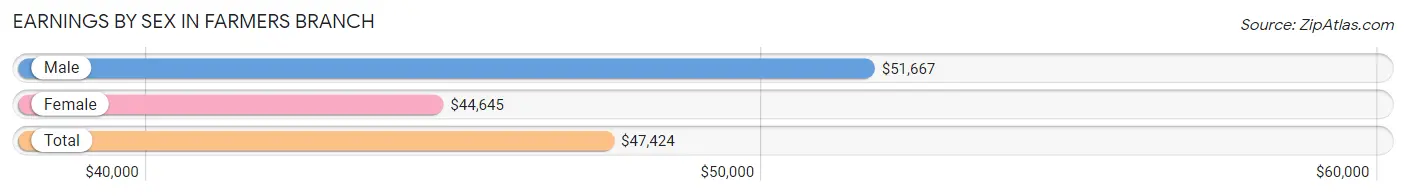
Earnings by Sex in Farmers Branch
Average Earnings in Farmers Branch are $47,424, $51,667 for men and $44,645 for women, a difference of 13.6%.
| Sex | Number | Average Earnings |
| Male | 11,934 (52.1%) | $51,667 |
| Female | 10,989 (47.9%) | $44,645 |
| Total | 22,923 (100.0%) | $47,424 |
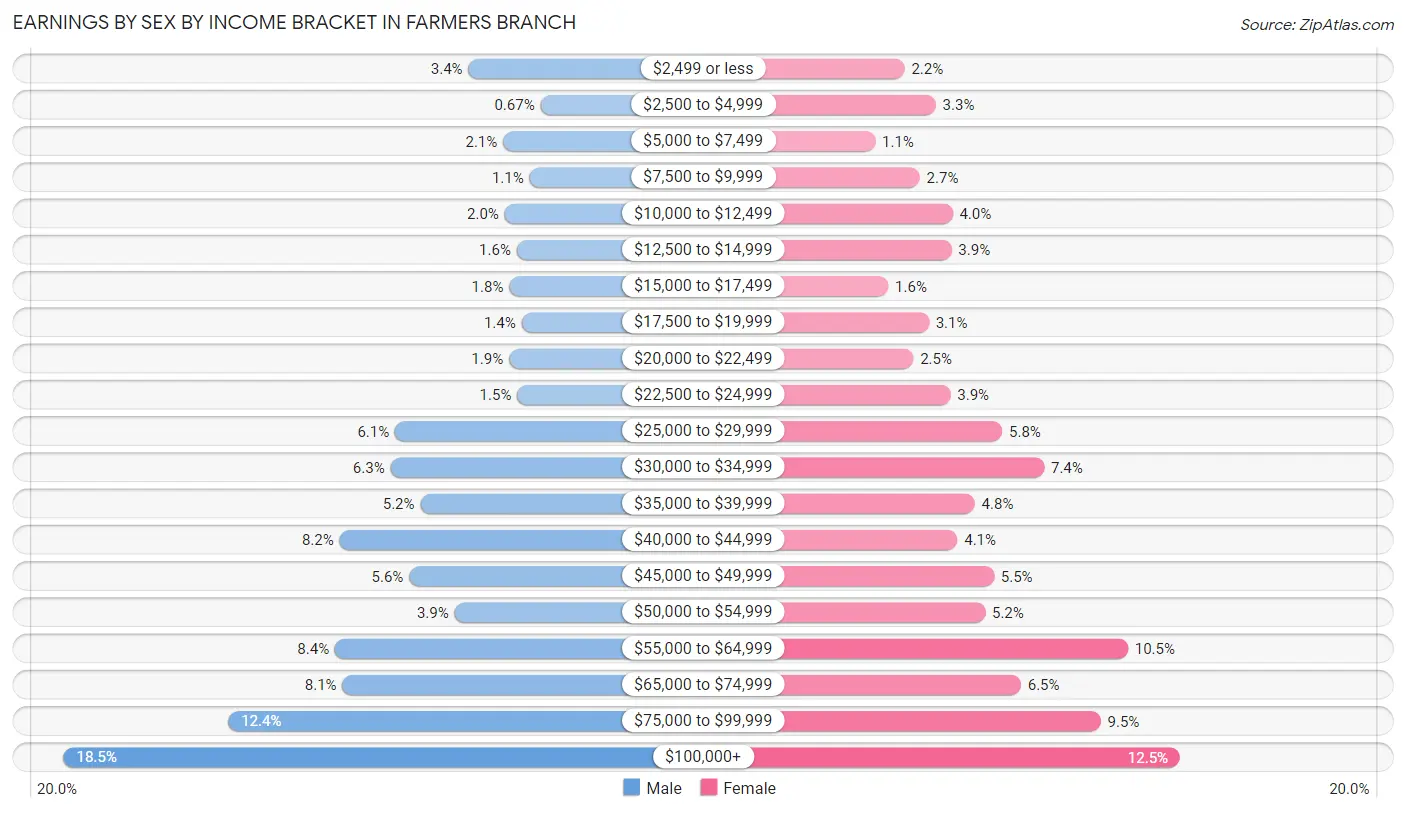
Earnings by Sex by Income Bracket in Farmers Branch
The most common earnings brackets in Farmers Branch are $100,000+ for men (2,213 | 18.5%) and $100,000+ for women (1,371 | 12.5%).
| Income | Male | Female |
| $2,499 or less | 402 (3.4%) | 237 (2.2%) |
| $2,500 to $4,999 | 80 (0.7%) | 366 (3.3%) |
| $5,000 to $7,499 | 247 (2.1%) | 116 (1.1%) |
| $7,500 to $9,999 | 129 (1.1%) | 300 (2.7%) |
| $10,000 to $12,499 | 240 (2.0%) | 435 (4.0%) |
| $12,500 to $14,999 | 186 (1.6%) | 431 (3.9%) |
| $15,000 to $17,499 | 220 (1.8%) | 170 (1.5%) |
| $17,500 to $19,999 | 165 (1.4%) | 337 (3.1%) |
| $20,000 to $22,499 | 221 (1.8%) | 274 (2.5%) |
| $22,500 to $24,999 | 184 (1.5%) | 426 (3.9%) |
| $25,000 to $29,999 | 730 (6.1%) | 640 (5.8%) |
| $30,000 to $34,999 | 751 (6.3%) | 812 (7.4%) |
| $35,000 to $39,999 | 617 (5.2%) | 526 (4.8%) |
| $40,000 to $44,999 | 978 (8.2%) | 455 (4.1%) |
| $45,000 to $49,999 | 667 (5.6%) | 605 (5.5%) |
| $50,000 to $54,999 | 464 (3.9%) | 569 (5.2%) |
| $55,000 to $64,999 | 999 (8.4%) | 1,157 (10.5%) |
| $65,000 to $74,999 | 965 (8.1%) | 717 (6.5%) |
| $75,000 to $99,999 | 1,476 (12.4%) | 1,045 (9.5%) |
| $100,000+ | 2,213 (18.5%) | 1,371 (12.5%) |
| Total | 11,934 (100.0%) | 10,989 (100.0%) |
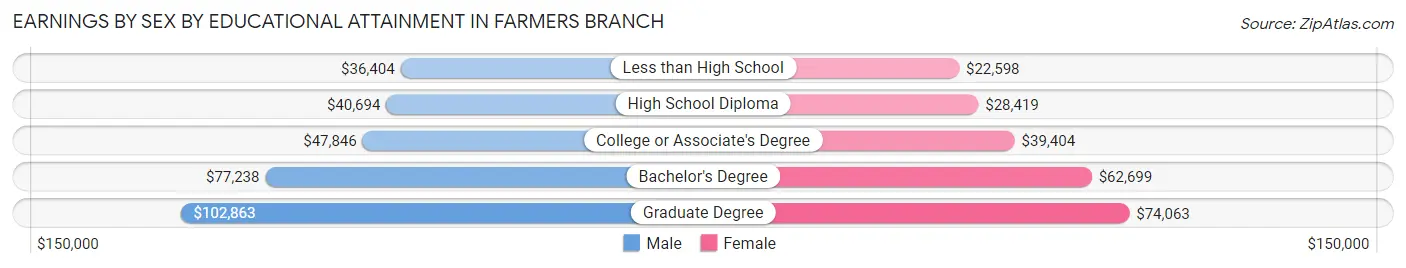
Earnings by Sex by Educational Attainment in Farmers Branch
Average earnings in Farmers Branch are $56,915 for men and $48,645 for women, a difference of 14.5%. Men with an educational attainment of graduate degree enjoy the highest average annual earnings of $102,863, while those with less than high school education earn the least with $36,404. Women with an educational attainment of graduate degree earn the most with the average annual earnings of $74,063, while those with less than high school education have the smallest earnings of $22,598.
| Educational Attainment | Male Income | Female Income |
| Less than High School | $36,404 | $22,598 |
| High School Diploma | $40,694 | $28,419 |
| College or Associate's Degree | $47,846 | $39,404 |
| Bachelor's Degree | $77,238 | $62,699 |
| Graduate Degree | $102,863 | $74,063 |
| Total | $56,915 | $48,645 |
Family Income in Farmers Branch
Family Income Brackets in Farmers Branch
According to the Farmers Branch family income data, there are 2,122 families falling into the $100,000 to $149,999 income range, which is the most common income bracket and makes up 25.1% of all families. Conversely, the $10,000 to $14,999 income bracket is the least frequent group with only 135 families (1.6%) belonging to this category.
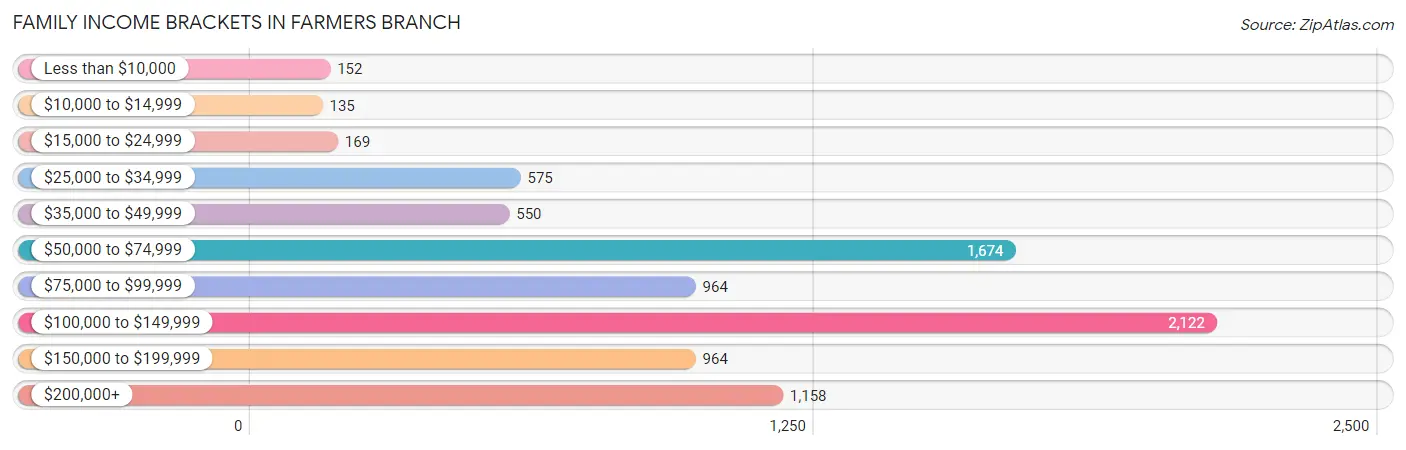
| Income Bracket | # Families | % Families |
| Less than $10,000 | 152 | 1.8% |
| $10,000 to $14,999 | 135 | 1.6% |
| $15,000 to $24,999 | 169 | 2.0% |
| $25,000 to $34,999 | 575 | 6.8% |
| $35,000 to $49,999 | 550 | 6.5% |
| $50,000 to $74,999 | 1,674 | 19.8% |
| $75,000 to $99,999 | 964 | 11.4% |
| $100,000 to $149,999 | 2,122 | 25.1% |
| $150,000 to $199,999 | 964 | 11.4% |
| $200,000+ | 1,158 | 13.7% |
Family Income by Famaliy Size in Farmers Branch
7+ person families (198 | 2.3%) account for the highest median family income in Farmers Branch with $141,176 per family, while 2-person families (3,840 | 45.4%) have the highest median income of $50,464 per family member.
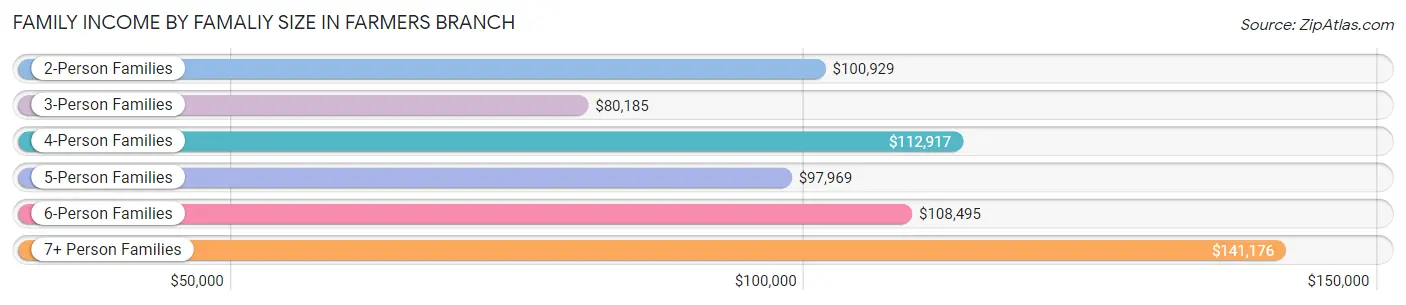
| Income Bracket | # Families | Median Income |
| 2-Person Families | 3,840 (45.4%) | $100,929 |
| 3-Person Families | 1,844 (21.8%) | $80,185 |
| 4-Person Families | 1,330 (15.7%) | $112,917 |
| 5-Person Families | 963 (11.4%) | $97,969 |
| 6-Person Families | 279 (3.3%) | $108,495 |
| 7+ Person Families | 198 (2.3%) | $141,176 |
| Total | 8,454 (100.0%) | $100,452 |
Family Income by Number of Earners in Farmers Branch
The median family income in Farmers Branch is $100,452, with families comprising 3+ earners (1,263) having the highest median family income of $130,144, while families with no earners (636) have the lowest median family income of $53,333, accounting for 14.9% and 7.5% of families, respectively.
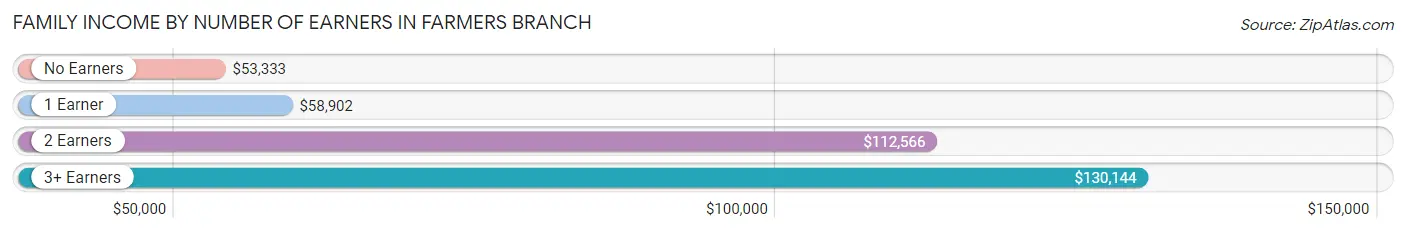
| Number of Earners | # Families | Median Income |
| No Earners | 636 (7.5%) | $53,333 |
| 1 Earner | 2,344 (27.7%) | $58,902 |
| 2 Earners | 4,211 (49.8%) | $112,566 |
| 3+ Earners | 1,263 (14.9%) | $130,144 |
| Total | 8,454 (100.0%) | $100,452 |
Household Income in Farmers Branch
Household Income Brackets in Farmers Branch
With 3,399 households falling in the category, the $100,000 to $149,999 income range is the most frequent in Farmers Branch, accounting for 23.5% of all households. In contrast, only 333 households (2.3%) fall into the less than $10,000 income bracket, making it the least populous group.
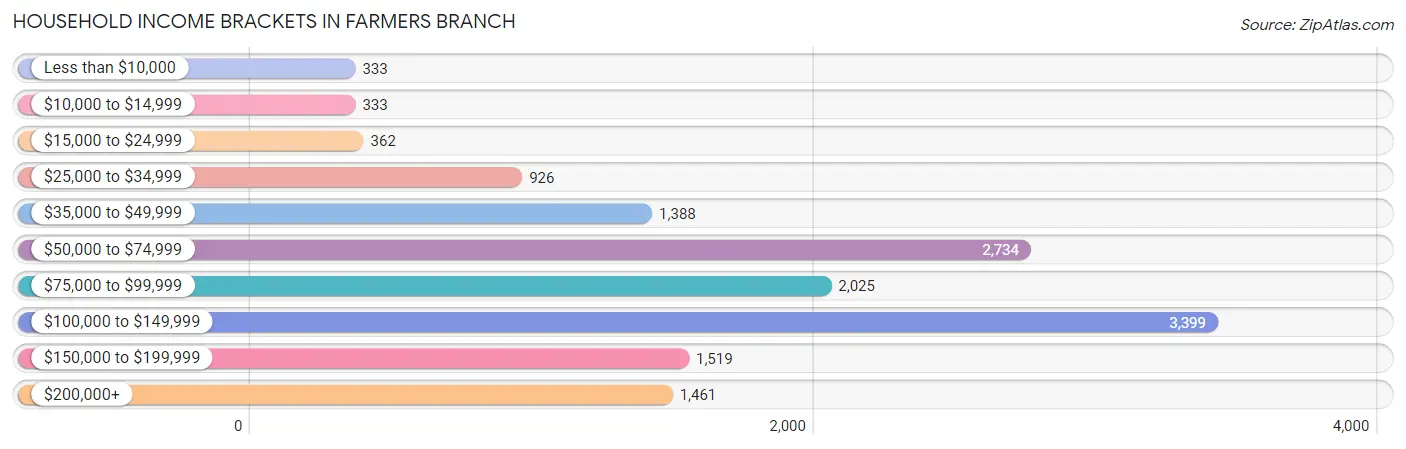
| Income Bracket | # Households | % Households |
| Less than $10,000 | 333 | 2.3% |
| $10,000 to $14,999 | 333 | 2.3% |
| $15,000 to $24,999 | 362 | 2.5% |
| $25,000 to $34,999 | 926 | 6.4% |
| $35,000 to $49,999 | 1,388 | 9.6% |
| $50,000 to $74,999 | 2,734 | 18.9% |
| $75,000 to $99,999 | 2,025 | 14.0% |
| $100,000 to $149,999 | 3,399 | 23.5% |
| $150,000 to $199,999 | 1,519 | 10.5% |
| $200,000+ | 1,461 | 10.1% |
Household Income by Householder Age in Farmers Branch
The median household income in Farmers Branch is $88,282, with the highest median household income of $104,510 found in the 45 to 64 years age bracket for the primary householder. A total of 4,099 households (28.3%) fall into this category. Meanwhile, the 15 to 24 years age bracket for the primary householder has the lowest median household income of $65,833, with 748 households (5.2%) in this group.
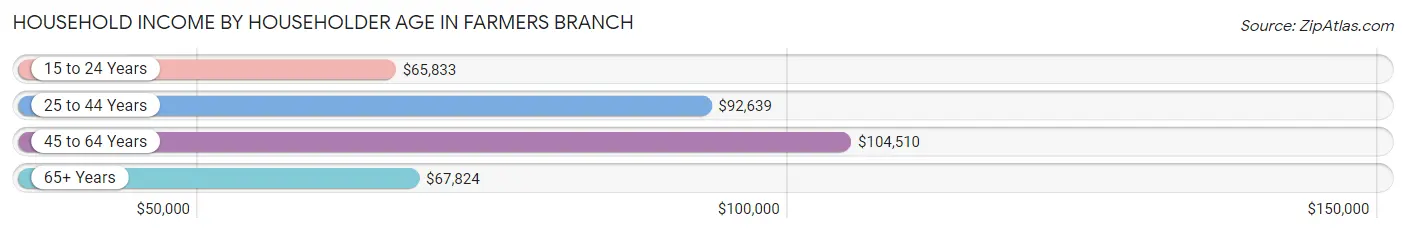
| Income Bracket | # Households | Median Income |
| 15 to 24 Years | 748 (5.2%) | $65,833 |
| 25 to 44 Years | 7,131 (49.3%) | $92,639 |
| 45 to 64 Years | 4,099 (28.3%) | $104,510 |
| 65+ Years | 2,485 (17.2%) | $67,824 |
| Total | 14,463 (100.0%) | $88,282 |
Poverty in Farmers Branch
Income Below Poverty by Sex and Age in Farmers Branch
With 8.3% poverty level for males and 9.4% for females among the residents of Farmers Branch, 12 to 14 year old males and under 5 year old females are the most vulnerable to poverty, with 212 males (27.4%) and 168 females (20.6%) in their respective age groups living below the poverty level.
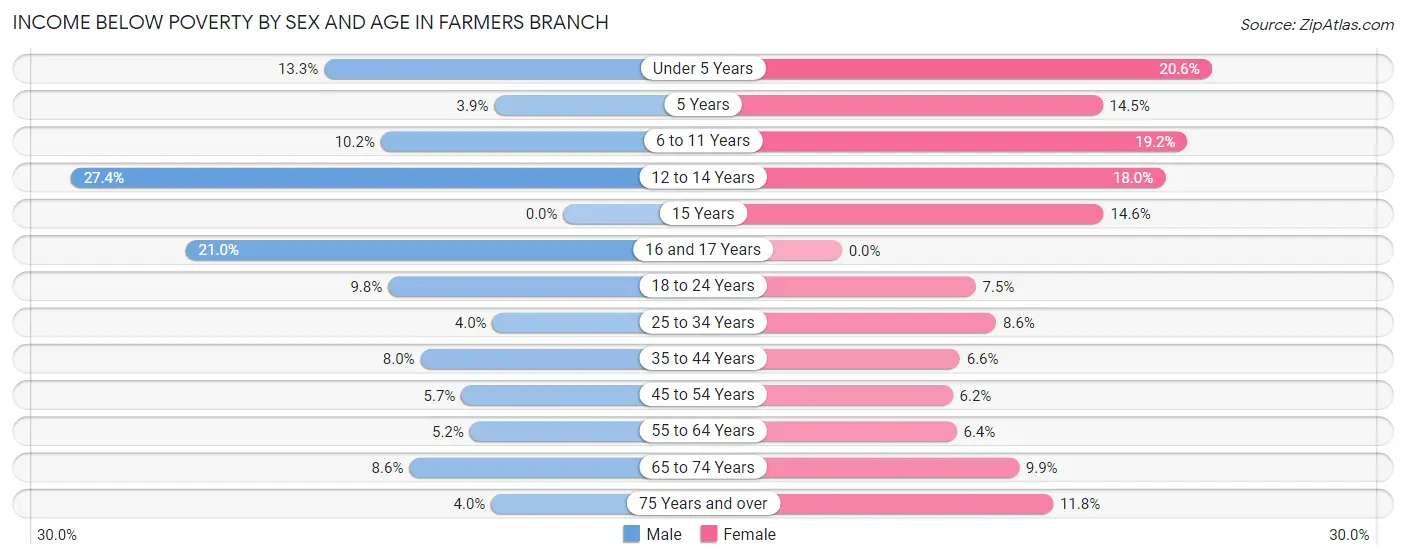
| Age Bracket | Male | Female |
| Under 5 Years | 166 (13.3%) | 168 (20.6%) |
| 5 Years | 7 (3.8%) | 36 (14.5%) |
| 6 to 11 Years | 128 (10.2%) | 171 (19.2%) |
| 12 to 14 Years | 212 (27.4%) | 124 (18.0%) |
| 15 Years | 0 (0.0%) | 35 (14.6%) |
| 16 and 17 Years | 114 (21.0%) | 0 (0.0%) |
| 18 to 24 Years | 170 (9.8%) | 109 (7.4%) |
| 25 to 34 Years | 150 (4.0%) | 332 (8.6%) |
| 35 to 44 Years | 234 (8.0%) | 171 (6.6%) |
| 45 to 54 Years | 97 (5.7%) | 120 (6.2%) |
| 55 to 64 Years | 90 (5.2%) | 131 (6.4%) |
| 65 to 74 Years | 92 (8.6%) | 147 (9.9%) |
| 75 Years and over | 29 (4.0%) | 124 (11.8%) |
| Total | 1,489 (8.3%) | 1,668 (9.4%) |
Income Above Poverty by Sex and Age in Farmers Branch
According to the poverty statistics in Farmers Branch, males aged 15 years and females aged 16 and 17 years are the age groups that are most secure financially, with 100.0% of males and 100.0% of females in these age groups living above the poverty line.
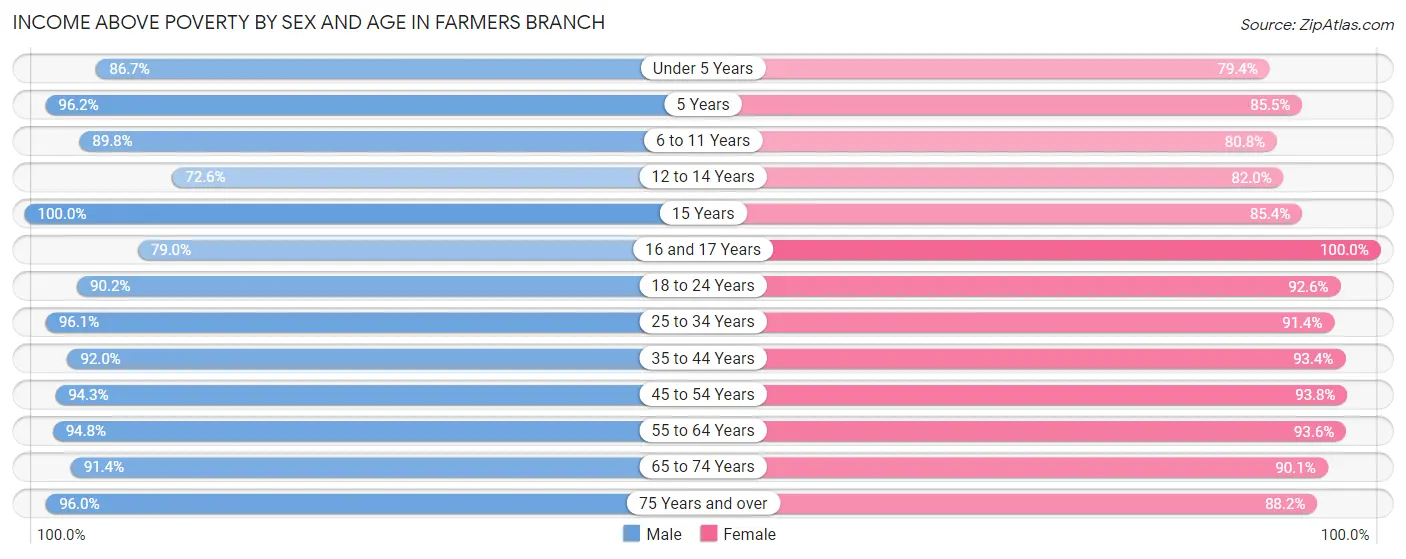
| Age Bracket | Male | Female |
| Under 5 Years | 1,079 (86.7%) | 648 (79.4%) |
| 5 Years | 175 (96.2%) | 212 (85.5%) |
| 6 to 11 Years | 1,131 (89.8%) | 718 (80.8%) |
| 12 to 14 Years | 561 (72.6%) | 565 (82.0%) |
| 15 Years | 257 (100.0%) | 205 (85.4%) |
| 16 and 17 Years | 428 (79.0%) | 406 (100.0%) |
| 18 to 24 Years | 1,572 (90.2%) | 1,354 (92.5%) |
| 25 to 34 Years | 3,647 (96.1%) | 3,531 (91.4%) |
| 35 to 44 Years | 2,705 (92.0%) | 2,431 (93.4%) |
| 45 to 54 Years | 1,608 (94.3%) | 1,826 (93.8%) |
| 55 to 64 Years | 1,633 (94.8%) | 1,918 (93.6%) |
| 65 to 74 Years | 980 (91.4%) | 1,344 (90.1%) |
| 75 Years and over | 692 (96.0%) | 930 (88.2%) |
| Total | 16,468 (91.7%) | 16,088 (90.6%) |
Income Below Poverty Among Married-Couple Families in Farmers Branch
The poverty statistics for married-couple families in Farmers Branch show that 5.4% or 329 of the total 6,105 families live below the poverty line. Families with 3 or 4 children have the highest poverty rate of 24.9%, comprising of 160 families. On the other hand, families with no children have the lowest poverty rate of 2.7%, which includes 93 families.
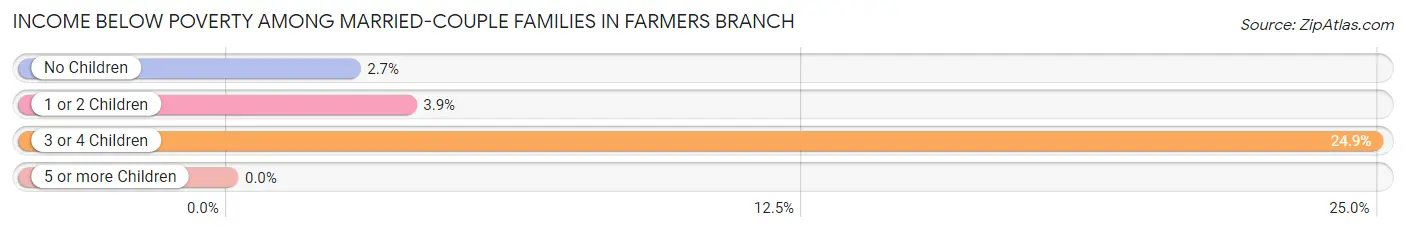
| Children | Above Poverty | Below Poverty |
| No Children | 3,409 (97.3%) | 93 (2.7%) |
| 1 or 2 Children | 1,885 (96.1%) | 76 (3.9%) |
| 3 or 4 Children | 482 (75.1%) | 160 (24.9%) |
| 5 or more Children | 0 (0.0%) | 0 (0.0%) |
| Total | 5,776 (94.6%) | 329 (5.4%) |
Income Below Poverty Among Single-Parent Households in Farmers Branch
According to the poverty data in Farmers Branch, 6.6% or 33 single-father households and 9.7% or 179 single-mother households are living below the poverty line. Among single-father households, those with 3 or 4 children have the highest poverty rate, with 5 households (50.0%) experiencing poverty. Likewise, among single-mother households, those with 3 or 4 children have the highest poverty rate, with 56 households (19.3%) falling below the poverty line.
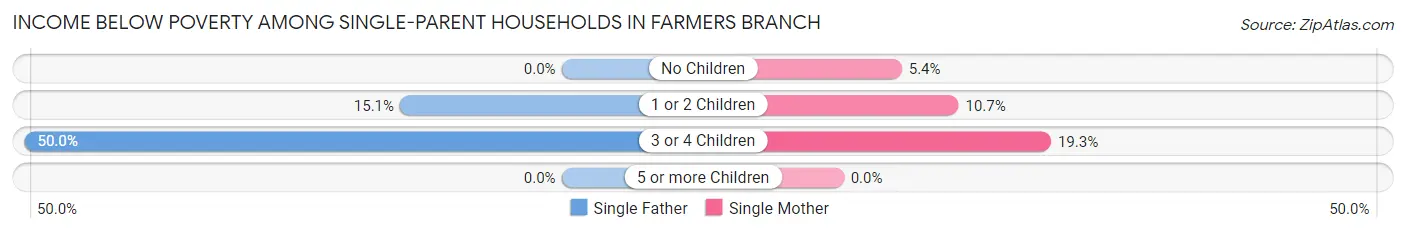
| Children | Single Father | Single Mother |
| No Children | 0 (0.0%) | 45 (5.4%) |
| 1 or 2 Children | 28 (15.0%) | 78 (10.7%) |
| 3 or 4 Children | 5 (50.0%) | 56 (19.3%) |
| 5 or more Children | 0 (0.0%) | 0 (0.0%) |
| Total | 33 (6.6%) | 179 (9.7%) |
Income Below Poverty Among Married-Couple vs Single-Parent Households in Farmers Branch
The poverty data for Farmers Branch shows that 329 of the married-couple family households (5.4%) and 212 of the single-parent households (9.0%) are living below the poverty level. Within the married-couple family households, those with 3 or 4 children have the highest poverty rate, with 160 households (24.9%) falling below the poverty line. Among the single-parent households, those with 3 or 4 children have the highest poverty rate, with 61 household (20.3%) living below poverty.
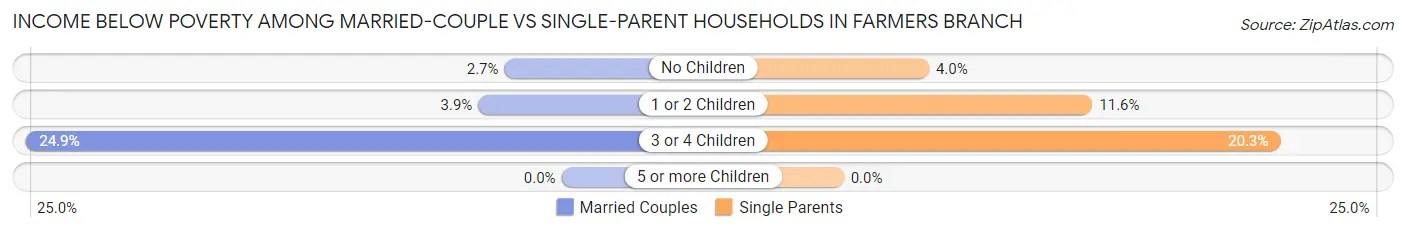
| Children | Married-Couple Families | Single-Parent Households |
| No Children | 93 (2.7%) | 45 (4.0%) |
| 1 or 2 Children | 76 (3.9%) | 106 (11.6%) |
| 3 or 4 Children | 160 (24.9%) | 61 (20.3%) |
| 5 or more Children | 0 (0.0%) | 0 (0.0%) |
| Total | 329 (5.4%) | 212 (9.0%) |
Race in Farmers Branch
The most populous races in Farmers Branch are White / Caucasian (23,281 | 64.7%), Hispanic or Latino (15,945 | 44.3%), and Asian (3,857 | 10.7%).
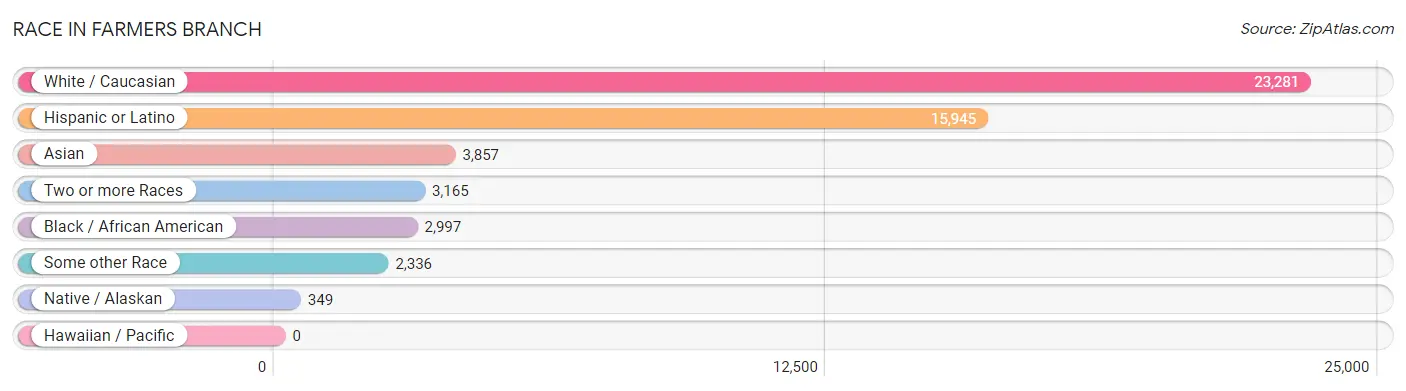
| Race | # Population | % Population |
| Asian | 3,857 | 10.7% |
| Black / African American | 2,997 | 8.3% |
| Hawaiian / Pacific | 0 | 0.0% |
| Hispanic or Latino | 15,945 | 44.3% |
| Native / Alaskan | 349 | 1.0% |
| White / Caucasian | 23,281 | 64.7% |
| Two or more Races | 3,165 | 8.8% |
| Some other Race | 2,336 | 6.5% |
| Total | 35,985 | 100.0% |
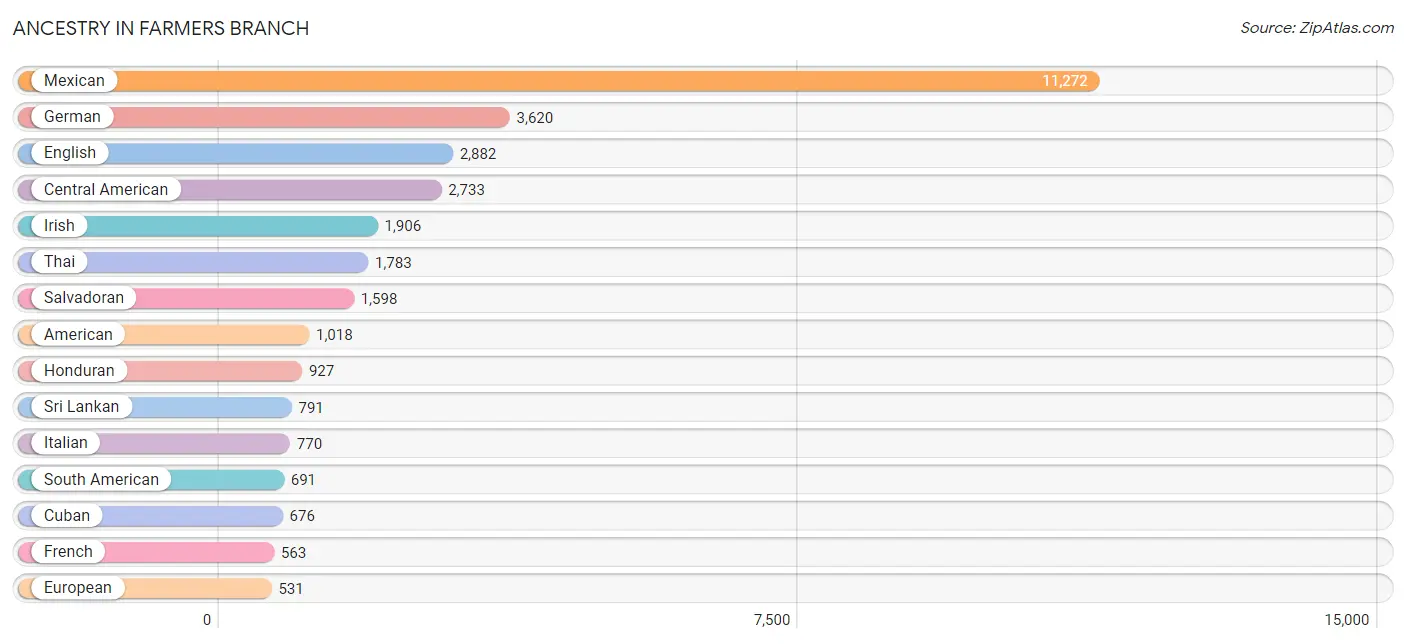
Ancestry in Farmers Branch
The most populous ancestries reported in Farmers Branch are Mexican (11,272 | 31.3%), German (3,620 | 10.1%), English (2,882 | 8.0%), Central American (2,733 | 7.6%), and Irish (1,906 | 5.3%), together accounting for 62.3% of all Farmers Branch residents.
| Ancestry | # Population | % Population |
| African | 305 | 0.9% |
| Albanian | 9 | 0.0% |
| American | 1,018 | 2.8% |
| Apache | 5 | 0.0% |
| Arab | 172 | 0.5% |
| Argentinean | 66 | 0.2% |
| Bhutanese | 131 | 0.4% |
| Brazilian | 113 | 0.3% |
| British | 303 | 0.8% |
| Bulgarian | 69 | 0.2% |
| Burmese | 515 | 1.4% |
| Canadian | 44 | 0.1% |
| Celtic | 16 | 0.0% |
| Central American | 2,733 | 7.6% |
| Central American Indian | 106 | 0.3% |
| Cherokee | 76 | 0.2% |
| Chickasaw | 13 | 0.0% |
| Chilean | 42 | 0.1% |
| Choctaw | 15 | 0.0% |
| Colombian | 392 | 1.1% |
| Creek | 15 | 0.0% |
| Croatian | 33 | 0.1% |
| Cuban | 676 | 1.9% |
| Czech | 120 | 0.3% |
| Czechoslovakian | 58 | 0.2% |
| Danish | 31 | 0.1% |
| Delaware | 5 | 0.0% |
| Dutch | 149 | 0.4% |
| Dutch West Indian | 14 | 0.0% |
| Eastern European | 71 | 0.2% |
| Ecuadorian | 43 | 0.1% |
| Egyptian | 46 | 0.1% |
| English | 2,882 | 8.0% |
| European | 531 | 1.5% |
| Filipino | 56 | 0.2% |
| Finnish | 9 | 0.0% |
| French | 563 | 1.6% |
| French Canadian | 59 | 0.2% |
| German | 3,620 | 10.1% |
| Greek | 24 | 0.1% |
| Guatemalan | 182 | 0.5% |
| Honduran | 927 | 2.6% |
| Hungarian | 58 | 0.2% |
| Indian (Asian) | 327 | 0.9% |
| Iranian | 32 | 0.1% |
| Iraqi | 57 | 0.2% |
| Irish | 1,906 | 5.3% |
| Italian | 770 | 2.1% |
| Jamaican | 11 | 0.0% |
| Kenyan | 9 | 0.0% |
| Korean | 193 | 0.5% |
| Laotian | 10 | 0.0% |
| Lebanese | 25 | 0.1% |
| Lithuanian | 33 | 0.1% |
| Luxembourger | 13 | 0.0% |
| Malaysian | 18 | 0.1% |
| Maltese | 10 | 0.0% |
| Mexican | 11,272 | 31.3% |
| Mexican American Indian | 165 | 0.5% |
| Native Hawaiian | 7 | 0.0% |
| Nigerian | 131 | 0.4% |
| Northern European | 17 | 0.1% |
| Norwegian | 337 | 0.9% |
| Pakistani | 31 | 0.1% |
| Panamanian | 26 | 0.1% |
| Peruvian | 37 | 0.1% |
| Polish | 199 | 0.5% |
| Portuguese | 54 | 0.2% |
| Puerto Rican | 282 | 0.8% |
| Romanian | 96 | 0.3% |
| Russian | 188 | 0.5% |
| Salvadoran | 1,598 | 4.4% |
| Scandinavian | 137 | 0.4% |
| Scotch-Irish | 236 | 0.7% |
| Scottish | 448 | 1.2% |
| Serbian | 14 | 0.0% |
| Slavic | 59 | 0.2% |
| Slovak | 39 | 0.1% |
| South American | 691 | 1.9% |
| Spaniard | 62 | 0.2% |
| Spanish | 15 | 0.0% |
| Sri Lankan | 791 | 2.2% |
| Subsaharan African | 445 | 1.2% |
| Swedish | 285 | 0.8% |
| Swiss | 78 | 0.2% |
| Syrian | 22 | 0.1% |
| Thai | 1,783 | 5.0% |
| Trinidadian and Tobagonian | 11 | 0.0% |
| Turkish | 35 | 0.1% |
| Ukrainian | 11 | 0.0% |
| Venezuelan | 111 | 0.3% |
| Vietnamese | 81 | 0.2% |
| Welsh | 98 | 0.3% |
| West Indian | 11 | 0.0% |
| Yugoslavian | 3 | 0.0% | View All 95 Rows |
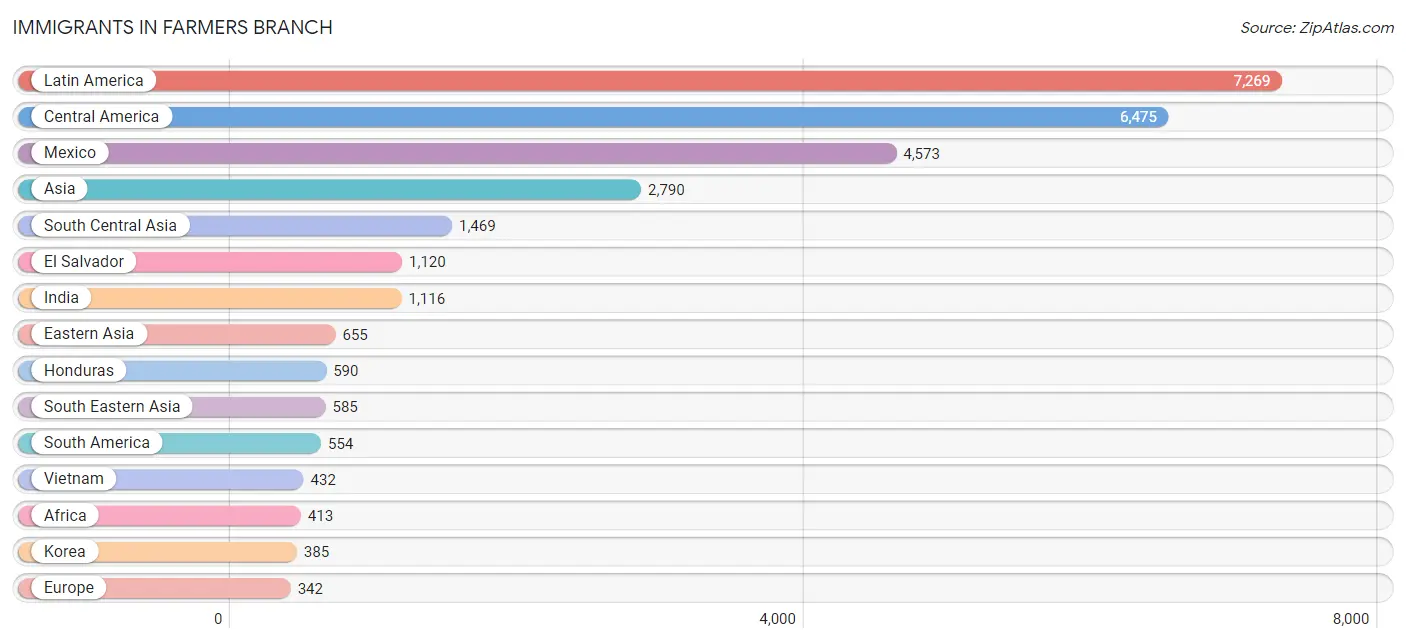
Immigrants in Farmers Branch
The most numerous immigrant groups reported in Farmers Branch came from Latin America (7,269 | 20.2%), Central America (6,475 | 18.0%), Mexico (4,573 | 12.7%), Asia (2,790 | 7.7%), and South Central Asia (1,469 | 4.1%), together accounting for 62.7% of all Farmers Branch residents.
| Immigration Origin | # Population | % Population |
| Africa | 413 | 1.1% |
| Albania | 9 | 0.0% |
| Argentina | 21 | 0.1% |
| Asia | 2,790 | 7.7% |
| Bangladesh | 45 | 0.1% |
| Bolivia | 1 | 0.0% |
| Brazil | 99 | 0.3% |
| Bulgaria | 24 | 0.1% |
| Canada | 139 | 0.4% |
| Caribbean | 240 | 0.7% |
| Central America | 6,475 | 18.0% |
| China | 231 | 0.6% |
| Colombia | 280 | 0.8% |
| Cuba | 195 | 0.5% |
| Dominica | 34 | 0.1% |
| Eastern Africa | 165 | 0.5% |
| Eastern Asia | 655 | 1.8% |
| Eastern Europe | 126 | 0.4% |
| Ecuador | 9 | 0.0% |
| Egypt | 21 | 0.1% |
| El Salvador | 1,120 | 3.1% |
| England | 11 | 0.0% |
| Ethiopia | 23 | 0.1% |
| Europe | 342 | 0.9% |
| Germany | 42 | 0.1% |
| Guatemala | 140 | 0.4% |
| Honduras | 590 | 1.6% |
| Hong Kong | 11 | 0.0% |
| India | 1,116 | 3.1% |
| Indonesia | 10 | 0.0% |
| Iran | 6 | 0.0% |
| Iraq | 57 | 0.2% |
| Ireland | 13 | 0.0% |
| Italy | 22 | 0.1% |
| Japan | 39 | 0.1% |
| Kenya | 121 | 0.3% |
| Korea | 385 | 1.1% |
| Latin America | 7,269 | 20.2% |
| Mexico | 4,573 | 12.7% |
| Nepal | 211 | 0.6% |
| Nicaragua | 7 | 0.0% |
| Nigeria | 119 | 0.3% |
| Northern Africa | 21 | 0.1% |
| Northern Europe | 81 | 0.2% |
| Pakistan | 91 | 0.3% |
| Peru | 28 | 0.1% |
| Philippines | 106 | 0.3% |
| Portugal | 9 | 0.0% |
| Romania | 30 | 0.1% |
| Russia | 40 | 0.1% |
| Saudi Arabia | 13 | 0.0% |
| Serbia | 23 | 0.1% |
| Sierra Leone | 14 | 0.0% |
| Singapore | 15 | 0.0% |
| South Africa | 22 | 0.1% |
| South America | 554 | 1.5% |
| South Central Asia | 1,469 | 4.1% |
| South Eastern Asia | 585 | 1.6% |
| Southern Europe | 93 | 0.3% |
| Spain | 62 | 0.2% |
| Taiwan | 34 | 0.1% |
| Thailand | 22 | 0.1% |
| Trinidad and Tobago | 11 | 0.0% |
| Venezuela | 116 | 0.3% |
| Vietnam | 432 | 1.2% |
| Western Africa | 133 | 0.4% |
| Western Asia | 81 | 0.2% |
| Western Europe | 42 | 0.1% |
| Zimbabwe | 8 | 0.0% | View All 69 Rows |
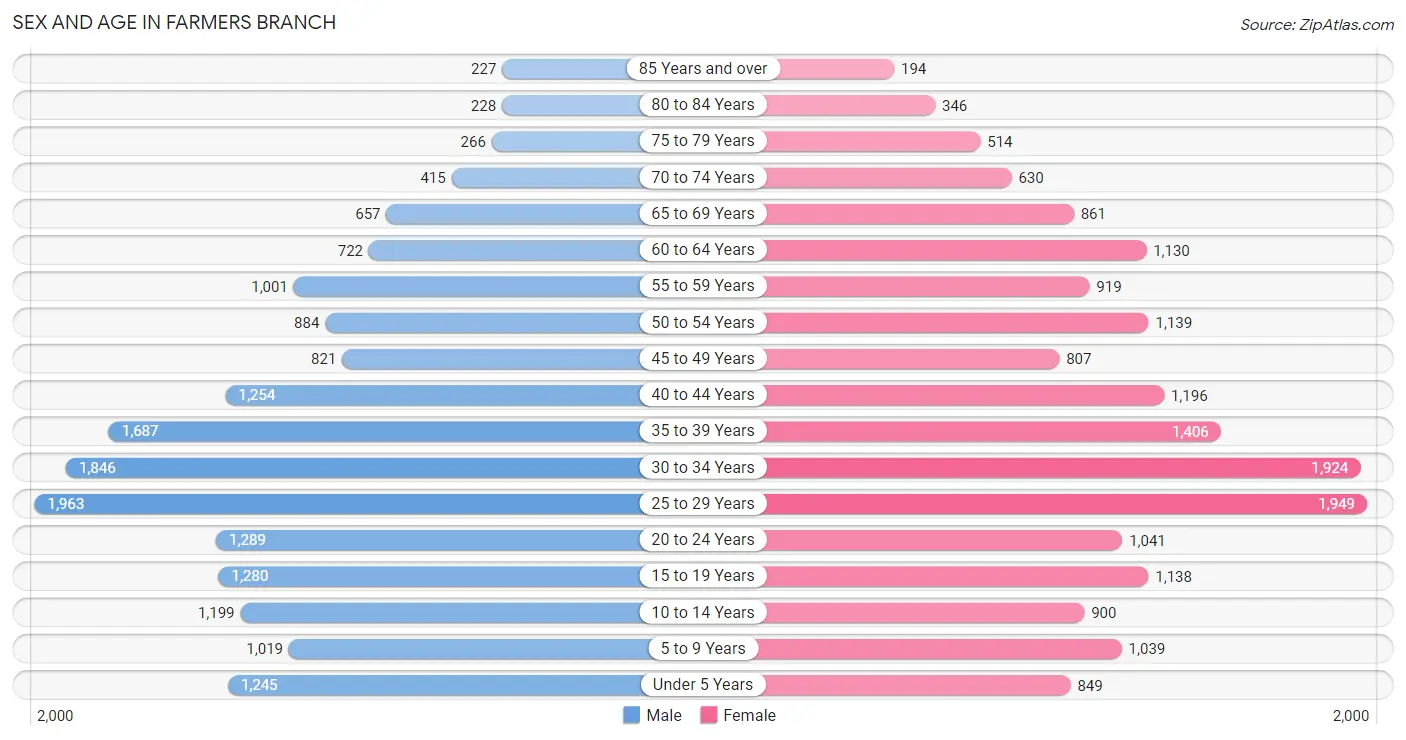
Sex and Age in Farmers Branch
Sex and Age in Farmers Branch
The most populous age groups in Farmers Branch are 25 to 29 Years (1,963 | 10.9%) for men and 25 to 29 Years (1,949 | 10.8%) for women.
| Age Bracket | Male | Female |
| Under 5 Years | 1,245 (6.9%) | 849 (4.7%) |
| 5 to 9 Years | 1,019 (5.7%) | 1,039 (5.8%) |
| 10 to 14 Years | 1,199 (6.7%) | 900 (5.0%) |
| 15 to 19 Years | 1,280 (7.1%) | 1,138 (6.3%) |
| 20 to 24 Years | 1,289 (7.2%) | 1,041 (5.8%) |
| 25 to 29 Years | 1,963 (10.9%) | 1,949 (10.8%) |
| 30 to 34 Years | 1,846 (10.2%) | 1,924 (10.7%) |
| 35 to 39 Years | 1,687 (9.4%) | 1,406 (7.8%) |
| 40 to 44 Years | 1,254 (7.0%) | 1,196 (6.7%) |
| 45 to 49 Years | 821 (4.6%) | 807 (4.5%) |
| 50 to 54 Years | 884 (4.9%) | 1,139 (6.3%) |
| 55 to 59 Years | 1,001 (5.6%) | 919 (5.1%) |
| 60 to 64 Years | 722 (4.0%) | 1,130 (6.3%) |
| 65 to 69 Years | 657 (3.6%) | 861 (4.8%) |
| 70 to 74 Years | 415 (2.3%) | 630 (3.5%) |
| 75 to 79 Years | 266 (1.5%) | 514 (2.9%) |
| 80 to 84 Years | 228 (1.3%) | 346 (1.9%) |
| 85 Years and over | 227 (1.3%) | 194 (1.1%) |
| Total | 18,003 (100.0%) | 17,982 (100.0%) |
Families and Households in Farmers Branch
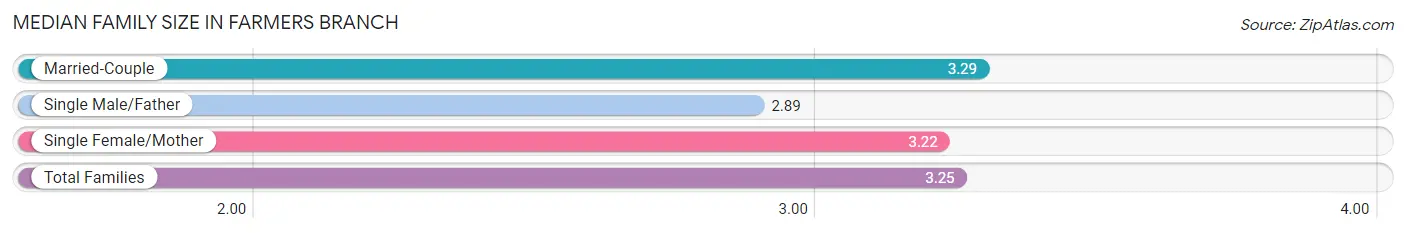
Median Family Size in Farmers Branch
The median family size in Farmers Branch is 3.25 persons per family, with married-couple families (6,105 | 72.2%) accounting for the largest median family size of 3.29 persons per family. On the other hand, single male/father families (498 | 5.9%) represent the smallest median family size with 2.89 persons per family.
| Family Type | # Families | Family Size |
| Married-Couple | 6,105 (72.2%) | 3.29 |
| Single Male/Father | 498 (5.9%) | 2.89 |
| Single Female/Mother | 1,851 (21.9%) | 3.22 |
| Total Families | 8,454 (100.0%) | 3.25 |
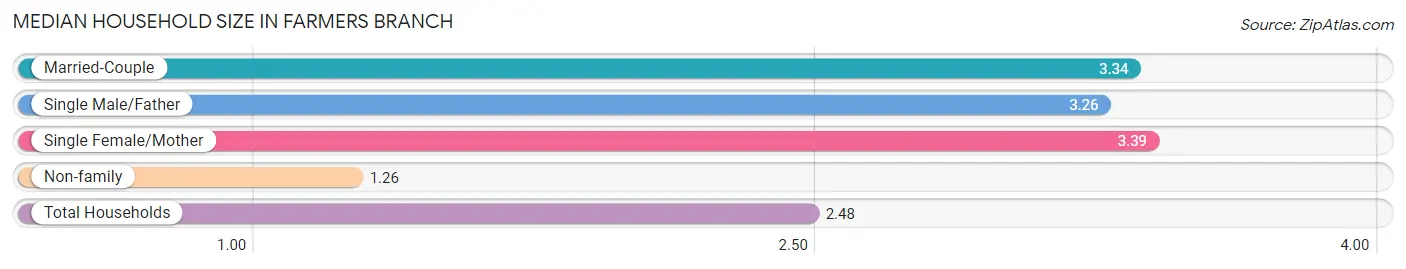
Median Household Size in Farmers Branch
The median household size in Farmers Branch is 2.48 persons per household, with single female/mother households (1,851 | 12.8%) accounting for the largest median household size of 3.39 persons per household. non-family households (6,009 | 41.5%) represent the smallest median household size with 1.26 persons per household.
| Household Type | # Households | Household Size |
| Married-Couple | 6,105 (42.2%) | 3.34 |
| Single Male/Father | 498 (3.4%) | 3.26 |
| Single Female/Mother | 1,851 (12.8%) | 3.39 |
| Non-family | 6,009 (41.5%) | 1.26 |
| Total Households | 14,463 (100.0%) | 2.48 |
Household Size by Marriage Status in Farmers Branch
Out of a total of 14,463 households in Farmers Branch, 8,454 (58.5%) are family households, while 6,009 (41.5%) are nonfamily households. The most numerous type of family households are 2-person households, comprising 3,463, and the most common type of nonfamily households are 1-person households, comprising 4,711.
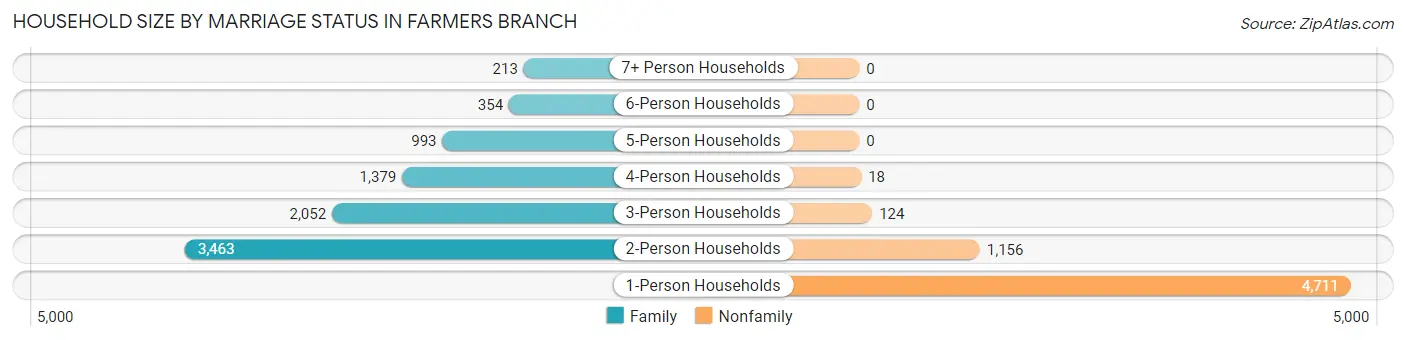
| Household Size | Family Households | Nonfamily Households |
| 1-Person Households | - | 4,711 (32.6%) |
| 2-Person Households | 3,463 (23.9%) | 1,156 (8.0%) |
| 3-Person Households | 2,052 (14.2%) | 124 (0.9%) |
| 4-Person Households | 1,379 (9.5%) | 18 (0.1%) |
| 5-Person Households | 993 (6.9%) | 0 (0.0%) |
| 6-Person Households | 354 (2.5%) | 0 (0.0%) |
| 7+ Person Households | 213 (1.5%) | 0 (0.0%) |
| Total | 8,454 (58.5%) | 6,009 (41.5%) |
Female Fertility in Farmers Branch
Fertility by Age in Farmers Branch
Average fertility rate in Farmers Branch is 60.0 births per 1,000 women. Women in the age bracket of 20 to 34 years have the highest fertility rate with 83.0 births per 1,000 women. Women in the age bracket of 20 to 34 years acount for 69.9% of all women with births.
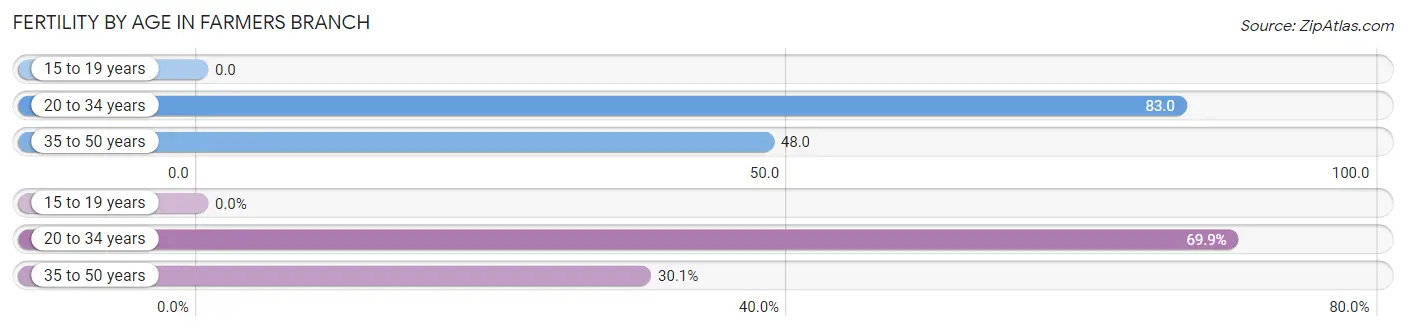
| Age Bracket | Women with Births | Births / 1,000 Women |
| 15 to 19 years | 0 (0.0%) | 0.0 |
| 20 to 34 years | 407 (69.9%) | 83.0 |
| 35 to 50 years | 175 (30.1%) | 48.0 |
| Total | 582 (100.0%) | 60.0 |
Fertility by Age by Marriage Status in Farmers Branch
80.6% of women with births (582) in Farmers Branch are married. The highest percentage of unmarried women with births falls into 35 to 50 years age bracket with 30.9% of them unmarried at the time of birth, while the lowest percentage of unmarried women with births belong to 20 to 34 years age bracket with 14.5% of them unmarried.
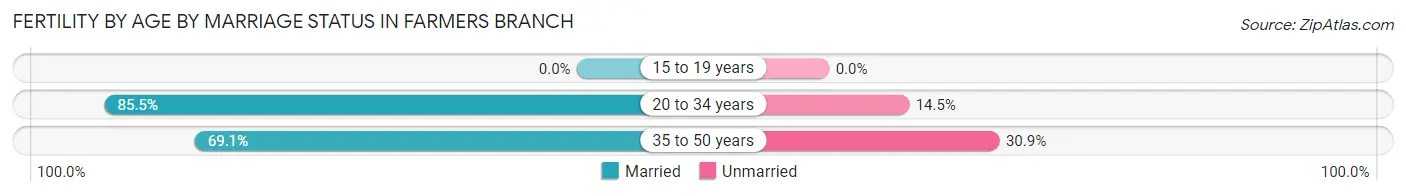
| Age Bracket | Married | Unmarried |
| 15 to 19 years | 0 (0.0%) | 0 (0.0%) |
| 20 to 34 years | 348 (85.5%) | 59 (14.5%) |
| 35 to 50 years | 121 (69.1%) | 54 (30.9%) |
| Total | 469 (80.6%) | 113 (19.4%) |
Fertility by Education in Farmers Branch
Average fertility rate in Farmers Branch is 60.0 births per 1,000 women. Women with the education attainment of graduate degree have the highest fertility rate of 84.0 births per 1,000 women, while women with the education attainment of less than high school have the lowest fertility at 13.0 births per 1,000 women. Women with the education attainment of bachelor's degree represent 34.9% of all women with births.
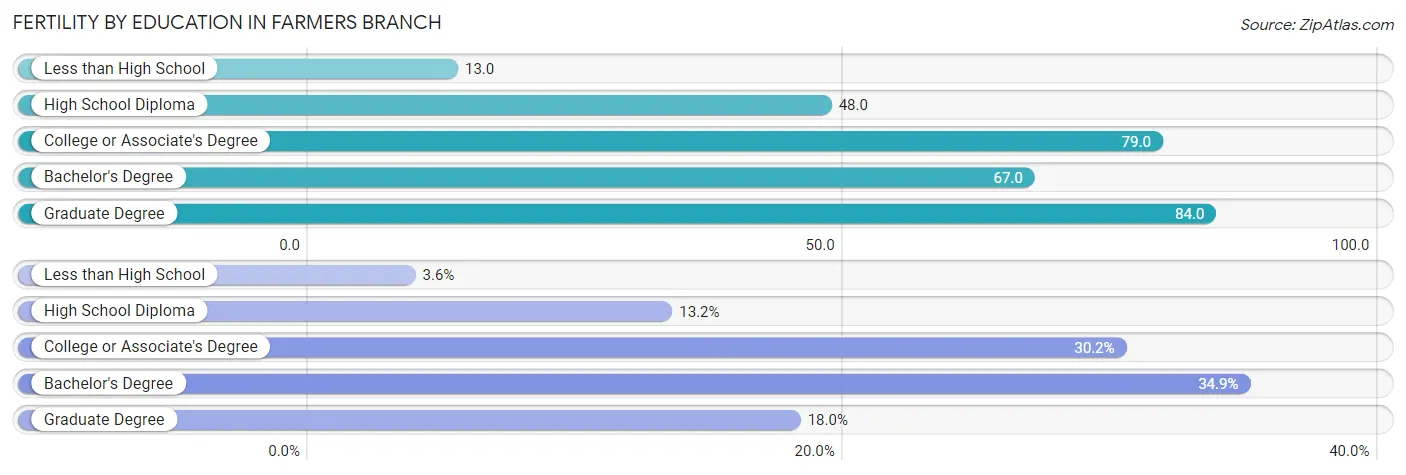
| Educational Attainment | Women with Births | Births / 1,000 Women |
| Less than High School | 21 (3.6%) | 13.0 |
| High School Diploma | 77 (13.2%) | 48.0 |
| College or Associate's Degree | 176 (30.2%) | 79.0 |
| Bachelor's Degree | 203 (34.9%) | 67.0 |
| Graduate Degree | 105 (18.0%) | 84.0 |
| Total | 582 (100.0%) | 60.0 |
Fertility by Education by Marriage Status in Farmers Branch
19.4% of women with births in Farmers Branch are unmarried. Women with the educational attainment of less than high school are most likely to be married with 100.0% of them married at childbirth, while women with the educational attainment of high school diploma are least likely to be married with 76.6% of them unmarried at childbirth.
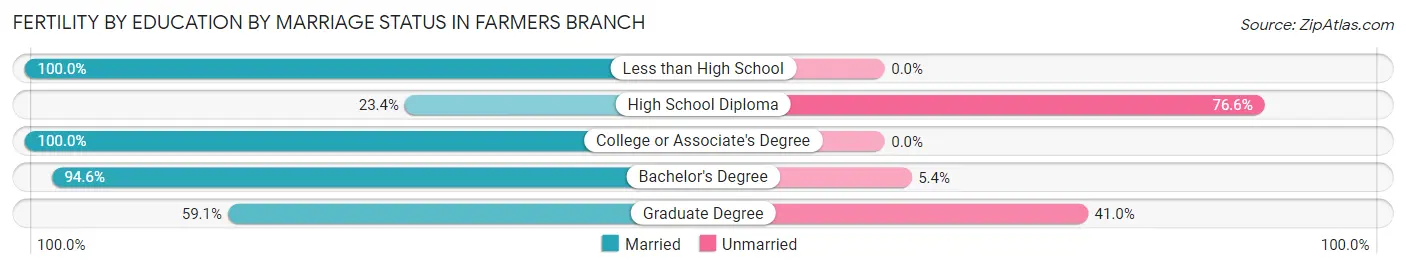
| Educational Attainment | Married | Unmarried |
| Less than High School | 21 (100.0%) | 0 (0.0%) |
| High School Diploma | 18 (23.4%) | 59 (76.6%) |
| College or Associate's Degree | 176 (100.0%) | 0 (0.0%) |
| Bachelor's Degree | 192 (94.6%) | 11 (5.4%) |
| Graduate Degree | 62 (59.1%) | 43 (40.9%) |
| Total | 469 (80.6%) | 113 (19.4%) |
Employment Characteristics in Farmers Branch
Employment by Class of Employer in Farmers Branch
Among the 21,673 employed individuals in Farmers Branch, private company employees (16,635 | 76.7%), self-employed (not incorporated) (1,730 | 8.0%), and not-for-profit organizations (1,103 | 5.1%) make up the most common classes of employment.
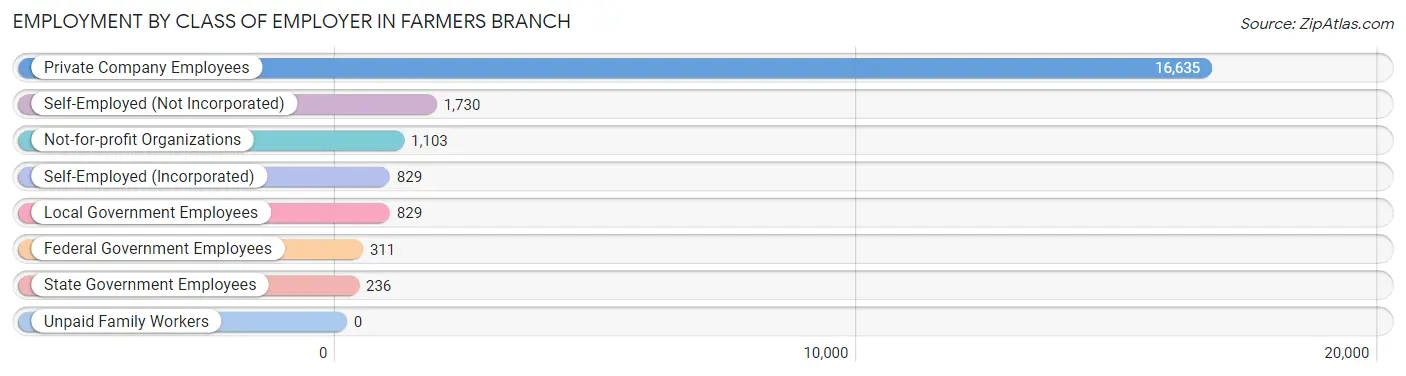
| Employer Class | # Employees | % Employees |
| Private Company Employees | 16,635 | 76.7% |
| Self-Employed (Incorporated) | 829 | 3.8% |
| Self-Employed (Not Incorporated) | 1,730 | 8.0% |
| Not-for-profit Organizations | 1,103 | 5.1% |
| Local Government Employees | 829 | 3.8% |
| State Government Employees | 236 | 1.1% |
| Federal Government Employees | 311 | 1.4% |
| Unpaid Family Workers | 0 | 0.0% |
| Total | 21,673 | 100.0% |
Employment Status by Age in Farmers Branch
According to the labor force statistics for Farmers Branch, out of the total population over 16 years of age (29,237), 77.1% or 22,542 individuals are in the labor force, with 2.9% or 654 of them unemployed. The age group with the highest labor force participation rate is 35 to 44 years, with 92.1% or 5,105 individuals in the labor force. Within the labor force, the 16 to 19 years age range has the highest percentage of unemployed individuals, with 11.0% or 95 of them being unemployed.
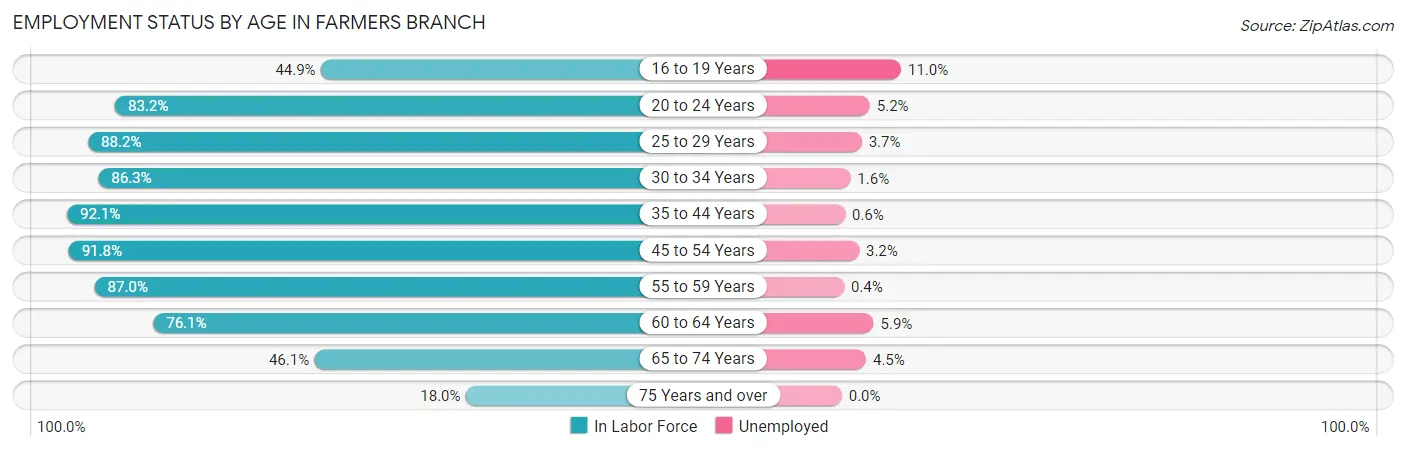
| Age Bracket | In Labor Force | Unemployed |
| 16 to 19 Years | 863 (44.9%) | 95 (11.0%) |
| 20 to 24 Years | 1,939 (83.2%) | 101 (5.2%) |
| 25 to 29 Years | 3,450 (88.2%) | 128 (3.7%) |
| 30 to 34 Years | 3,254 (86.3%) | 52 (1.6%) |
| 35 to 44 Years | 5,105 (92.1%) | 31 (0.6%) |
| 45 to 54 Years | 3,352 (91.8%) | 107 (3.2%) |
| 55 to 59 Years | 1,670 (87.0%) | 7 (0.4%) |
| 60 to 64 Years | 1,409 (76.1%) | 83 (5.9%) |
| 65 to 74 Years | 1,182 (46.1%) | 53 (4.5%) |
| 75 Years and over | 320 (18.0%) | 0 (0.0%) |
| Total | 22,542 (77.1%) | 654 (2.9%) |
Employment Status by Educational Attainment in Farmers Branch
According to labor force statistics for Farmers Branch, 88.3% of individuals (18,232) out of the total population between 25 and 64 years of age (20,648) are in the labor force, with 2.2% or 401 of them being unemployed. The group with the highest labor force participation rate are those with the educational attainment of bachelor's degree or higher, with 92.8% or 9,040 individuals in the labor force. Within the labor force, individuals with less than high school education have the highest percentage of unemployment, with 2.9% or 81 of them being unemployed.
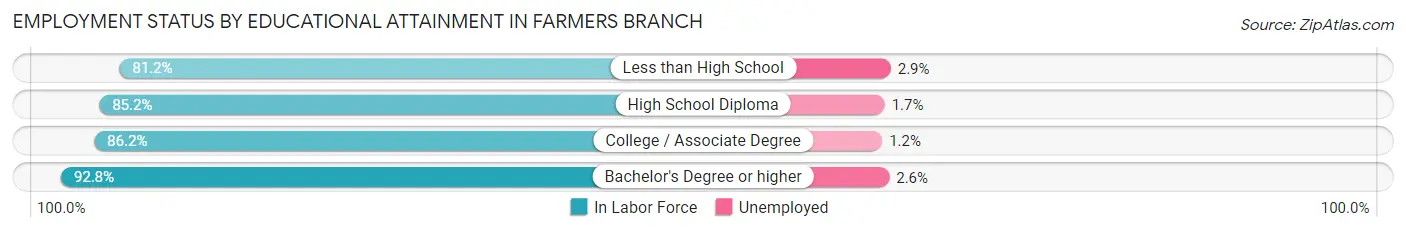
| Educational Attainment | In Labor Force | Unemployed |
| Less than High School | 2,782 (81.2%) | 99 (2.9%) |
| High School Diploma | 2,884 (85.2%) | 58 (1.7%) |
| College / Associate Degree | 3,531 (86.2%) | 49 (1.2%) |
| Bachelor's Degree or higher | 9,040 (92.8%) | 253 (2.6%) |
| Total | 18,232 (88.3%) | 454 (2.2%) |
Employment Occupations by Sex in Farmers Branch
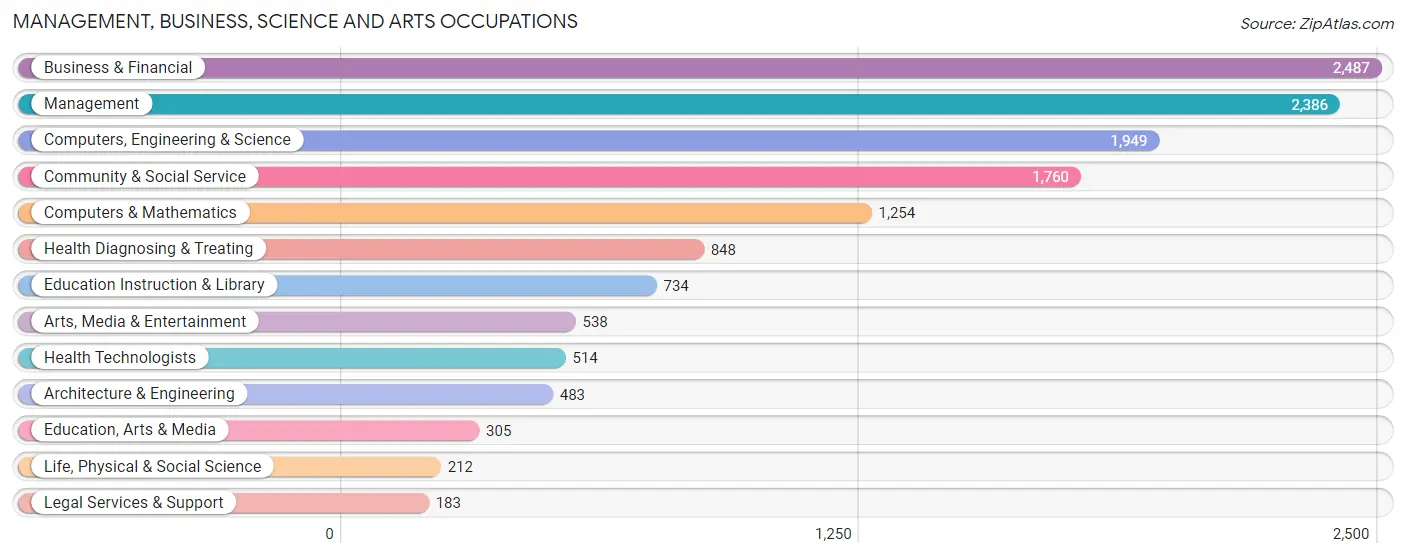
Management, Business, Science and Arts Occupations
The most common Management, Business, Science and Arts occupations in Farmers Branch are Business & Financial (2,487 | 11.4%), Management (2,386 | 10.9%), Computers, Engineering & Science (1,949 | 8.9%), Community & Social Service (1,760 | 8.0%), and Computers & Mathematics (1,254 | 5.7%).
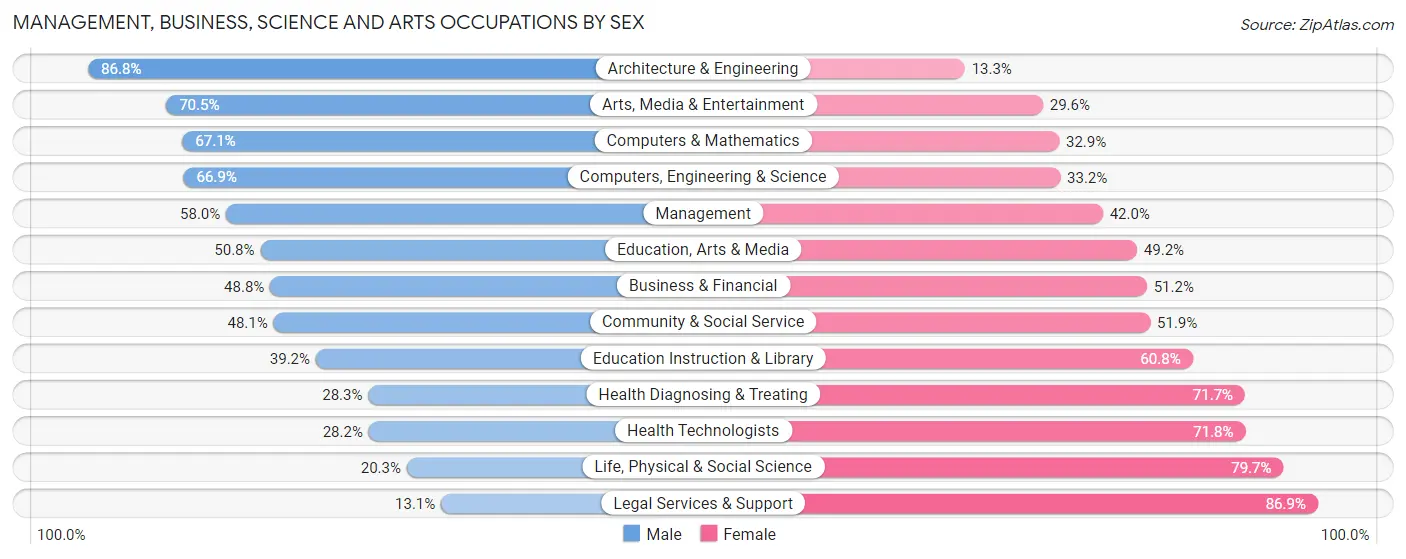
Management, Business, Science and Arts Occupations by Sex
Within the Management, Business, Science and Arts occupations in Farmers Branch, the most male-oriented occupations are Architecture & Engineering (86.8%), Arts, Media & Entertainment (70.5%), and Computers & Mathematics (67.1%), while the most female-oriented occupations are Legal Services & Support (86.9%), Life, Physical & Social Science (79.7%), and Health Technologists (71.8%).
| Occupation | Male | Female |
| Management | 1,383 (58.0%) | 1,003 (42.0%) |
| Business & Financial | 1,213 (48.8%) | 1,274 (51.2%) |
| Computers, Engineering & Science | 1,303 (66.8%) | 646 (33.2%) |
| Computers & Mathematics | 841 (67.1%) | 413 (32.9%) |
| Architecture & Engineering | 419 (86.8%) | 64 (13.3%) |
| Life, Physical & Social Science | 43 (20.3%) | 169 (79.7%) |
| Community & Social Service | 846 (48.1%) | 914 (51.9%) |
| Education, Arts & Media | 155 (50.8%) | 150 (49.2%) |
| Legal Services & Support | 24 (13.1%) | 159 (86.9%) |
| Education Instruction & Library | 288 (39.2%) | 446 (60.8%) |
| Arts, Media & Entertainment | 379 (70.5%) | 159 (29.5%) |
| Health Diagnosing & Treating | 240 (28.3%) | 608 (71.7%) |
| Health Technologists | 145 (28.2%) | 369 (71.8%) |
| Total (Category) | 4,985 (52.9%) | 4,445 (47.1%) |
| Total (Overall) | 11,509 (52.6%) | 10,371 (47.4%) |
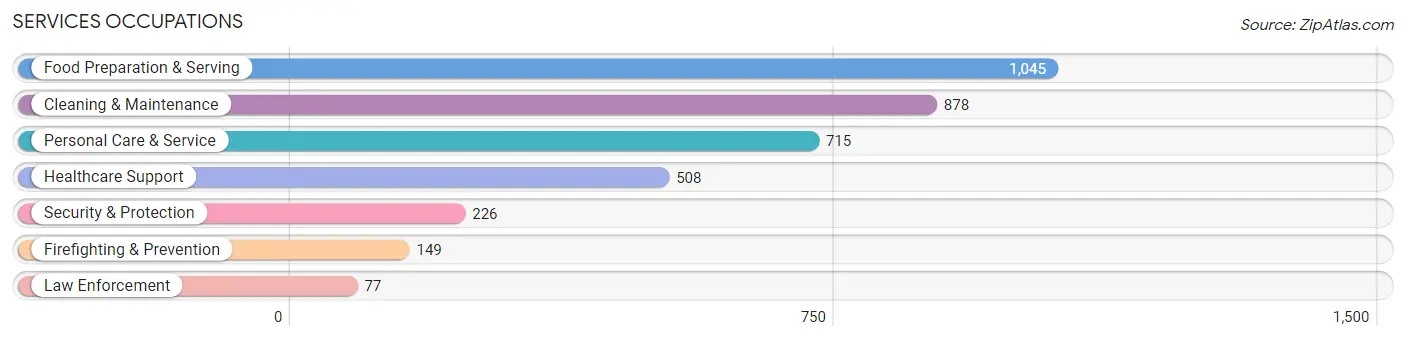
Services Occupations
The most common Services occupations in Farmers Branch are Food Preparation & Serving (1,045 | 4.8%), Cleaning & Maintenance (878 | 4.0%), Personal Care & Service (715 | 3.3%), Healthcare Support (508 | 2.3%), and Security & Protection (226 | 1.0%).
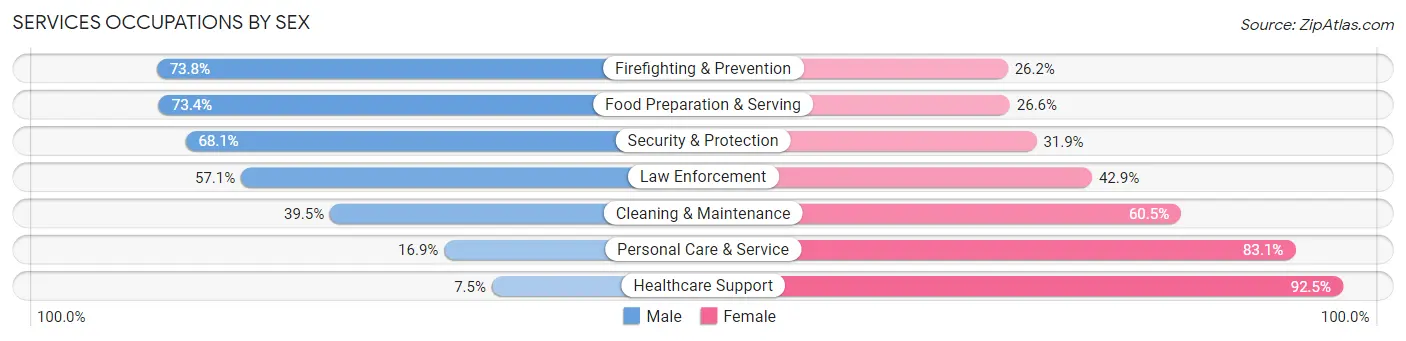
Services Occupations by Sex
Within the Services occupations in Farmers Branch, the most male-oriented occupations are Firefighting & Prevention (73.8%), Food Preparation & Serving (73.4%), and Security & Protection (68.1%), while the most female-oriented occupations are Healthcare Support (92.5%), Personal Care & Service (83.1%), and Cleaning & Maintenance (60.5%).
| Occupation | Male | Female |
| Healthcare Support | 38 (7.5%) | 470 (92.5%) |
| Security & Protection | 154 (68.1%) | 72 (31.9%) |
| Firefighting & Prevention | 110 (73.8%) | 39 (26.2%) |
| Law Enforcement | 44 (57.1%) | 33 (42.9%) |
| Food Preparation & Serving | 767 (73.4%) | 278 (26.6%) |
| Cleaning & Maintenance | 347 (39.5%) | 531 (60.5%) |
| Personal Care & Service | 121 (16.9%) | 594 (83.1%) |
| Total (Category) | 1,427 (42.3%) | 1,945 (57.7%) |
| Total (Overall) | 11,509 (52.6%) | 10,371 (47.4%) |
Sales and Office Occupations
The most common Sales and Office occupations in Farmers Branch are Office & Administration (2,622 | 12.0%), and Sales & Related (2,284 | 10.4%).

Sales and Office Occupations by Sex
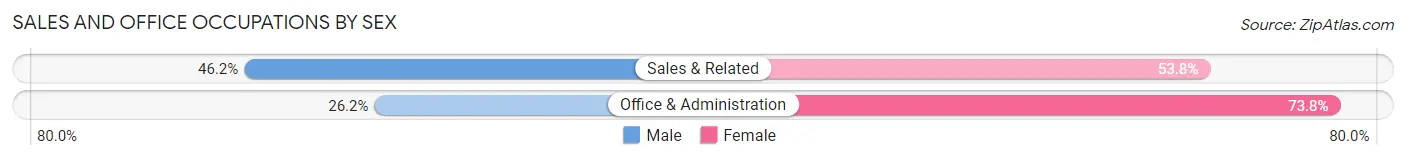
| Occupation | Male | Female |
| Sales & Related | 1,056 (46.2%) | 1,228 (53.8%) |
| Office & Administration | 687 (26.2%) | 1,935 (73.8%) |
| Total (Category) | 1,743 (35.5%) | 3,163 (64.5%) |
| Total (Overall) | 11,509 (52.6%) | 10,371 (47.4%) |
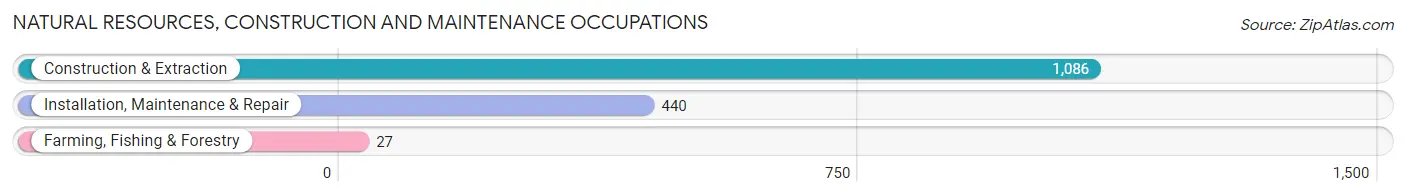
Natural Resources, Construction and Maintenance Occupations
The most common Natural Resources, Construction and Maintenance occupations in Farmers Branch are Construction & Extraction (1,086 | 5.0%), Installation, Maintenance & Repair (440 | 2.0%), and Farming, Fishing & Forestry (27 | 0.1%).
Natural Resources, Construction and Maintenance Occupations by Sex
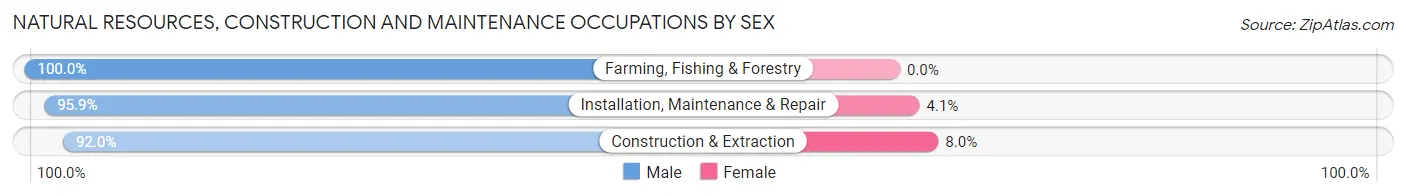
| Occupation | Male | Female |
| Farming, Fishing & Forestry | 27 (100.0%) | 0 (0.0%) |
| Construction & Extraction | 999 (92.0%) | 87 (8.0%) |
| Installation, Maintenance & Repair | 422 (95.9%) | 18 (4.1%) |
| Total (Category) | 1,448 (93.2%) | 105 (6.8%) |
| Total (Overall) | 11,509 (52.6%) | 10,371 (47.4%) |
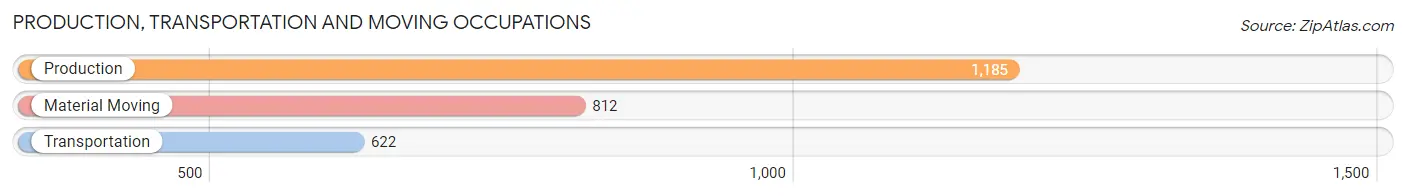
Production, Transportation and Moving Occupations
The most common Production, Transportation and Moving occupations in Farmers Branch are Production (1,185 | 5.4%), Material Moving (812 | 3.7%), and Transportation (622 | 2.8%).
Production, Transportation and Moving Occupations by Sex
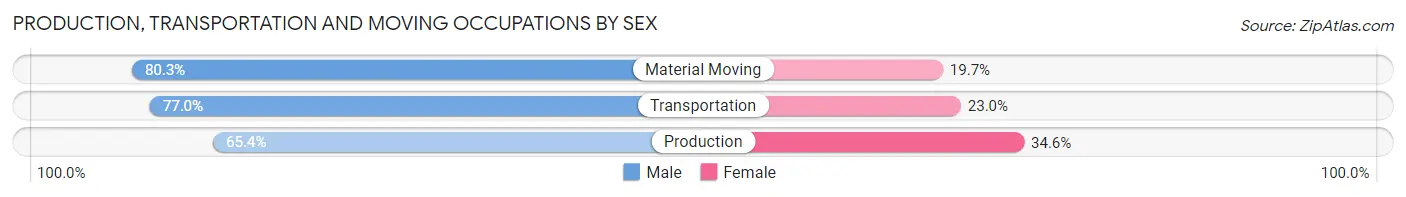
| Occupation | Male | Female |
| Production | 775 (65.4%) | 410 (34.6%) |
| Transportation | 479 (77.0%) | 143 (23.0%) |
| Material Moving | 652 (80.3%) | 160 (19.7%) |
| Total (Category) | 1,906 (72.8%) | 713 (27.2%) |
| Total (Overall) | 11,509 (52.6%) | 10,371 (47.4%) |
Employment Industries by Sex in Farmers Branch
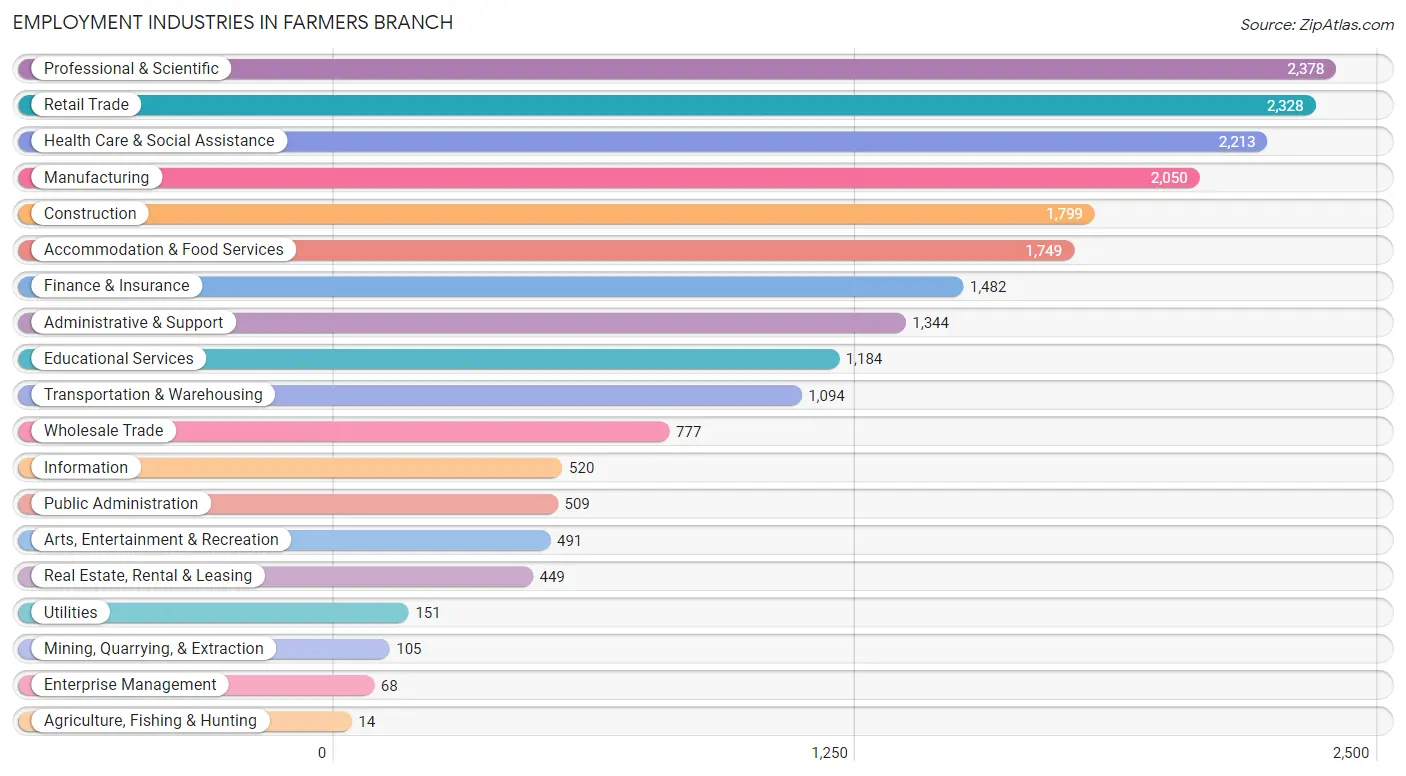
Employment Industries in Farmers Branch
The major employment industries in Farmers Branch include Professional & Scientific (2,378 | 10.9%), Retail Trade (2,328 | 10.6%), Health Care & Social Assistance (2,213 | 10.1%), Manufacturing (2,050 | 9.4%), and Construction (1,799 | 8.2%).
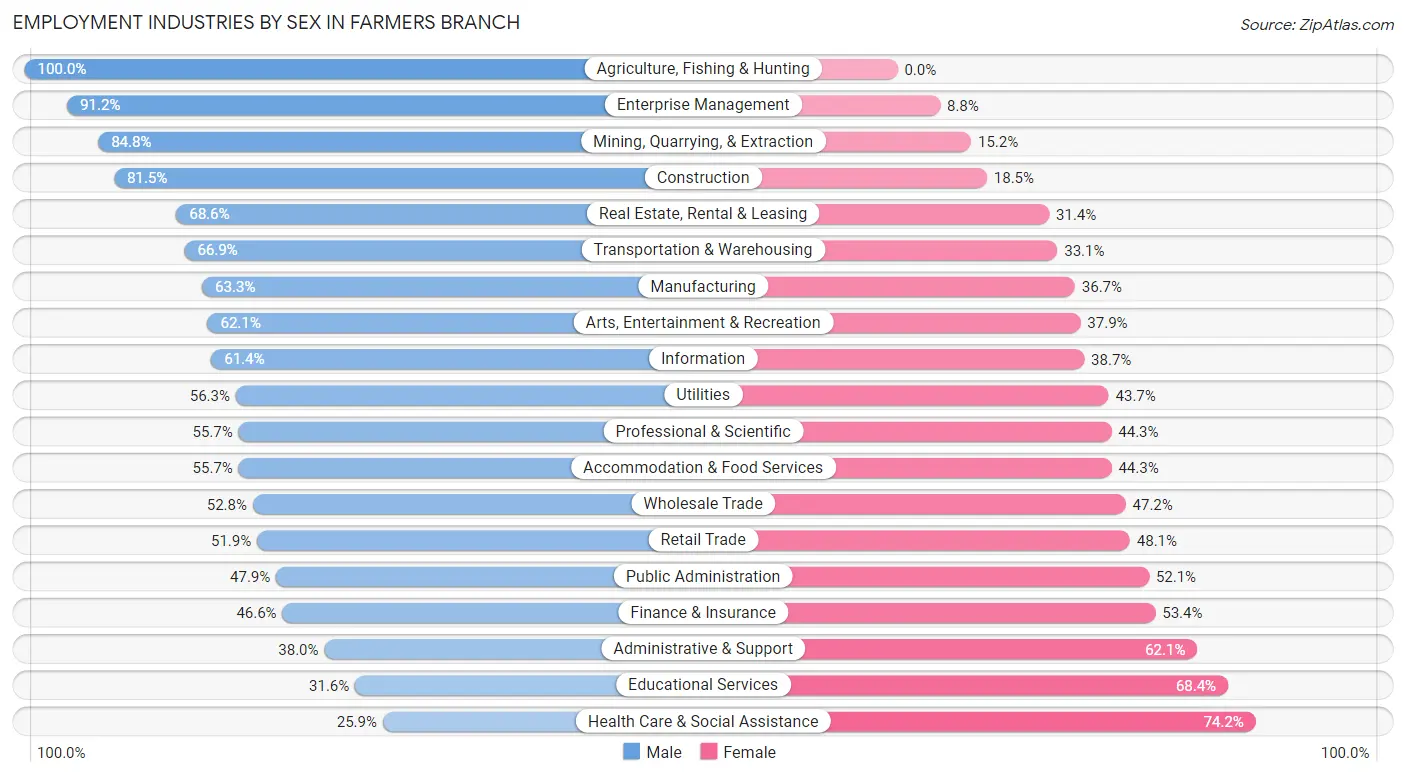
Employment Industries by Sex in Farmers Branch
The Farmers Branch industries that see more men than women are Agriculture, Fishing & Hunting (100.0%), Enterprise Management (91.2%), and Mining, Quarrying, & Extraction (84.8%), whereas the industries that tend to have a higher number of women are Health Care & Social Assistance (74.2%), Educational Services (68.4%), and Administrative & Support (62.1%).
| Industry | Male | Female |
| Agriculture, Fishing & Hunting | 14 (100.0%) | 0 (0.0%) |
| Mining, Quarrying, & Extraction | 89 (84.8%) | 16 (15.2%) |
| Construction | 1,466 (81.5%) | 333 (18.5%) |
| Manufacturing | 1,297 (63.3%) | 753 (36.7%) |
| Wholesale Trade | 410 (52.8%) | 367 (47.2%) |
| Retail Trade | 1,208 (51.9%) | 1,120 (48.1%) |
| Transportation & Warehousing | 732 (66.9%) | 362 (33.1%) |
| Utilities | 85 (56.3%) | 66 (43.7%) |
| Information | 319 (61.4%) | 201 (38.7%) |
| Finance & Insurance | 691 (46.6%) | 791 (53.4%) |
| Real Estate, Rental & Leasing | 308 (68.6%) | 141 (31.4%) |
| Professional & Scientific | 1,325 (55.7%) | 1,053 (44.3%) |
| Enterprise Management | 62 (91.2%) | 6 (8.8%) |
| Administrative & Support | 510 (38.0%) | 834 (62.1%) |
| Educational Services | 374 (31.6%) | 810 (68.4%) |
| Health Care & Social Assistance | 572 (25.9%) | 1,641 (74.2%) |
| Arts, Entertainment & Recreation | 305 (62.1%) | 186 (37.9%) |
| Accommodation & Food Services | 974 (55.7%) | 775 (44.3%) |
| Public Administration | 244 (47.9%) | 265 (52.1%) |
| Total | 11,509 (52.6%) | 10,371 (47.4%) |
Education in Farmers Branch
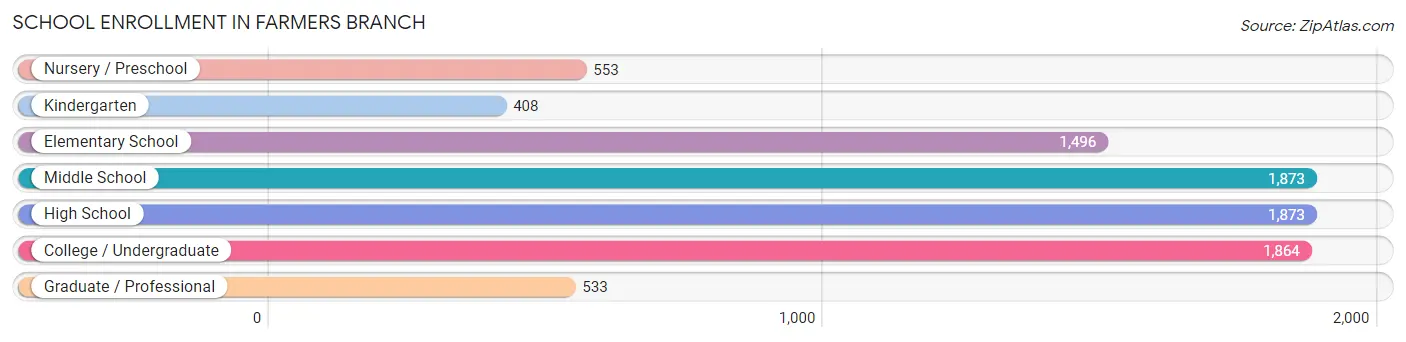
School Enrollment in Farmers Branch
The most common levels of schooling among the 8,600 students in Farmers Branch are middle school (1,873 | 21.8%), high school (1,873 | 21.8%), and college / undergraduate (1,864 | 21.7%).
| School Level | # Students | % Students |
| Nursery / Preschool | 553 | 6.4% |
| Kindergarten | 408 | 4.7% |
| Elementary School | 1,496 | 17.4% |
| Middle School | 1,873 | 21.8% |
| High School | 1,873 | 21.8% |
| College / Undergraduate | 1,864 | 21.7% |
| Graduate / Professional | 533 | 6.2% |
| Total | 8,600 | 100.0% |
School Enrollment by Age by Funding Source in Farmers Branch
Out of a total of 8,600 students who are enrolled in schools in Farmers Branch, 1,514 (17.6%) attend a private institution, while the remaining 7,086 (82.4%) are enrolled in public schools. The age group of 25 to 34 year olds has the highest likelihood of being enrolled in private schools, with 256 (27.5% in the age bracket) enrolled. Conversely, the age group of 15 to 17 year olds has the lowest likelihood of being enrolled in a private school, with 1,308 (93.2% in the age bracket) attending a public institution.
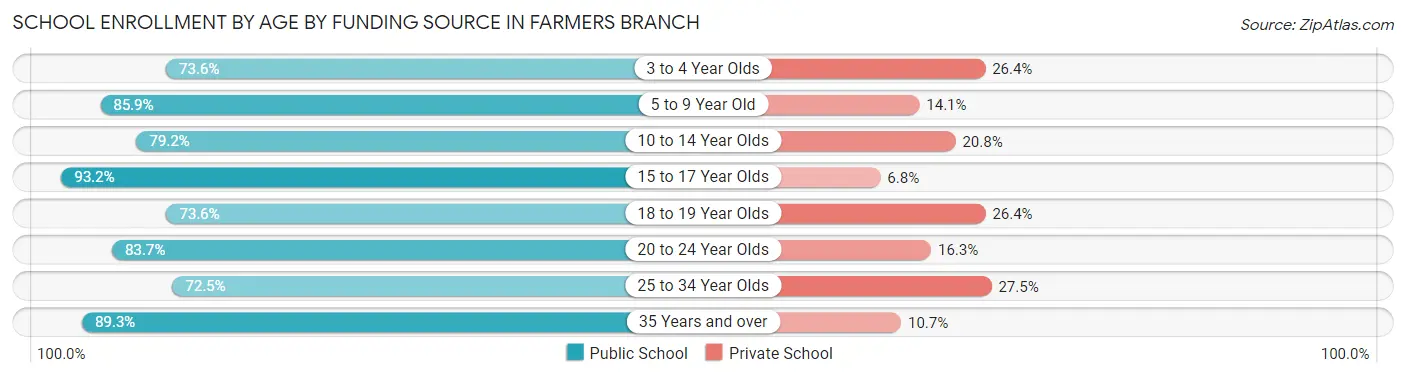
| Age Bracket | Public School | Private School |
| 3 to 4 Year Olds | 366 (73.6%) | 131 (26.4%) |
| 5 to 9 Year Old | 1,669 (85.9%) | 274 (14.1%) |
| 10 to 14 Year Olds | 1,657 (79.2%) | 436 (20.8%) |
| 15 to 17 Year Olds | 1,308 (93.2%) | 96 (6.8%) |
| 18 to 19 Year Olds | 432 (73.6%) | 155 (26.4%) |
| 20 to 24 Year Olds | 607 (83.7%) | 118 (16.3%) |
| 25 to 34 Year Olds | 674 (72.5%) | 256 (27.5%) |
| 35 Years and over | 376 (89.3%) | 45 (10.7%) |
| Total | 7,086 (82.4%) | 1,514 (17.6%) |
Educational Attainment by Field of Study in Farmers Branch
Business (3,612 | 29.9%), engineering (981 | 8.1%), computers & mathematics (949 | 7.9%), social sciences (821 | 6.8%), and arts & humanities (797 | 6.6%) are the most common fields of study among 12,091 individuals in Farmers Branch who have obtained a bachelor's degree or higher.
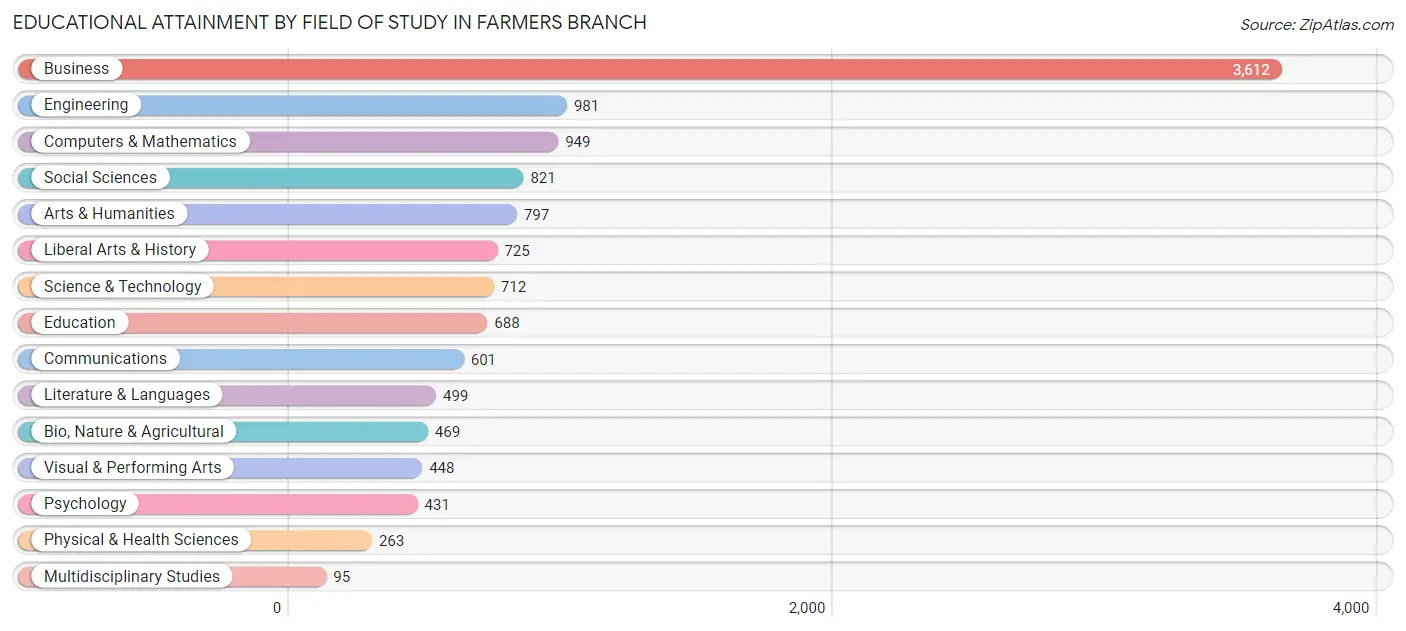
| Field of Study | # Graduates | % Graduates |
| Computers & Mathematics | 949 | 7.9% |
| Bio, Nature & Agricultural | 469 | 3.9% |
| Physical & Health Sciences | 263 | 2.2% |
| Psychology | 431 | 3.6% |
| Social Sciences | 821 | 6.8% |
| Engineering | 981 | 8.1% |
| Multidisciplinary Studies | 95 | 0.8% |
| Science & Technology | 712 | 5.9% |
| Business | 3,612 | 29.9% |
| Education | 688 | 5.7% |
| Literature & Languages | 499 | 4.1% |
| Liberal Arts & History | 725 | 6.0% |
| Visual & Performing Arts | 448 | 3.7% |
| Communications | 601 | 5.0% |
| Arts & Humanities | 797 | 6.6% |
| Total | 12,091 | 100.0% |
Transportation & Commute in Farmers Branch
Vehicle Availability by Sex in Farmers Branch
The most prevalent vehicle ownership categories in Farmers Branch are males with 2 vehicles (4,979, accounting for 43.9%) and females with 2 vehicles (4,029, making up 48.4%).
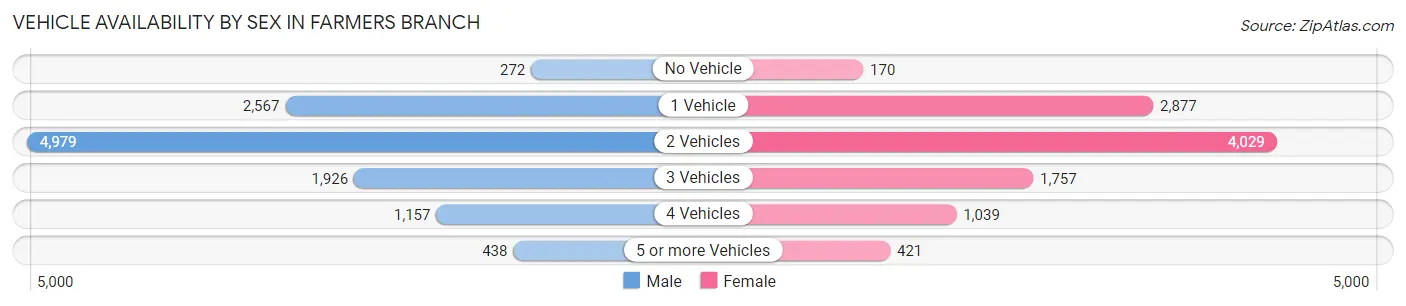
| Vehicles Available | Male | Female |
| No Vehicle | 272 (2.4%) | 170 (1.7%) |
| 1 Vehicle | 2,567 (22.6%) | 2,877 (28.0%) |
| 2 Vehicles | 4,979 (43.9%) | 4,029 (39.1%) |
| 3 Vehicles | 1,926 (17.0%) | 1,757 (17.1%) |
| 4 Vehicles | 1,157 (10.2%) | 1,039 (10.1%) |
| 5 or more Vehicles | 438 (3.9%) | 421 (4.1%) |
| Total | 11,339 (100.0%) | 10,293 (100.0%) |
Commute Time in Farmers Branch
The most frequently occuring commute durations in Farmers Branch are 20 to 24 minutes (4,048 commuters, 21.6%), 30 to 34 minutes (3,311 commuters, 17.6%), and 15 to 19 minutes (3,280 commuters, 17.5%).
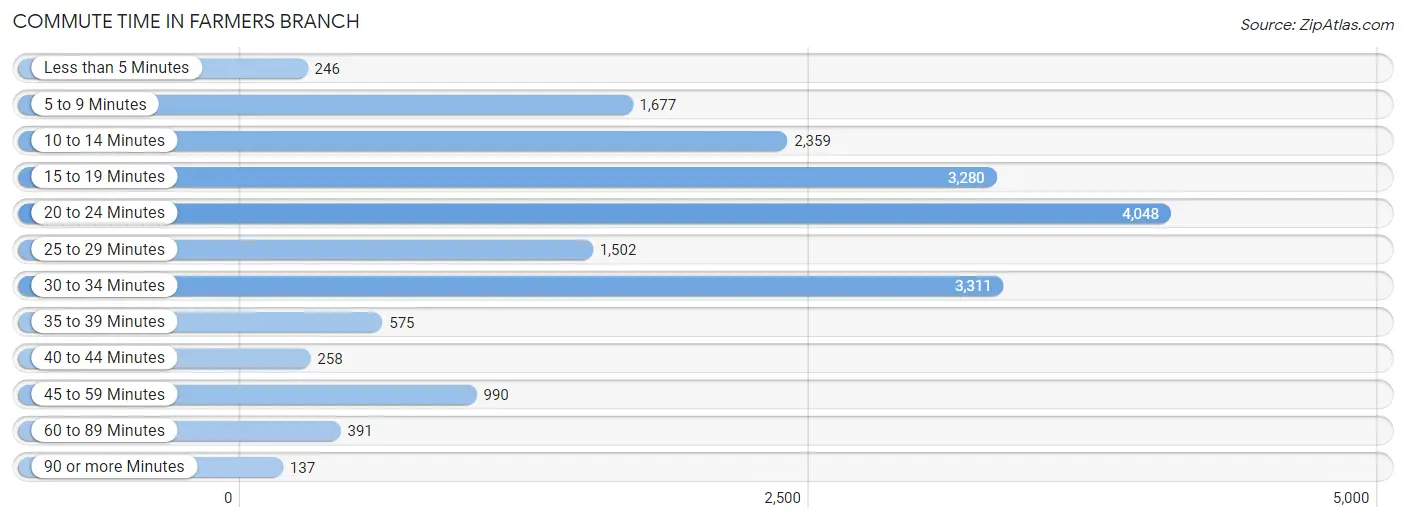
| Commute Time | # Commuters | % Commuters |
| Less than 5 Minutes | 246 | 1.3% |
| 5 to 9 Minutes | 1,677 | 8.9% |
| 10 to 14 Minutes | 2,359 | 12.6% |
| 15 to 19 Minutes | 3,280 | 17.5% |
| 20 to 24 Minutes | 4,048 | 21.6% |
| 25 to 29 Minutes | 1,502 | 8.0% |
| 30 to 34 Minutes | 3,311 | 17.6% |
| 35 to 39 Minutes | 575 | 3.1% |
| 40 to 44 Minutes | 258 | 1.4% |
| 45 to 59 Minutes | 990 | 5.3% |
| 60 to 89 Minutes | 391 | 2.1% |
| 90 or more Minutes | 137 | 0.7% |
Commute Time by Sex in Farmers Branch
The most common commute times in Farmers Branch are 20 to 24 minutes (2,096 commuters, 20.7%) for males and 20 to 24 minutes (1,952 commuters, 22.5%) for females.
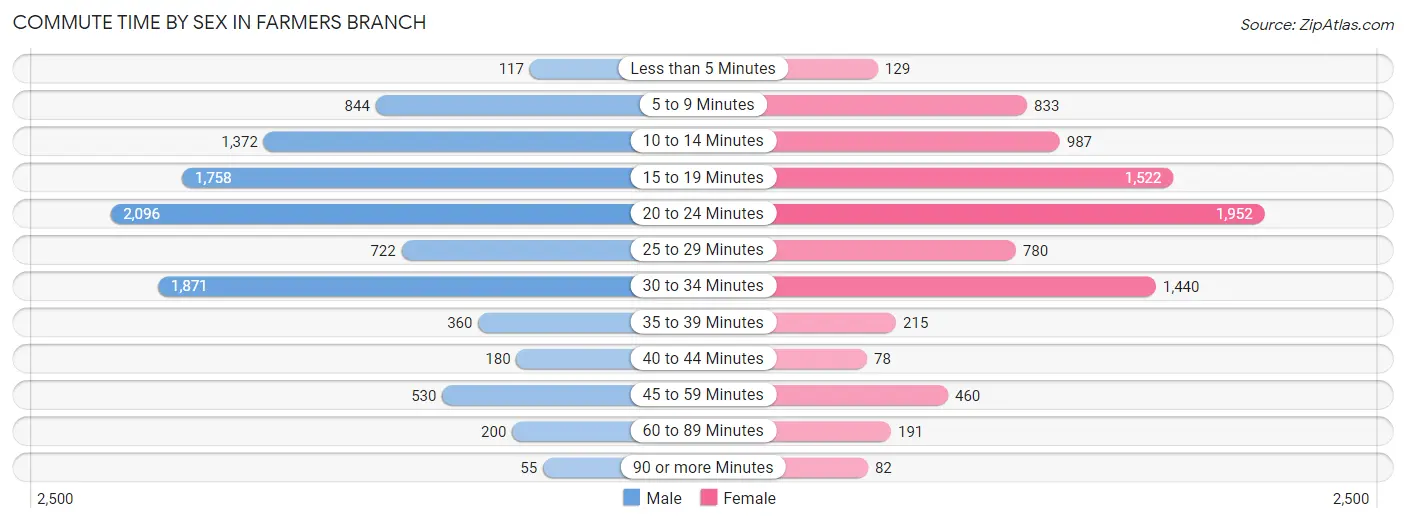
| Commute Time | Male | Female |
| Less than 5 Minutes | 117 (1.2%) | 129 (1.5%) |
| 5 to 9 Minutes | 844 (8.4%) | 833 (9.6%) |
| 10 to 14 Minutes | 1,372 (13.6%) | 987 (11.4%) |
| 15 to 19 Minutes | 1,758 (17.4%) | 1,522 (17.6%) |
| 20 to 24 Minutes | 2,096 (20.7%) | 1,952 (22.5%) |
| 25 to 29 Minutes | 722 (7.1%) | 780 (9.0%) |
| 30 to 34 Minutes | 1,871 (18.5%) | 1,440 (16.6%) |
| 35 to 39 Minutes | 360 (3.6%) | 215 (2.5%) |
| 40 to 44 Minutes | 180 (1.8%) | 78 (0.9%) |
| 45 to 59 Minutes | 530 (5.2%) | 460 (5.3%) |
| 60 to 89 Minutes | 200 (2.0%) | 191 (2.2%) |
| 90 or more Minutes | 55 (0.5%) | 82 (0.9%) |
Time of Departure to Work by Sex in Farmers Branch
The most frequent times of departure to work in Farmers Branch are 7:00 AM to 7:29 AM (1,502, 14.9%) for males and 8:00 AM to 8:29 AM (1,889, 21.8%) for females.
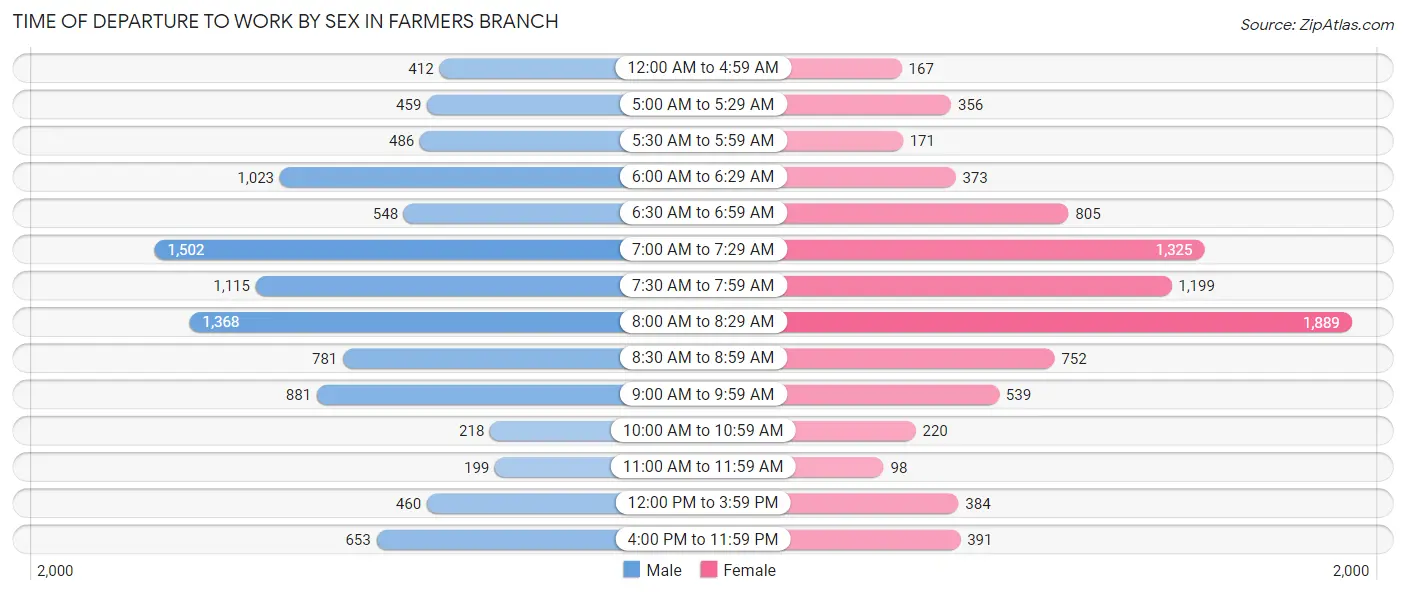
| Time of Departure | Male | Female |
| 12:00 AM to 4:59 AM | 412 (4.1%) | 167 (1.9%) |
| 5:00 AM to 5:29 AM | 459 (4.5%) | 356 (4.1%) |
| 5:30 AM to 5:59 AM | 486 (4.8%) | 171 (2.0%) |
| 6:00 AM to 6:29 AM | 1,023 (10.1%) | 373 (4.3%) |
| 6:30 AM to 6:59 AM | 548 (5.4%) | 805 (9.3%) |
| 7:00 AM to 7:29 AM | 1,502 (14.9%) | 1,325 (15.3%) |
| 7:30 AM to 7:59 AM | 1,115 (11.0%) | 1,199 (13.8%) |
| 8:00 AM to 8:29 AM | 1,368 (13.5%) | 1,889 (21.8%) |
| 8:30 AM to 8:59 AM | 781 (7.7%) | 752 (8.7%) |
| 9:00 AM to 9:59 AM | 881 (8.7%) | 539 (6.2%) |
| 10:00 AM to 10:59 AM | 218 (2.2%) | 220 (2.5%) |
| 11:00 AM to 11:59 AM | 199 (2.0%) | 98 (1.1%) |
| 12:00 PM to 3:59 PM | 460 (4.5%) | 384 (4.4%) |
| 4:00 PM to 11:59 PM | 653 (6.5%) | 391 (4.5%) |
| Total | 10,105 (100.0%) | 8,669 (100.0%) |
Housing Occupancy in Farmers Branch
Occupancy by Ownership in Farmers Branch
Of the total 14,463 dwellings in Farmers Branch, owner-occupied units account for 6,955 (48.1%), while renter-occupied units make up 7,508 (51.9%).
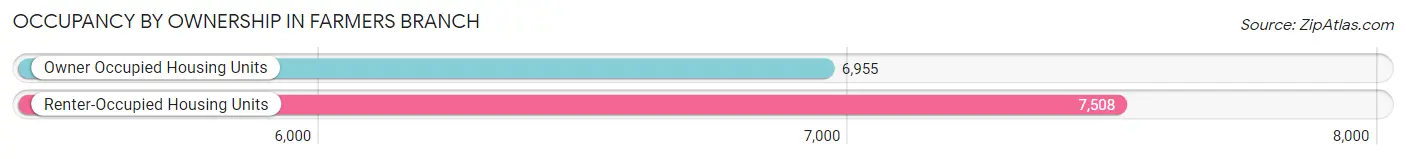
| Occupancy | # Housing Units | % Housing Units |
| Owner Occupied Housing Units | 6,955 | 48.1% |
| Renter-Occupied Housing Units | 7,508 | 51.9% |
| Total Occupied Housing Units | 14,463 | 100.0% |
Occupancy by Household Size in Farmers Branch
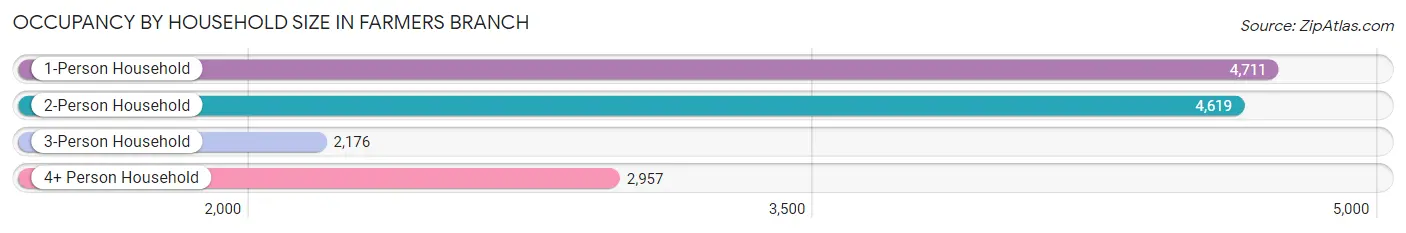
| Household Size | # Housing Units | % Housing Units |
| 1-Person Household | 4,711 | 32.6% |
| 2-Person Household | 4,619 | 31.9% |
| 3-Person Household | 2,176 | 15.0% |
| 4+ Person Household | 2,957 | 20.4% |
| Total Housing Units | 14,463 | 100.0% |
Occupancy by Ownership by Household Size in Farmers Branch
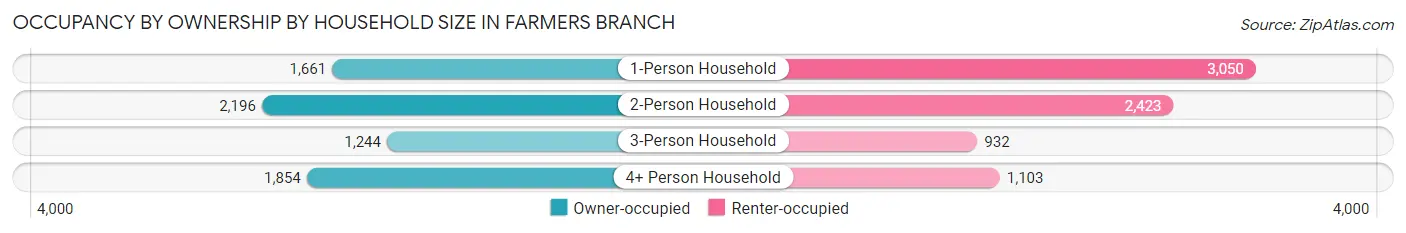
| Household Size | Owner-occupied | Renter-occupied |
| 1-Person Household | 1,661 (35.3%) | 3,050 (64.7%) |
| 2-Person Household | 2,196 (47.5%) | 2,423 (52.5%) |
| 3-Person Household | 1,244 (57.2%) | 932 (42.8%) |
| 4+ Person Household | 1,854 (62.7%) | 1,103 (37.3%) |
| Total Housing Units | 6,955 (48.1%) | 7,508 (51.9%) |
Occupancy by Educational Attainment in Farmers Branch
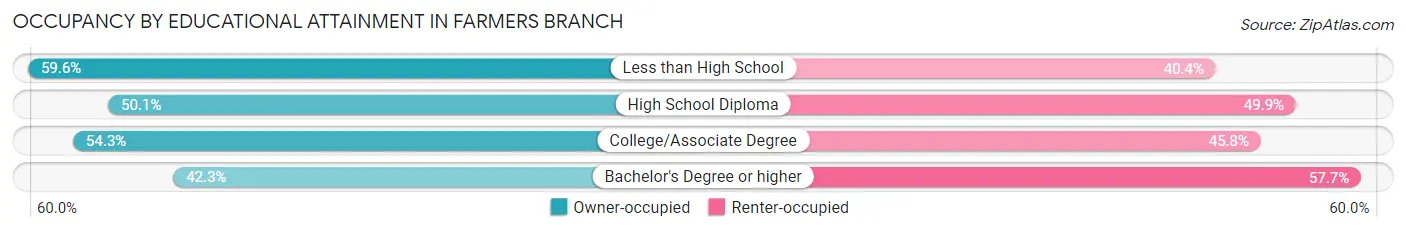
| Household Size | Owner-occupied | Renter-occupied |
| Less than High School | 1,024 (59.6%) | 694 (40.4%) |
| High School Diploma | 1,059 (50.1%) | 1,056 (49.9%) |
| College/Associate Degree | 1,697 (54.2%) | 1,431 (45.8%) |
| Bachelor's Degree or higher | 3,175 (42.3%) | 4,327 (57.7%) |
Occupancy by Age of Householder in Farmers Branch
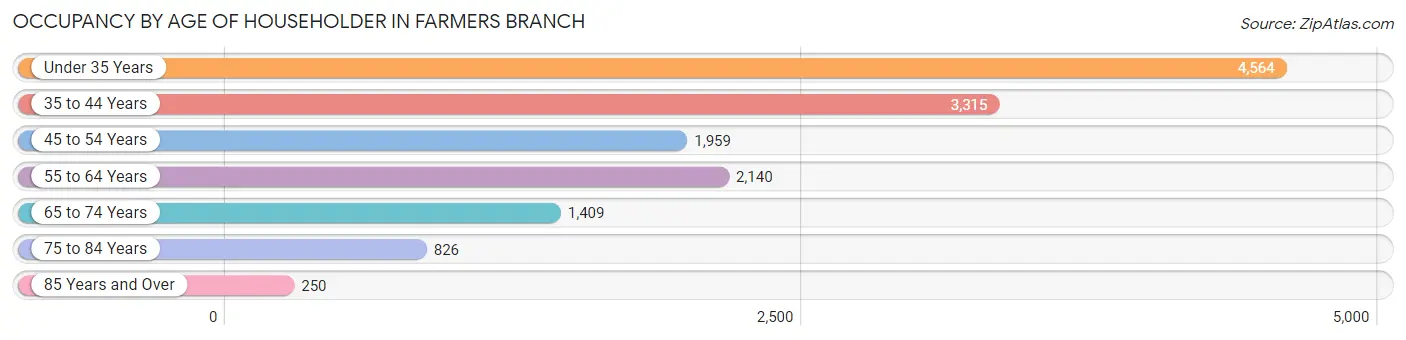
| Age Bracket | # Households | % Households |
| Under 35 Years | 4,564 | 31.6% |
| 35 to 44 Years | 3,315 | 22.9% |
| 45 to 54 Years | 1,959 | 13.5% |
| 55 to 64 Years | 2,140 | 14.8% |
| 65 to 74 Years | 1,409 | 9.7% |
| 75 to 84 Years | 826 | 5.7% |
| 85 Years and Over | 250 | 1.7% |
| Total | 14,463 | 100.0% |
Housing Finances in Farmers Branch
Median Income by Occupancy in Farmers Branch
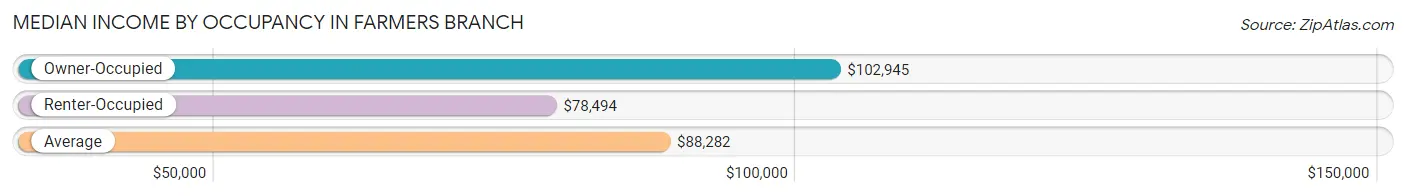
| Occupancy Type | # Households | Median Income |
| Owner-Occupied | 6,955 (48.1%) | $102,945 |
| Renter-Occupied | 7,508 (51.9%) | $78,494 |
| Average | 14,463 (100.0%) | $88,282 |
Occupancy by Householder Income Bracket in Farmers Branch
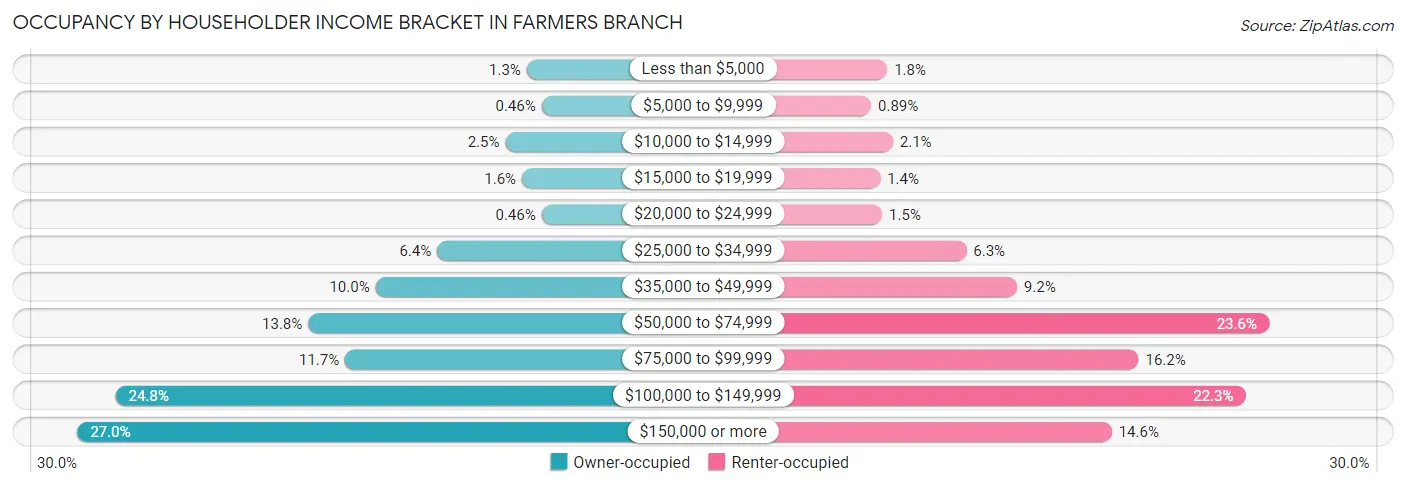
| Income Bracket | Owner-occupied | Renter-occupied |
| Less than $5,000 | 91 (1.3%) | 136 (1.8%) |
| $5,000 to $9,999 | 32 (0.5%) | 67 (0.9%) |
| $10,000 to $14,999 | 176 (2.5%) | 160 (2.1%) |
| $15,000 to $19,999 | 110 (1.6%) | 106 (1.4%) |
| $20,000 to $24,999 | 32 (0.5%) | 114 (1.5%) |
| $25,000 to $34,999 | 447 (6.4%) | 475 (6.3%) |
| $35,000 to $49,999 | 692 (10.0%) | 692 (9.2%) |
| $50,000 to $74,999 | 960 (13.8%) | 1,773 (23.6%) |
| $75,000 to $99,999 | 813 (11.7%) | 1,214 (16.2%) |
| $100,000 to $149,999 | 1,725 (24.8%) | 1,672 (22.3%) |
| $150,000 or more | 1,877 (27.0%) | 1,099 (14.6%) |
| Total | 6,955 (100.0%) | 7,508 (100.0%) |
Monthly Housing Cost Tiers in Farmers Branch
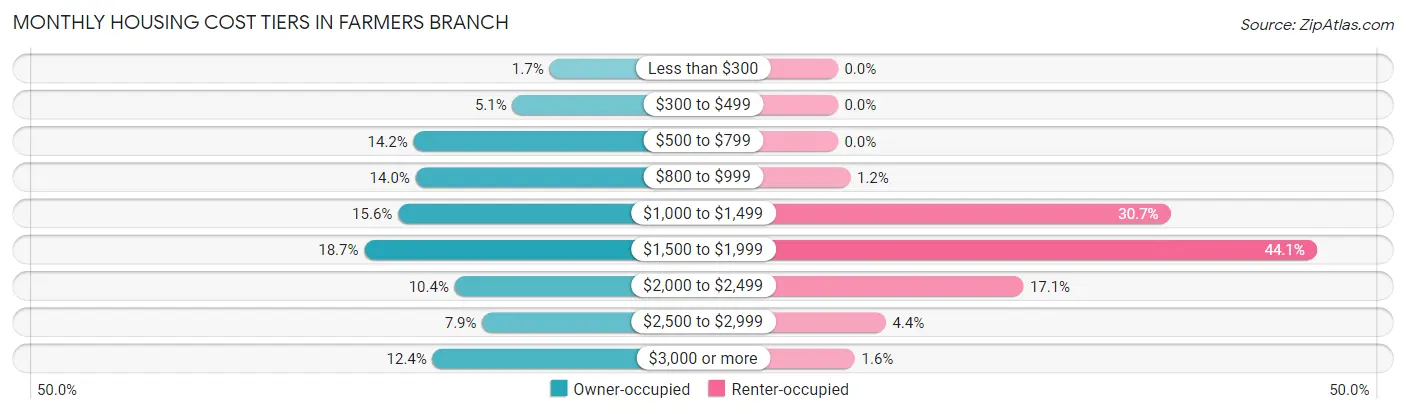
| Monthly Cost | Owner-occupied | Renter-occupied |
| Less than $300 | 117 (1.7%) | 0 (0.0%) |
| $300 to $499 | 353 (5.1%) | 0 (0.0%) |
| $500 to $799 | 987 (14.2%) | 0 (0.0%) |
| $800 to $999 | 974 (14.0%) | 87 (1.2%) |
| $1,000 to $1,499 | 1,086 (15.6%) | 2,301 (30.6%) |
| $1,500 to $1,999 | 1,303 (18.7%) | 3,313 (44.1%) |
| $2,000 to $2,499 | 723 (10.4%) | 1,282 (17.1%) |
| $2,500 to $2,999 | 547 (7.9%) | 332 (4.4%) |
| $3,000 or more | 865 (12.4%) | 119 (1.6%) |
| Total | 6,955 (100.0%) | 7,508 (100.0%) |
Physical Housing Characteristics in Farmers Branch
Housing Structures in Farmers Branch
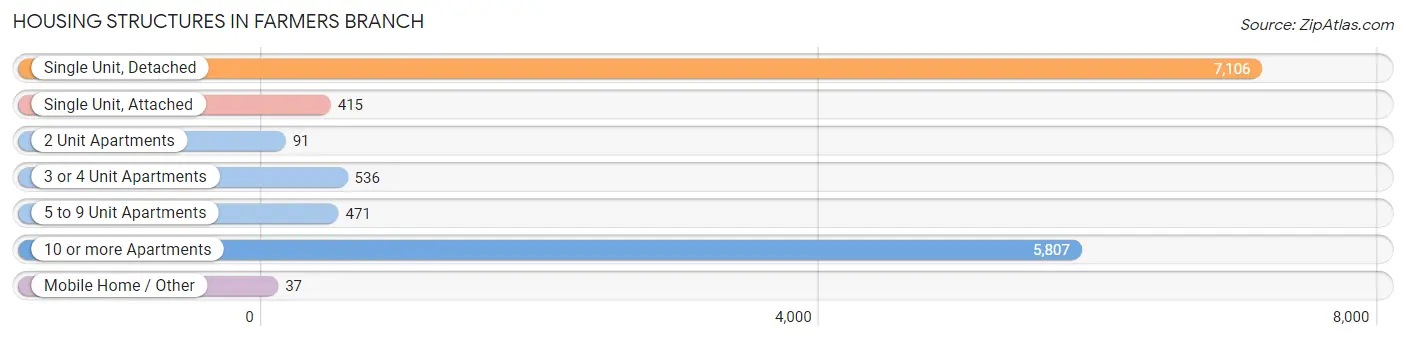
| Structure Type | # Housing Units | % Housing Units |
| Single Unit, Detached | 7,106 | 49.1% |
| Single Unit, Attached | 415 | 2.9% |
| 2 Unit Apartments | 91 | 0.6% |
| 3 or 4 Unit Apartments | 536 | 3.7% |
| 5 to 9 Unit Apartments | 471 | 3.3% |
| 10 or more Apartments | 5,807 | 40.2% |
| Mobile Home / Other | 37 | 0.3% |
| Total | 14,463 | 100.0% |
Housing Structures by Occupancy in Farmers Branch
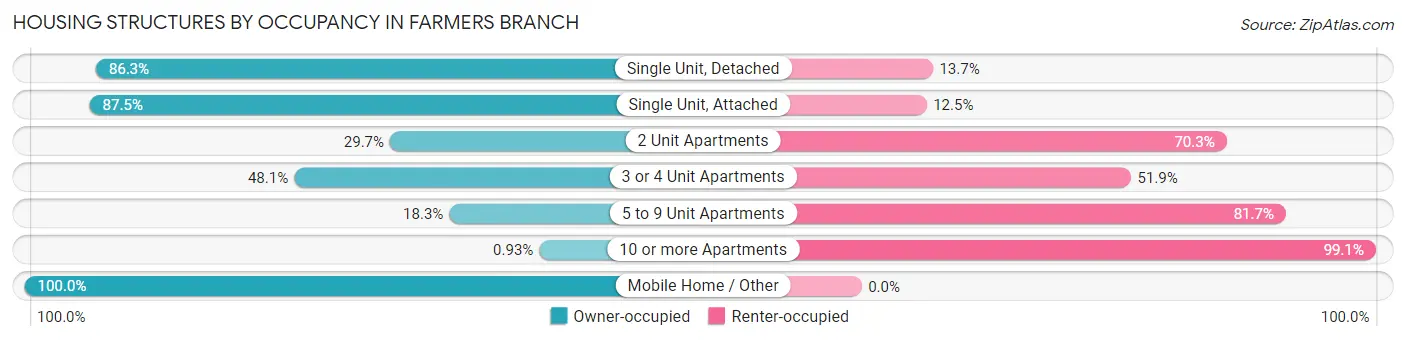
| Structure Type | Owner-occupied | Renter-occupied |
| Single Unit, Detached | 6,130 (86.3%) | 976 (13.7%) |
| Single Unit, Attached | 363 (87.5%) | 52 (12.5%) |
| 2 Unit Apartments | 27 (29.7%) | 64 (70.3%) |
| 3 or 4 Unit Apartments | 258 (48.1%) | 278 (51.9%) |
| 5 to 9 Unit Apartments | 86 (18.3%) | 385 (81.7%) |
| 10 or more Apartments | 54 (0.9%) | 5,753 (99.1%) |
| Mobile Home / Other | 37 (100.0%) | 0 (0.0%) |
| Total | 6,955 (48.1%) | 7,508 (51.9%) |
Housing Structures by Number of Rooms in Farmers Branch
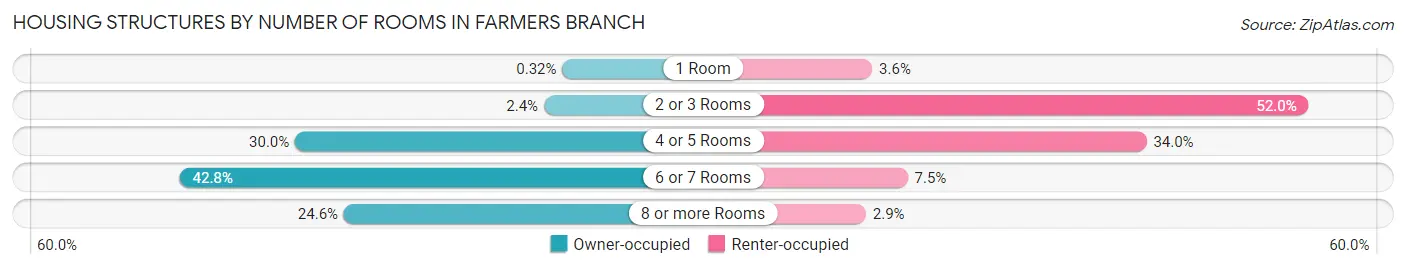
| Number of Rooms | Owner-occupied | Renter-occupied |
| 1 Room | 22 (0.3%) | 269 (3.6%) |
| 2 or 3 Rooms | 164 (2.4%) | 3,905 (52.0%) |
| 4 or 5 Rooms | 2,085 (30.0%) | 2,554 (34.0%) |
| 6 or 7 Rooms | 2,976 (42.8%) | 564 (7.5%) |
| 8 or more Rooms | 1,708 (24.6%) | 216 (2.9%) |
| Total | 6,955 (100.0%) | 7,508 (100.0%) |
Housing Structure by Heating Type in Farmers Branch
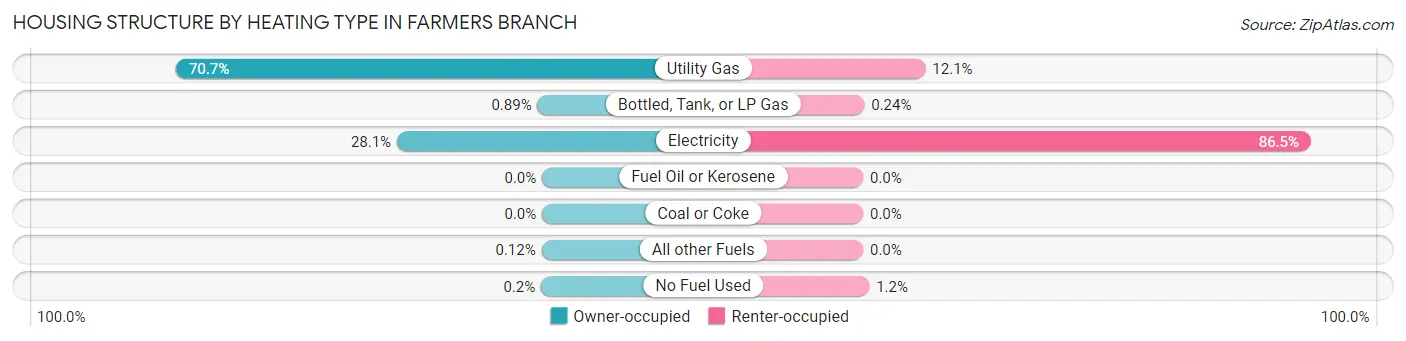
| Heating Type | Owner-occupied | Renter-occupied |
| Utility Gas | 4,920 (70.7%) | 905 (12.0%) |
| Bottled, Tank, or LP Gas | 62 (0.9%) | 18 (0.2%) |
| Electricity | 1,951 (28.1%) | 6,495 (86.5%) |
| Fuel Oil or Kerosene | 0 (0.0%) | 0 (0.0%) |
| Coal or Coke | 0 (0.0%) | 0 (0.0%) |
| All other Fuels | 8 (0.1%) | 0 (0.0%) |
| No Fuel Used | 14 (0.2%) | 90 (1.2%) |
| Total | 6,955 (100.0%) | 7,508 (100.0%) |
Household Vehicle Usage in Farmers Branch
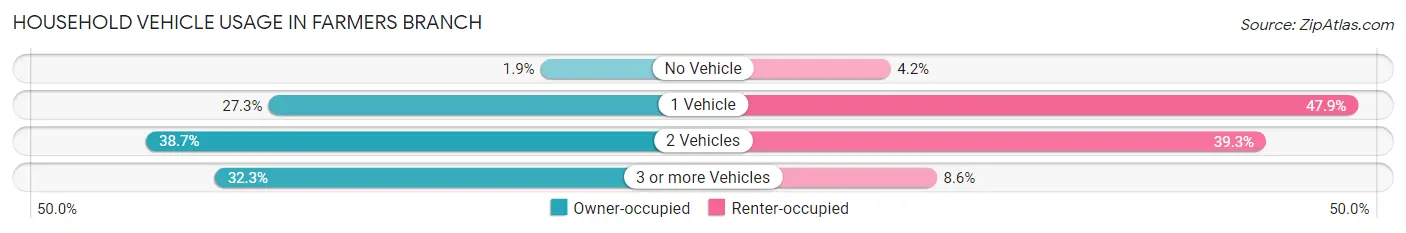
| Vehicles per Household | Owner-occupied | Renter-occupied |
| No Vehicle | 129 (1.8%) | 318 (4.2%) |
| 1 Vehicle | 1,895 (27.3%) | 3,597 (47.9%) |
| 2 Vehicles | 2,688 (38.7%) | 2,951 (39.3%) |
| 3 or more Vehicles | 2,243 (32.3%) | 642 (8.6%) |
| Total | 6,955 (100.0%) | 7,508 (100.0%) |
Real Estate & Mortgages in Farmers Branch
Real Estate and Mortgage Overview in Farmers Branch
| Characteristic | Without Mortgage | With Mortgage |
| Housing Units | 2,868 | 4,087 |
| Median Property Value | $248,700 | $323,800 |
| Median Household Income | $76,342 | $1,289 |
| Monthly Housing Costs | $807 | $841 |
| Real Estate Taxes | $3,471 | $102 |
Property Value by Mortgage Status in Farmers Branch
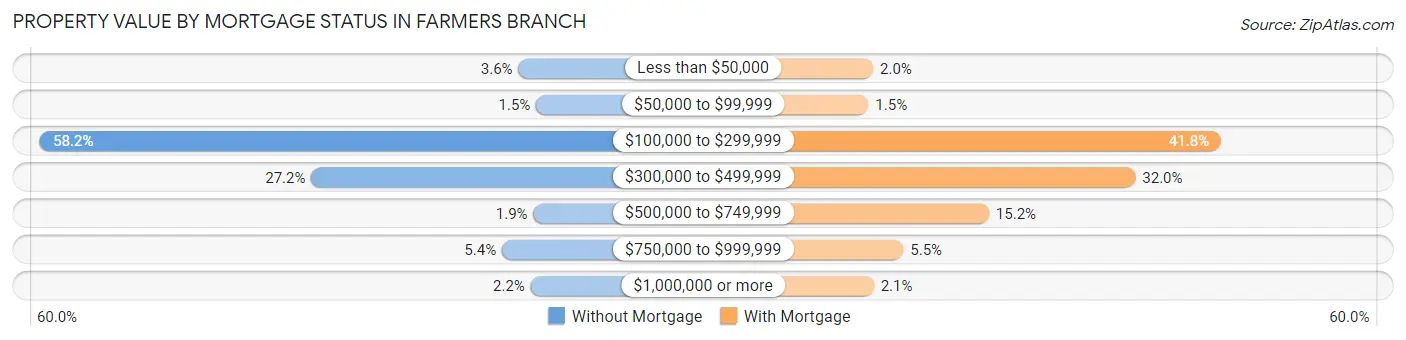
| Property Value | Without Mortgage | With Mortgage |
| Less than $50,000 | 102 (3.6%) | 82 (2.0%) |
| $50,000 to $99,999 | 44 (1.5%) | 60 (1.5%) |
| $100,000 to $299,999 | 1,670 (58.2%) | 1,707 (41.8%) |
| $300,000 to $499,999 | 781 (27.2%) | 1,307 (32.0%) |
| $500,000 to $749,999 | 53 (1.8%) | 623 (15.2%) |
| $750,000 to $999,999 | 156 (5.4%) | 223 (5.5%) |
| $1,000,000 or more | 62 (2.2%) | 85 (2.1%) |
| Total | 2,868 (100.0%) | 4,087 (100.0%) |
Household Income by Mortgage Status in Farmers Branch
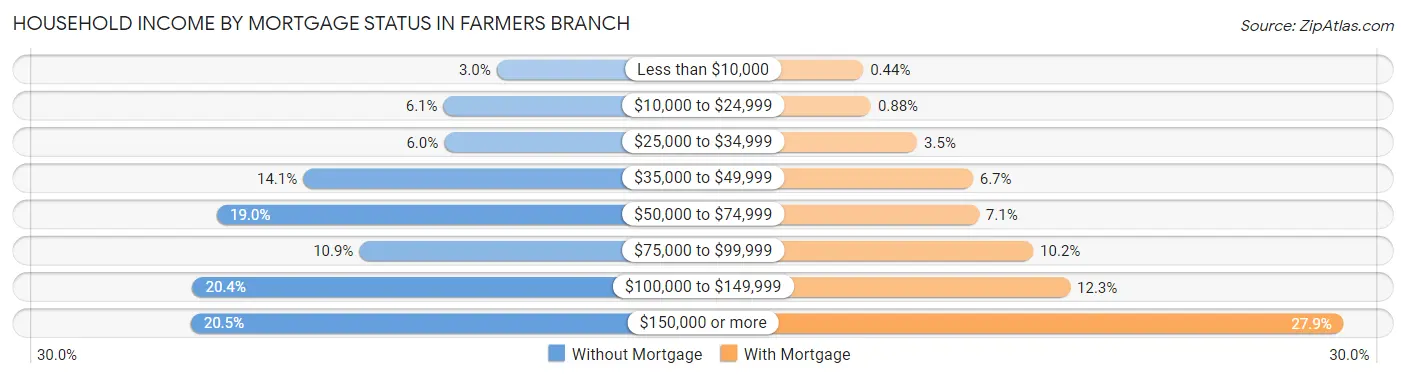
| Household Income | Without Mortgage | With Mortgage |
| Less than $10,000 | 87 (3.0%) | 18 (0.4%) |
| $10,000 to $24,999 | 174 (6.1%) | 36 (0.9%) |
| $25,000 to $34,999 | 173 (6.0%) | 144 (3.5%) |
| $35,000 to $49,999 | 404 (14.1%) | 274 (6.7%) |
| $50,000 to $74,999 | 545 (19.0%) | 288 (7.0%) |
| $75,000 to $99,999 | 312 (10.9%) | 415 (10.2%) |
| $100,000 to $149,999 | 585 (20.4%) | 501 (12.3%) |
| $150,000 or more | 588 (20.5%) | 1,140 (27.9%) |
| Total | 2,868 (100.0%) | 4,087 (100.0%) |
Property Value to Household Income Ratio in Farmers Branch
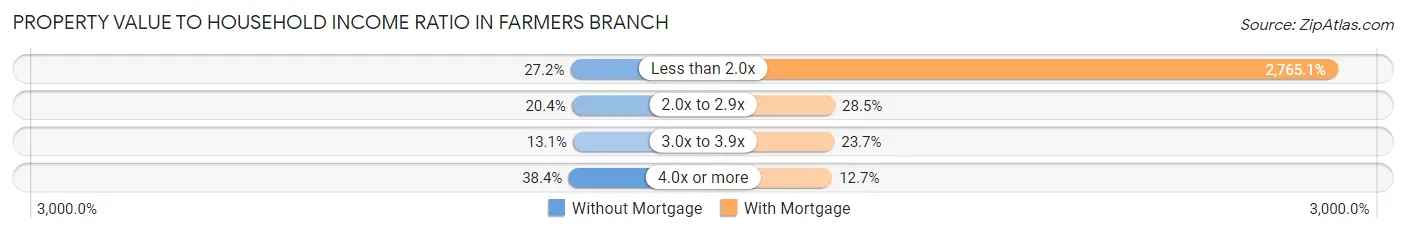
| Value-to-Income Ratio | Without Mortgage | With Mortgage |
| Less than 2.0x | 779 (27.2%) | 113,011 (2,765.1%) |
| 2.0x to 2.9x | 586 (20.4%) | 1,163 (28.5%) |
| 3.0x to 3.9x | 376 (13.1%) | 968 (23.7%) |
| 4.0x or more | 1,101 (38.4%) | 517 (12.7%) |
| Total | 2,868 (100.0%) | 4,087 (100.0%) |
Real Estate Taxes by Mortgage Status in Farmers Branch
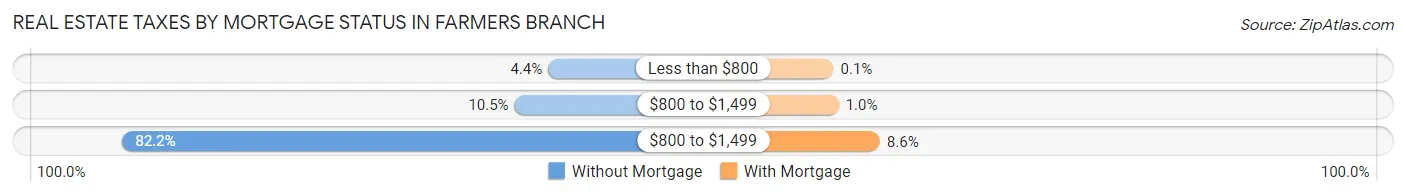
| Property Taxes | Without Mortgage | With Mortgage |
| Less than $800 | 126 (4.4%) | 4 (0.1%) |
| $800 to $1,499 | 302 (10.5%) | 42 (1.0%) |
| $800 to $1,499 | 2,356 (82.2%) | 350 (8.6%) |
| Total | 2,868 (100.0%) | 4,087 (100.0%) |
Health & Disability in Farmers Branch
Health Insurance Coverage by Age in Farmers Branch
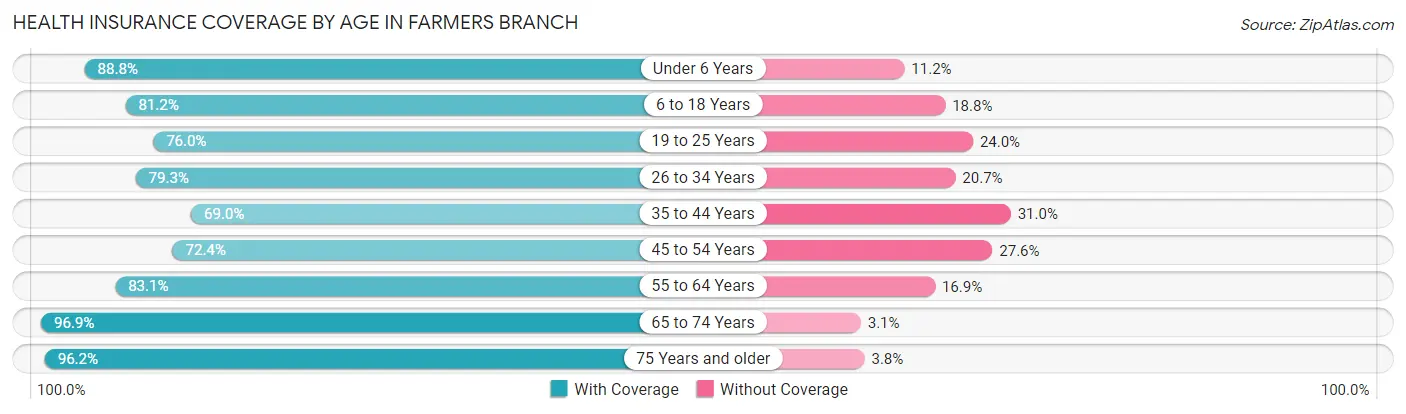
| Age Bracket | With Coverage | Without Coverage |
| Under 6 Years | 2,241 (88.8%) | 283 (11.2%) |
| 6 to 18 Years | 4,504 (81.2%) | 1,044 (18.8%) |
| 19 to 25 Years | 2,722 (76.0%) | 859 (24.0%) |
| 26 to 34 Years | 5,567 (79.3%) | 1,455 (20.7%) |
| 35 to 44 Years | 3,821 (69.0%) | 1,720 (31.0%) |
| 45 to 54 Years | 2,643 (72.4%) | 1,008 (27.6%) |
| 55 to 64 Years | 3,134 (83.1%) | 638 (16.9%) |
| 65 to 74 Years | 2,484 (96.9%) | 79 (3.1%) |
| 75 Years and older | 1,708 (96.2%) | 67 (3.8%) |
| Total | 28,824 (80.1%) | 7,153 (19.9%) |
Health Insurance Coverage by Citizenship Status in Farmers Branch
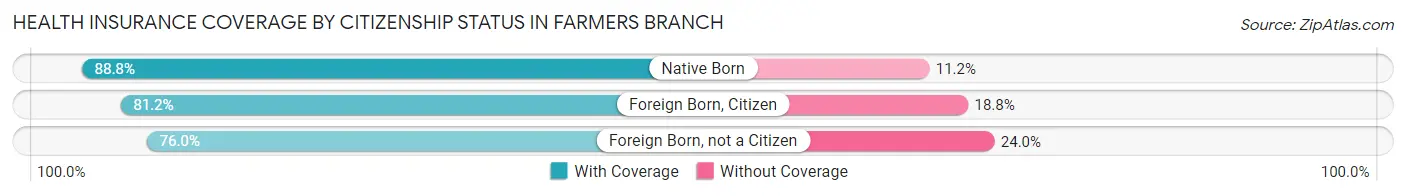
| Citizenship Status | With Coverage | Without Coverage |
| Native Born | 2,241 (88.8%) | 283 (11.2%) |
| Foreign Born, Citizen | 4,504 (81.2%) | 1,044 (18.8%) |
| Foreign Born, not a Citizen | 2,722 (76.0%) | 859 (24.0%) |
Health Insurance Coverage by Household Income in Farmers Branch
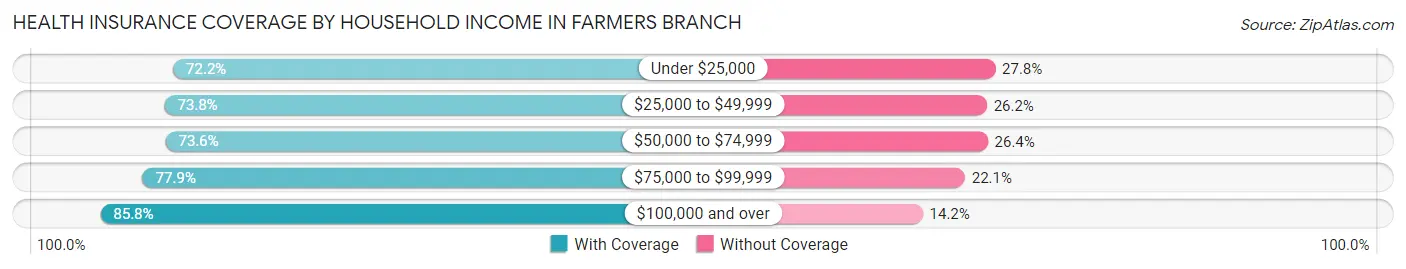
| Household Income | With Coverage | Without Coverage |
| Under $25,000 | 1,463 (72.2%) | 563 (27.8%) |
| $25,000 to $49,999 | 3,903 (73.8%) | 1,386 (26.2%) |
| $50,000 to $74,999 | 4,825 (73.6%) | 1,729 (26.4%) |
| $75,000 to $99,999 | 3,388 (77.9%) | 962 (22.1%) |
| $100,000 and over | 15,136 (85.8%) | 2,505 (14.2%) |
Public vs Private Health Insurance Coverage by Age in Farmers Branch
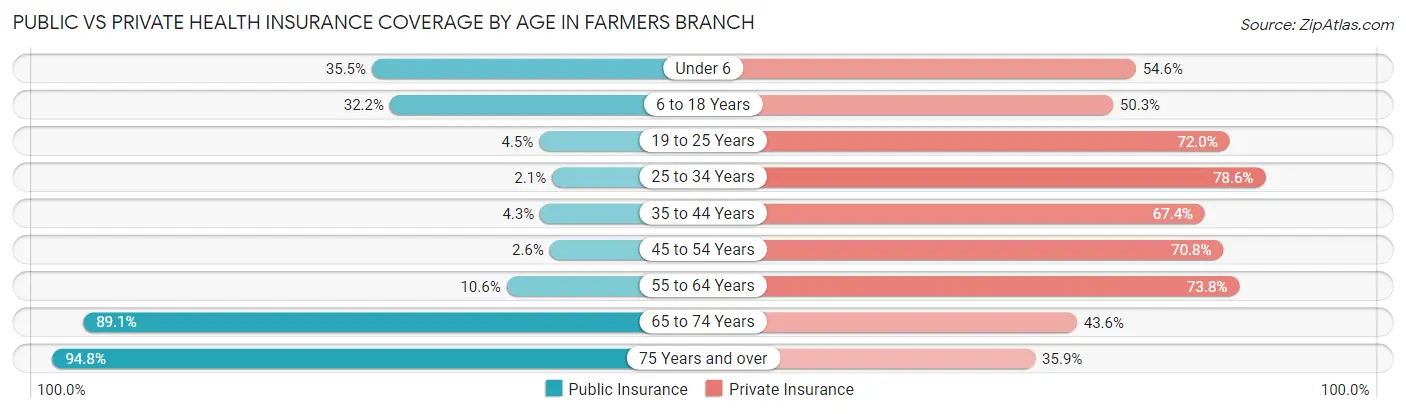
| Age Bracket | Public Insurance | Private Insurance |
| Under 6 | 897 (35.5%) | 1,377 (54.6%) |
| 6 to 18 Years | 1,787 (32.2%) | 2,792 (50.3%) |
| 19 to 25 Years | 161 (4.5%) | 2,577 (72.0%) |
| 25 to 34 Years | 148 (2.1%) | 5,518 (78.6%) |
| 35 to 44 Years | 240 (4.3%) | 3,734 (67.4%) |
| 45 to 54 Years | 93 (2.5%) | 2,585 (70.8%) |
| 55 to 64 Years | 398 (10.5%) | 2,782 (73.8%) |
| 65 to 74 Years | 2,284 (89.1%) | 1,118 (43.6%) |
| 75 Years and over | 1,683 (94.8%) | 637 (35.9%) |
| Total | 7,691 (21.4%) | 23,120 (64.3%) |
Disability Status by Sex by Age in Farmers Branch
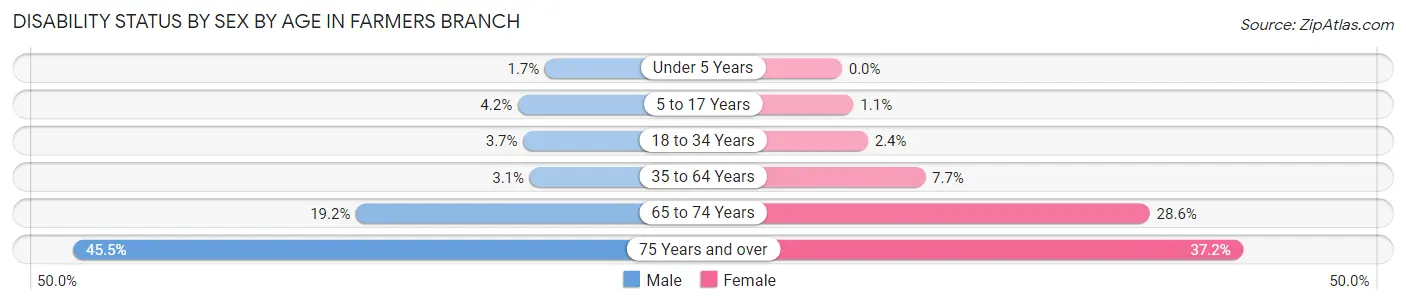
| Age Bracket | Male | Female |
| Under 5 Years | 21 (1.7%) | 0 (0.0%) |
| 5 to 17 Years | 127 (4.2%) | 28 (1.1%) |
| 18 to 34 Years | 207 (3.7%) | 130 (2.4%) |
| 35 to 64 Years | 198 (3.1%) | 510 (7.7%) |
| 65 to 74 Years | 206 (19.2%) | 426 (28.6%) |
| 75 Years and over | 328 (45.5%) | 392 (37.2%) |
Disability Class by Sex by Age in Farmers Branch
Disability Class: Hearing Difficulty
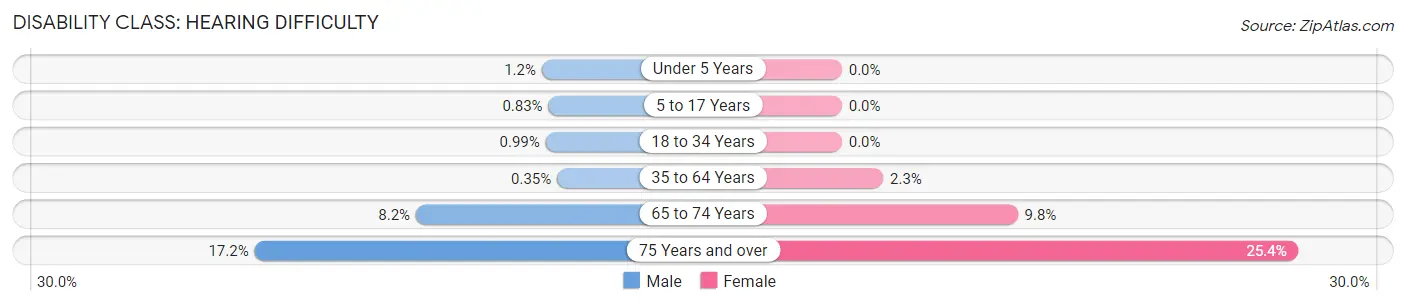
| Age Bracket | Male | Female |
| Under 5 Years | 15 (1.2%) | 0 (0.0%) |
| 5 to 17 Years | 25 (0.8%) | 0 (0.0%) |
| 18 to 34 Years | 55 (1.0%) | 0 (0.0%) |
| 35 to 64 Years | 22 (0.4%) | 152 (2.3%) |
| 65 to 74 Years | 88 (8.2%) | 146 (9.8%) |
| 75 Years and over | 124 (17.2%) | 268 (25.4%) |
Disability Class: Vision Difficulty
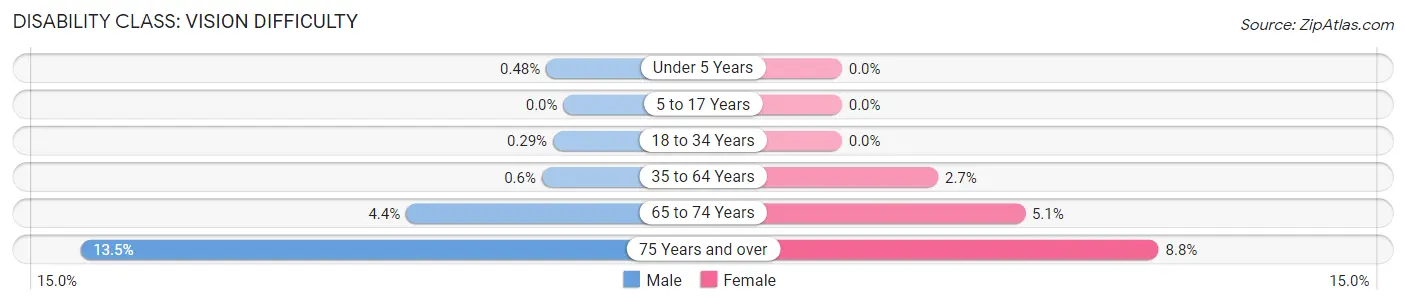
| Age Bracket | Male | Female |
| Under 5 Years | 6 (0.5%) | 0 (0.0%) |
| 5 to 17 Years | 0 (0.0%) | 0 (0.0%) |
| 18 to 34 Years | 16 (0.3%) | 0 (0.0%) |
| 35 to 64 Years | 38 (0.6%) | 177 (2.7%) |
| 65 to 74 Years | 47 (4.4%) | 76 (5.1%) |
| 75 Years and over | 97 (13.5%) | 93 (8.8%) |
Disability Class: Cognitive Difficulty
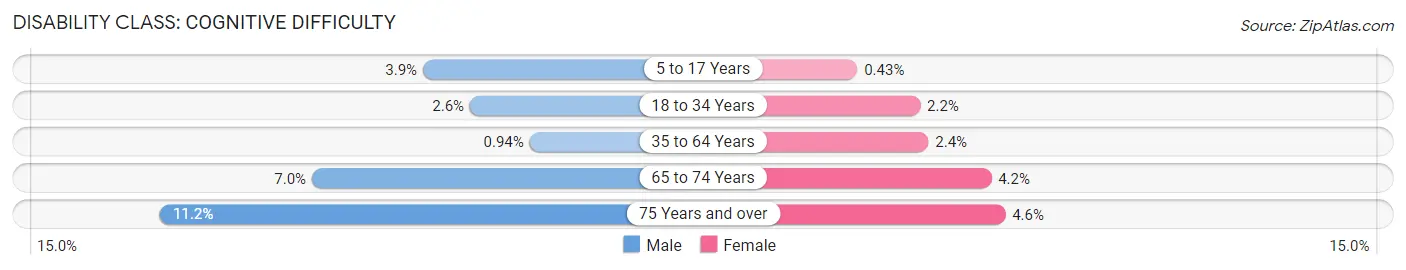
| Age Bracket | Male | Female |
| 5 to 17 Years | 118 (3.9%) | 11 (0.4%) |
| 18 to 34 Years | 145 (2.6%) | 118 (2.2%) |
| 35 to 64 Years | 60 (0.9%) | 159 (2.4%) |
| 65 to 74 Years | 75 (7.0%) | 62 (4.2%) |
| 75 Years and over | 81 (11.2%) | 48 (4.5%) |
Disability Class: Ambulatory Difficulty
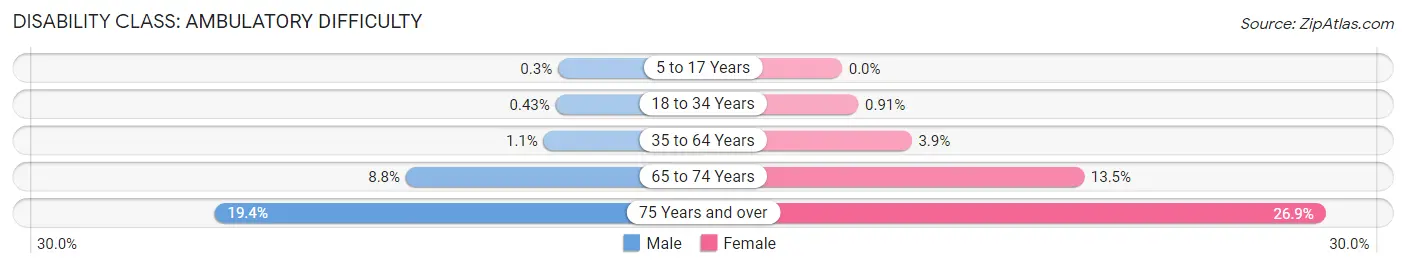
| Age Bracket | Male | Female |
| 5 to 17 Years | 9 (0.3%) | 0 (0.0%) |
| 18 to 34 Years | 24 (0.4%) | 49 (0.9%) |
| 35 to 64 Years | 70 (1.1%) | 256 (3.9%) |
| 65 to 74 Years | 94 (8.8%) | 201 (13.5%) |
| 75 Years and over | 140 (19.4%) | 284 (26.9%) |
Disability Class: Self-Care Difficulty
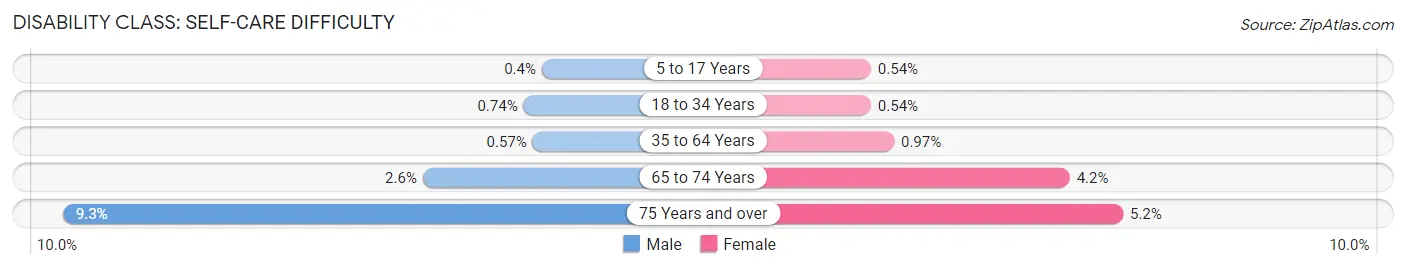
| Age Bracket | Male | Female |
| 5 to 17 Years | 12 (0.4%) | 14 (0.5%) |
| 18 to 34 Years | 41 (0.7%) | 29 (0.5%) |
| 35 to 64 Years | 36 (0.6%) | 64 (1.0%) |
| 65 to 74 Years | 28 (2.6%) | 63 (4.2%) |
| 75 Years and over | 67 (9.3%) | 55 (5.2%) |
Technology Access in Farmers Branch
Computing Device Access in Farmers Branch
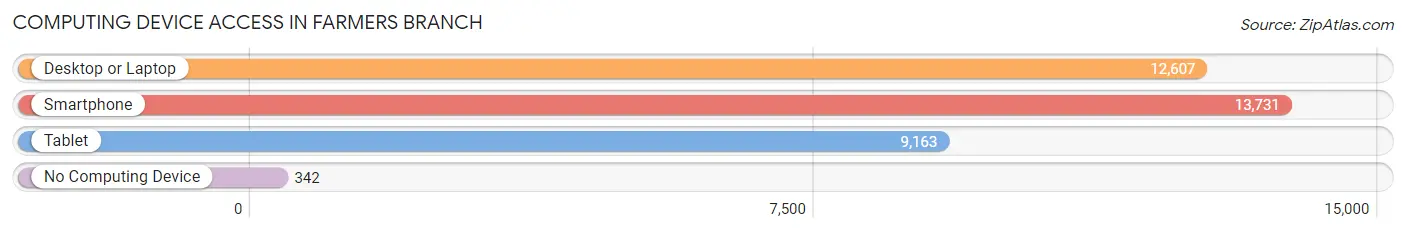
| Device Type | # Households | % Households |
| Desktop or Laptop | 12,607 | 87.2% |
| Smartphone | 13,731 | 94.9% |
| Tablet | 9,163 | 63.3% |
| No Computing Device | 342 | 2.4% |
| Total | 14,463 | 100.0% |
Internet Access in Farmers Branch
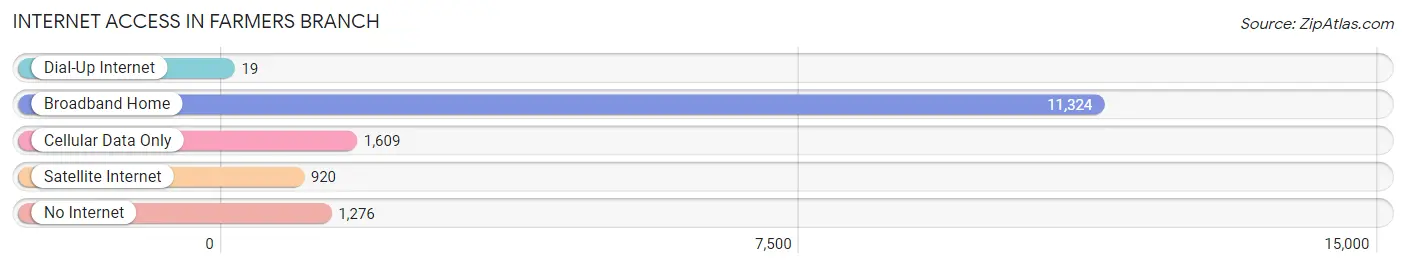
| Internet Type | # Households | % Households |
| Dial-Up Internet | 19 | 0.1% |
| Broadband Home | 11,324 | 78.3% |
| Cellular Data Only | 1,609 | 11.1% |
| Satellite Internet | 920 | 6.4% |
| No Internet | 1,276 | 8.8% |
| Total | 14,463 | 100.0% |
Farmers Branch Summary
Farmers Branch, Texas is a city located in Dallas County, Texas, United States. It is a suburb of Dallas and is part of the Dallas–Fort Worth metroplex. The population was 28,616 at the 2010 census, making it the 23rd most populous city in the state of Texas.
History
The area that is now Farmers Branch was first settled in the 1840s by William and Mary Larner, who were among the first settlers in the area. The Larner family established a farm and a trading post, which became the center of the community. The area was known as Larner's Settlement until 1856, when it was renamed Farmers Branch.
The city was officially incorporated in 1945, and the first mayor was elected in 1946. The city has grown steadily since then, and today it is home to a diverse population of more than 28,000 people.
Geography
Farmers Branch is located in Dallas County, Texas, at the intersection of Interstate 35E and Interstate 635. It is bordered by the cities of Dallas, Carrollton, Addison, and Coppell. The city covers an area of 8.3 square miles, and has a population density of 3,400 people per square mile.
The city is located in the Blackland Prairie region of Texas, and is characterized by rolling hills and flat plains. The climate is humid subtropical, with hot summers and mild winters.
Economy
The economy of Farmers Branch is largely based on the service industry, with many businesses providing services to the surrounding area. The city is home to several large employers, including the Farmers Branch Independent School District, the City of Farmers Branch, and the Farmers Branch Medical Center.
The city also has a thriving retail sector, with several shopping centers and malls located in the area. The city is also home to several corporate headquarters, including the headquarters of the Dr Pepper Snapple Group and the headquarters of the Mary Kay cosmetics company.
Demographics
As of the 2010 census, the population of Farmers Branch was 28,616. The racial makeup of the city was 73.3% White, 11.2% African American, 0.7% Native American, 5.2% Asian, 0.1% Pacific Islander, 6.2% from other races, and 3.3% from two or more races. Hispanic or Latino of any race were 20.2% of the population.
The median income for a household in the city was $50,945, and the median income for a family was $60,945. The per capita income for the city was $25,945. About 8.2% of families and 10.3% of the population were below the poverty line, including 14.2% of those under age 18 and 6.2% of those age 65 or over.
Conclusion
Farmers Branch, Texas is a vibrant and diverse city located in Dallas County, Texas. It is part of the Dallas–Fort Worth metroplex and is home to a population of more than 28,000 people. The city has a strong economy based on the service industry, and is home to several large employers. The city also has a thriving retail sector, with several shopping centers and malls located in the area. The population of Farmers Branch is diverse, with a mix of races and ethnicities. The median income for a household in the city is $50,945, and the per capita income for the city is $25,945.
Common Questions
What is Per Capita Income in Farmers Branch?
Per Capita income in Farmers Branch is $43,681.
What is the Median Family Income in Farmers Branch?
Median Family Income in Farmers Branch is $100,452.
What is the Median Household income in Farmers Branch?
Median Household Income in Farmers Branch is $88,282.
What is Income or Wage Gap in Farmers Branch?
Income or Wage Gap in Farmers Branch is 13.6%.
Women in Farmers Branch earn 86.4 cents for every dollar earned by a man.
What is Family Income Deficit in Farmers Branch?
Family Income Deficit in Farmers Branch is $11,356.
Families that are below poverty line in Farmers Branch earn $11,356 less on average than the poverty threshold level.
What is Inequality or Gini Index in Farmers Branch?
Inequality or Gini Index in Farmers Branch is 0.39.
What is the Total Population of Farmers Branch?
Total Population of Farmers Branch is 35,985.
What is the Total Male Population of Farmers Branch?
Total Male Population of Farmers Branch is 18,003.
What is the Total Female Population of Farmers Branch?
Total Female Population of Farmers Branch is 17,982.
What is the Ratio of Males per 100 Females in Farmers Branch?
There are 100.12 Males per 100 Females in Farmers Branch.
What is the Ratio of Females per 100 Males in Farmers Branch?
There are 99.88 Females per 100 Males in Farmers Branch.
What is the Median Population Age in Farmers Branch?
Median Population Age in Farmers Branch is 34.1 Years.
What is the Average Family Size in Farmers Branch
Average Family Size in Farmers Branch is 3.2 People.
What is the Average Household Size in Farmers Branch
Average Household Size in Farmers Branch is 2.5 People.
How Large is the Labor Force in Farmers Branch?
There are 22,542 People in the Labor Forcein in Farmers Branch.
What is the Percentage of People in the Labor Force in Farmers Branch?
77.1% of People are in the Labor Force in Farmers Branch.
What is the Unemployment Rate in Farmers Branch?
Unemployment Rate in Farmers Branch is 2.9%.