Zip Codes with the Highest Percentage of Households with Income Above $100,000 in New Castle, PA
RELATED REPORTS & OPTIONS
Household Income | $100k+
New Castle
Compare Zip Codes
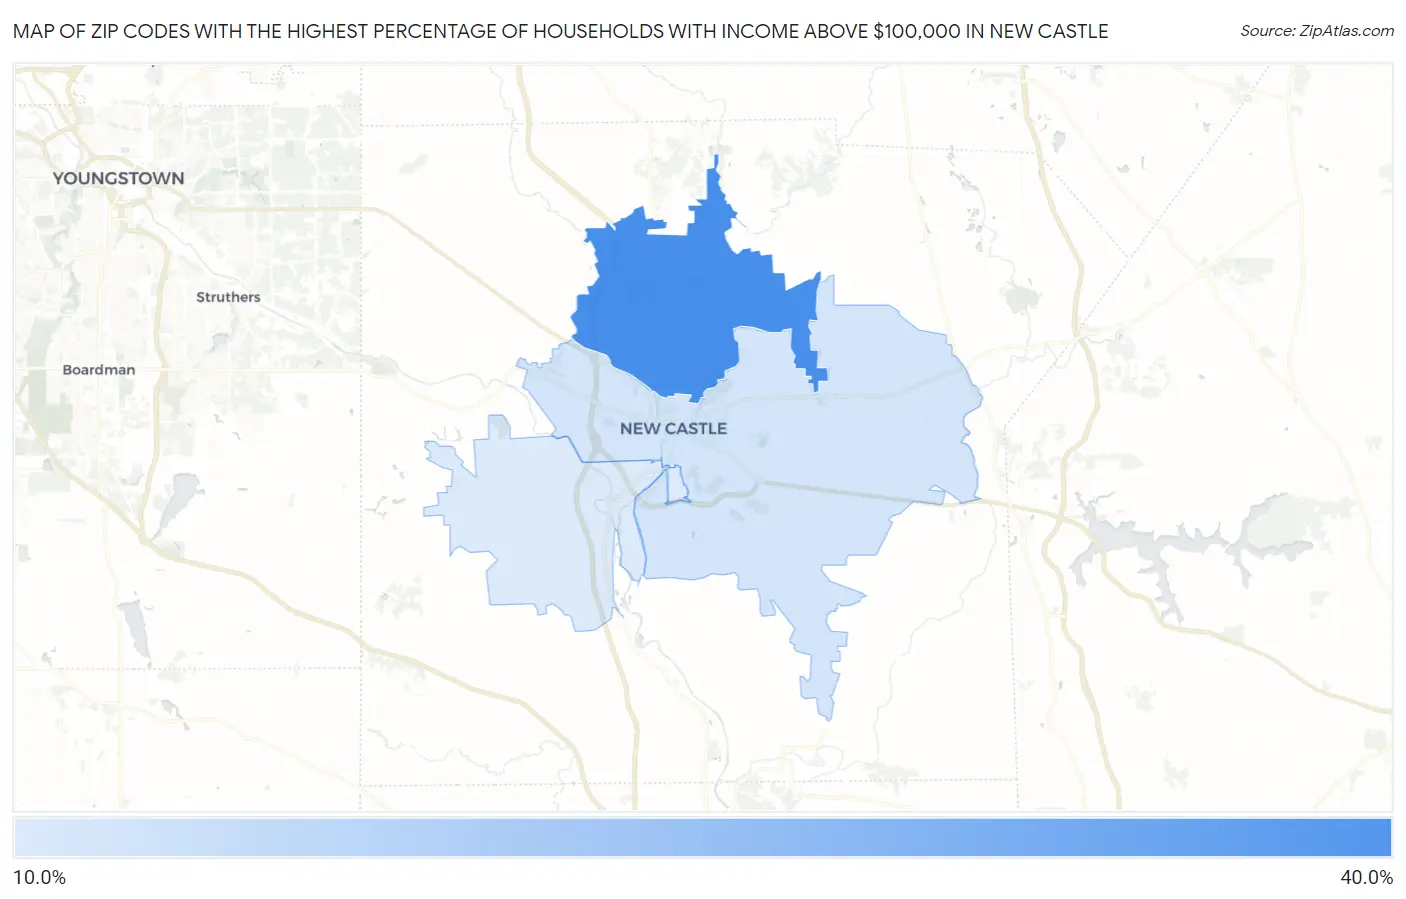
Map of Zip Codes with the Highest Percentage of Households with Income Above $100,000 in New Castle
18.6%
32.8%
Zip Codes with the Highest Percentage of Households with Income Above $100,000 in New Castle, PA
| Zip Code | Households with Income > $100k | vs State | vs National | |
| 1. | 16105 | 32.8% | 35.9%(-3.10)#717 | 37.3%(-4.50)#13,271 |
| 2. | 16101 | 19.4% | 35.9%(-16.5)#1,404 | 37.3%(-17.9)#24,507 |
| 3. | 16102 | 18.6% | 35.9%(-17.3)#1,444 | 37.3%(-18.7)#25,118 |
1
Common Questions
What are the Top Zip Codes with the Highest Percentage of Households with Income Above $100,000 in New Castle, PA?
Top Zip Codes with the Highest Percentage of Households with Income Above $100,000 in New Castle, PA are:
What zip code has the Highest Percentage of Households with Income Above $100,000 in New Castle, PA?
16105 has the Highest Percentage of Households with Income Above $100,000 in New Castle, PA with 32.8%.
What is the Percentage of Households with Income Above $100,000 in New Castle, PA?
Percentage of Households with Income Above $100,000 in New Castle is 9.9%.
What is the Percentage of Households with Income Above $100,000 in Pennsylvania?
Percentage of Households with Income Above $100,000 in Pennsylvania is 35.9%.
What is the Percentage of Households with Income Above $100,000 in the United States?
Percentage of Households with Income Above $100,000 in the United States is 37.3%.