Zip Codes with the Highest Percentage of Households with Income Above $100,000 in Butler, PA
RELATED REPORTS & OPTIONS
Household Income | $100k+
Butler
Compare Zip Codes
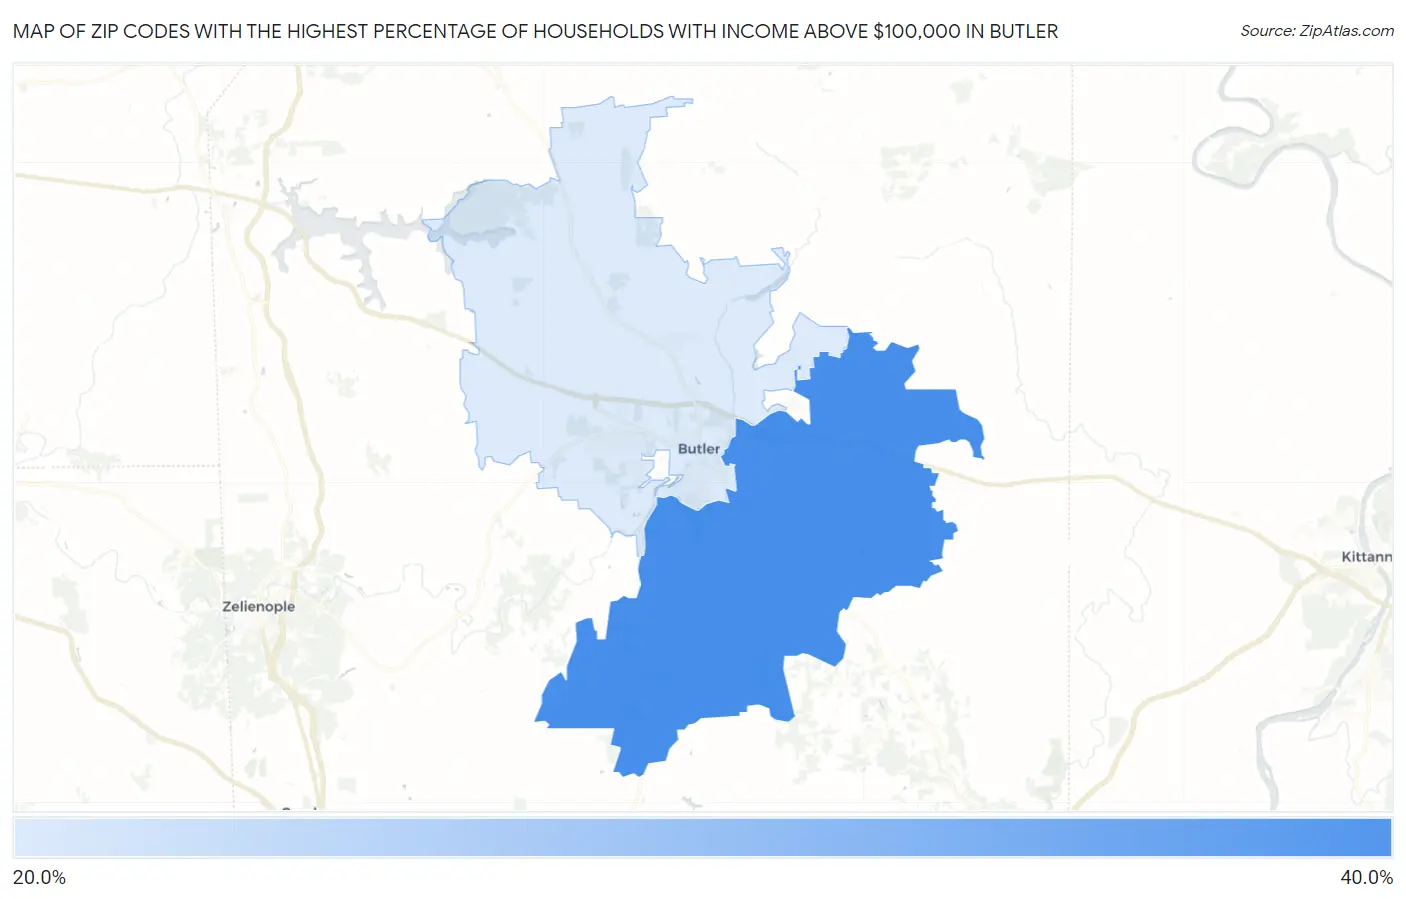
Map of Zip Codes with the Highest Percentage of Households with Income Above $100,000 in Butler
28.8%
36.3%
Zip Codes with the Highest Percentage of Households with Income Above $100,000 in Butler, PA
| Zip Code | Households with Income > $100k | vs State | vs National | |
| 1. | 16002 | 36.3% | 35.9%(+0.400)#562 | 37.3%(-1.00)#10,980 |
| 2. | 16001 | 28.8% | 35.9%(-7.10)#927 | 37.3%(-8.50)#16,398 |
1
Common Questions
What are the Top Zip Codes with the Highest Percentage of Households with Income Above $100,000 in Butler, PA?
Top Zip Codes with the Highest Percentage of Households with Income Above $100,000 in Butler, PA are:
What zip code has the Highest Percentage of Households with Income Above $100,000 in Butler, PA?
16002 has the Highest Percentage of Households with Income Above $100,000 in Butler, PA with 36.3%.
What is the Percentage of Households with Income Above $100,000 in Butler, PA?
Percentage of Households with Income Above $100,000 in Butler is 15.1%.
What is the Percentage of Households with Income Above $100,000 in Pennsylvania?
Percentage of Households with Income Above $100,000 in Pennsylvania is 35.9%.
What is the Percentage of Households with Income Above $100,000 in the United States?
Percentage of Households with Income Above $100,000 in the United States is 37.3%.