Zip Codes with the Highest Percentage of Households with Income Above $100,000 in Lebanon, PA
RELATED REPORTS & OPTIONS
Household Income | $100k+
Lebanon
Compare Zip Codes
Map of Zip Codes with the Highest Percentage of Households with Income Above $100,000 in Lebanon
23.2%
33.1%
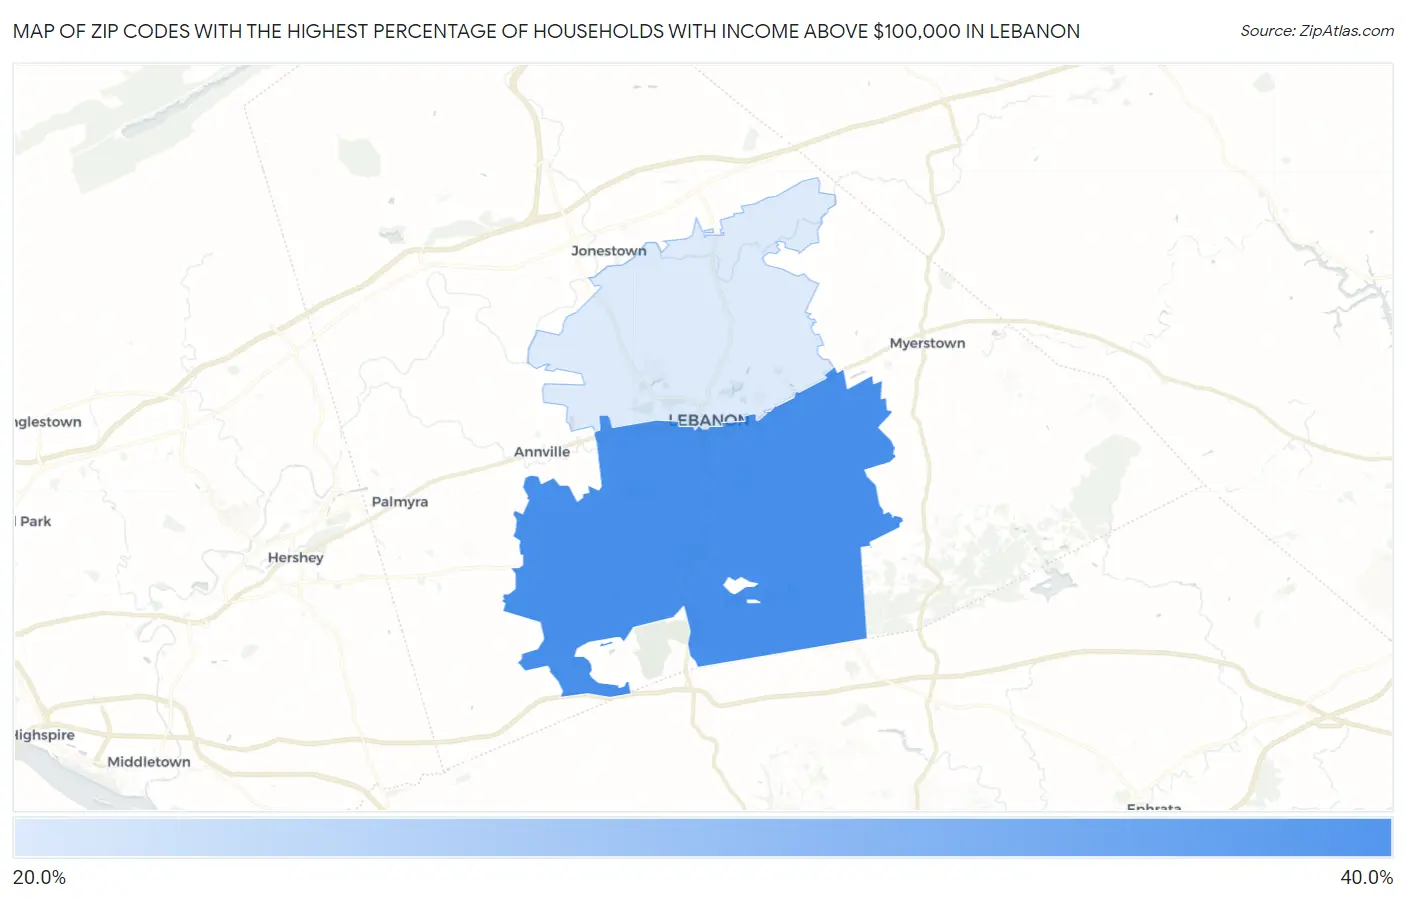
Zip Codes with the Highest Percentage of Households with Income Above $100,000 in Lebanon, PA
| Zip Code | Households with Income > $100k | vs State | vs National | |
| 1. | 17042 | 33.1% | 35.9%(-2.80)#695 | 37.3%(-4.20)#13,021 |
| 2. | 17046 | 23.2% | 35.9%(-12.7)#1,226 | 37.3%(-14.1)#21,400 |
1
Common Questions
What are the Top Zip Codes with the Highest Percentage of Households with Income Above $100,000 in Lebanon, PA?
Top Zip Codes with the Highest Percentage of Households with Income Above $100,000 in Lebanon, PA are:
What zip code has the Highest Percentage of Households with Income Above $100,000 in Lebanon, PA?
17042 has the Highest Percentage of Households with Income Above $100,000 in Lebanon, PA with 33.1%.
What is the Percentage of Households with Income Above $100,000 in Lebanon, PA?
Percentage of Households with Income Above $100,000 in Lebanon is 15.7%.
What is the Percentage of Households with Income Above $100,000 in Pennsylvania?
Percentage of Households with Income Above $100,000 in Pennsylvania is 35.9%.
What is the Percentage of Households with Income Above $100,000 in the United States?
Percentage of Households with Income Above $100,000 in the United States is 37.3%.