Zip Codes with the Highest Percentage of Owner-Occupied Units in Omaha, NE

RELATED REPORTS & OPTIONS

Highest Owner-Occupied
Population
Families and Households
Female Fertility
Female Fertility (Unmarried)
Race (Community Size)
Race (Percentage)
Ancestry (Community Size)
AfghanAfricanAlbanianAleutAmericanApacheArabArapahoArgentineanArmenianAustralianAustrianBangladeshiBasqueBelgianBhutaneseBlackfeetBolivianBrazilianBritishBulgarianBurmeseCajunCambodianCanadianCarpatho RusynCentral AmericanCentral American IndianCherokeeChickasawChileanChineseChippewaChoctawColombianComancheCosta RicanCreekCroatianCubanCzechCzechoslovakianDanishDominicanDutchEastern EuropeanEcuadorianEgyptianEnglishEthiopianEuropeanFilipinoFinnishFrenchFrench American IndianFrench CanadianGermanGerman RussianGhanaianGreekGuamanian / ChamorroGuatemalanGuyaneseHaitianHonduranHungarianIcelanderIndian (Asian)IndonesianInupiatIranianIraqiIrishIroquoisIsraeliItalianJamaicanJapaneseJordanianKenyanKiowaKoreanLaotianLatvianLebaneseLithuanianLuxembourgerMacedonianMalaysianMexicanMexican American IndianMoroccanNative HawaiianNavajoNicaraguanNigerianNorthern EuropeanNorwegianPakistaniPalestinianPanamanianPennsylvania GermanPeruvianPolishPortuguesePotawatomiPuebloPuerto RicanRomanianRussianSalvadoranSamoanScandinavianScotch-IrishScottishSeminoleSerbianSiouxSlavicSlovakSloveneSomaliSouth AfricanSouth AmericanSpaniardSpanishSri LankanSubsaharan AfricanSudaneseSwedishSwissSyrianThaiTlingit-HaidaTrinidadian and TobagonianTurkishUkrainianVenezuelanVietnameseWelshWest IndianYugoslavianZimbabwean
Ancestry (Percentage)
AfghanAfricanAlbanianAleutAmericanApacheArabArapahoArgentineanArmenianAustralianAustrianBangladeshiBasqueBelgianBhutaneseBlackfeetBolivianBrazilianBritishBulgarianBurmeseCajunCambodianCanadianCarpatho RusynCentral AmericanCentral American IndianCherokeeChickasawChileanChineseChippewaChoctawColombianComancheCosta RicanCreekCroatianCubanCzechCzechoslovakianDanishDominicanDutchEastern EuropeanEcuadorianEgyptianEnglishEthiopianEuropeanFilipinoFinnishFrenchFrench American IndianFrench CanadianGermanGerman RussianGhanaianGreekGuamanian / ChamorroGuatemalanGuyaneseHaitianHonduranHungarianIcelanderIndian (Asian)IndonesianInupiatIranianIraqiIrishIroquoisIsraeliItalianJamaicanJapaneseJordanianKenyanKiowaKoreanLaotianLatvianLebaneseLithuanianLuxembourgerMacedonianMalaysianMexicanMexican American IndianMoroccanNative HawaiianNavajoNicaraguanNigerianNorthern EuropeanNorwegianPakistaniPalestinianPanamanianPennsylvania GermanPeruvianPolishPortuguesePotawatomiPuebloPuerto RicanRomanianRussianSalvadoranSamoanScandinavianScotch-IrishScottishSeminoleSerbianSiouxSlavicSlovakSloveneSomaliSouth AfricanSouth AmericanSpaniardSpanishSri LankanSubsaharan AfricanSudaneseSwedishSwissSyrianThaiTlingit-HaidaTrinidadian and TobagonianTurkishUkrainianVenezuelanVietnameseWelshWest IndianYugoslavianZimbabwean
Immigrant Origin (Total)
AfghanistanAfricaArgentinaAsiaAustraliaBangladeshBarbadosBelarusBosnia and HerzegovinaBrazilBurma / MyanmarCameroonCanadaCaribbeanCentral AmericaChileChinaColombiaCongoCosta RicaCroatiaCubaCzechoslovakiaDominican RepublicEastern AfricaEastern AsiaEastern EuropeEgyptEl SalvadorEnglandEthiopiaEuropeFranceGermanyGhanaGreeceGuatemalaHondurasHong KongHungaryIndiaIndonesiaIranIraqIrelandIsraelItalyJamaicaJapanJordanKazakhstanKenyaKoreaKuwaitLaosLatin AmericaLatviaLithuaniaMalaysiaMexicoMiddle AfricaMoroccoNepalNetherlandsNicaraguaNigeriaNorthern AfricaNorthern EuropeOceaniaPakistanPanamaPeruPhilippinesPolandPortugalRomaniaRussiaSaudi ArabiaScotlandSierra LeoneSomaliaSouth AfricaSouth AmericaSouth Central AsiaSouth Eastern AsiaSouthern EuropeSpainSri LankaSudanSyriaTaiwanThailandTrinidad and TobagoTurkeyUgandaUkraineVenezuelaVietnamWestern AfricaWestern AsiaWestern EuropeZaireZimbabwe
Immigrant Origin (Percentage)
AfghanistanAfricaArgentinaAsiaAustraliaBangladeshBarbadosBelarusBosnia and HerzegovinaBrazilBurma / MyanmarCameroonCanadaCaribbeanCentral AmericaChileChinaColombiaCongoCosta RicaCroatiaCubaCzechoslovakiaDominican RepublicEastern AfricaEastern AsiaEastern EuropeEgyptEl SalvadorEnglandEthiopiaEuropeFranceGermanyGhanaGreeceGuatemalaHondurasHong KongHungaryIndiaIndonesiaIranIraqIrelandIsraelItalyJamaicaJapanJordanKazakhstanKenyaKoreaKuwaitLaosLatin AmericaLatviaLithuaniaMalaysiaMexicoMiddle AfricaMoroccoNepalNetherlandsNicaraguaNigeriaNorthern AfricaNorthern EuropeOceaniaPakistanPanamaPeruPhilippinesPolandPortugalRomaniaRussiaSaudi ArabiaScotlandSierra LeoneSomaliaSouth AfricaSouth AmericaSouth Central AsiaSouth Eastern AsiaSouthern EuropeSpainSri LankaSudanSyriaTaiwanThailandTrinidad and TobagoTurkeyUgandaUkraineVenezuelaVietnamWestern AfricaWestern AsiaWestern EuropeZaireZimbabwe
Income
Income (Families)
Income (Households)
Poverty
Poverty (Families)
Unemployment
Employment Occupations
Employment Industries
Employer Class
Commute Time
Commute Means
School Enrollment
Education by Degree Field
Occupancy
Finances
Physical Characteristics
Omaha
Compare Zip Codes
Comparison Subject

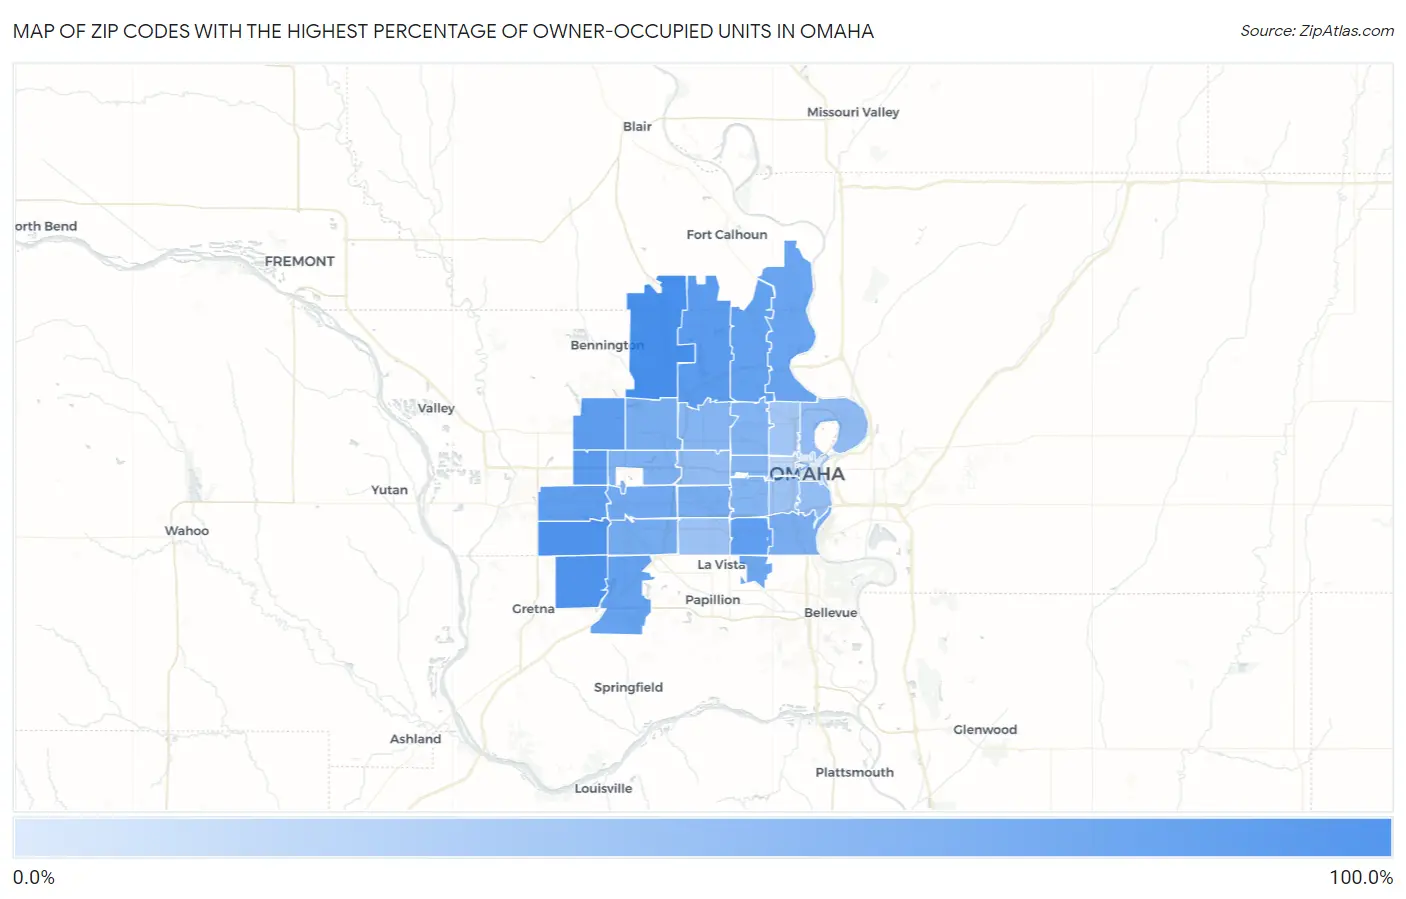
Map of Zip Codes with the Highest Percentage of Owner-Occupied Units in Omaha

0.0%
100.0%
Zip Codes with the Highest Percentage of Owner-Occupied Units in Omaha Map

Zip Codes with the Highest Percentage of Owner-Occupied Units in Omaha, NE

Zip Code % Owner-Occupied vs State vs National
1.6814295.4%66.5%(+28.9)#3464.8%(+30.6)#2,590
2.6813690.2%66.5%(+23.6)#8164.8%(+25.4)#5,384
3.6813590.0%66.5%(+23.5)#8464.8%(+25.2)#5,477
4.6812281.7%66.5%(+15.1)#24764.8%(+16.8)#12,998
5.6811881.3%66.5%(+14.8)#25464.8%(+16.5)#13,335
6.6811679.6%66.5%(+13.0)#28564.8%(+14.7)#15,038
7.6813078.4%66.5%(+11.9)#29964.8%(+13.6)#16,058
8.6811778.3%66.5%(+11.7)#30364.8%(+13.4)#16,228
9.6815277.0%66.5%(+10.4)#33164.8%(+12.2)#17,421
10.6813874.9%66.5%(+8.33)#37764.8%(+10.1)#19,308
11.6811272.3%66.5%(+5.79)#41064.8%(+7.52)#21,193
12.6815769.0%66.5%(+2.50)#45164.8%(+4.23)#23,359
13.6814467.8%66.5%(+1.22)#46664.8%(+2.95)#24,107
14.6813765.2%66.5%(-1.30)#48664.8%(+0.433)#25,342
15.6816463.9%66.5%(-2.61)#50664.8%(-0.885)#25,945
16.6812463.0%66.5%(-3.57)#50964.8%(-1.84)#26,343
17.6810761.9%66.5%(-4.69)#51564.8%(-2.96)#26,778
18.6815460.0%66.5%(-6.54)#52564.8%(-4.81)#27,402
19.6810458.7%66.5%(-7.84)#53464.8%(-6.11)#27,800
20.6810656.7%66.5%(-9.86)#54664.8%(-8.13)#28,325
21.6813455.2%66.5%(-11.3)#55164.8%(-9.60)#28,702
22.6813255.0%66.5%(-11.6)#55264.8%(-9.86)#28,779
23.6811049.3%66.5%(-17.3)#55764.8%(-15.5)#29,837
24.6811448.5%66.5%(-18.0)#55964.8%(-16.3)#29,968
25.6810847.4%66.5%(-19.1)#56064.8%(-17.4)#30,131
26.6812744.7%66.5%(-21.8)#56364.8%(-20.1)#30,524
27.6810543.4%66.5%(-23.2)#56664.8%(-21.4)#30,677
28.6811139.3%66.5%(-27.3)#56864.8%(-25.5)#31,081
29.6813126.6%66.5%(-39.9)#57464.8%(-38.2)#31,926
30.6810212.9%66.5%(-53.7)#57564.8%(-52.0)#32,299

Common Questions

What are the Top 10 Zip Codes with the Highest Percentage of Owner-Occupied Units in Omaha, NE?
Top 10 Zip Codes with the Highest Percentage of Owner-Occupied Units in Omaha, NE are:
#1
95.4%
#2
90.2%
#3
90.0%
#4
81.7%
#5
81.3%
#6
79.6%
#7
78.4%
#8
78.3%
#9
77.0%
#10
74.9%
What zip code has the Highest Percentage of Owner-Occupied Units in Omaha, NE?
68142 has the Highest Percentage of Owner-Occupied Units in Omaha, NE with 95.4%.
What is the Percentage of Owner-Occupied Units in Omaha, NE?
Percentage of Owner-Occupied Units in Omaha is 57.9%.
What is the Percentage of Owner-Occupied Units in Nebraska?
Percentage of Owner-Occupied Units in Nebraska is 66.5%.
What is the Percentage of Owner-Occupied Units in the United States?
Percentage of Owner-Occupied Units in the United States is 64.8%.