Zip Codes with the Highest Percentage of Population Employed in Farming, Fishing & Forestry in Omaha, NE

RELATED REPORTS & OPTIONS

Farming, Fishing & Forestry
Population
Families and Households
Female Fertility
Female Fertility (Unmarried)
Race (Community Size)
Race (Percentage)
Ancestry (Community Size)
AfghanAfricanAlbanianAleutAmericanApacheArabArapahoArgentineanArmenianAustralianAustrianBangladeshiBasqueBelgianBhutaneseBlackfeetBolivianBrazilianBritishBulgarianBurmeseCajunCambodianCanadianCarpatho RusynCentral AmericanCentral American IndianCherokeeChickasawChileanChineseChippewaChoctawColombianComancheCosta RicanCreekCroatianCubanCzechCzechoslovakianDanishDominicanDutchEastern EuropeanEcuadorianEgyptianEnglishEthiopianEuropeanFilipinoFinnishFrenchFrench American IndianFrench CanadianGermanGerman RussianGhanaianGreekGuamanian / ChamorroGuatemalanGuyaneseHaitianHonduranHungarianIcelanderIndian (Asian)IndonesianInupiatIranianIraqiIrishIroquoisIsraeliItalianJamaicanJapaneseJordanianKenyanKiowaKoreanLaotianLatvianLebaneseLithuanianLuxembourgerMacedonianMalaysianMexicanMexican American IndianMoroccanNative HawaiianNavajoNicaraguanNigerianNorthern EuropeanNorwegianPakistaniPalestinianPanamanianPennsylvania GermanPeruvianPolishPortuguesePotawatomiPuebloPuerto RicanRomanianRussianSalvadoranSamoanScandinavianScotch-IrishScottishSeminoleSerbianSiouxSlavicSlovakSloveneSomaliSouth AfricanSouth AmericanSpaniardSpanishSri LankanSubsaharan AfricanSudaneseSwedishSwissSyrianThaiTlingit-HaidaTrinidadian and TobagonianTurkishUkrainianVenezuelanVietnameseWelshWest IndianYugoslavianZimbabwean
Ancestry (Percentage)
AfghanAfricanAlbanianAleutAmericanApacheArabArapahoArgentineanArmenianAustralianAustrianBangladeshiBasqueBelgianBhutaneseBlackfeetBolivianBrazilianBritishBulgarianBurmeseCajunCambodianCanadianCarpatho RusynCentral AmericanCentral American IndianCherokeeChickasawChileanChineseChippewaChoctawColombianComancheCosta RicanCreekCroatianCubanCzechCzechoslovakianDanishDominicanDutchEastern EuropeanEcuadorianEgyptianEnglishEthiopianEuropeanFilipinoFinnishFrenchFrench American IndianFrench CanadianGermanGerman RussianGhanaianGreekGuamanian / ChamorroGuatemalanGuyaneseHaitianHonduranHungarianIcelanderIndian (Asian)IndonesianInupiatIranianIraqiIrishIroquoisIsraeliItalianJamaicanJapaneseJordanianKenyanKiowaKoreanLaotianLatvianLebaneseLithuanianLuxembourgerMacedonianMalaysianMexicanMexican American IndianMoroccanNative HawaiianNavajoNicaraguanNigerianNorthern EuropeanNorwegianPakistaniPalestinianPanamanianPennsylvania GermanPeruvianPolishPortuguesePotawatomiPuebloPuerto RicanRomanianRussianSalvadoranSamoanScandinavianScotch-IrishScottishSeminoleSerbianSiouxSlavicSlovakSloveneSomaliSouth AfricanSouth AmericanSpaniardSpanishSri LankanSubsaharan AfricanSudaneseSwedishSwissSyrianThaiTlingit-HaidaTrinidadian and TobagonianTurkishUkrainianVenezuelanVietnameseWelshWest IndianYugoslavianZimbabwean
Immigrant Origin (Total)
AfghanistanAfricaArgentinaAsiaAustraliaBangladeshBarbadosBelarusBosnia and HerzegovinaBrazilBurma / MyanmarCameroonCanadaCaribbeanCentral AmericaChileChinaColombiaCongoCosta RicaCroatiaCubaCzechoslovakiaDominican RepublicEastern AfricaEastern AsiaEastern EuropeEgyptEl SalvadorEnglandEthiopiaEuropeFranceGermanyGhanaGreeceGuatemalaHondurasHong KongHungaryIndiaIndonesiaIranIraqIrelandIsraelItalyJamaicaJapanJordanKazakhstanKenyaKoreaKuwaitLaosLatin AmericaLatviaLithuaniaMalaysiaMexicoMiddle AfricaMoroccoNepalNetherlandsNicaraguaNigeriaNorthern AfricaNorthern EuropeOceaniaPakistanPanamaPeruPhilippinesPolandPortugalRomaniaRussiaSaudi ArabiaScotlandSierra LeoneSomaliaSouth AfricaSouth AmericaSouth Central AsiaSouth Eastern AsiaSouthern EuropeSpainSri LankaSudanSyriaTaiwanThailandTrinidad and TobagoTurkeyUgandaUkraineVenezuelaVietnamWestern AfricaWestern AsiaWestern EuropeZaireZimbabwe
Immigrant Origin (Percentage)
AfghanistanAfricaArgentinaAsiaAustraliaBangladeshBarbadosBelarusBosnia and HerzegovinaBrazilBurma / MyanmarCameroonCanadaCaribbeanCentral AmericaChileChinaColombiaCongoCosta RicaCroatiaCubaCzechoslovakiaDominican RepublicEastern AfricaEastern AsiaEastern EuropeEgyptEl SalvadorEnglandEthiopiaEuropeFranceGermanyGhanaGreeceGuatemalaHondurasHong KongHungaryIndiaIndonesiaIranIraqIrelandIsraelItalyJamaicaJapanJordanKazakhstanKenyaKoreaKuwaitLaosLatin AmericaLatviaLithuaniaMalaysiaMexicoMiddle AfricaMoroccoNepalNetherlandsNicaraguaNigeriaNorthern AfricaNorthern EuropeOceaniaPakistanPanamaPeruPhilippinesPolandPortugalRomaniaRussiaSaudi ArabiaScotlandSierra LeoneSomaliaSouth AfricaSouth AmericaSouth Central AsiaSouth Eastern AsiaSouthern EuropeSpainSri LankaSudanSyriaTaiwanThailandTrinidad and TobagoTurkeyUgandaUkraineVenezuelaVietnamWestern AfricaWestern AsiaWestern EuropeZaireZimbabwe
Income
Income (Families)
Income (Households)
Poverty
Poverty (Families)
Unemployment
Employment Occupations
Employment Industries
Employer Class
Commute Time
Commute Means
School Enrollment
Education by Degree Field
Occupancy
Finances
Physical Characteristics
Omaha
Compare Zip Codes
Comparison Subject

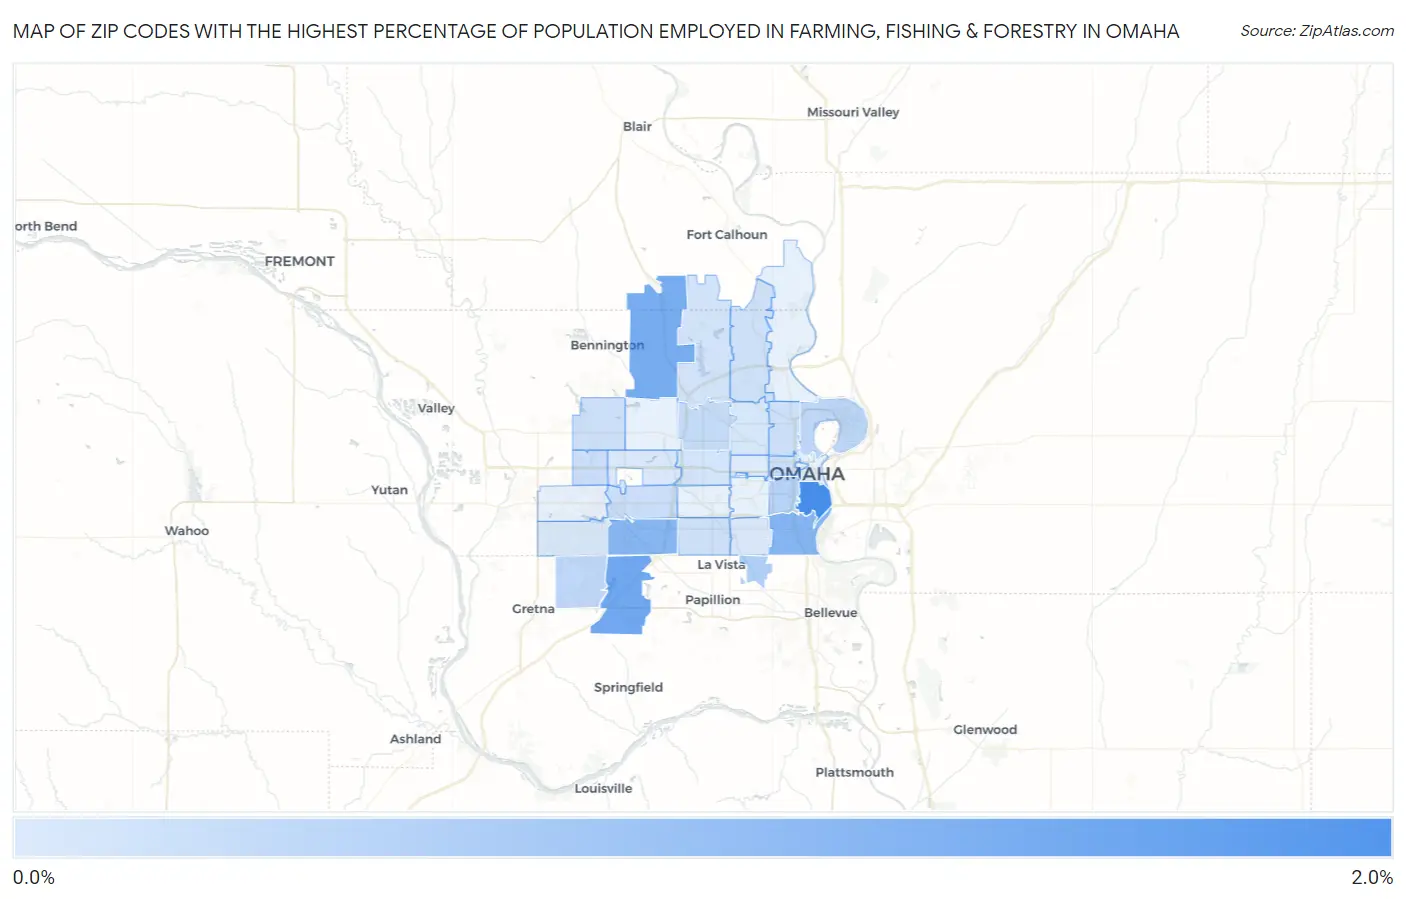
Map of Zip Codes with the Highest Percentage of Population Employed in Farming, Fishing & Forestry in Omaha

0.0%
2.0%
Zip Codes with the Highest Percentage of Population Employed in Farming, Fishing & Forestry in Omaha Map

Zip Codes with the Highest Percentage of Population Employed in Farming, Fishing & Forestry in Omaha, NE

Zip Code % Employed vs State vs National
1.681081.8%1.3%(+0.440)#3260.61%(+1.16)#7,140
2.681381.3%1.3%(-0.033)#3590.61%(+0.682)#8,615
3.681421.2%1.3%(-0.124)#3710.61%(+0.591)#8,939
4.681071.1%1.3%(-0.268)#3790.61%(+0.448)#9,505
5.681371.0%1.3%(-0.294)#3830.61%(+0.421)#9,619
6.681570.55%1.3%(-0.774)#4230.61%(-0.059)#12,461
7.681050.49%1.3%(-0.826)#4270.61%(-0.111)#12,889
8.681100.41%1.3%(-0.908)#4330.61%(-0.193)#13,646
9.681360.37%1.3%(-0.953)#4350.61%(-0.238)#14,070
10.681340.33%1.3%(-0.993)#4380.61%(-0.278)#14,504
11.681180.24%1.3%(-1.08)#4450.61%(-0.363)#15,519
12.681440.23%1.3%(-1.09)#4460.61%(-0.371)#15,627
13.681270.22%1.3%(-1.10)#4490.61%(-0.382)#15,790
14.681160.22%1.3%(-1.10)#4500.61%(-0.383)#15,797
15.681110.22%1.3%(-1.10)#4510.61%(-0.387)#15,856
16.681310.21%1.3%(-1.11)#4540.61%(-0.399)#16,035
17.681520.19%1.3%(-1.13)#4580.61%(-0.419)#16,338
18.681220.17%1.3%(-1.16)#4600.61%(-0.440)#16,655
19.681140.13%1.3%(-1.19)#4610.61%(-0.477)#17,288
20.681040.12%1.3%(-1.21)#4630.61%(-0.490)#17,501
21.681170.098%1.3%(-1.22)#4660.61%(-0.507)#17,799
22.681350.083%1.3%(-1.24)#4690.61%(-0.523)#18,066
23.681540.079%1.3%(-1.24)#4700.61%(-0.527)#18,151
24.681320.034%1.3%(-1.29)#4730.61%(-0.571)#18,899

Common Questions

What are the Top 10 Zip Codes with the Highest Percentage of Population Employed in Farming, Fishing & Forestry in Omaha, NE?
Top 10 Zip Codes with the Highest Percentage of Population Employed in Farming, Fishing & Forestry in Omaha, NE are:
#1
1.8%
#2
1.3%
#3
1.2%
#4
1.1%
#5
1.0%
#6
0.55%
#7
0.49%
#8
0.41%
#9
0.37%
#10
0.33%
What zip code has the Highest Percentage of Population Employed in Farming, Fishing & Forestry in Omaha, NE?
68108 has the Highest Percentage of Population Employed in Farming, Fishing & Forestry in Omaha, NE with 1.8%.
What is the Percentage of Population Employed in Farming, Fishing & Forestry in Omaha, NE?
Percentage of Population Employed in Farming, Fishing & Forestry in Omaha is 0.29%.
What is the Percentage of Population Employed in Farming, Fishing & Forestry in Nebraska?
Percentage of Population Employed in Farming, Fishing & Forestry in Nebraska is 1.3%.
What is the Percentage of Population Employed in Farming, Fishing & Forestry in the United States?
Percentage of Population Employed in Farming, Fishing & Forestry in the United States is 0.61%.