Harmony, NC Map & Demographics
Harmony Map
Harmony Overview
$28,357
PER CAPITA INCOME
$75,192
AVG FAMILY INCOME
$62,024
AVG HOUSEHOLD INCOME
38.5%
WAGE / INCOME GAP [ % ]
61.5¢/ $1
WAGE / INCOME GAP [ $ ]
0.34
INEQUALITY / GINI INDEX
584
TOTAL POPULATION
339
MALE POPULATION
245
FEMALE POPULATION
138.37
MALES / 100 FEMALES
72.27
FEMALES / 100 MALES
41.5
MEDIAN AGE
3.2
AVG FAMILY SIZE
2.6
AVG HOUSEHOLD SIZE
325
LABOR FORCE [ PEOPLE ]
68.1%
PERCENT IN LABOR FORCE
2.2%
UNEMPLOYMENT RATE
Harmony Zip Codes
Income in Harmony
Income Overview in Harmony
Per Capita Income in Harmony is $28,357, while median incomes of families and households are $75,192 and $62,024 respectively.
| Characteristic | Number | Measure |
| Per Capita Income | 584 | $28,357 |
| Median Family Income | 156 | $75,192 |
| Mean Family Income | 156 | $84,170 |
| Median Household Income | 220 | $62,024 |
| Mean Household Income | 220 | $73,623 |
| Income Deficit | 156 | $0 |
| Wage / Income Gap (%) | 584 | 38.54% |
| Wage / Income Gap ($) | 584 | 61.46¢ per $1 |
| Gini / Inequality Index | 584 | 0.34 |
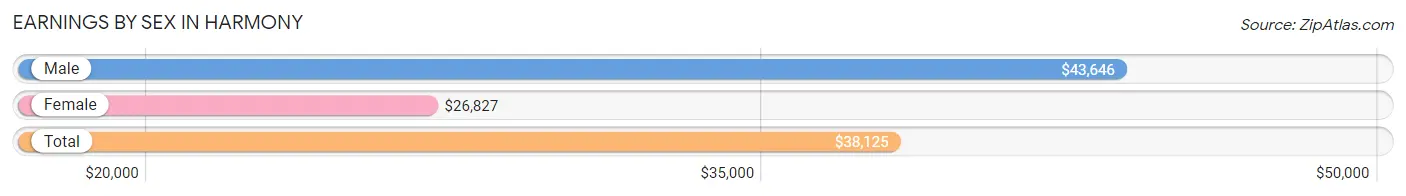
Earnings by Sex in Harmony
Average Earnings in Harmony are $38,125, $43,646 for men and $26,827 for women, a difference of 38.5%.
| Sex | Number | Average Earnings |
| Male | 207 (63.3%) | $43,646 |
| Female | 120 (36.7%) | $26,827 |
| Total | 327 (100.0%) | $38,125 |
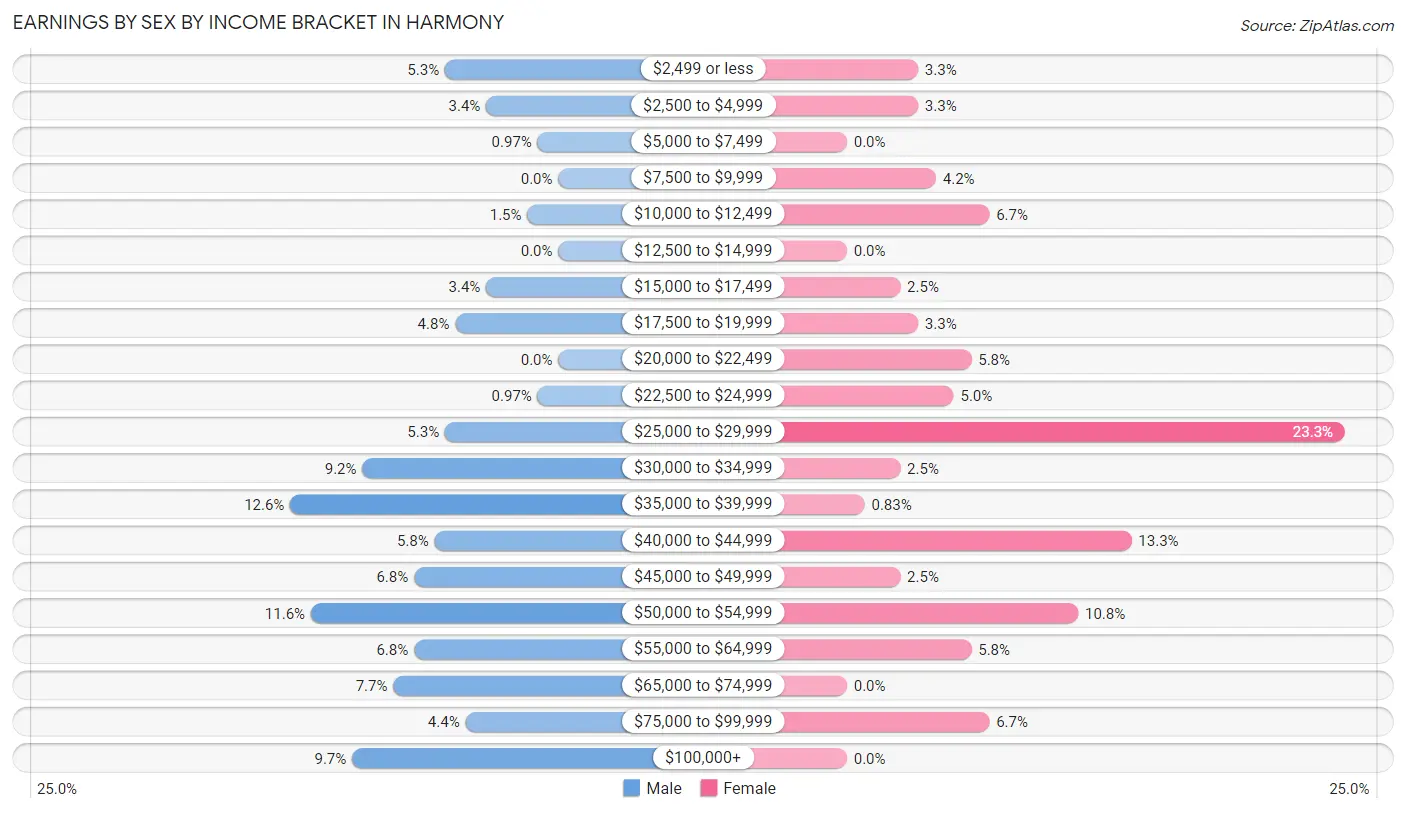
Earnings by Sex by Income Bracket in Harmony
The most common earnings brackets in Harmony are $35,000 to $39,999 for men (26 | 12.6%) and $25,000 to $29,999 for women (28 | 23.3%).
| Income | Male | Female |
| $2,499 or less | 11 (5.3%) | 4 (3.3%) |
| $2,500 to $4,999 | 7 (3.4%) | 4 (3.3%) |
| $5,000 to $7,499 | 2 (1.0%) | 0 (0.0%) |
| $7,500 to $9,999 | 0 (0.0%) | 5 (4.2%) |
| $10,000 to $12,499 | 3 (1.5%) | 8 (6.7%) |
| $12,500 to $14,999 | 0 (0.0%) | 0 (0.0%) |
| $15,000 to $17,499 | 7 (3.4%) | 3 (2.5%) |
| $17,500 to $19,999 | 10 (4.8%) | 4 (3.3%) |
| $20,000 to $22,499 | 0 (0.0%) | 7 (5.8%) |
| $22,500 to $24,999 | 2 (1.0%) | 6 (5.0%) |
| $25,000 to $29,999 | 11 (5.3%) | 28 (23.3%) |
| $30,000 to $34,999 | 19 (9.2%) | 3 (2.5%) |
| $35,000 to $39,999 | 26 (12.6%) | 1 (0.8%) |
| $40,000 to $44,999 | 12 (5.8%) | 16 (13.3%) |
| $45,000 to $49,999 | 14 (6.8%) | 3 (2.5%) |
| $50,000 to $54,999 | 24 (11.6%) | 13 (10.8%) |
| $55,000 to $64,999 | 14 (6.8%) | 7 (5.8%) |
| $65,000 to $74,999 | 16 (7.7%) | 0 (0.0%) |
| $75,000 to $99,999 | 9 (4.3%) | 8 (6.7%) |
| $100,000+ | 20 (9.7%) | 0 (0.0%) |
| Total | 207 (100.0%) | 120 (100.0%) |
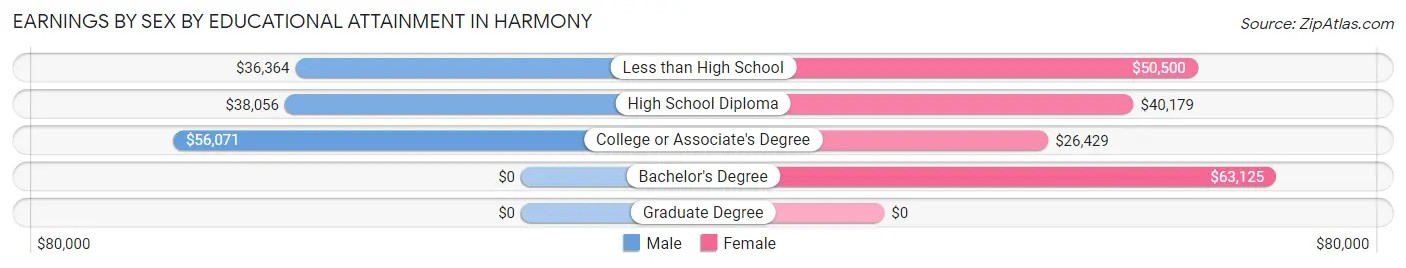
Earnings by Sex by Educational Attainment in Harmony
Average earnings in Harmony are $48,333 for men and $38,750 for women, a difference of 19.8%. Men with an educational attainment of college or associate's degree enjoy the highest average annual earnings of $56,071, while those with less than high school education earn the least with $36,364. Women with an educational attainment of bachelor's degree earn the most with the average annual earnings of $63,125, while those with college or associate's degree education have the smallest earnings of $26,429.
| Educational Attainment | Male Income | Female Income |
| Less than High School | $36,364 | $50,500 |
| High School Diploma | $38,056 | $40,179 |
| College or Associate's Degree | $56,071 | $26,429 |
| Bachelor's Degree | - | - |
| Graduate Degree | - | - |
| Total | $48,333 | $38,750 |
Family Income in Harmony
Family Income Brackets in Harmony
According to the Harmony family income data, there are 51 families falling into the $100,000 to $149,999 income range, which is the most common income bracket and makes up 32.7% of all families.
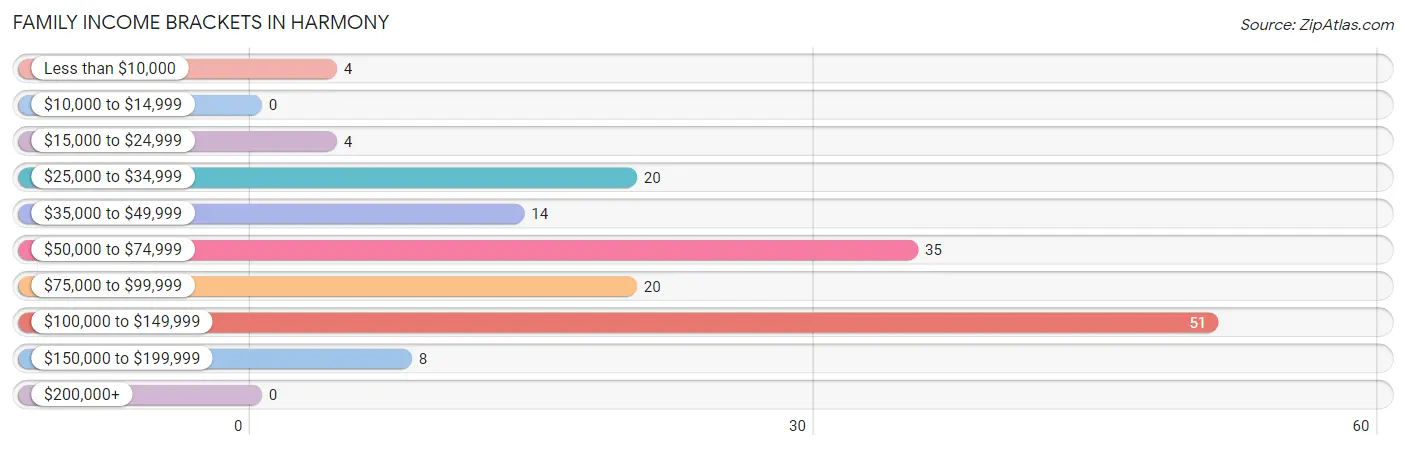
| Income Bracket | # Families | % Families |
| Less than $10,000 | 4 | 2.6% |
| $10,000 to $14,999 | 0 | 0.0% |
| $15,000 to $24,999 | 4 | 2.6% |
| $25,000 to $34,999 | 20 | 12.8% |
| $35,000 to $49,999 | 14 | 9.0% |
| $50,000 to $74,999 | 35 | 22.4% |
| $75,000 to $99,999 | 20 | 12.8% |
| $100,000 to $149,999 | 51 | 32.7% |
| $150,000 to $199,999 | 8 | 5.1% |
| $200,000+ | 0 | 0.0% |
Family Income by Famaliy Size in Harmony
5-person families (7 | 4.5%) account for the highest median family income in Harmony with $148,750 per family, while 2-person families (58 | 37.2%) have the highest median income of $36,458 per family member.
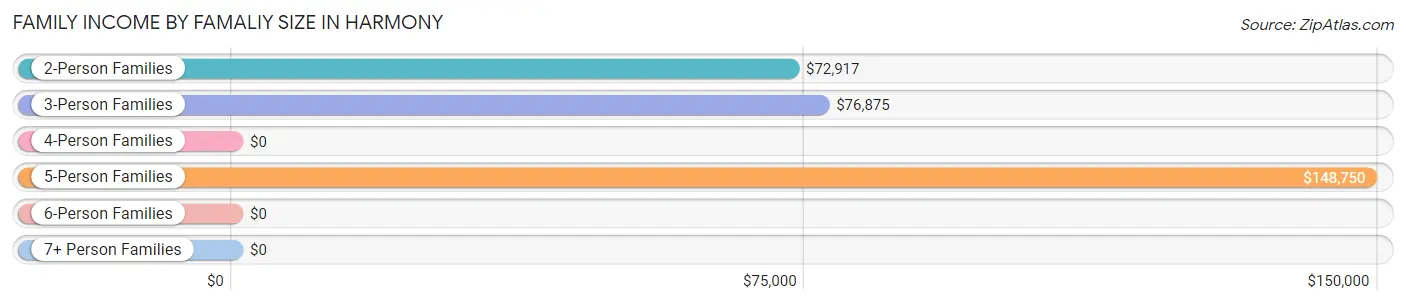
| Income Bracket | # Families | Median Income |
| 2-Person Families | 58 (37.2%) | $72,917 |
| 3-Person Families | 51 (32.7%) | $76,875 |
| 4-Person Families | 20 (12.8%) | $0 |
| 5-Person Families | 7 (4.5%) | $148,750 |
| 6-Person Families | 17 (10.9%) | $0 |
| 7+ Person Families | 3 (1.9%) | $0 |
| Total | 156 (100.0%) | $75,192 |
Family Income by Number of Earners in Harmony
The median family income in Harmony is $75,192, with families comprising 3+ earners (26) having the highest median family income of $128,333, while families with no earners (16) have the lowest median family income of $35,000, accounting for 16.7% and 10.3% of families, respectively.
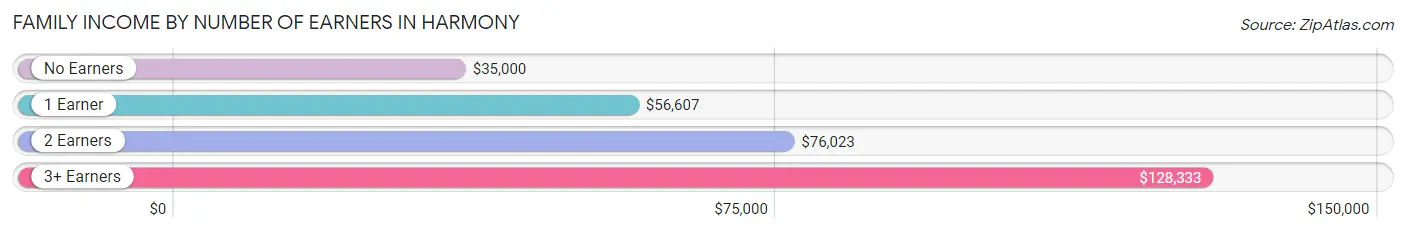
| Number of Earners | # Families | Median Income |
| No Earners | 16 (10.3%) | $35,000 |
| 1 Earner | 47 (30.1%) | $56,607 |
| 2 Earners | 67 (42.9%) | $76,023 |
| 3+ Earners | 26 (16.7%) | $128,333 |
| Total | 156 (100.0%) | $75,192 |
Household Income in Harmony
Household Income Brackets in Harmony
With 64 households falling in the category, the $50,000 to $74,999 income range is the most frequent in Harmony, accounting for 29.1% of all households.
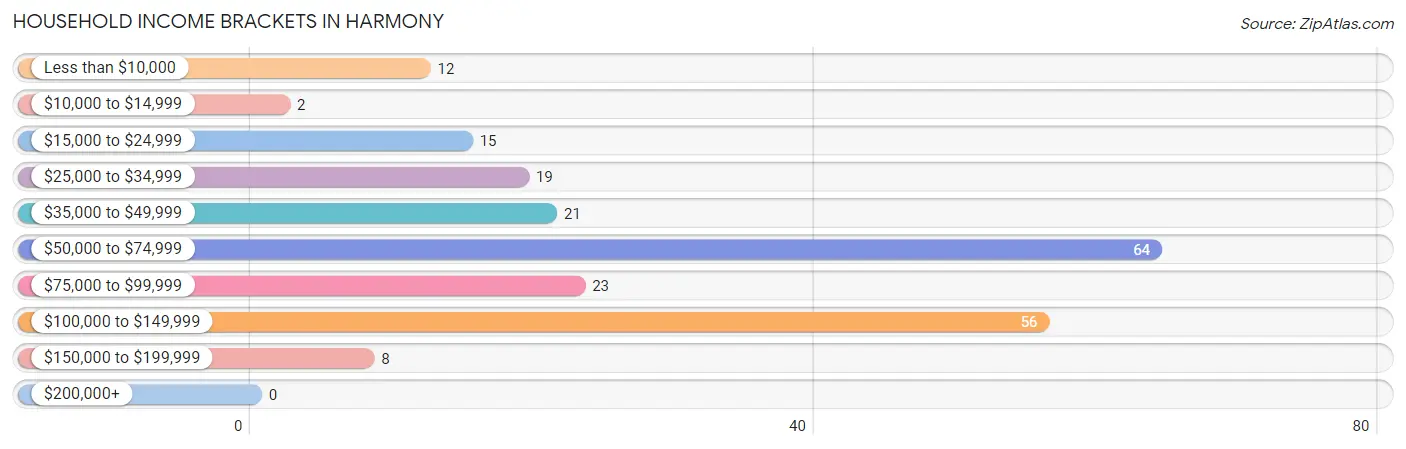
| Income Bracket | # Households | % Households |
| Less than $10,000 | 12 | 5.5% |
| $10,000 to $14,999 | 2 | 0.9% |
| $15,000 to $24,999 | 15 | 6.8% |
| $25,000 to $34,999 | 19 | 8.6% |
| $35,000 to $49,999 | 21 | 9.5% |
| $50,000 to $74,999 | 64 | 29.1% |
| $75,000 to $99,999 | 23 | 10.5% |
| $100,000 to $149,999 | 56 | 25.5% |
| $150,000 to $199,999 | 8 | 3.6% |
| $200,000+ | 0 | 0.0% |
Household Income by Householder Age in Harmony
The median household income in Harmony is $62,024, with the highest median household income of $73,958 found in the 25 to 44 years age bracket for the primary householder. A total of 45 households (20.4%) fall into this category. Meanwhile, the 15 to 24 years age bracket for the primary householder has the lowest median household income of $0, with 9 households (4.1%) in this group.
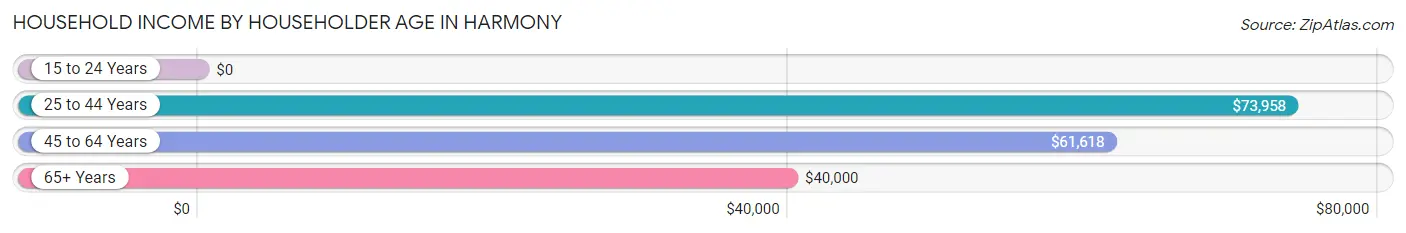
| Income Bracket | # Households | Median Income |
| 15 to 24 Years | 9 (4.1%) | $0 |
| 25 to 44 Years | 45 (20.4%) | $73,958 |
| 45 to 64 Years | 122 (55.4%) | $61,618 |
| 65+ Years | 44 (20.0%) | $40,000 |
| Total | 220 (100.0%) | $62,024 |
Poverty in Harmony
Income Below Poverty by Sex and Age in Harmony
With 6.8% poverty level for males and 6.9% for females among the residents of Harmony, 75 year old and over males and 16 and 17 year old females are the most vulnerable to poverty, with 4 males (30.8%) and 3 females (50.0%) in their respective age groups living below the poverty level.
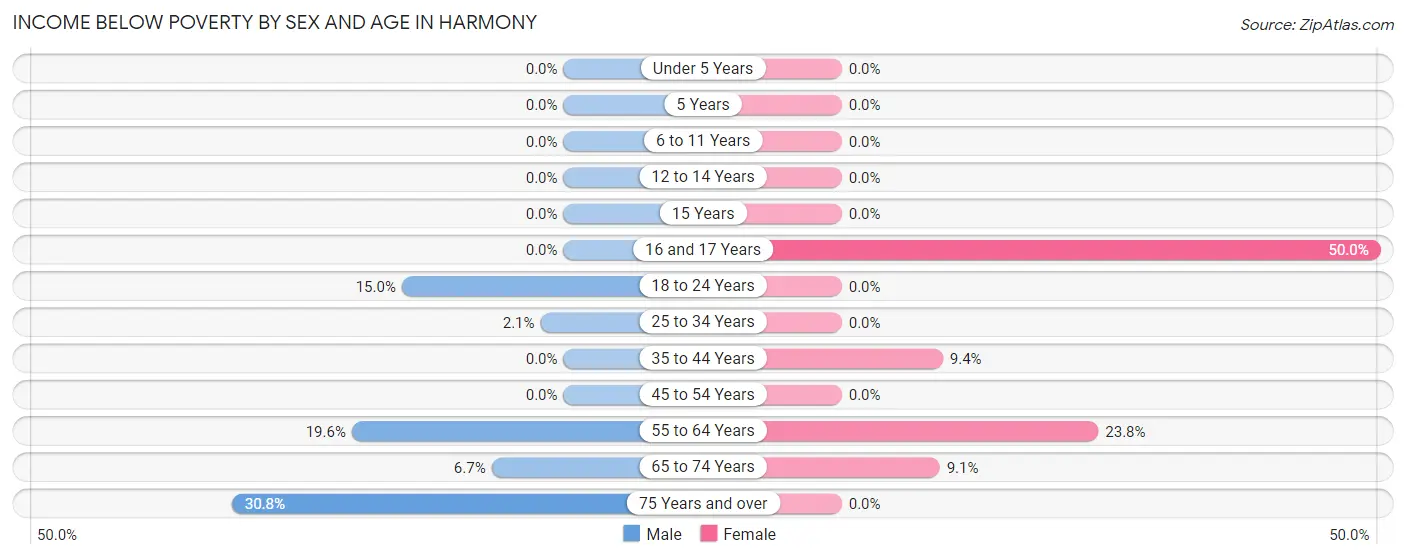
| Age Bracket | Male | Female |
| Under 5 Years | 0 (0.0%) | 0 (0.0%) |
| 5 Years | 0 (0.0%) | 0 (0.0%) |
| 6 to 11 Years | 0 (0.0%) | 0 (0.0%) |
| 12 to 14 Years | 0 (0.0%) | 0 (0.0%) |
| 15 Years | 0 (0.0%) | 0 (0.0%) |
| 16 and 17 Years | 0 (0.0%) | 3 (50.0%) |
| 18 to 24 Years | 6 (15.0%) | 0 (0.0%) |
| 25 to 34 Years | 1 (2.1%) | 0 (0.0%) |
| 35 to 44 Years | 0 (0.0%) | 3 (9.4%) |
| 45 to 54 Years | 0 (0.0%) | 0 (0.0%) |
| 55 to 64 Years | 11 (19.6%) | 10 (23.8%) |
| 65 to 74 Years | 1 (6.7%) | 1 (9.1%) |
| 75 Years and over | 4 (30.8%) | 0 (0.0%) |
| Total | 23 (6.8%) | 17 (6.9%) |
Income Above Poverty by Sex and Age in Harmony
According to the poverty statistics in Harmony, males aged under 5 years and females aged under 5 years are the age groups that are most secure financially, with 100.0% of males and 100.0% of females in these age groups living above the poverty line.
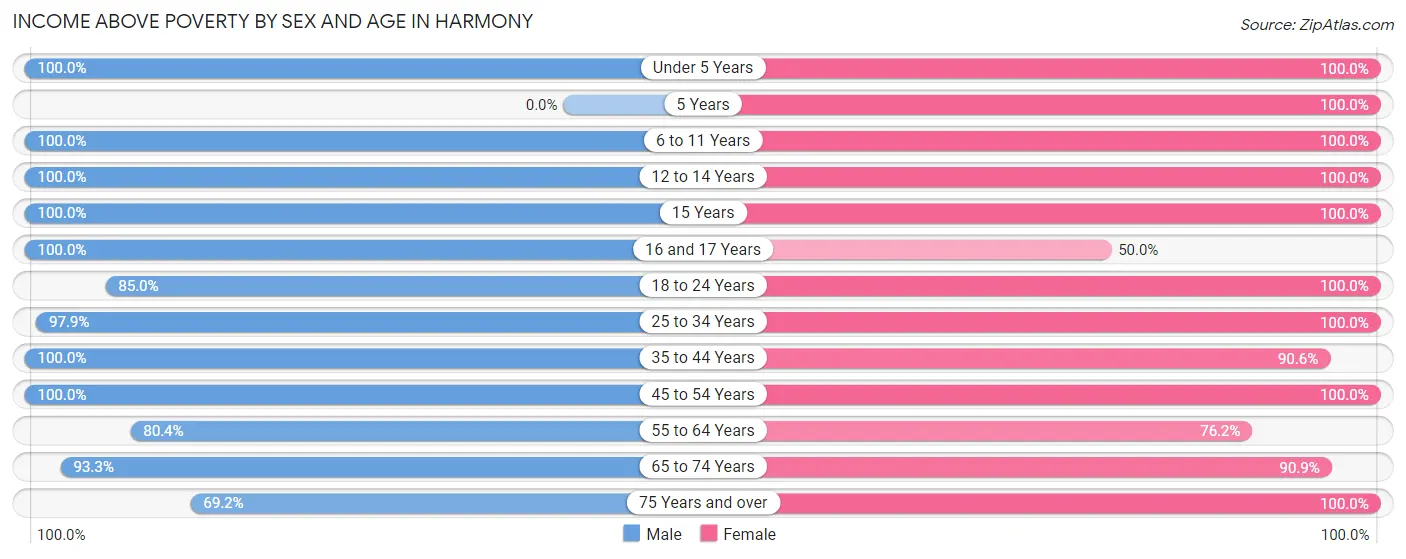
| Age Bracket | Male | Female |
| Under 5 Years | 28 (100.0%) | 3 (100.0%) |
| 5 Years | 0 (0.0%) | 3 (100.0%) |
| 6 to 11 Years | 23 (100.0%) | 24 (100.0%) |
| 12 to 14 Years | 10 (100.0%) | 3 (100.0%) |
| 15 Years | 4 (100.0%) | 9 (100.0%) |
| 16 and 17 Years | 14 (100.0%) | 3 (50.0%) |
| 18 to 24 Years | 34 (85.0%) | 27 (100.0%) |
| 25 to 34 Years | 46 (97.9%) | 31 (100.0%) |
| 35 to 44 Years | 16 (100.0%) | 29 (90.6%) |
| 45 to 54 Years | 73 (100.0%) | 34 (100.0%) |
| 55 to 64 Years | 45 (80.4%) | 32 (76.2%) |
| 65 to 74 Years | 14 (93.3%) | 10 (90.9%) |
| 75 Years and over | 9 (69.2%) | 20 (100.0%) |
| Total | 316 (93.2%) | 228 (93.1%) |
Income Below Poverty Among Married-Couple Families in Harmony
The poverty statistics for married-couple families in Harmony show that 3.7% or 4 of the total 109 families live below the poverty line. Families with 1 or 2 children have the highest poverty rate of 7.0%, comprising of 3 families. On the other hand, families with 3 or 4 children have the lowest poverty rate of 0.0%, which includes 0 families.
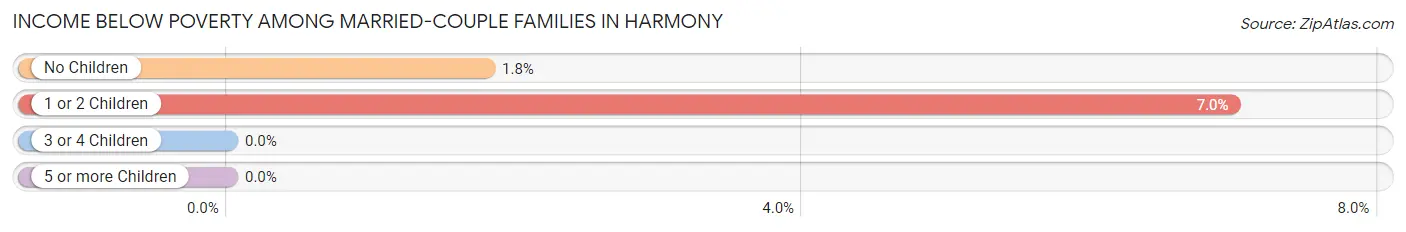
| Children | Above Poverty | Below Poverty |
| No Children | 55 (98.2%) | 1 (1.8%) |
| 1 or 2 Children | 40 (93.0%) | 3 (7.0%) |
| 3 or 4 Children | 7 (100.0%) | 0 (0.0%) |
| 5 or more Children | 3 (100.0%) | 0 (0.0%) |
| Total | 105 (96.3%) | 4 (3.7%) |
Income Below Poverty Among Single-Parent Households in Harmony
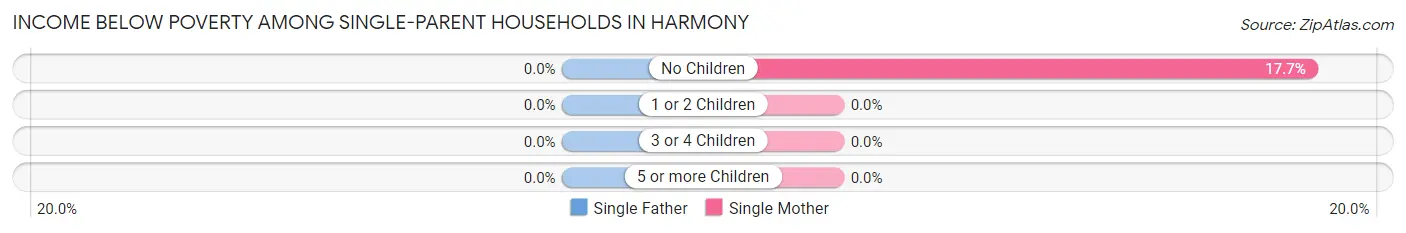
| Children | Single Father | Single Mother |
| No Children | 0 (0.0%) | 3 (17.6%) |
| 1 or 2 Children | 0 (0.0%) | 0 (0.0%) |
| 3 or 4 Children | 0 (0.0%) | 0 (0.0%) |
| 5 or more Children | 0 (0.0%) | 0 (0.0%) |
| Total | 0 (0.0%) | 3 (8.3%) |
Income Below Poverty Among Married-Couple vs Single-Parent Households in Harmony
The poverty data for Harmony shows that 4 of the married-couple family households (3.7%) and 3 of the single-parent households (6.4%) are living below the poverty level. Within the married-couple family households, those with 1 or 2 children have the highest poverty rate, with 3 households (7.0%) falling below the poverty line. Among the single-parent households, those with no children have the highest poverty rate, with 3 household (13.0%) living below poverty.
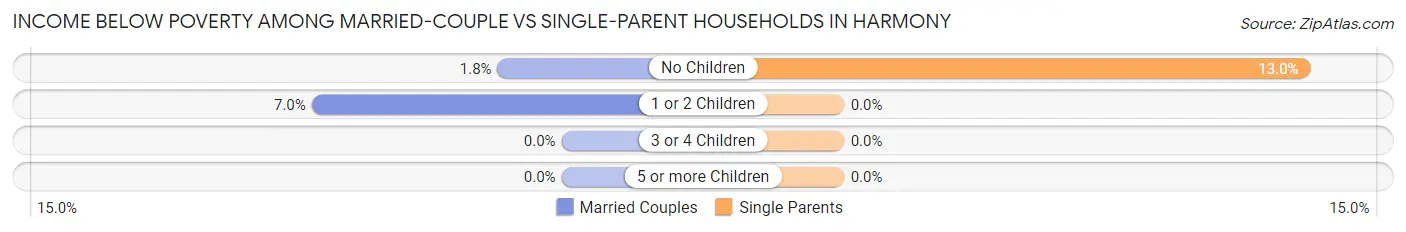
| Children | Married-Couple Families | Single-Parent Households |
| No Children | 1 (1.8%) | 3 (13.0%) |
| 1 or 2 Children | 3 (7.0%) | 0 (0.0%) |
| 3 or 4 Children | 0 (0.0%) | 0 (0.0%) |
| 5 or more Children | 0 (0.0%) | 0 (0.0%) |
| Total | 4 (3.7%) | 3 (6.4%) |
Race in Harmony
The most populous races in Harmony are White / Caucasian (462 | 79.1%), Hispanic or Latino (109 | 18.7%), and Some other Race (63 | 10.8%).
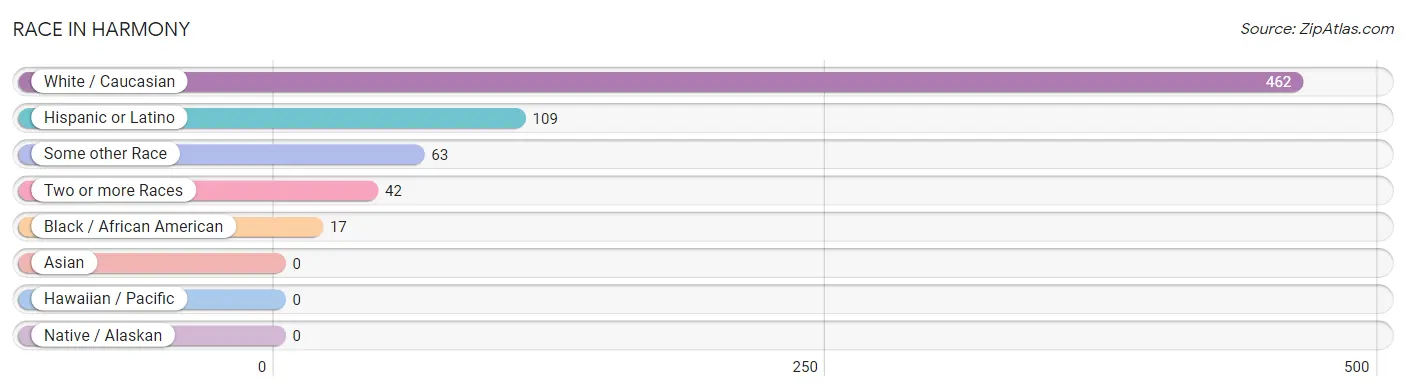
| Race | # Population | % Population |
| Asian | 0 | 0.0% |
| Black / African American | 17 | 2.9% |
| Hawaiian / Pacific | 0 | 0.0% |
| Hispanic or Latino | 109 | 18.7% |
| Native / Alaskan | 0 | 0.0% |
| White / Caucasian | 462 | 79.1% |
| Two or more Races | 42 | 7.2% |
| Some other Race | 63 | 10.8% |
| Total | 584 | 100.0% |
Ancestry in Harmony
The most populous ancestries reported in Harmony are German (101 | 17.3%), Mexican (71 | 12.2%), English (67 | 11.5%), American (47 | 8.1%), and Irish (28 | 4.8%), together accounting for 53.8% of all Harmony residents.
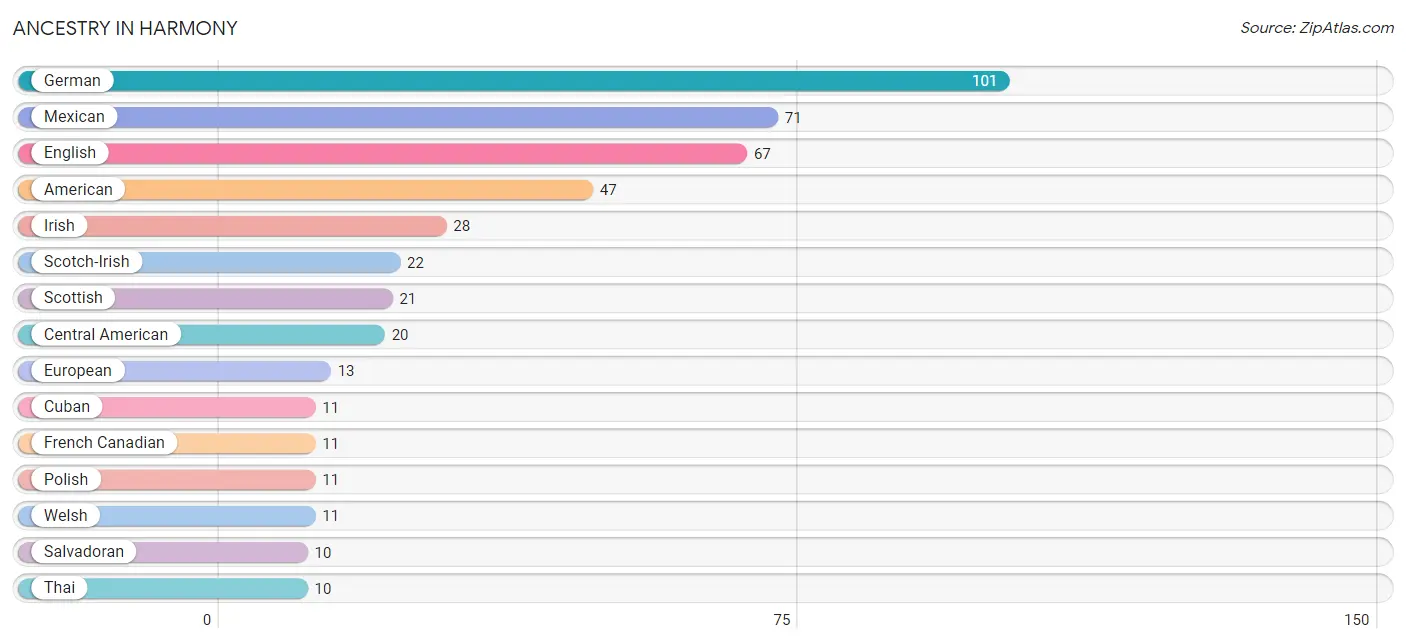
| Ancestry | # Population | % Population |
| American | 47 | 8.1% |
| Celtic | 4 | 0.7% |
| Central American | 20 | 3.4% |
| Cherokee | 2 | 0.3% |
| Chippewa | 1 | 0.2% |
| Crow | 1 | 0.2% |
| Cuban | 11 | 1.9% |
| English | 67 | 11.5% |
| European | 13 | 2.2% |
| French Canadian | 11 | 1.9% |
| German | 101 | 17.3% |
| Guatemalan | 2 | 0.3% |
| Honduran | 3 | 0.5% |
| Irish | 28 | 4.8% |
| Italian | 3 | 0.5% |
| Mexican | 71 | 12.2% |
| Northern European | 4 | 0.7% |
| Panamanian | 5 | 0.9% |
| Polish | 11 | 1.9% |
| Salvadoran | 10 | 1.7% |
| Scotch-Irish | 22 | 3.8% |
| Scottish | 21 | 3.6% |
| Swiss | 3 | 0.5% |
| Thai | 10 | 1.7% |
| Welsh | 11 | 1.9% | View All 25 Rows |
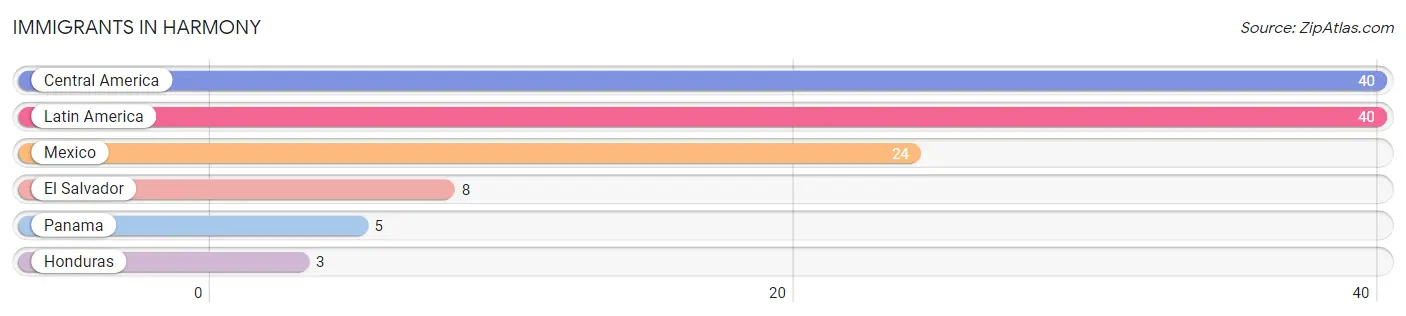
Immigrants in Harmony
The most numerous immigrant groups reported in Harmony came from Central America (40 | 6.9%), Latin America (40 | 6.9%), Mexico (24 | 4.1%), El Salvador (8 | 1.4%), and Panama (5 | 0.9%), together accounting for 20.0% of all Harmony residents.
| Immigration Origin | # Population | % Population |
| Central America | 40 | 6.9% |
| El Salvador | 8 | 1.4% |
| Honduras | 3 | 0.5% |
| Latin America | 40 | 6.9% |
| Mexico | 24 | 4.1% |
| Panama | 5 | 0.9% | View All 6 Rows |
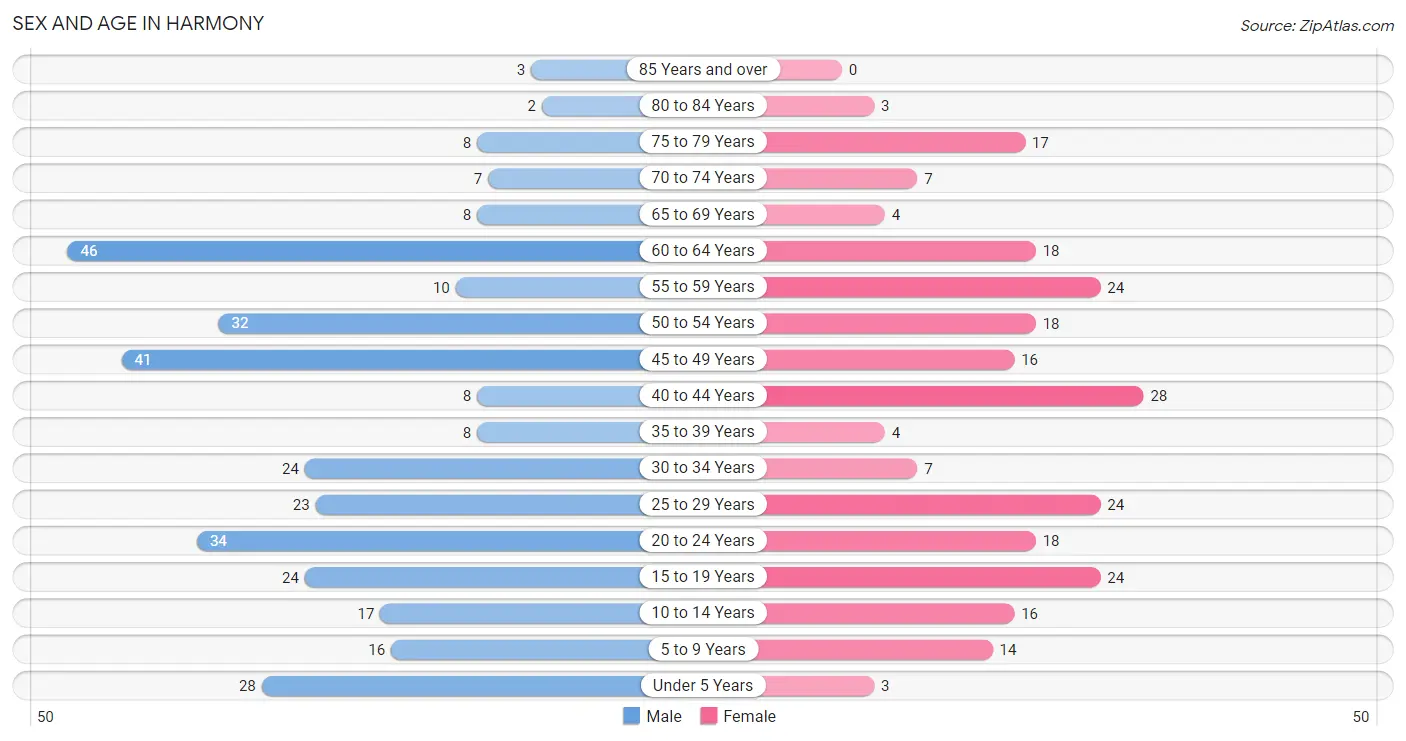
Sex and Age in Harmony
Sex and Age in Harmony
The most populous age groups in Harmony are 60 to 64 Years (46 | 13.6%) for men and 40 to 44 Years (28 | 11.4%) for women.
| Age Bracket | Male | Female |
| Under 5 Years | 28 (8.3%) | 3 (1.2%) |
| 5 to 9 Years | 16 (4.7%) | 14 (5.7%) |
| 10 to 14 Years | 17 (5.0%) | 16 (6.5%) |
| 15 to 19 Years | 24 (7.1%) | 24 (9.8%) |
| 20 to 24 Years | 34 (10.0%) | 18 (7.3%) |
| 25 to 29 Years | 23 (6.8%) | 24 (9.8%) |
| 30 to 34 Years | 24 (7.1%) | 7 (2.9%) |
| 35 to 39 Years | 8 (2.4%) | 4 (1.6%) |
| 40 to 44 Years | 8 (2.4%) | 28 (11.4%) |
| 45 to 49 Years | 41 (12.1%) | 16 (6.5%) |
| 50 to 54 Years | 32 (9.4%) | 18 (7.3%) |
| 55 to 59 Years | 10 (2.9%) | 24 (9.8%) |
| 60 to 64 Years | 46 (13.6%) | 18 (7.3%) |
| 65 to 69 Years | 8 (2.4%) | 4 (1.6%) |
| 70 to 74 Years | 7 (2.1%) | 7 (2.9%) |
| 75 to 79 Years | 8 (2.4%) | 17 (6.9%) |
| 80 to 84 Years | 2 (0.6%) | 3 (1.2%) |
| 85 Years and over | 3 (0.9%) | 0 (0.0%) |
| Total | 339 (100.0%) | 245 (100.0%) |
Families and Households in Harmony
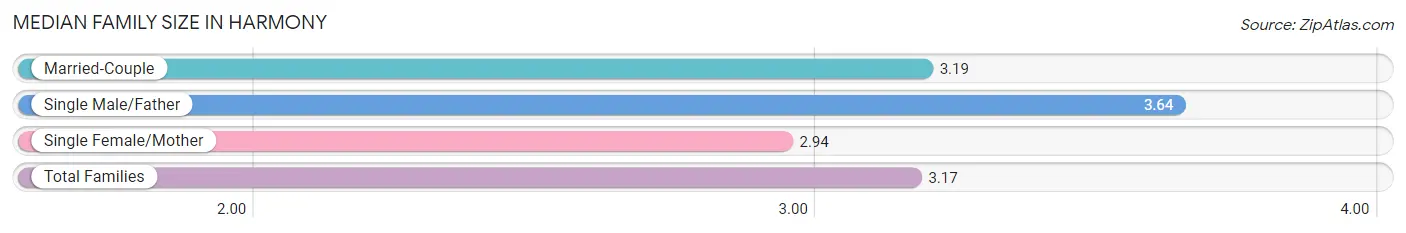
Median Family Size in Harmony
The median family size in Harmony is 3.17 persons per family, with single male/father families (11 | 7.0%) accounting for the largest median family size of 3.64 persons per family. On the other hand, single female/mother families (36 | 23.1%) represent the smallest median family size with 2.94 persons per family.
| Family Type | # Families | Family Size |
| Married-Couple | 109 (69.9%) | 3.19 |
| Single Male/Father | 11 (7.0%) | 3.64 |
| Single Female/Mother | 36 (23.1%) | 2.94 |
| Total Families | 156 (100.0%) | 3.17 |
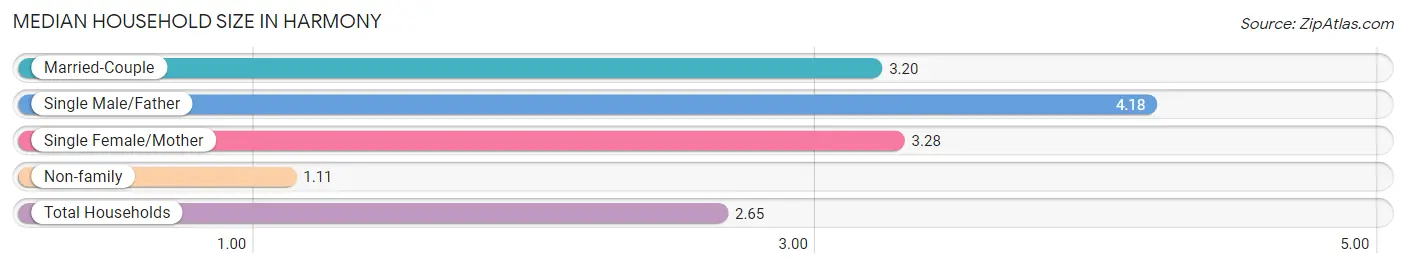
Median Household Size in Harmony
The median household size in Harmony is 2.65 persons per household, with single male/father households (11 | 5.0%) accounting for the largest median household size of 4.18 persons per household. non-family households (64 | 29.1%) represent the smallest median household size with 1.11 persons per household.
| Household Type | # Households | Household Size |
| Married-Couple | 109 (49.5%) | 3.20 |
| Single Male/Father | 11 (5.0%) | 4.18 |
| Single Female/Mother | 36 (16.4%) | 3.28 |
| Non-family | 64 (29.1%) | 1.11 |
| Total Households | 220 (100.0%) | 2.65 |
Household Size by Marriage Status in Harmony
Out of a total of 220 households in Harmony, 156 (70.9%) are family households, while 64 (29.1%) are nonfamily households. The most numerous type of family households are 2-person households, comprising 58, and the most common type of nonfamily households are 1-person households, comprising 56.
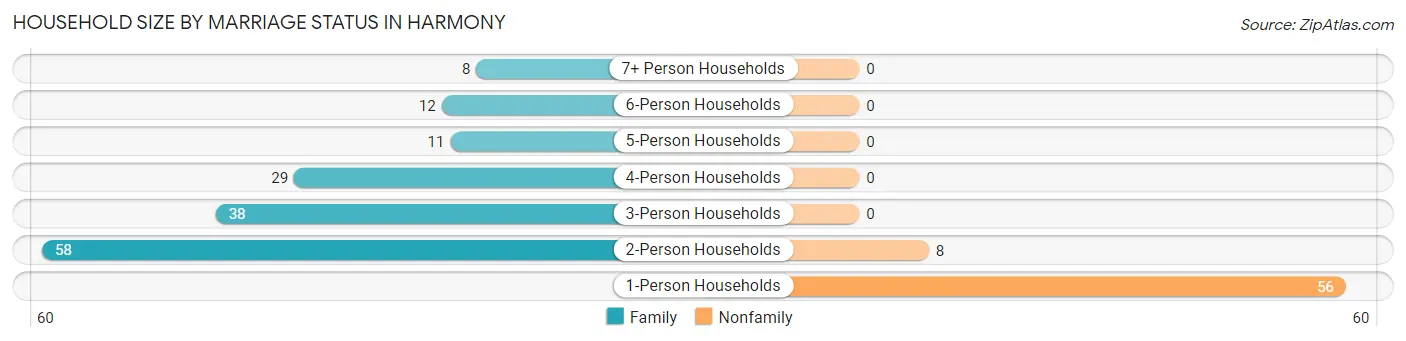
| Household Size | Family Households | Nonfamily Households |
| 1-Person Households | - | 56 (25.5%) |
| 2-Person Households | 58 (26.4%) | 8 (3.6%) |
| 3-Person Households | 38 (17.3%) | 0 (0.0%) |
| 4-Person Households | 29 (13.2%) | 0 (0.0%) |
| 5-Person Households | 11 (5.0%) | 0 (0.0%) |
| 6-Person Households | 12 (5.4%) | 0 (0.0%) |
| 7+ Person Households | 8 (3.6%) | 0 (0.0%) |
| Total | 156 (70.9%) | 64 (29.1%) |
Female Fertility in Harmony
Fertility by Age in Harmony
Average fertility rate in Harmony is 91.0 births per 1,000 women. Women in the age bracket of 20 to 34 years have the highest fertility rate with 224.0 births per 1,000 women. Women in the age bracket of 20 to 34 years acount for 100.0% of all women with births.
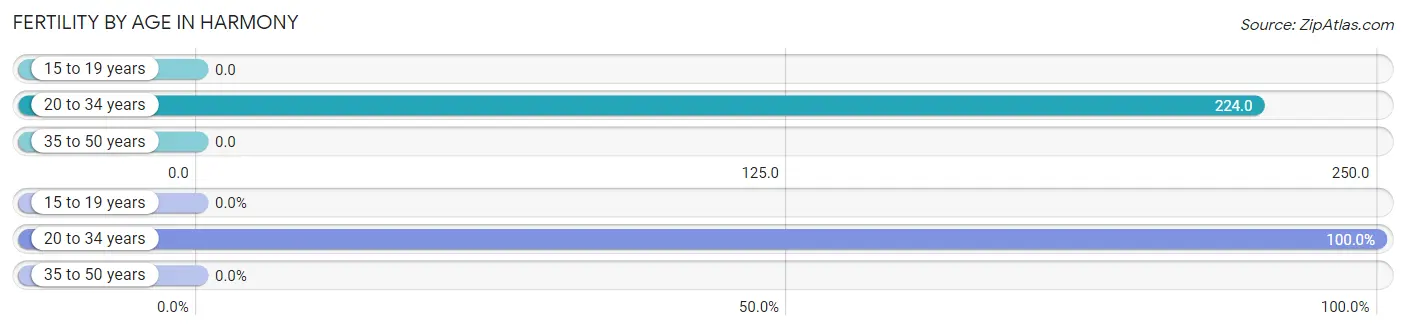
| Age Bracket | Women with Births | Births / 1,000 Women |
| 15 to 19 years | 0 (0.0%) | 0.0 |
| 20 to 34 years | 11 (100.0%) | 224.0 |
| 35 to 50 years | 0 (0.0%) | 0.0 |
| Total | 11 (100.0%) | 91.0 |
Fertility by Age by Marriage Status in Harmony
18.2% of women with births (11) in Harmony are married. The highest percentage of unmarried women with births falls into 20 to 34 years age bracket with 81.8% of them unmarried at the time of birth, while the lowest percentage of unmarried women with births belong to 20 to 34 years age bracket with 81.8% of them unmarried.
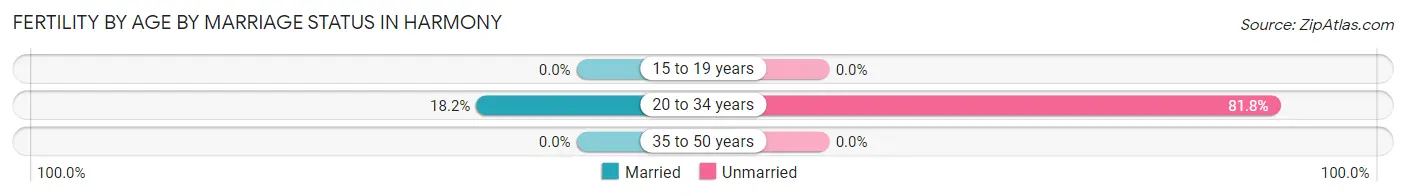
| Age Bracket | Married | Unmarried |
| 15 to 19 years | 0 (0.0%) | 0 (0.0%) |
| 20 to 34 years | 2 (18.2%) | 9 (81.8%) |
| 35 to 50 years | 0 (0.0%) | 0 (0.0%) |
| Total | 2 (18.2%) | 9 (81.8%) |
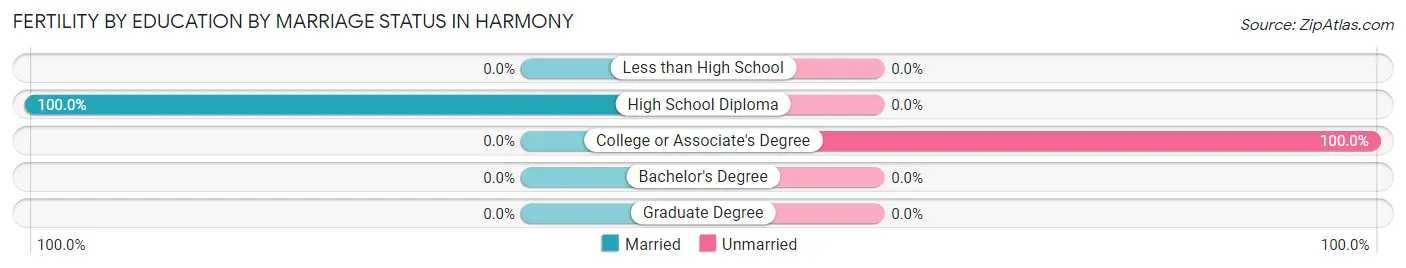
Fertility by Education in Harmony
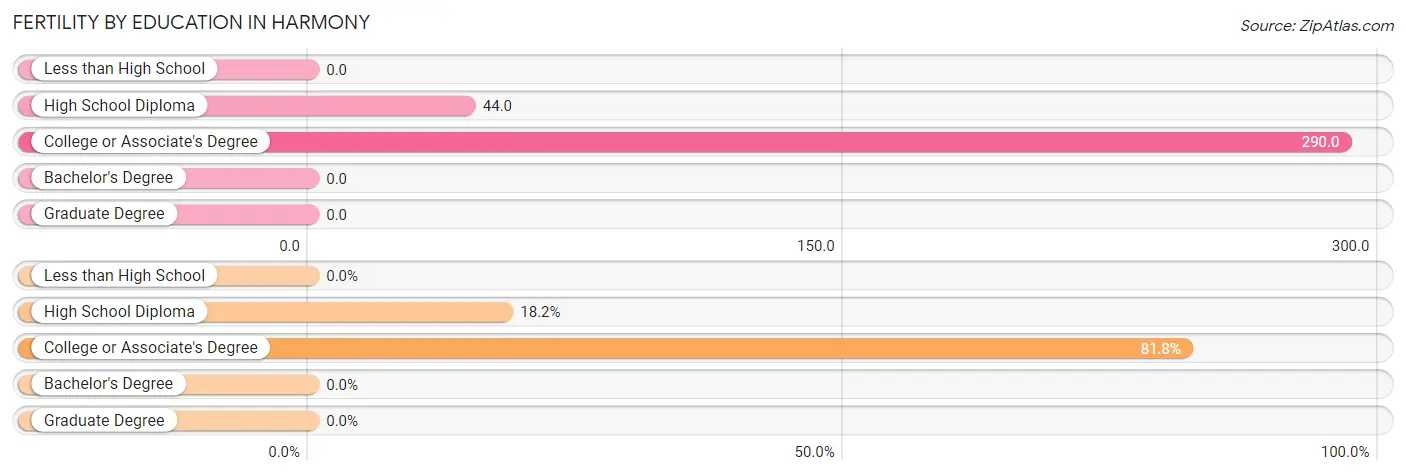
| Educational Attainment | Women with Births | Births / 1,000 Women |
| Less than High School | 0 (0.0%) | 0.0 |
| High School Diploma | 2 (18.2%) | 44.0 |
| College or Associate's Degree | 9 (81.8%) | 290.0 |
| Bachelor's Degree | 0 (0.0%) | 0.0 |
| Graduate Degree | 0 (0.0%) | 0.0 |
| Total | 11 (100.0%) | 91.0 |
Fertility by Education by Marriage Status in Harmony
81.8% of women with births in Harmony are unmarried. Women with the educational attainment of high school diploma are most likely to be married with 100.0% of them married at childbirth, while women with the educational attainment of college or associate's degree are least likely to be married with 100.0% of them unmarried at childbirth.
| Educational Attainment | Married | Unmarried |
| Less than High School | 0 (0.0%) | 0 (0.0%) |
| High School Diploma | 2 (100.0%) | 0 (0.0%) |
| College or Associate's Degree | 0 (0.0%) | 9 (100.0%) |
| Bachelor's Degree | 0 (0.0%) | 0 (0.0%) |
| Graduate Degree | 0 (0.0%) | 0 (0.0%) |
| Total | 2 (18.2%) | 9 (81.8%) |
Employment Characteristics in Harmony
Employment by Class of Employer in Harmony
Among the 301 employed individuals in Harmony, private company employees (200 | 66.4%), local government employees (27 | 9.0%), and self-employed (not incorporated) (20 | 6.6%) make up the most common classes of employment.
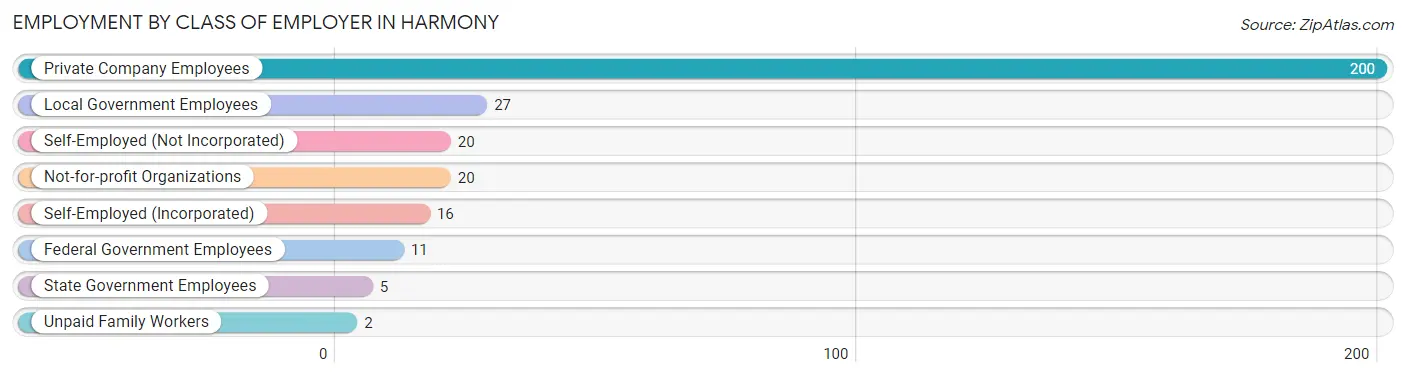
| Employer Class | # Employees | % Employees |
| Private Company Employees | 200 | 66.4% |
| Self-Employed (Incorporated) | 16 | 5.3% |
| Self-Employed (Not Incorporated) | 20 | 6.6% |
| Not-for-profit Organizations | 20 | 6.6% |
| Local Government Employees | 27 | 9.0% |
| State Government Employees | 5 | 1.7% |
| Federal Government Employees | 11 | 3.6% |
| Unpaid Family Workers | 2 | 0.7% |
| Total | 301 | 100.0% |
Employment Status by Age in Harmony
According to the labor force statistics for Harmony, out of the total population over 16 years of age (477), 68.1% or 325 individuals are in the labor force, with 2.2% or 7 of them unemployed. The age group with the highest labor force participation rate is 45 to 54 years, with 88.8% or 95 individuals in the labor force. Within the labor force, the 16 to 19 years age range has the highest percentage of unemployed individuals, with 10.5% or 2 of them being unemployed.
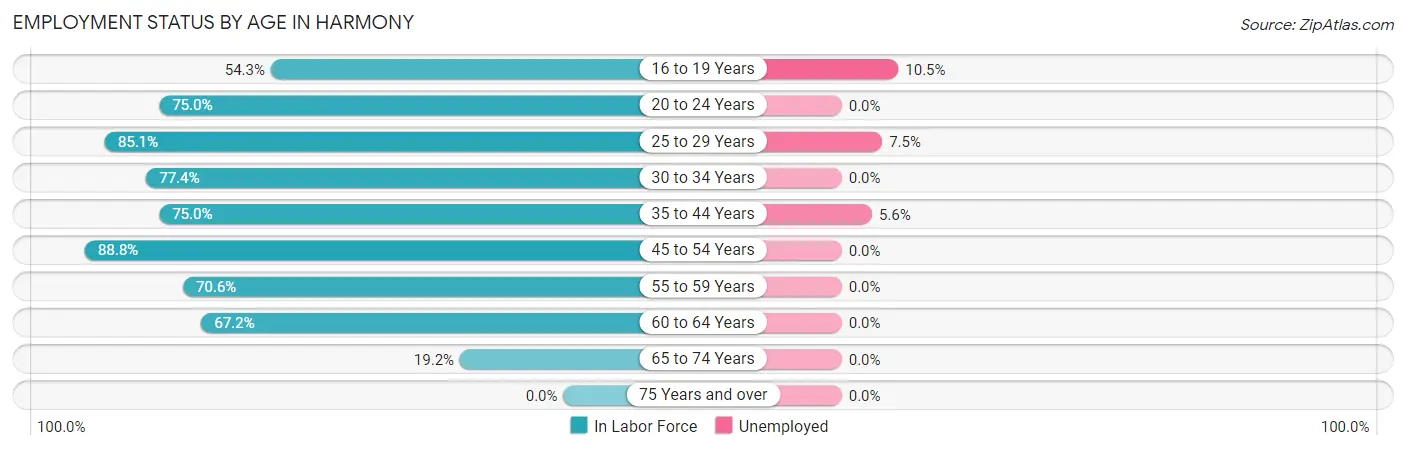
| Age Bracket | In Labor Force | Unemployed |
| 16 to 19 Years | 19 (54.3%) | 2 (10.5%) |
| 20 to 24 Years | 39 (75.0%) | 0 (0.0%) |
| 25 to 29 Years | 40 (85.1%) | 3 (7.5%) |
| 30 to 34 Years | 24 (77.4%) | 0 (0.0%) |
| 35 to 44 Years | 36 (75.0%) | 2 (5.6%) |
| 45 to 54 Years | 95 (88.8%) | 0 (0.0%) |
| 55 to 59 Years | 24 (70.6%) | 0 (0.0%) |
| 60 to 64 Years | 43 (67.2%) | 0 (0.0%) |
| 65 to 74 Years | 5 (19.2%) | 0 (0.0%) |
| 75 Years and over | 0 (0.0%) | 0 (0.0%) |
| Total | 325 (68.1%) | 7 (2.2%) |
Employment Status by Educational Attainment in Harmony
According to labor force statistics for Harmony, 79.2% of individuals (262) out of the total population between 25 and 64 years of age (331) are in the labor force, with 1.9% or 5 of them being unemployed. The group with the highest labor force participation rate are those with the educational attainment of bachelor's degree or higher, with 88.6% or 39 individuals in the labor force. Within the labor force, individuals with high school diploma education have the highest percentage of unemployment, with 3.9% or 3 of them being unemployed.
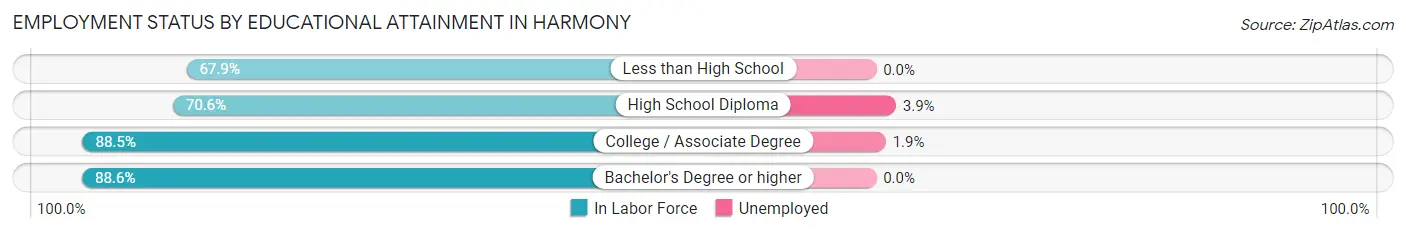
| Educational Attainment | In Labor Force | Unemployed |
| Less than High School | 38 (67.9%) | 0 (0.0%) |
| High School Diploma | 77 (70.6%) | 4 (3.9%) |
| College / Associate Degree | 108 (88.5%) | 2 (1.9%) |
| Bachelor's Degree or higher | 39 (88.6%) | 0 (0.0%) |
| Total | 262 (79.2%) | 6 (1.9%) |
Employment Occupations by Sex in Harmony
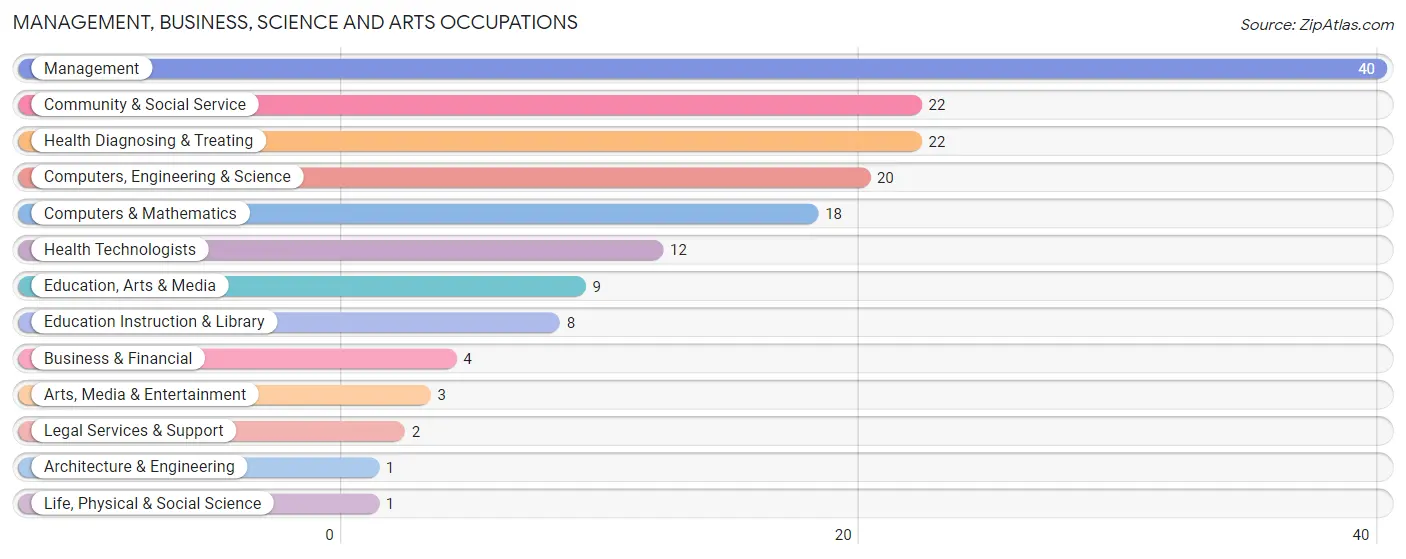
Management, Business, Science and Arts Occupations
The most common Management, Business, Science and Arts occupations in Harmony are Management (40 | 12.6%), Community & Social Service (22 | 6.9%), Health Diagnosing & Treating (22 | 6.9%), Computers, Engineering & Science (20 | 6.3%), and Computers & Mathematics (18 | 5.7%).
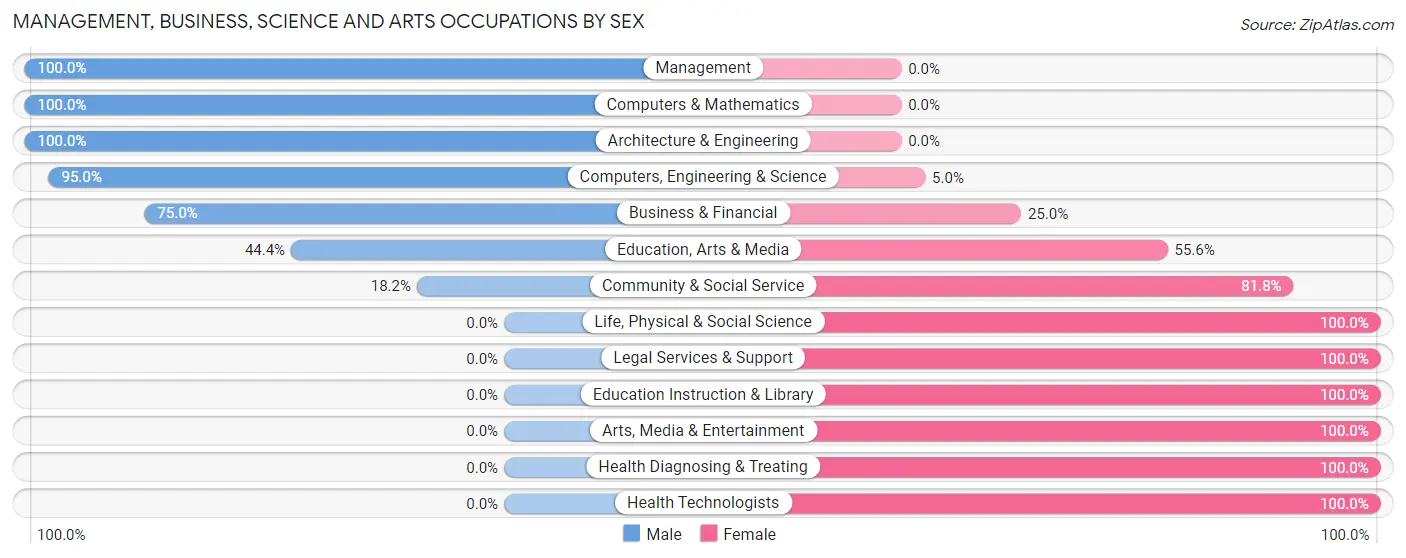
Management, Business, Science and Arts Occupations by Sex
Within the Management, Business, Science and Arts occupations in Harmony, the most male-oriented occupations are Management (100.0%), Computers & Mathematics (100.0%), and Architecture & Engineering (100.0%), while the most female-oriented occupations are Life, Physical & Social Science (100.0%), Legal Services & Support (100.0%), and Education Instruction & Library (100.0%).
| Occupation | Male | Female |
| Management | 40 (100.0%) | 0 (0.0%) |
| Business & Financial | 3 (75.0%) | 1 (25.0%) |
| Computers, Engineering & Science | 19 (95.0%) | 1 (5.0%) |
| Computers & Mathematics | 18 (100.0%) | 0 (0.0%) |
| Architecture & Engineering | 1 (100.0%) | 0 (0.0%) |
| Life, Physical & Social Science | 0 (0.0%) | 1 (100.0%) |
| Community & Social Service | 4 (18.2%) | 18 (81.8%) |
| Education, Arts & Media | 4 (44.4%) | 5 (55.6%) |
| Legal Services & Support | 0 (0.0%) | 2 (100.0%) |
| Education Instruction & Library | 0 (0.0%) | 8 (100.0%) |
| Arts, Media & Entertainment | 0 (0.0%) | 3 (100.0%) |
| Health Diagnosing & Treating | 0 (0.0%) | 22 (100.0%) |
| Health Technologists | 0 (0.0%) | 12 (100.0%) |
| Total (Category) | 66 (61.1%) | 42 (38.9%) |
| Total (Overall) | 204 (64.1%) | 114 (35.8%) |
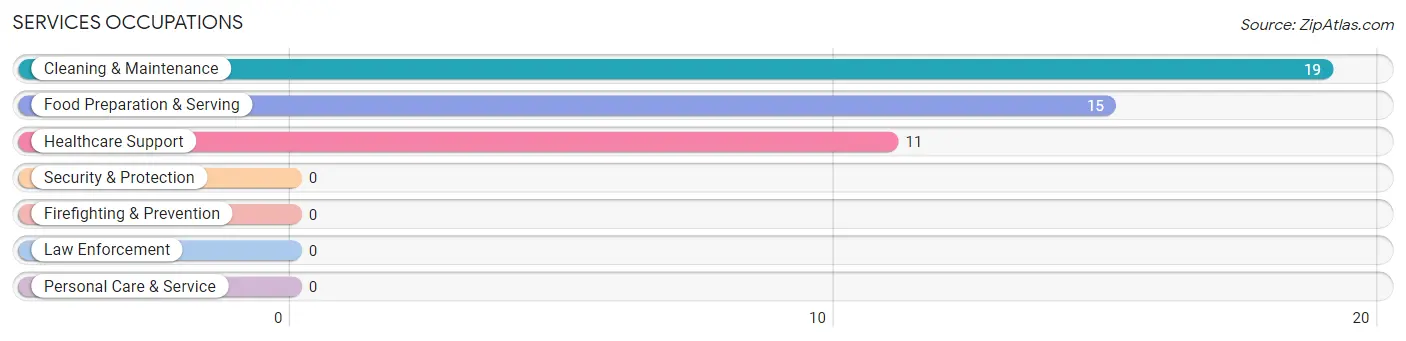
Services Occupations
The most common Services occupations in Harmony are Cleaning & Maintenance (19 | 6.0%), Food Preparation & Serving (15 | 4.7%), and Healthcare Support (11 | 3.5%).
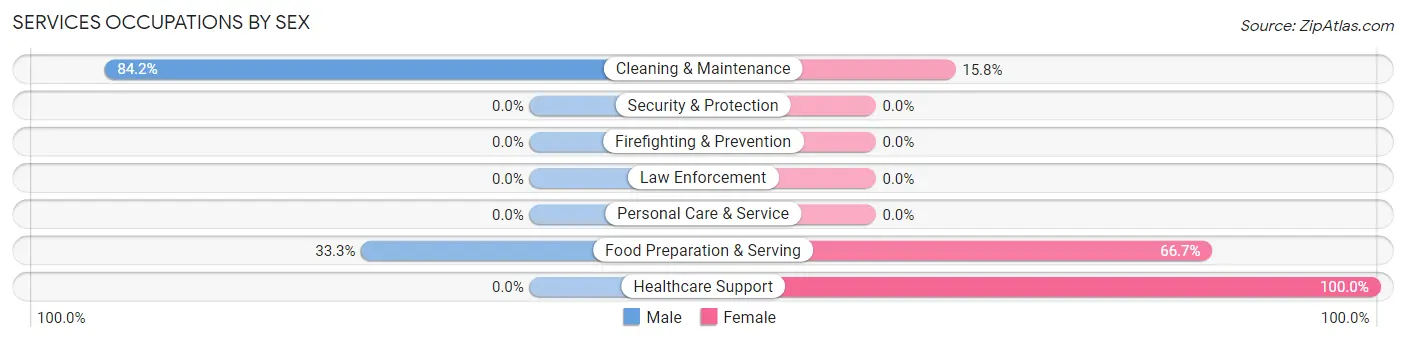
Services Occupations by Sex
Within the Services occupations in Harmony, the most male-oriented occupations are Cleaning & Maintenance (84.2%), and Food Preparation & Serving (33.3%), while the most female-oriented occupations are Healthcare Support (100.0%), Food Preparation & Serving (66.7%), and Cleaning & Maintenance (15.8%).
| Occupation | Male | Female |
| Healthcare Support | 0 (0.0%) | 11 (100.0%) |
| Security & Protection | 0 (0.0%) | 0 (0.0%) |
| Firefighting & Prevention | 0 (0.0%) | 0 (0.0%) |
| Law Enforcement | 0 (0.0%) | 0 (0.0%) |
| Food Preparation & Serving | 5 (33.3%) | 10 (66.7%) |
| Cleaning & Maintenance | 16 (84.2%) | 3 (15.8%) |
| Personal Care & Service | 0 (0.0%) | 0 (0.0%) |
| Total (Category) | 21 (46.7%) | 24 (53.3%) |
| Total (Overall) | 204 (64.1%) | 114 (35.8%) |
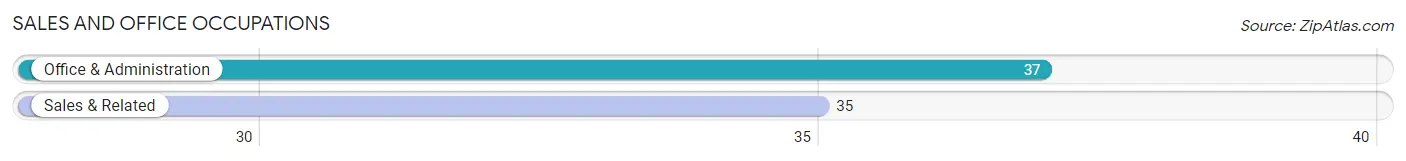
Sales and Office Occupations
The most common Sales and Office occupations in Harmony are Office & Administration (37 | 11.6%), and Sales & Related (35 | 11.0%).
Sales and Office Occupations by Sex
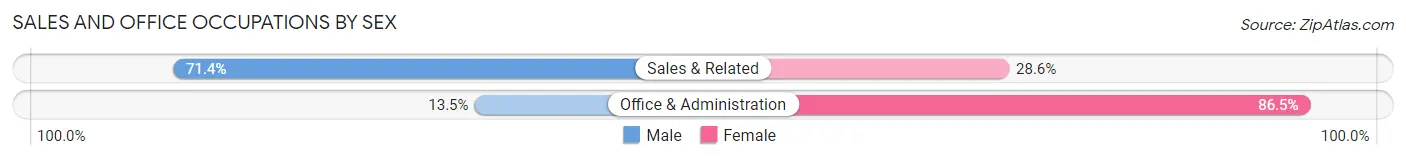
| Occupation | Male | Female |
| Sales & Related | 25 (71.4%) | 10 (28.6%) |
| Office & Administration | 5 (13.5%) | 32 (86.5%) |
| Total (Category) | 30 (41.7%) | 42 (58.3%) |
| Total (Overall) | 204 (64.1%) | 114 (35.8%) |
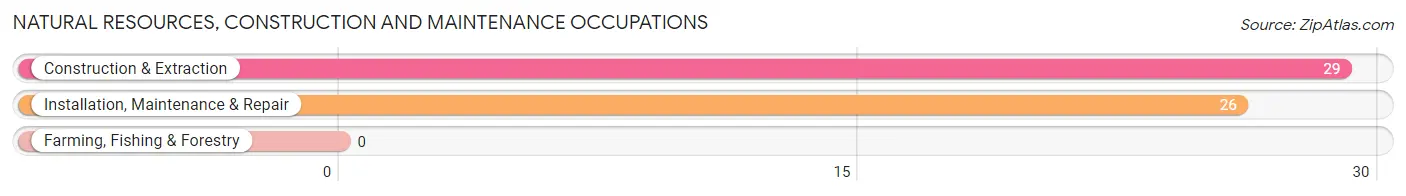
Natural Resources, Construction and Maintenance Occupations
The most common Natural Resources, Construction and Maintenance occupations in Harmony are Construction & Extraction (29 | 9.1%), and Installation, Maintenance & Repair (26 | 8.2%).
Natural Resources, Construction and Maintenance Occupations by Sex
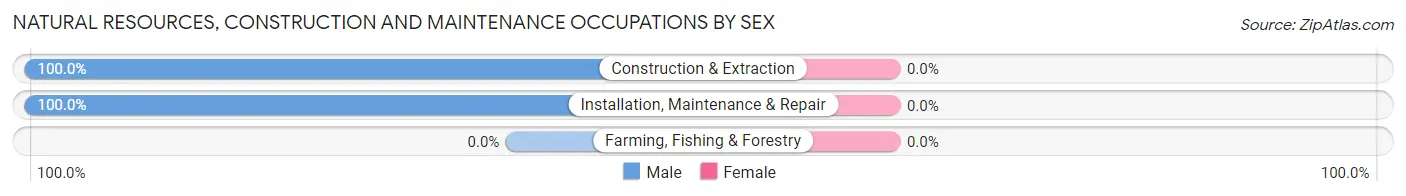
| Occupation | Male | Female |
| Farming, Fishing & Forestry | 0 (0.0%) | 0 (0.0%) |
| Construction & Extraction | 29 (100.0%) | 0 (0.0%) |
| Installation, Maintenance & Repair | 26 (100.0%) | 0 (0.0%) |
| Total (Category) | 55 (100.0%) | 0 (0.0%) |
| Total (Overall) | 204 (64.1%) | 114 (35.8%) |
Production, Transportation and Moving Occupations
The most common Production, Transportation and Moving occupations in Harmony are Production (16 | 5.0%), Transportation (12 | 3.8%), and Material Moving (10 | 3.1%).
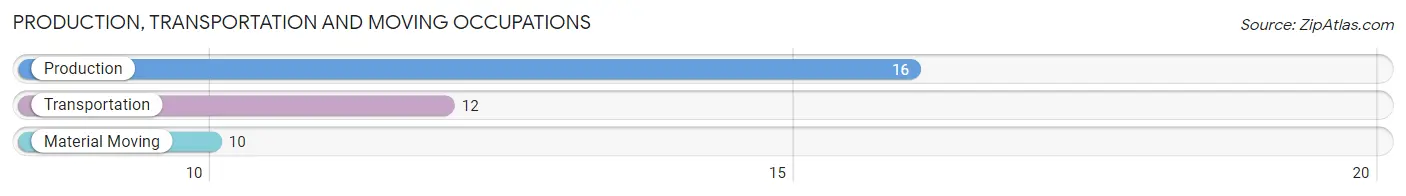
Production, Transportation and Moving Occupations by Sex
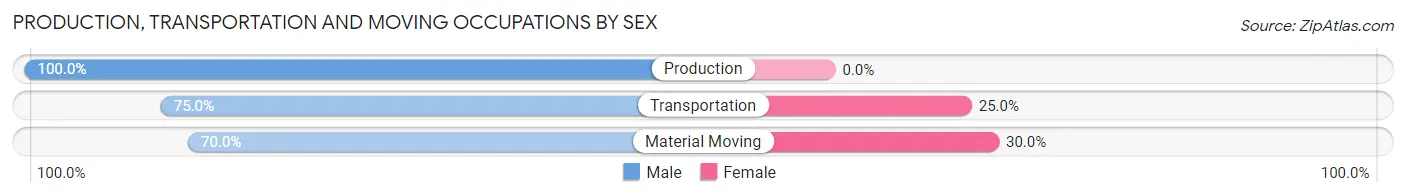
| Occupation | Male | Female |
| Production | 16 (100.0%) | 0 (0.0%) |
| Transportation | 9 (75.0%) | 3 (25.0%) |
| Material Moving | 7 (70.0%) | 3 (30.0%) |
| Total (Category) | 32 (84.2%) | 6 (15.8%) |
| Total (Overall) | 204 (64.1%) | 114 (35.8%) |
Employment Industries by Sex in Harmony
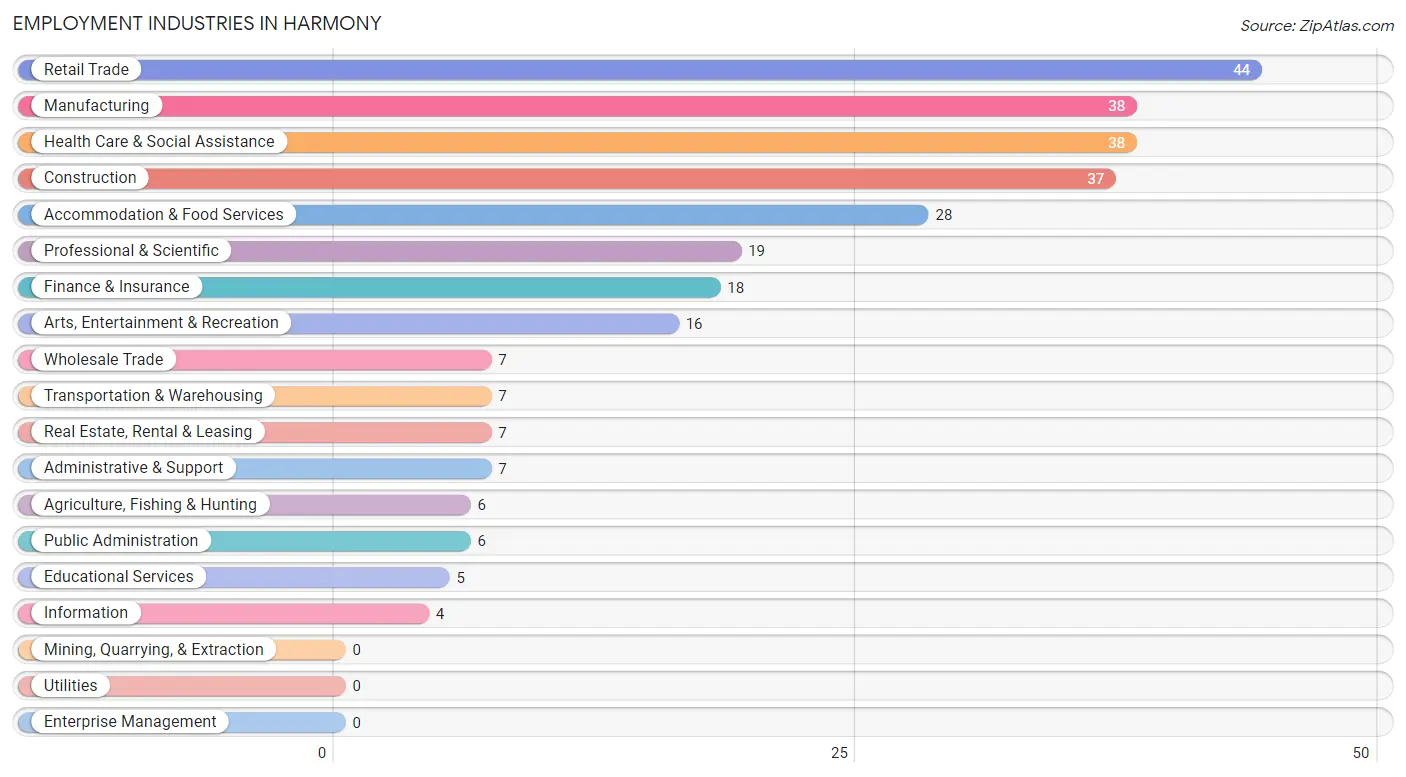
Employment Industries in Harmony
The major employment industries in Harmony include Retail Trade (44 | 13.8%), Manufacturing (38 | 11.9%), Health Care & Social Assistance (38 | 11.9%), Construction (37 | 11.6%), and Accommodation & Food Services (28 | 8.8%).
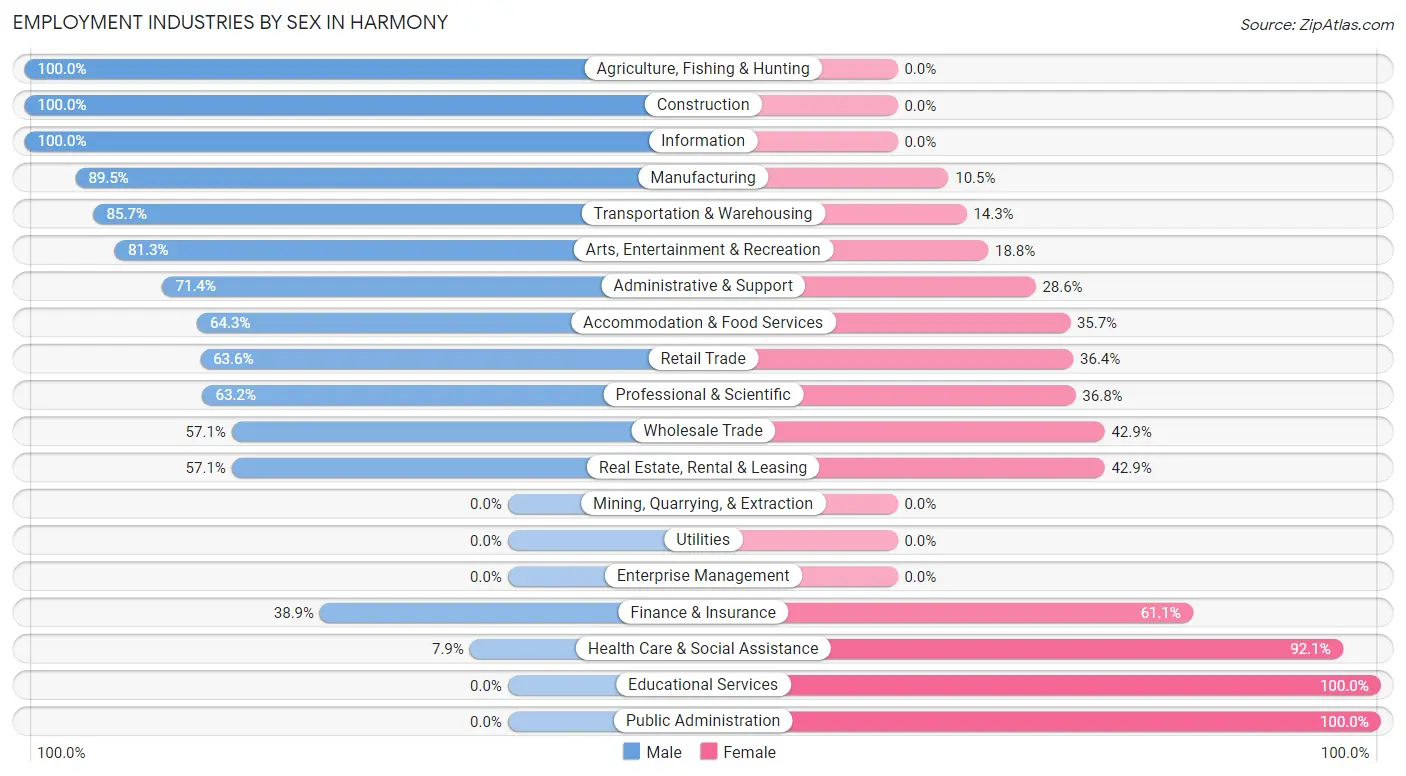
Employment Industries by Sex in Harmony
The Harmony industries that see more men than women are Agriculture, Fishing & Hunting (100.0%), Construction (100.0%), and Information (100.0%), whereas the industries that tend to have a higher number of women are Educational Services (100.0%), Public Administration (100.0%), and Health Care & Social Assistance (92.1%).
| Industry | Male | Female |
| Agriculture, Fishing & Hunting | 6 (100.0%) | 0 (0.0%) |
| Mining, Quarrying, & Extraction | 0 (0.0%) | 0 (0.0%) |
| Construction | 37 (100.0%) | 0 (0.0%) |
| Manufacturing | 34 (89.5%) | 4 (10.5%) |
| Wholesale Trade | 4 (57.1%) | 3 (42.9%) |
| Retail Trade | 28 (63.6%) | 16 (36.4%) |
| Transportation & Warehousing | 6 (85.7%) | 1 (14.3%) |
| Utilities | 0 (0.0%) | 0 (0.0%) |
| Information | 4 (100.0%) | 0 (0.0%) |
| Finance & Insurance | 7 (38.9%) | 11 (61.1%) |
| Real Estate, Rental & Leasing | 4 (57.1%) | 3 (42.9%) |
| Professional & Scientific | 12 (63.2%) | 7 (36.8%) |
| Enterprise Management | 0 (0.0%) | 0 (0.0%) |
| Administrative & Support | 5 (71.4%) | 2 (28.6%) |
| Educational Services | 0 (0.0%) | 5 (100.0%) |
| Health Care & Social Assistance | 3 (7.9%) | 35 (92.1%) |
| Arts, Entertainment & Recreation | 13 (81.2%) | 3 (18.8%) |
| Accommodation & Food Services | 18 (64.3%) | 10 (35.7%) |
| Public Administration | 0 (0.0%) | 6 (100.0%) |
| Total | 204 (64.1%) | 114 (35.8%) |
Education in Harmony
School Enrollment in Harmony
The most common levels of schooling among the 125 students in Harmony are high school (34 | 27.2%), college / undergraduate (31 | 24.8%), and middle school (30 | 24.0%).
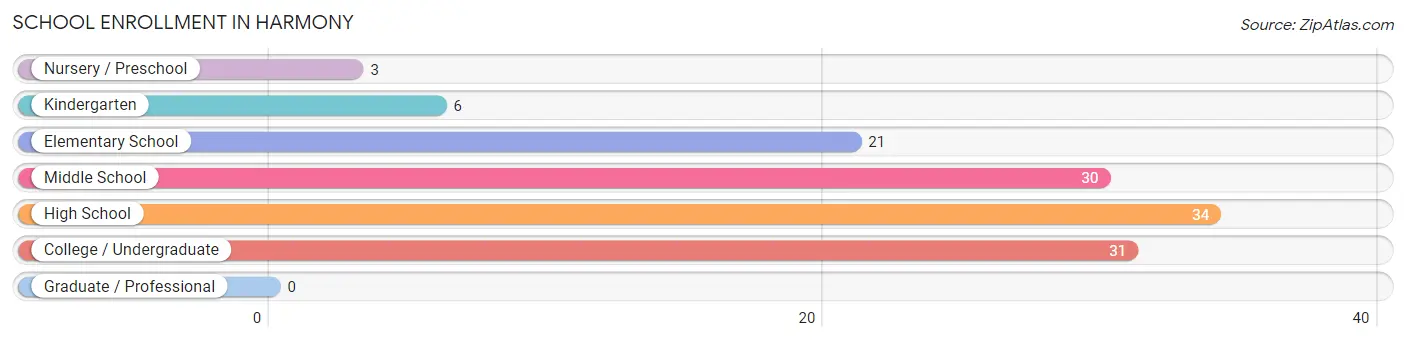
| School Level | # Students | % Students |
| Nursery / Preschool | 3 | 2.4% |
| Kindergarten | 6 | 4.8% |
| Elementary School | 21 | 16.8% |
| Middle School | 30 | 24.0% |
| High School | 34 | 27.2% |
| College / Undergraduate | 31 | 24.8% |
| Graduate / Professional | 0 | 0.0% |
| Total | 125 | 100.0% |
School Enrollment by Age by Funding Source in Harmony
Out of a total of 125 students who are enrolled in schools in Harmony, 25 (20.0%) attend a private institution, while the remaining 100 (80.0%) are enrolled in public schools. The age group of 3 to 4 year olds has the highest likelihood of being enrolled in private schools, with 3 (100.0% in the age bracket) enrolled. Conversely, the age group of 20 to 24 year olds has the lowest likelihood of being enrolled in a private school, with 22 (100.0% in the age bracket) attending a public institution.
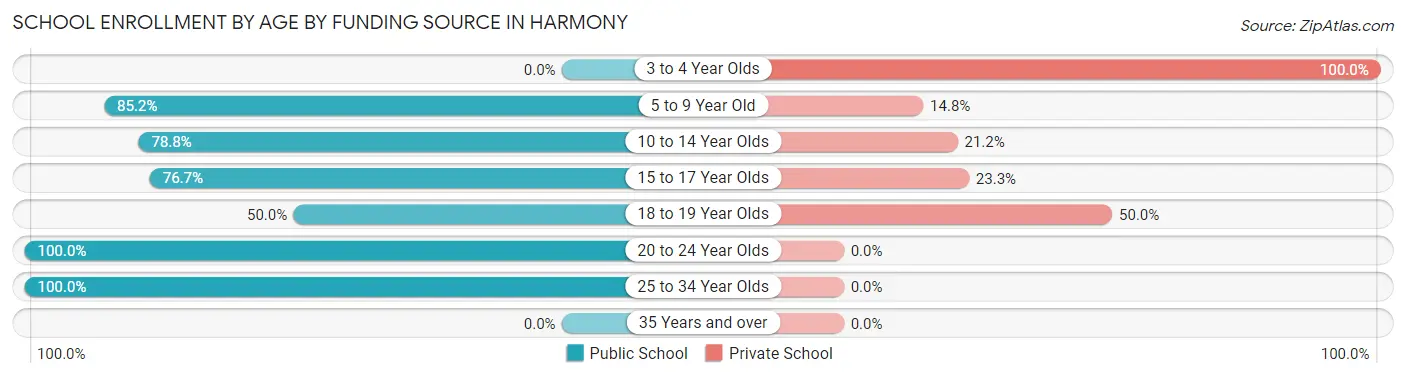
| Age Bracket | Public School | Private School |
| 3 to 4 Year Olds | 0 (0.0%) | 3 (100.0%) |
| 5 to 9 Year Old | 23 (85.2%) | 4 (14.8%) |
| 10 to 14 Year Olds | 26 (78.8%) | 7 (21.2%) |
| 15 to 17 Year Olds | 23 (76.7%) | 7 (23.3%) |
| 18 to 19 Year Olds | 4 (50.0%) | 4 (50.0%) |
| 20 to 24 Year Olds | 22 (100.0%) | 0 (0.0%) |
| 25 to 34 Year Olds | 2 (100.0%) | 0 (0.0%) |
| 35 Years and over | 0 (0.0%) | 0 (0.0%) |
| Total | 100 (80.0%) | 25 (20.0%) |
Educational Attainment by Field of Study in Harmony
Arts & humanities (13 | 24.5%), education (7 | 13.2%), science & technology (6 | 11.3%), liberal arts & history (6 | 11.3%), and psychology (5 | 9.4%) are the most common fields of study among 53 individuals in Harmony who have obtained a bachelor's degree or higher.
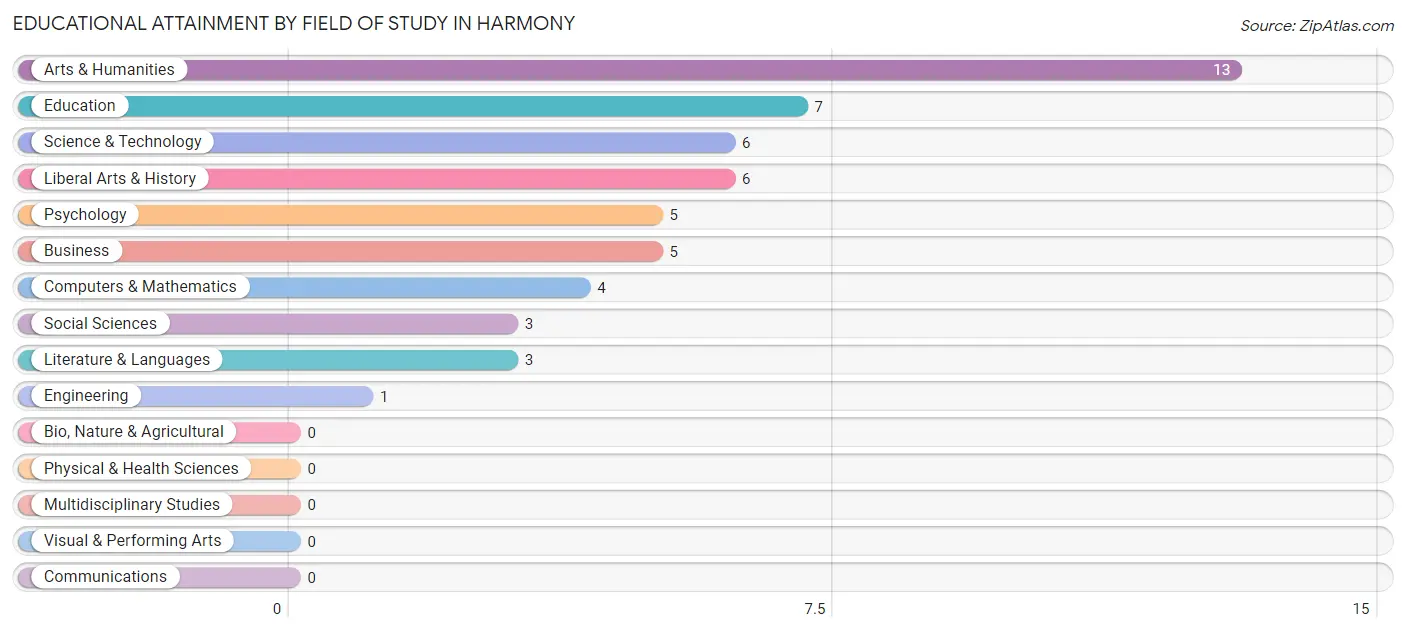
| Field of Study | # Graduates | % Graduates |
| Computers & Mathematics | 4 | 7.5% |
| Bio, Nature & Agricultural | 0 | 0.0% |
| Physical & Health Sciences | 0 | 0.0% |
| Psychology | 5 | 9.4% |
| Social Sciences | 3 | 5.7% |
| Engineering | 1 | 1.9% |
| Multidisciplinary Studies | 0 | 0.0% |
| Science & Technology | 6 | 11.3% |
| Business | 5 | 9.4% |
| Education | 7 | 13.2% |
| Literature & Languages | 3 | 5.7% |
| Liberal Arts & History | 6 | 11.3% |
| Visual & Performing Arts | 0 | 0.0% |
| Communications | 0 | 0.0% |
| Arts & Humanities | 13 | 24.5% |
| Total | 53 | 100.0% |
Transportation & Commute in Harmony
Vehicle Availability by Sex in Harmony
The most prevalent vehicle ownership categories in Harmony are males with 3 vehicles (84, accounting for 44.9%) and females with 3 vehicles (65, making up 73.7%).
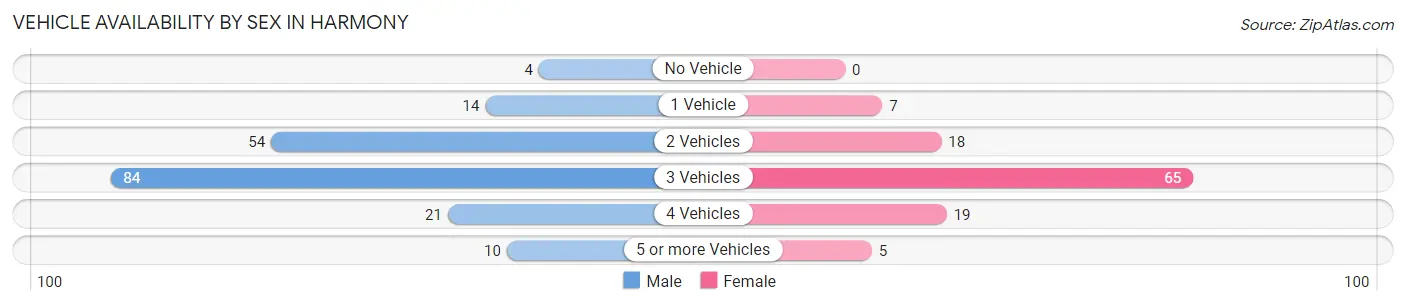
| Vehicles Available | Male | Female |
| No Vehicle | 4 (2.1%) | 0 (0.0%) |
| 1 Vehicle | 14 (7.5%) | 7 (6.1%) |
| 2 Vehicles | 54 (28.9%) | 18 (15.8%) |
| 3 Vehicles | 84 (44.9%) | 65 (57.0%) |
| 4 Vehicles | 21 (11.2%) | 19 (16.7%) |
| 5 or more Vehicles | 10 (5.3%) | 5 (4.4%) |
| Total | 187 (100.0%) | 114 (100.0%) |
Commute Time in Harmony
The most frequently occuring commute durations in Harmony are 20 to 24 minutes (51 commuters, 18.0%), 25 to 29 minutes (51 commuters, 18.0%), and 30 to 34 minutes (48 commuters, 17.0%).
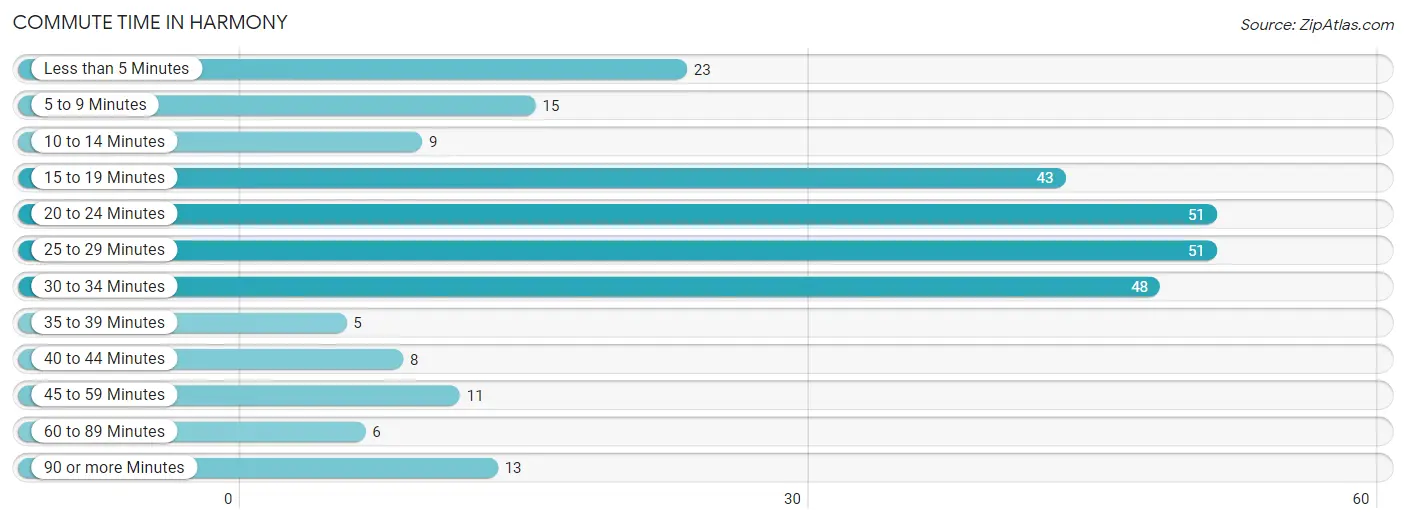
| Commute Time | # Commuters | % Commuters |
| Less than 5 Minutes | 23 | 8.1% |
| 5 to 9 Minutes | 15 | 5.3% |
| 10 to 14 Minutes | 9 | 3.2% |
| 15 to 19 Minutes | 43 | 15.2% |
| 20 to 24 Minutes | 51 | 18.0% |
| 25 to 29 Minutes | 51 | 18.0% |
| 30 to 34 Minutes | 48 | 17.0% |
| 35 to 39 Minutes | 5 | 1.8% |
| 40 to 44 Minutes | 8 | 2.8% |
| 45 to 59 Minutes | 11 | 3.9% |
| 60 to 89 Minutes | 6 | 2.1% |
| 90 or more Minutes | 13 | 4.6% |
Commute Time by Sex in Harmony
The most common commute times in Harmony are 20 to 24 minutes (37 commuters, 21.3%) for males and 25 to 29 minutes (31 commuters, 28.4%) for females.
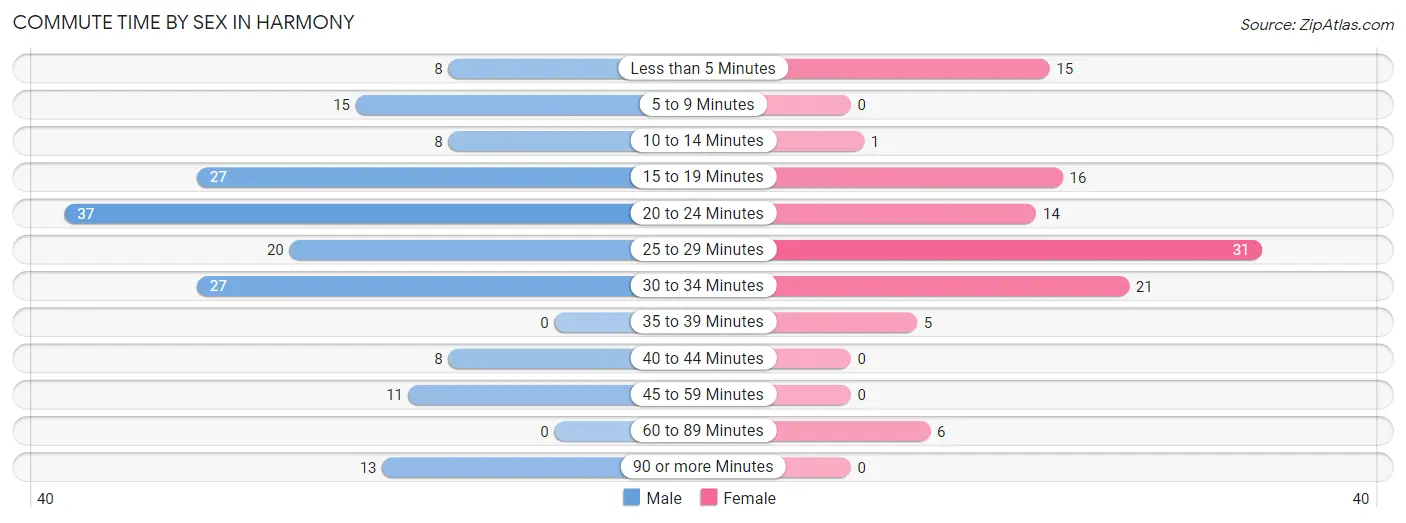
| Commute Time | Male | Female |
| Less than 5 Minutes | 8 (4.6%) | 15 (13.8%) |
| 5 to 9 Minutes | 15 (8.6%) | 0 (0.0%) |
| 10 to 14 Minutes | 8 (4.6%) | 1 (0.9%) |
| 15 to 19 Minutes | 27 (15.5%) | 16 (14.7%) |
| 20 to 24 Minutes | 37 (21.3%) | 14 (12.8%) |
| 25 to 29 Minutes | 20 (11.5%) | 31 (28.4%) |
| 30 to 34 Minutes | 27 (15.5%) | 21 (19.3%) |
| 35 to 39 Minutes | 0 (0.0%) | 5 (4.6%) |
| 40 to 44 Minutes | 8 (4.6%) | 0 (0.0%) |
| 45 to 59 Minutes | 11 (6.3%) | 0 (0.0%) |
| 60 to 89 Minutes | 0 (0.0%) | 6 (5.5%) |
| 90 or more Minutes | 13 (7.5%) | 0 (0.0%) |
Time of Departure to Work by Sex in Harmony
The most frequent times of departure to work in Harmony are 7:00 AM to 7:29 AM (28, 16.1%) for males and 8:00 AM to 8:29 AM (22, 20.2%) for females.
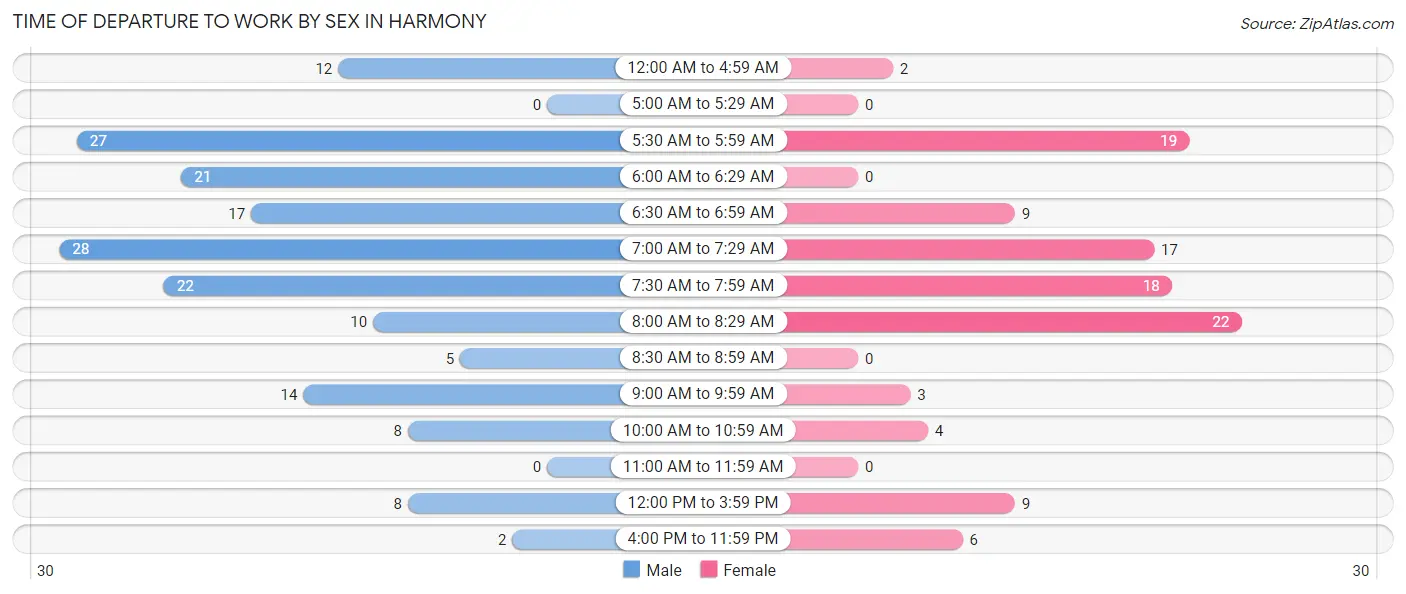
| Time of Departure | Male | Female |
| 12:00 AM to 4:59 AM | 12 (6.9%) | 2 (1.8%) |
| 5:00 AM to 5:29 AM | 0 (0.0%) | 0 (0.0%) |
| 5:30 AM to 5:59 AM | 27 (15.5%) | 19 (17.4%) |
| 6:00 AM to 6:29 AM | 21 (12.1%) | 0 (0.0%) |
| 6:30 AM to 6:59 AM | 17 (9.8%) | 9 (8.3%) |
| 7:00 AM to 7:29 AM | 28 (16.1%) | 17 (15.6%) |
| 7:30 AM to 7:59 AM | 22 (12.6%) | 18 (16.5%) |
| 8:00 AM to 8:29 AM | 10 (5.8%) | 22 (20.2%) |
| 8:30 AM to 8:59 AM | 5 (2.9%) | 0 (0.0%) |
| 9:00 AM to 9:59 AM | 14 (8.1%) | 3 (2.8%) |
| 10:00 AM to 10:59 AM | 8 (4.6%) | 4 (3.7%) |
| 11:00 AM to 11:59 AM | 0 (0.0%) | 0 (0.0%) |
| 12:00 PM to 3:59 PM | 8 (4.6%) | 9 (8.3%) |
| 4:00 PM to 11:59 PM | 2 (1.1%) | 6 (5.5%) |
| Total | 174 (100.0%) | 109 (100.0%) |
Housing Occupancy in Harmony
Occupancy by Ownership in Harmony
Of the total 220 dwellings in Harmony, owner-occupied units account for 161 (73.2%), while renter-occupied units make up 59 (26.8%).
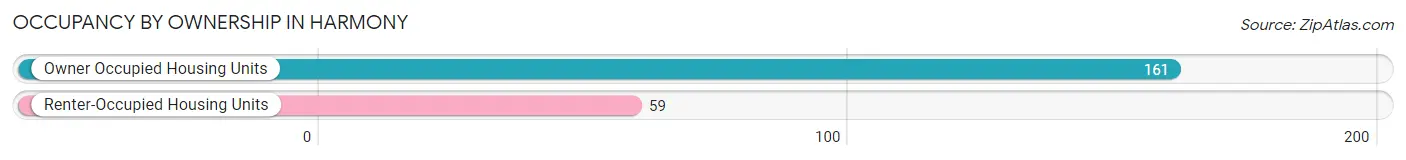
| Occupancy | # Housing Units | % Housing Units |
| Owner Occupied Housing Units | 161 | 73.2% |
| Renter-Occupied Housing Units | 59 | 26.8% |
| Total Occupied Housing Units | 220 | 100.0% |
Occupancy by Household Size in Harmony
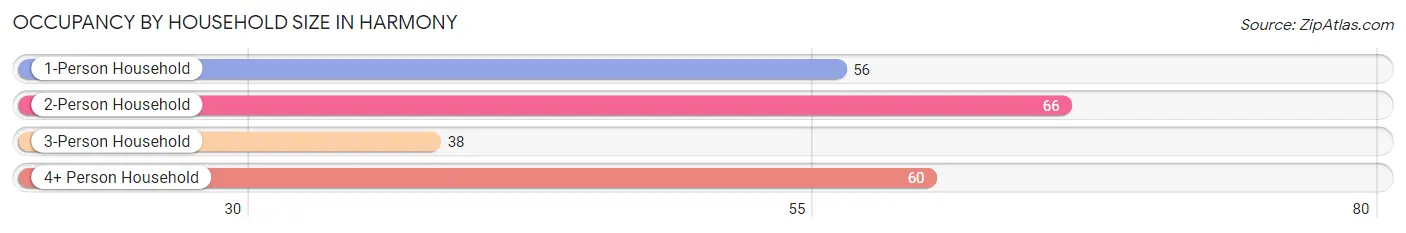
| Household Size | # Housing Units | % Housing Units |
| 1-Person Household | 56 | 25.5% |
| 2-Person Household | 66 | 30.0% |
| 3-Person Household | 38 | 17.3% |
| 4+ Person Household | 60 | 27.3% |
| Total Housing Units | 220 | 100.0% |
Occupancy by Ownership by Household Size in Harmony
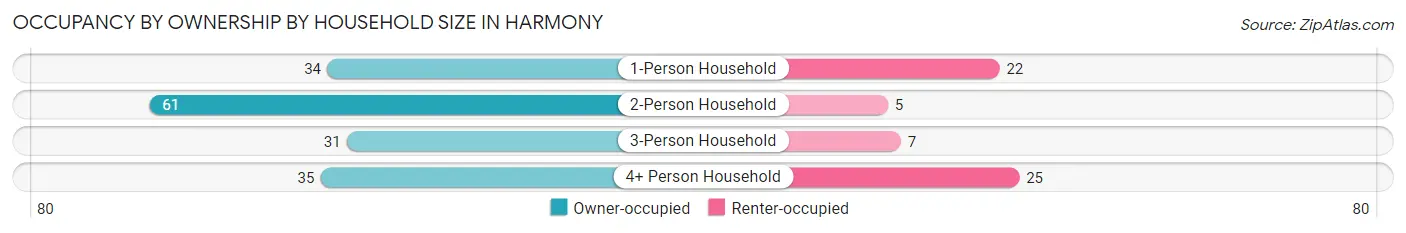
| Household Size | Owner-occupied | Renter-occupied |
| 1-Person Household | 34 (60.7%) | 22 (39.3%) |
| 2-Person Household | 61 (92.4%) | 5 (7.6%) |
| 3-Person Household | 31 (81.6%) | 7 (18.4%) |
| 4+ Person Household | 35 (58.3%) | 25 (41.7%) |
| Total Housing Units | 161 (73.2%) | 59 (26.8%) |
Occupancy by Educational Attainment in Harmony
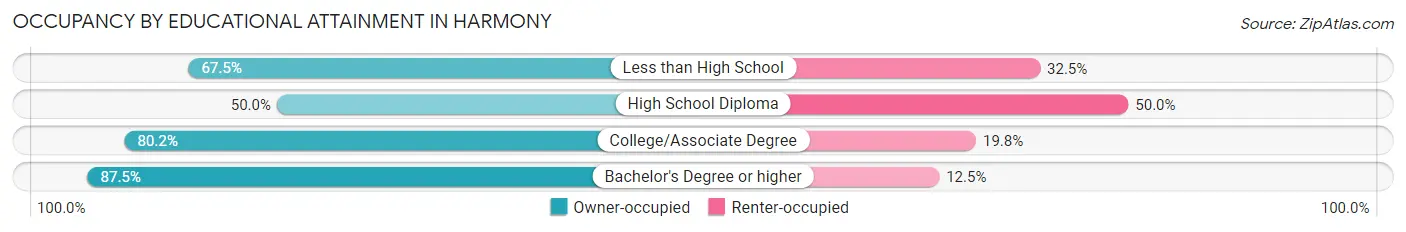
| Household Size | Owner-occupied | Renter-occupied |
| Less than High School | 27 (67.5%) | 13 (32.5%) |
| High School Diploma | 21 (50.0%) | 21 (50.0%) |
| College/Associate Degree | 85 (80.2%) | 21 (19.8%) |
| Bachelor's Degree or higher | 28 (87.5%) | 4 (12.5%) |
Occupancy by Age of Householder in Harmony
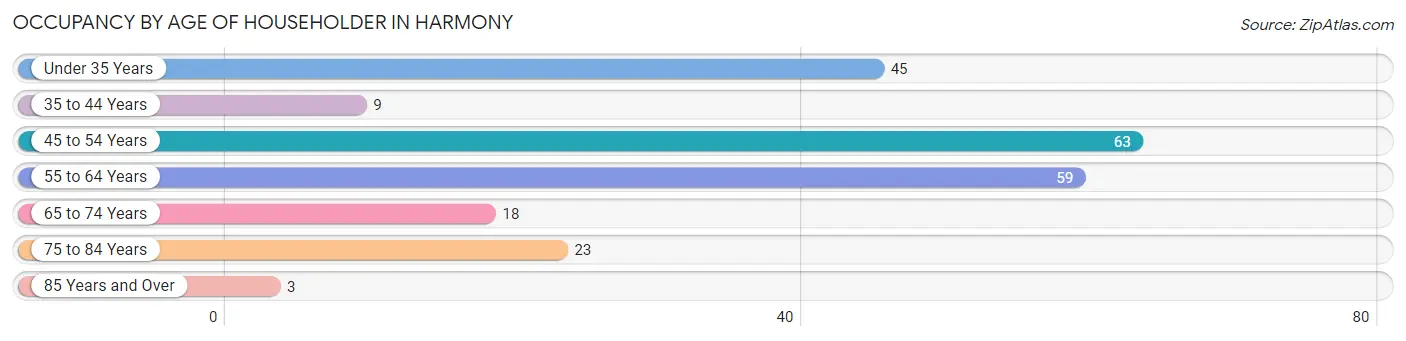
| Age Bracket | # Households | % Households |
| Under 35 Years | 45 | 20.4% |
| 35 to 44 Years | 9 | 4.1% |
| 45 to 54 Years | 63 | 28.6% |
| 55 to 64 Years | 59 | 26.8% |
| 65 to 74 Years | 18 | 8.2% |
| 75 to 84 Years | 23 | 10.4% |
| 85 Years and Over | 3 | 1.4% |
| Total | 220 | 100.0% |
Housing Finances in Harmony
Median Income by Occupancy in Harmony
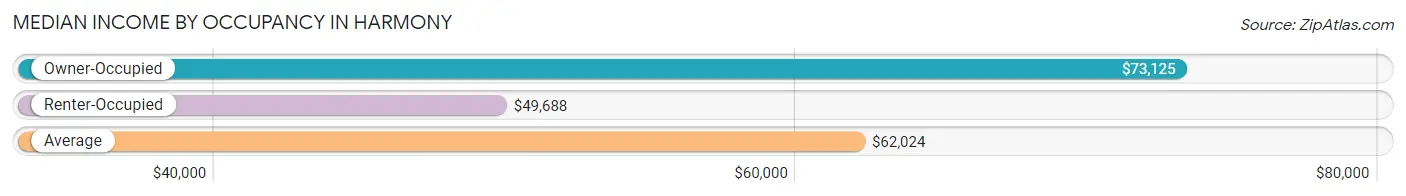
| Occupancy Type | # Households | Median Income |
| Owner-Occupied | 161 (73.2%) | $73,125 |
| Renter-Occupied | 59 (26.8%) | $49,688 |
| Average | 220 (100.0%) | $62,024 |
Occupancy by Householder Income Bracket in Harmony
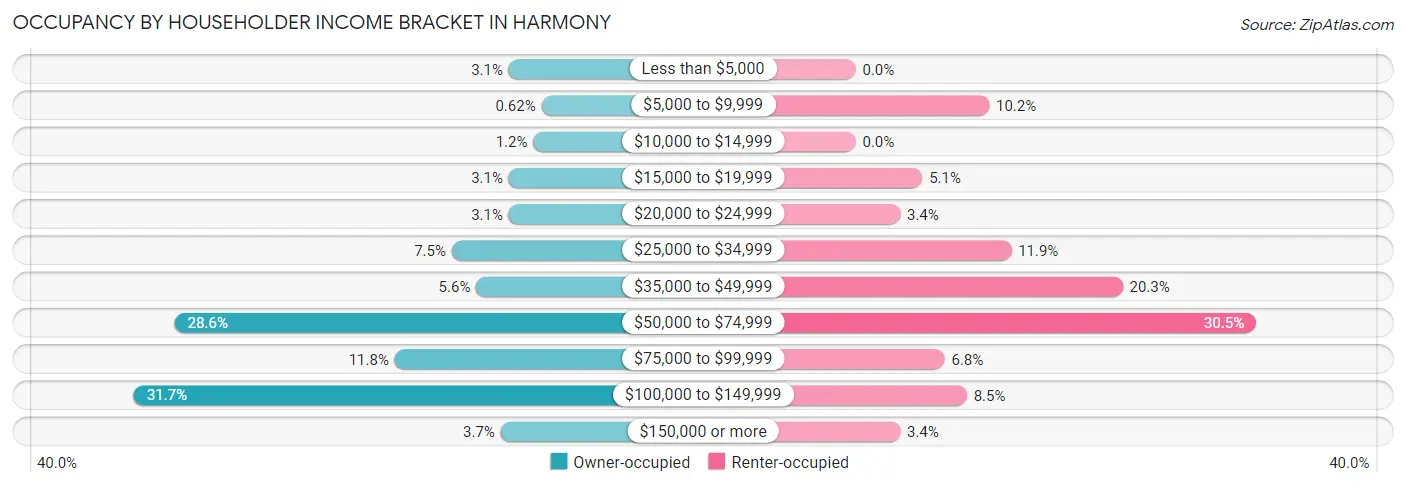
| Income Bracket | Owner-occupied | Renter-occupied |
| Less than $5,000 | 5 (3.1%) | 0 (0.0%) |
| $5,000 to $9,999 | 1 (0.6%) | 6 (10.2%) |
| $10,000 to $14,999 | 2 (1.2%) | 0 (0.0%) |
| $15,000 to $19,999 | 5 (3.1%) | 3 (5.1%) |
| $20,000 to $24,999 | 5 (3.1%) | 2 (3.4%) |
| $25,000 to $34,999 | 12 (7.4%) | 7 (11.9%) |
| $35,000 to $49,999 | 9 (5.6%) | 12 (20.3%) |
| $50,000 to $74,999 | 46 (28.6%) | 18 (30.5%) |
| $75,000 to $99,999 | 19 (11.8%) | 4 (6.8%) |
| $100,000 to $149,999 | 51 (31.7%) | 5 (8.5%) |
| $150,000 or more | 6 (3.7%) | 2 (3.4%) |
| Total | 161 (100.0%) | 59 (100.0%) |
Monthly Housing Cost Tiers in Harmony
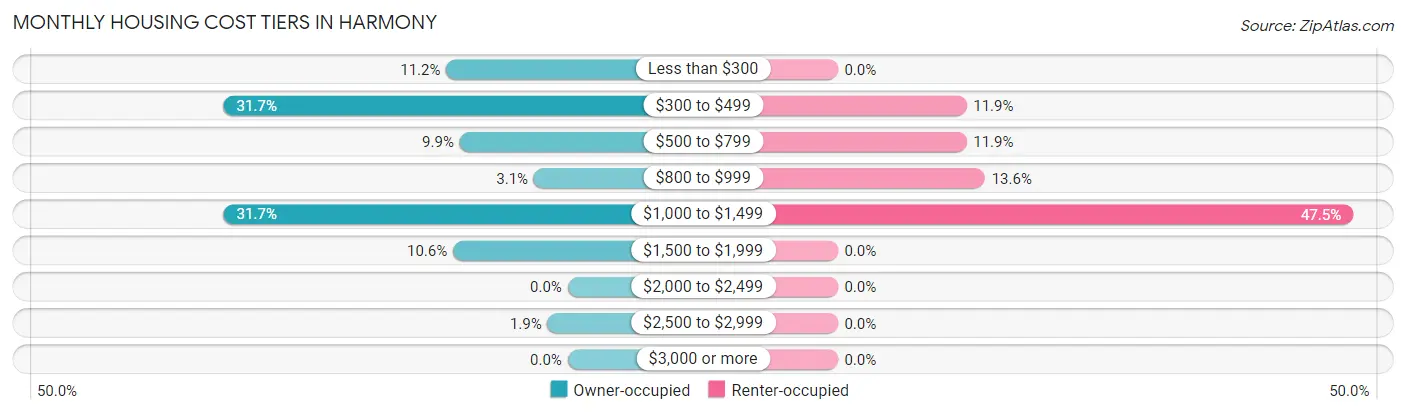
| Monthly Cost | Owner-occupied | Renter-occupied |
| Less than $300 | 18 (11.2%) | 0 (0.0%) |
| $300 to $499 | 51 (31.7%) | 7 (11.9%) |
| $500 to $799 | 16 (9.9%) | 7 (11.9%) |
| $800 to $999 | 5 (3.1%) | 8 (13.6%) |
| $1,000 to $1,499 | 51 (31.7%) | 28 (47.5%) |
| $1,500 to $1,999 | 17 (10.6%) | 0 (0.0%) |
| $2,000 to $2,499 | 0 (0.0%) | 0 (0.0%) |
| $2,500 to $2,999 | 3 (1.9%) | 0 (0.0%) |
| $3,000 or more | 0 (0.0%) | 0 (0.0%) |
| Total | 161 (100.0%) | 59 (100.0%) |
Physical Housing Characteristics in Harmony
Housing Structures in Harmony
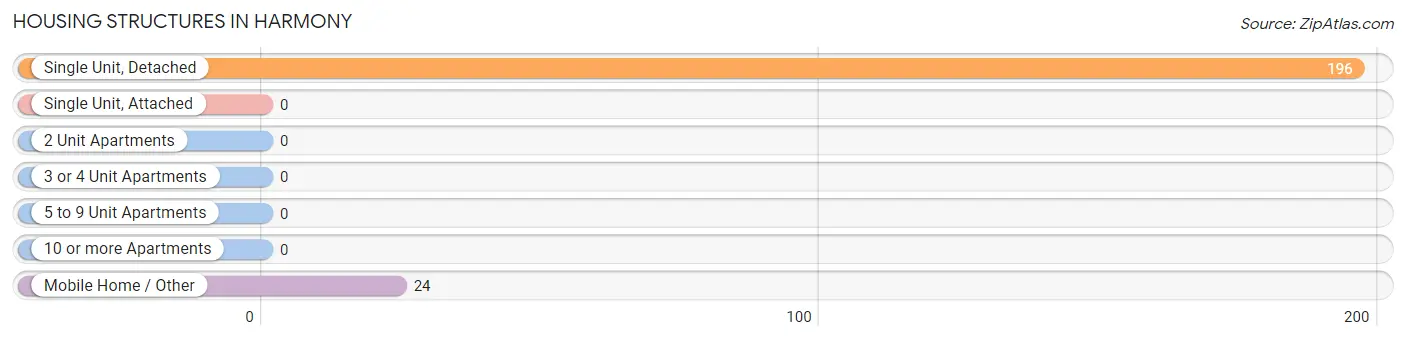
| Structure Type | # Housing Units | % Housing Units |
| Single Unit, Detached | 196 | 89.1% |
| Single Unit, Attached | 0 | 0.0% |
| 2 Unit Apartments | 0 | 0.0% |
| 3 or 4 Unit Apartments | 0 | 0.0% |
| 5 to 9 Unit Apartments | 0 | 0.0% |
| 10 or more Apartments | 0 | 0.0% |
| Mobile Home / Other | 24 | 10.9% |
| Total | 220 | 100.0% |
Housing Structures by Occupancy in Harmony
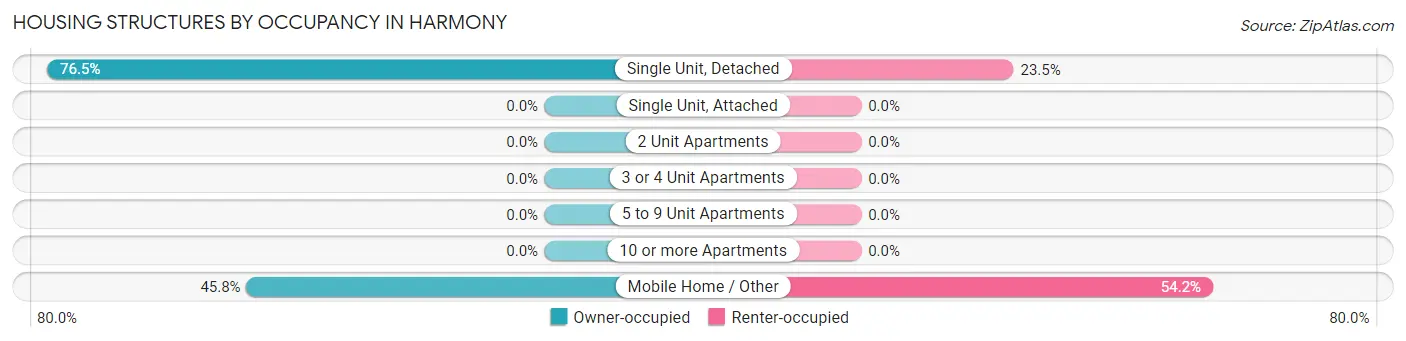
| Structure Type | Owner-occupied | Renter-occupied |
| Single Unit, Detached | 150 (76.5%) | 46 (23.5%) |
| Single Unit, Attached | 0 (0.0%) | 0 (0.0%) |
| 2 Unit Apartments | 0 (0.0%) | 0 (0.0%) |
| 3 or 4 Unit Apartments | 0 (0.0%) | 0 (0.0%) |
| 5 to 9 Unit Apartments | 0 (0.0%) | 0 (0.0%) |
| 10 or more Apartments | 0 (0.0%) | 0 (0.0%) |
| Mobile Home / Other | 11 (45.8%) | 13 (54.2%) |
| Total | 161 (73.2%) | 59 (26.8%) |
Housing Structures by Number of Rooms in Harmony
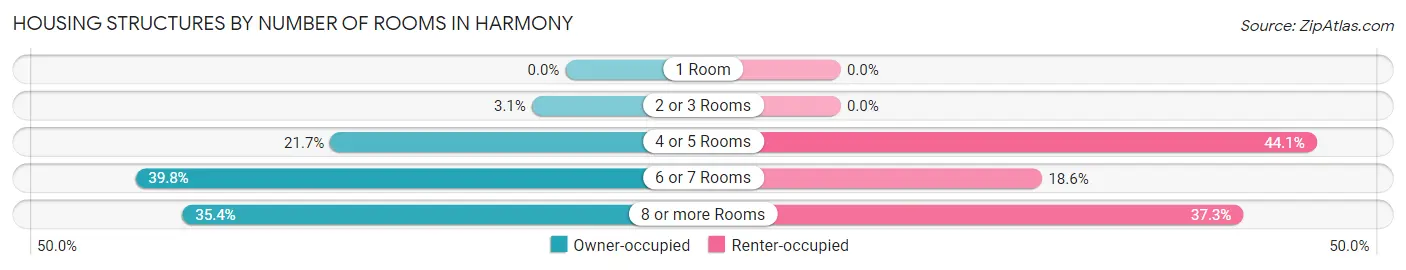
| Number of Rooms | Owner-occupied | Renter-occupied |
| 1 Room | 0 (0.0%) | 0 (0.0%) |
| 2 or 3 Rooms | 5 (3.1%) | 0 (0.0%) |
| 4 or 5 Rooms | 35 (21.7%) | 26 (44.1%) |
| 6 or 7 Rooms | 64 (39.8%) | 11 (18.6%) |
| 8 or more Rooms | 57 (35.4%) | 22 (37.3%) |
| Total | 161 (100.0%) | 59 (100.0%) |
Housing Structure by Heating Type in Harmony
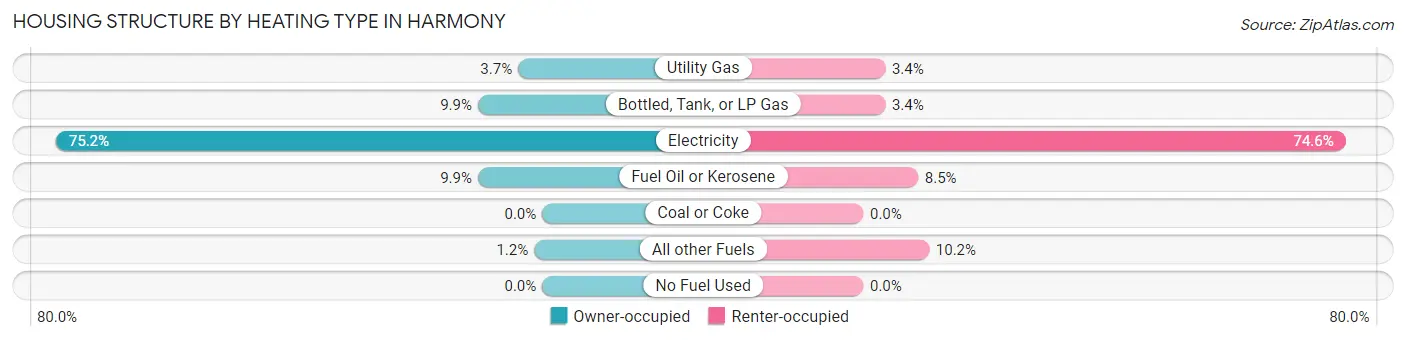
| Heating Type | Owner-occupied | Renter-occupied |
| Utility Gas | 6 (3.7%) | 2 (3.4%) |
| Bottled, Tank, or LP Gas | 16 (9.9%) | 2 (3.4%) |
| Electricity | 121 (75.2%) | 44 (74.6%) |
| Fuel Oil or Kerosene | 16 (9.9%) | 5 (8.5%) |
| Coal or Coke | 0 (0.0%) | 0 (0.0%) |
| All other Fuels | 2 (1.2%) | 6 (10.2%) |
| No Fuel Used | 0 (0.0%) | 0 (0.0%) |
| Total | 161 (100.0%) | 59 (100.0%) |
Household Vehicle Usage in Harmony
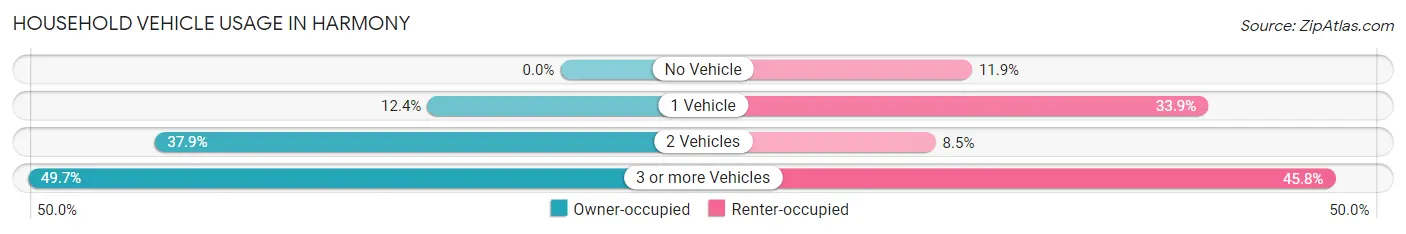
| Vehicles per Household | Owner-occupied | Renter-occupied |
| No Vehicle | 0 (0.0%) | 7 (11.9%) |
| 1 Vehicle | 20 (12.4%) | 20 (33.9%) |
| 2 Vehicles | 61 (37.9%) | 5 (8.5%) |
| 3 or more Vehicles | 80 (49.7%) | 27 (45.8%) |
| Total | 161 (100.0%) | 59 (100.0%) |
Real Estate & Mortgages in Harmony
Real Estate and Mortgage Overview in Harmony
| Characteristic | Without Mortgage | With Mortgage |
| Housing Units | 63 | 98 |
| Median Property Value | $92,100 | $147,500 |
| Median Household Income | $65,972 | $6 |
| Monthly Housing Costs | $370 | $0 |
| Real Estate Taxes | $747 | $0 |
Property Value by Mortgage Status in Harmony
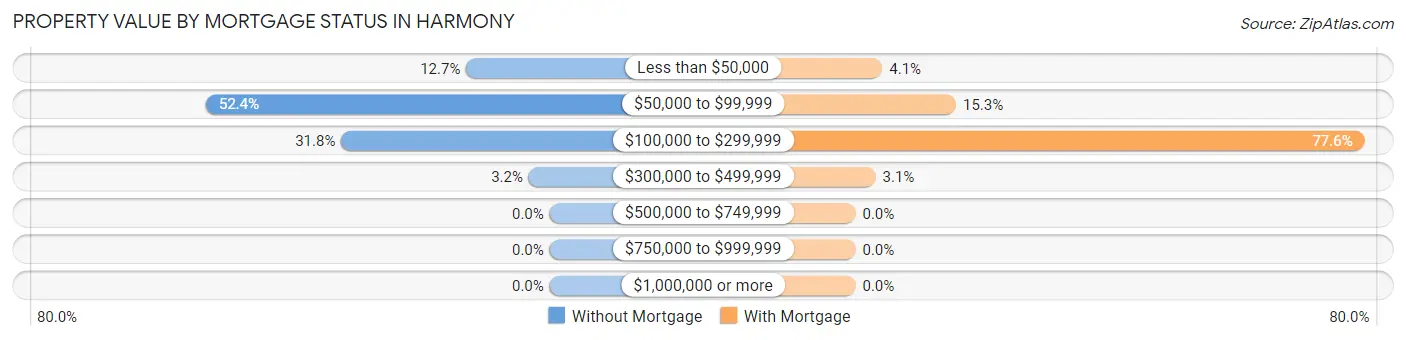
| Property Value | Without Mortgage | With Mortgage |
| Less than $50,000 | 8 (12.7%) | 4 (4.1%) |
| $50,000 to $99,999 | 33 (52.4%) | 15 (15.3%) |
| $100,000 to $299,999 | 20 (31.8%) | 76 (77.5%) |
| $300,000 to $499,999 | 2 (3.2%) | 3 (3.1%) |
| $500,000 to $749,999 | 0 (0.0%) | 0 (0.0%) |
| $750,000 to $999,999 | 0 (0.0%) | 0 (0.0%) |
| $1,000,000 or more | 0 (0.0%) | 0 (0.0%) |
| Total | 63 (100.0%) | 98 (100.0%) |
Household Income by Mortgage Status in Harmony
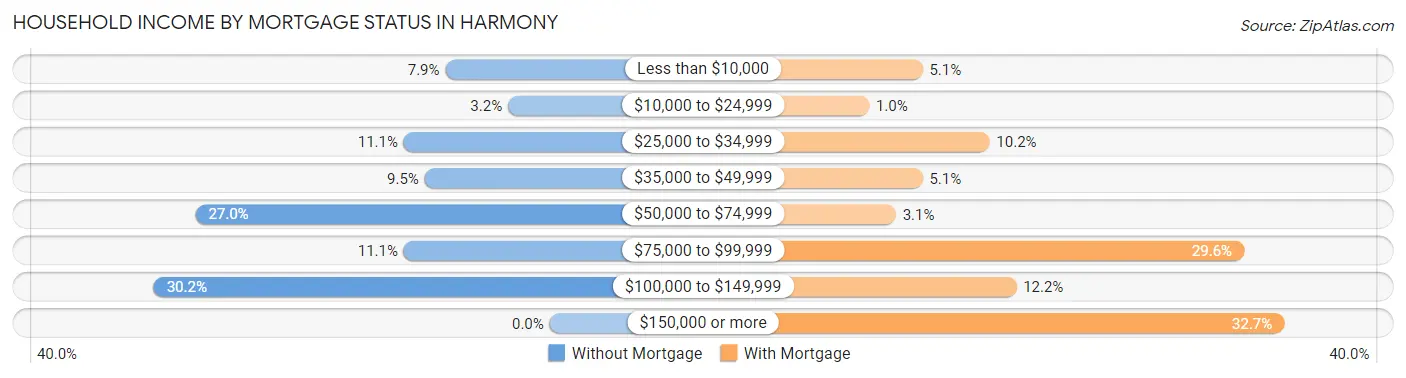
| Household Income | Without Mortgage | With Mortgage |
| Less than $10,000 | 5 (7.9%) | 5 (5.1%) |
| $10,000 to $24,999 | 2 (3.2%) | 1 (1.0%) |
| $25,000 to $34,999 | 7 (11.1%) | 10 (10.2%) |
| $35,000 to $49,999 | 6 (9.5%) | 5 (5.1%) |
| $50,000 to $74,999 | 17 (27.0%) | 3 (3.1%) |
| $75,000 to $99,999 | 7 (11.1%) | 29 (29.6%) |
| $100,000 to $149,999 | 19 (30.2%) | 12 (12.2%) |
| $150,000 or more | 0 (0.0%) | 32 (32.7%) |
| Total | 63 (100.0%) | 98 (100.0%) |
Property Value to Household Income Ratio in Harmony
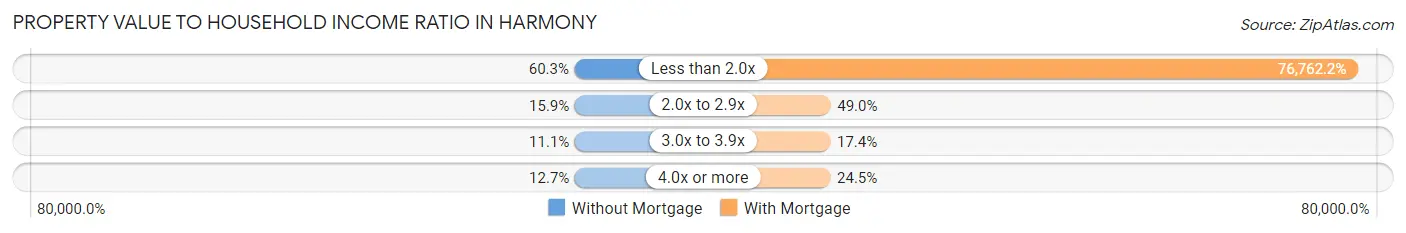
| Value-to-Income Ratio | Without Mortgage | With Mortgage |
| Less than 2.0x | 38 (60.3%) | 75,227 (76,762.2%) |
| 2.0x to 2.9x | 10 (15.9%) | 48 (49.0%) |
| 3.0x to 3.9x | 7 (11.1%) | 17 (17.3%) |
| 4.0x or more | 8 (12.7%) | 24 (24.5%) |
| Total | 63 (100.0%) | 98 (100.0%) |
Real Estate Taxes by Mortgage Status in Harmony
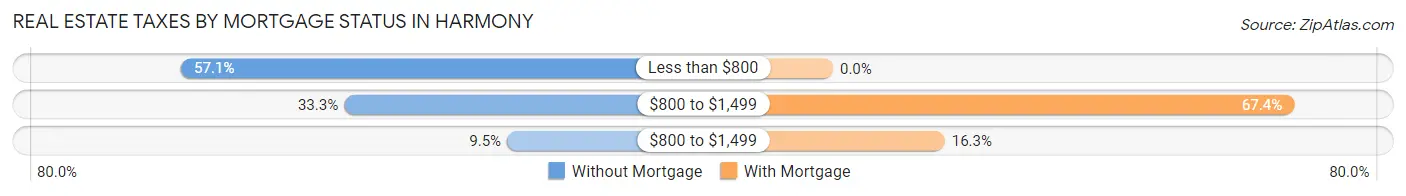
| Property Taxes | Without Mortgage | With Mortgage |
| Less than $800 | 36 (57.1%) | 0 (0.0%) |
| $800 to $1,499 | 21 (33.3%) | 66 (67.3%) |
| $800 to $1,499 | 6 (9.5%) | 16 (16.3%) |
| Total | 63 (100.0%) | 98 (100.0%) |
Health & Disability in Harmony
Health Insurance Coverage by Age in Harmony
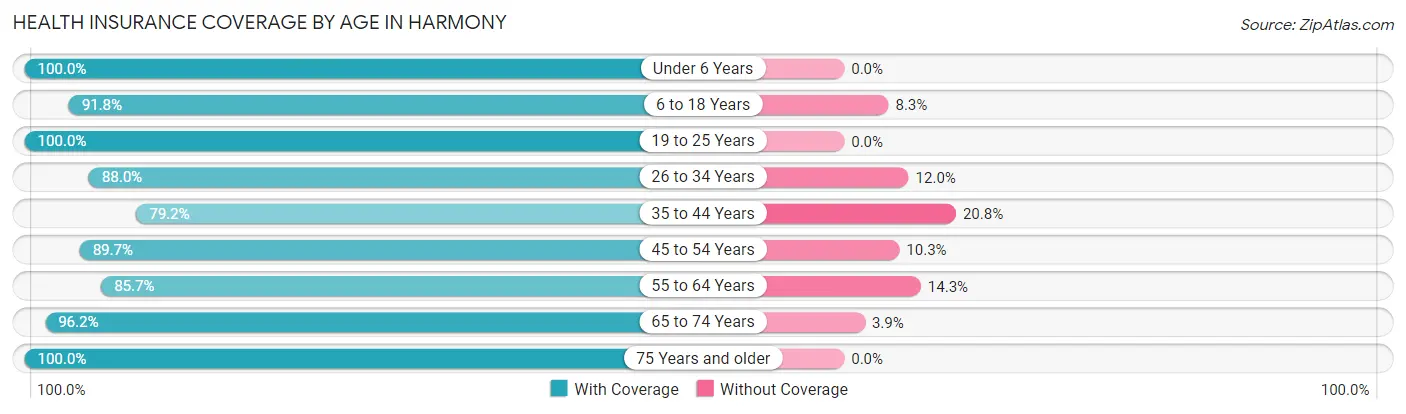
| Age Bracket | With Coverage | Without Coverage |
| Under 6 Years | 34 (100.0%) | 0 (0.0%) |
| 6 to 18 Years | 89 (91.7%) | 8 (8.3%) |
| 19 to 25 Years | 66 (100.0%) | 0 (0.0%) |
| 26 to 34 Years | 66 (88.0%) | 9 (12.0%) |
| 35 to 44 Years | 38 (79.2%) | 10 (20.8%) |
| 45 to 54 Years | 96 (89.7%) | 11 (10.3%) |
| 55 to 64 Years | 84 (85.7%) | 14 (14.3%) |
| 65 to 74 Years | 25 (96.2%) | 1 (3.8%) |
| 75 Years and older | 33 (100.0%) | 0 (0.0%) |
| Total | 531 (90.9%) | 53 (9.1%) |
Health Insurance Coverage by Citizenship Status in Harmony
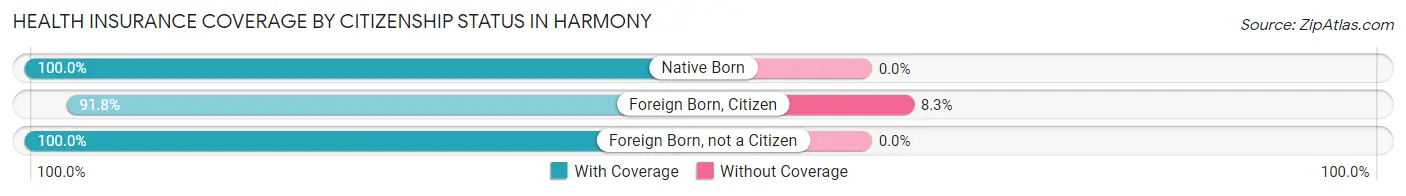
| Citizenship Status | With Coverage | Without Coverage |
| Native Born | 34 (100.0%) | 0 (0.0%) |
| Foreign Born, Citizen | 89 (91.7%) | 8 (8.3%) |
| Foreign Born, not a Citizen | 66 (100.0%) | 0 (0.0%) |
Health Insurance Coverage by Household Income in Harmony
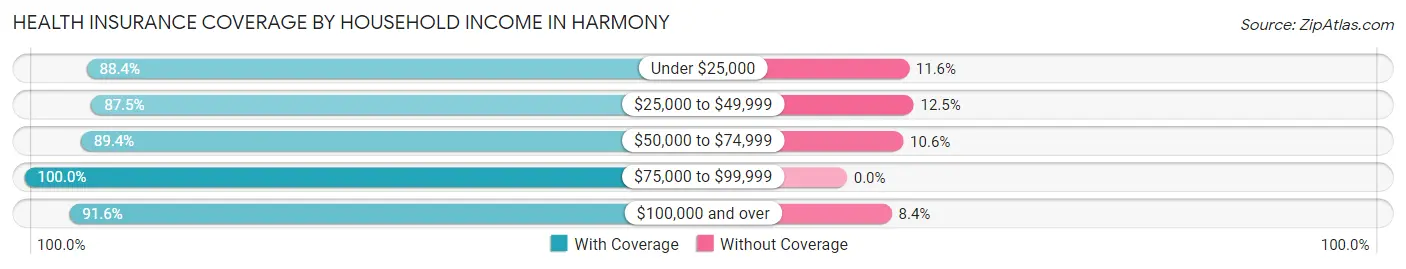
| Household Income | With Coverage | Without Coverage |
| Under $25,000 | 38 (88.4%) | 5 (11.6%) |
| $25,000 to $49,999 | 84 (87.5%) | 12 (12.5%) |
| $50,000 to $74,999 | 127 (89.4%) | 15 (10.6%) |
| $75,000 to $99,999 | 53 (100.0%) | 0 (0.0%) |
| $100,000 and over | 229 (91.6%) | 21 (8.4%) |
Public vs Private Health Insurance Coverage by Age in Harmony
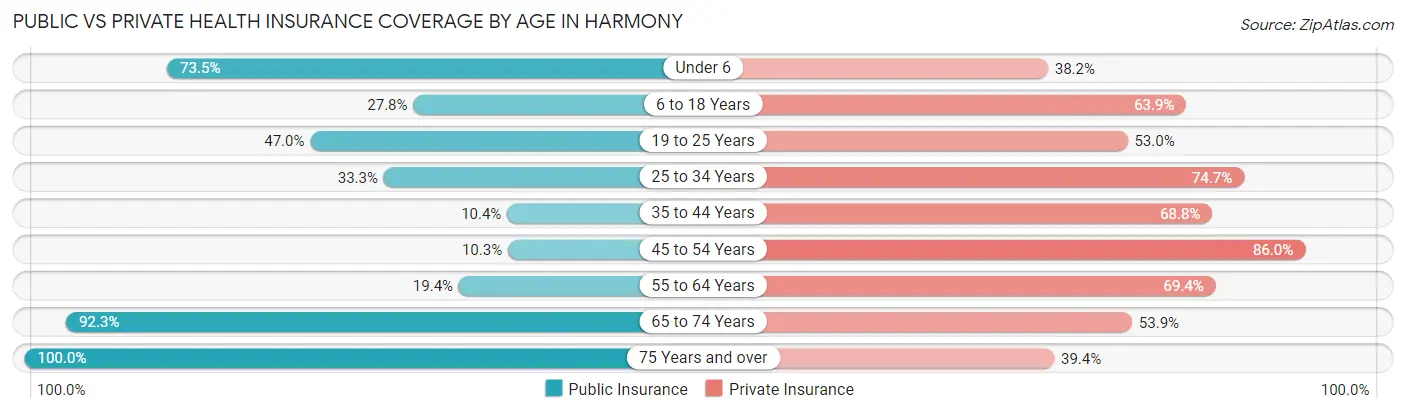
| Age Bracket | Public Insurance | Private Insurance |
| Under 6 | 25 (73.5%) | 13 (38.2%) |
| 6 to 18 Years | 27 (27.8%) | 62 (63.9%) |
| 19 to 25 Years | 31 (47.0%) | 35 (53.0%) |
| 25 to 34 Years | 25 (33.3%) | 56 (74.7%) |
| 35 to 44 Years | 5 (10.4%) | 33 (68.8%) |
| 45 to 54 Years | 11 (10.3%) | 92 (86.0%) |
| 55 to 64 Years | 19 (19.4%) | 68 (69.4%) |
| 65 to 74 Years | 24 (92.3%) | 14 (53.8%) |
| 75 Years and over | 33 (100.0%) | 13 (39.4%) |
| Total | 200 (34.3%) | 386 (66.1%) |
Disability Status by Sex by Age in Harmony
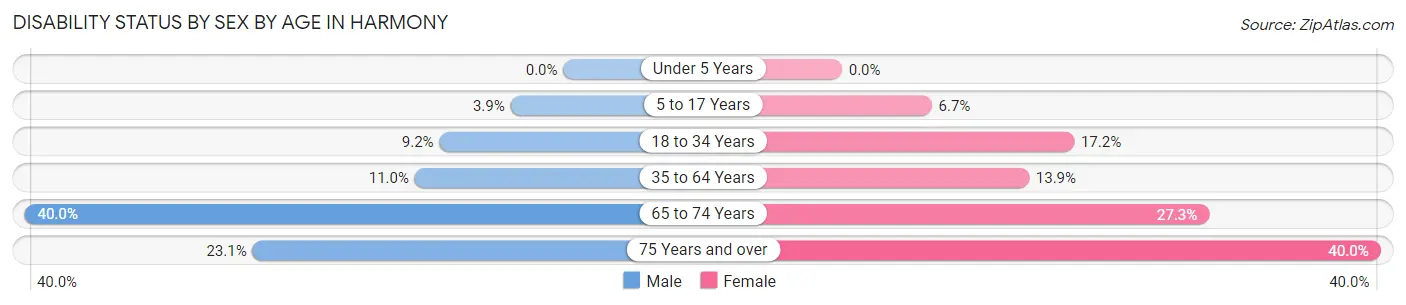
| Age Bracket | Male | Female |
| Under 5 Years | 0 (0.0%) | 0 (0.0%) |
| 5 to 17 Years | 2 (3.9%) | 3 (6.7%) |
| 18 to 34 Years | 8 (9.2%) | 10 (17.2%) |
| 35 to 64 Years | 16 (11.0%) | 15 (13.9%) |
| 65 to 74 Years | 6 (40.0%) | 3 (27.3%) |
| 75 Years and over | 3 (23.1%) | 8 (40.0%) |
Disability Class by Sex by Age in Harmony
Disability Class: Hearing Difficulty
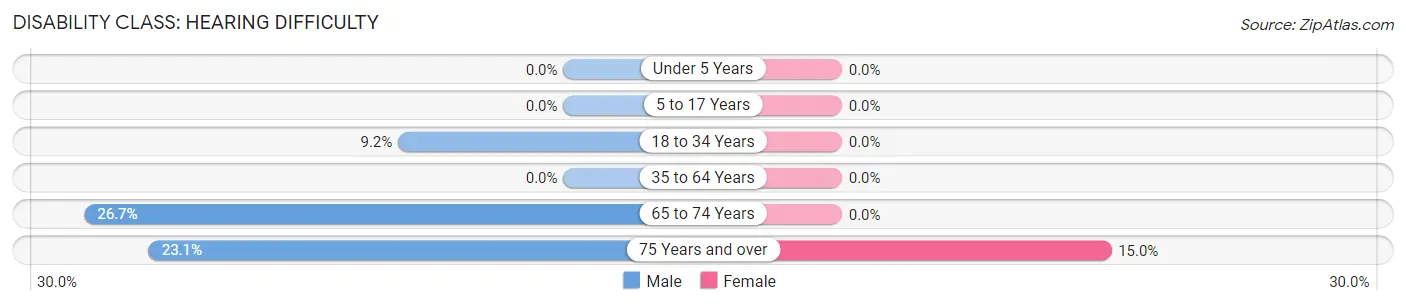
| Age Bracket | Male | Female |
| Under 5 Years | 0 (0.0%) | 0 (0.0%) |
| 5 to 17 Years | 0 (0.0%) | 0 (0.0%) |
| 18 to 34 Years | 8 (9.2%) | 0 (0.0%) |
| 35 to 64 Years | 0 (0.0%) | 0 (0.0%) |
| 65 to 74 Years | 4 (26.7%) | 0 (0.0%) |
| 75 Years and over | 3 (23.1%) | 3 (15.0%) |
Disability Class: Vision Difficulty
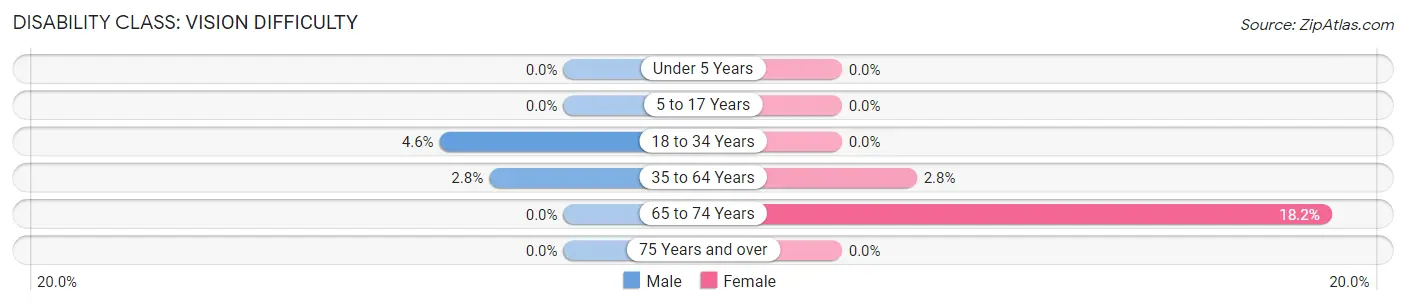
| Age Bracket | Male | Female |
| Under 5 Years | 0 (0.0%) | 0 (0.0%) |
| 5 to 17 Years | 0 (0.0%) | 0 (0.0%) |
| 18 to 34 Years | 4 (4.6%) | 0 (0.0%) |
| 35 to 64 Years | 4 (2.8%) | 3 (2.8%) |
| 65 to 74 Years | 0 (0.0%) | 2 (18.2%) |
| 75 Years and over | 0 (0.0%) | 0 (0.0%) |
Disability Class: Cognitive Difficulty
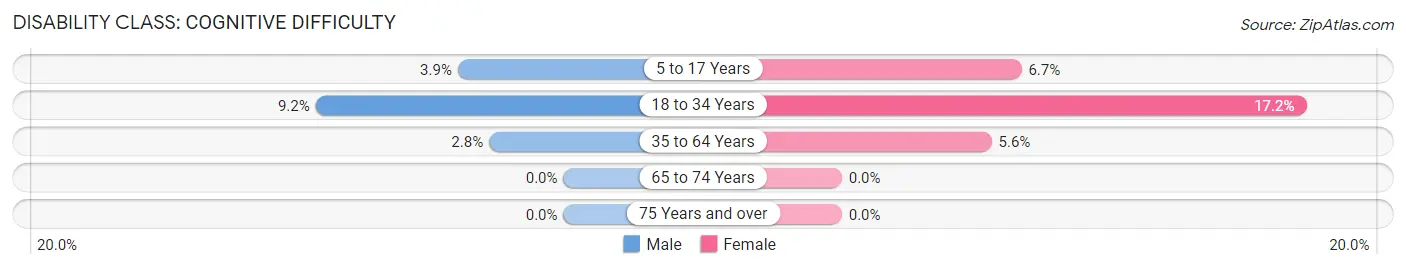
| Age Bracket | Male | Female |
| 5 to 17 Years | 2 (3.9%) | 3 (6.7%) |
| 18 to 34 Years | 8 (9.2%) | 10 (17.2%) |
| 35 to 64 Years | 4 (2.8%) | 6 (5.6%) |
| 65 to 74 Years | 0 (0.0%) | 0 (0.0%) |
| 75 Years and over | 0 (0.0%) | 0 (0.0%) |
Disability Class: Ambulatory Difficulty
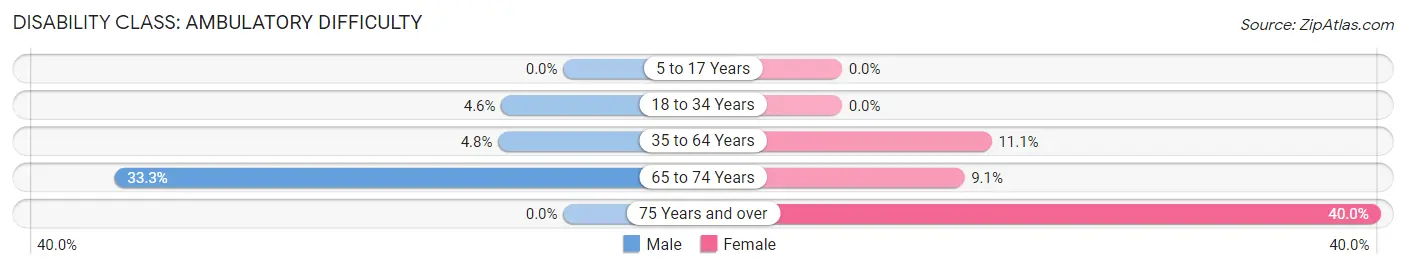
| Age Bracket | Male | Female |
| 5 to 17 Years | 0 (0.0%) | 0 (0.0%) |
| 18 to 34 Years | 4 (4.6%) | 0 (0.0%) |
| 35 to 64 Years | 7 (4.8%) | 12 (11.1%) |
| 65 to 74 Years | 5 (33.3%) | 1 (9.1%) |
| 75 Years and over | 0 (0.0%) | 8 (40.0%) |
Disability Class: Self-Care Difficulty
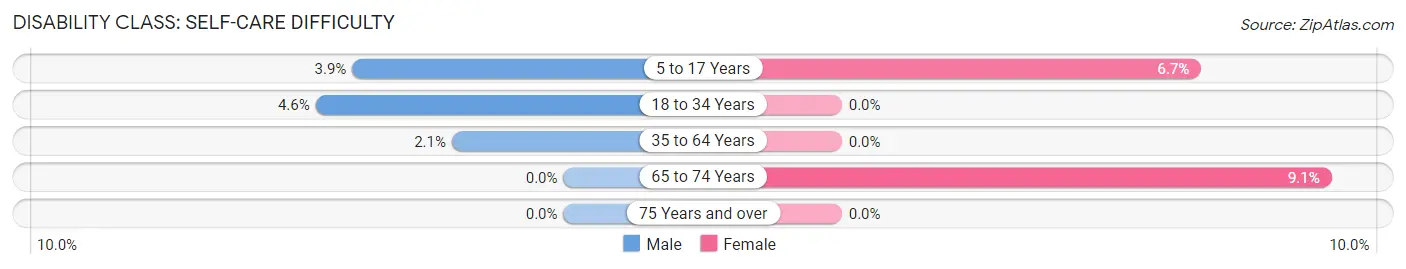
| Age Bracket | Male | Female |
| 5 to 17 Years | 2 (3.9%) | 3 (6.7%) |
| 18 to 34 Years | 4 (4.6%) | 0 (0.0%) |
| 35 to 64 Years | 3 (2.1%) | 0 (0.0%) |
| 65 to 74 Years | 0 (0.0%) | 1 (9.1%) |
| 75 Years and over | 0 (0.0%) | 0 (0.0%) |
Technology Access in Harmony
Computing Device Access in Harmony
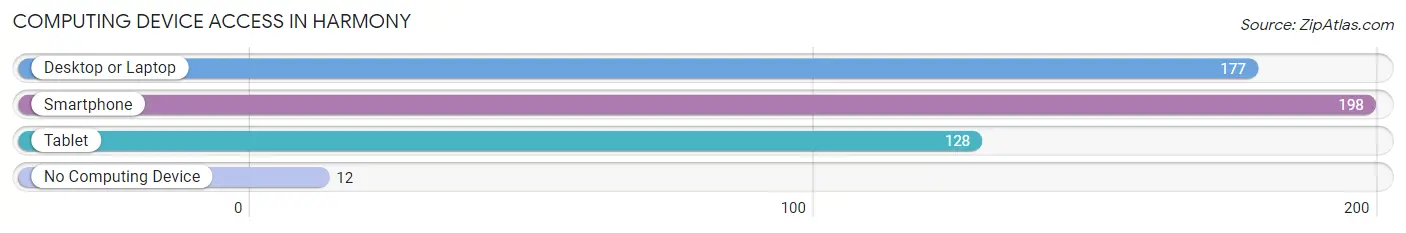
| Device Type | # Households | % Households |
| Desktop or Laptop | 177 | 80.4% |
| Smartphone | 198 | 90.0% |
| Tablet | 128 | 58.2% |
| No Computing Device | 12 | 5.4% |
| Total | 220 | 100.0% |
Internet Access in Harmony
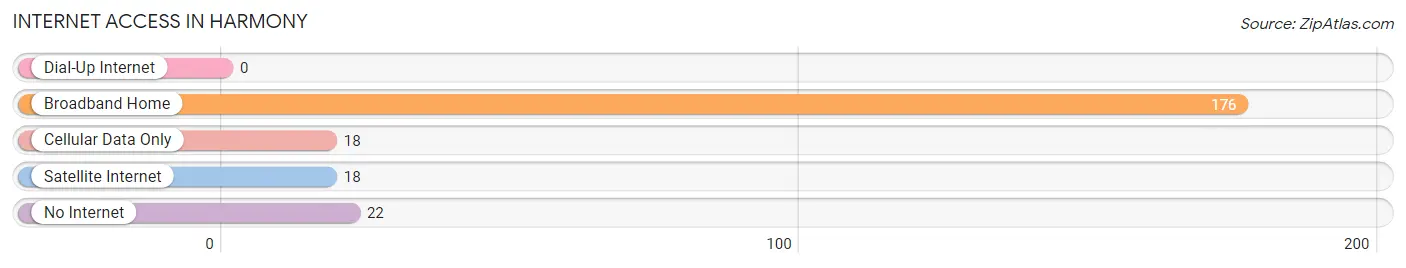
| Internet Type | # Households | % Households |
| Dial-Up Internet | 0 | 0.0% |
| Broadband Home | 176 | 80.0% |
| Cellular Data Only | 18 | 8.2% |
| Satellite Internet | 18 | 8.2% |
| No Internet | 22 | 10.0% |
| Total | 220 | 100.0% |
Harmony Summary
Harmony is a small town located in Iredell County, North Carolina. It is situated in the foothills of the Blue Ridge Mountains, approximately 25 miles north of Charlotte. The town was founded in 1851 and has a population of approximately 1,500 people.
Geography
Harmony is located in the foothills of the Blue Ridge Mountains, approximately 25 miles north of Charlotte. The town is situated on the banks of the Catawba River, which provides a scenic backdrop for the town. The town is surrounded by rolling hills and lush forests, making it a popular destination for outdoor activities such as hiking, camping, and fishing.
Economy
Harmony’s economy is largely based on agriculture and tourism. The town is home to several farms, which produce a variety of crops such as corn, soybeans, and tobacco. The town also has a thriving tourism industry, with many visitors coming to enjoy the town’s natural beauty and outdoor activities.
Demographics
Harmony is a predominantly white town, with approximately 90% of the population being Caucasian. The remaining 10% of the population is made up of African Americans, Hispanics, and other ethnicities. The median household income in Harmony is approximately $45,000, and the median home value is approximately $150,000.
History
Harmony was founded in 1851 by a group of settlers from Pennsylvania. The town was named after the Harmony Society, a religious group that had settled in the area in the early 1800s. The town quickly grew and prospered, becoming a center for trade and commerce. In the late 1800s, Harmony was a popular destination for tourists, who came to enjoy the town’s natural beauty and outdoor activities.
In the early 1900s, Harmony experienced a period of decline as the railroad bypassed the town and the local economy shifted away from agriculture. However, in the late 20th century, the town experienced a resurgence as tourism and outdoor recreation became popular again. Today, Harmony is a popular destination for visitors looking to enjoy the town’s natural beauty and outdoor activities.
Common Questions
What is Per Capita Income in Harmony?
Per Capita income in Harmony is $28,357.
What is the Median Family Income in Harmony?
Median Family Income in Harmony is $75,192.
What is the Median Household income in Harmony?
Median Household Income in Harmony is $62,024.
What is Income or Wage Gap in Harmony?
Income or Wage Gap in Harmony is 38.5%.
Women in Harmony earn 61.5 cents for every dollar earned by a man.
What is Inequality or Gini Index in Harmony?
Inequality or Gini Index in Harmony is 0.34.
What is the Total Population of Harmony?
Total Population of Harmony is 584.
What is the Total Male Population of Harmony?
Total Male Population of Harmony is 339.
What is the Total Female Population of Harmony?
Total Female Population of Harmony is 245.
What is the Ratio of Males per 100 Females in Harmony?
There are 138.37 Males per 100 Females in Harmony.
What is the Ratio of Females per 100 Males in Harmony?
There are 72.27 Females per 100 Males in Harmony.
What is the Median Population Age in Harmony?
Median Population Age in Harmony is 41.5 Years.
What is the Average Family Size in Harmony
Average Family Size in Harmony is 3.2 People.
What is the Average Household Size in Harmony
Average Household Size in Harmony is 2.6 People.
How Large is the Labor Force in Harmony?
There are 325 People in the Labor Forcein in Harmony.
What is the Percentage of People in the Labor Force in Harmony?
68.1% of People are in the Labor Force in Harmony.
What is the Unemployment Rate in Harmony?
Unemployment Rate in Harmony is 2.2%.