Buxton, NC Map & Demographics
Buxton Map
Buxton Overview
$38,916
PER CAPITA INCOME
$103,179
AVG FAMILY INCOME
$87,344
AVG HOUSEHOLD INCOME
14.5%
WAGE / INCOME GAP [ % ]
85.5¢/ $1
WAGE / INCOME GAP [ $ ]
0.34
INEQUALITY / GINI INDEX
1,477
TOTAL POPULATION
774
MALE POPULATION
703
FEMALE POPULATION
110.10
MALES / 100 FEMALES
90.83
FEMALES / 100 MALES
46.5
MEDIAN AGE
2.7
AVG FAMILY SIZE
2.5
AVG HOUSEHOLD SIZE
907
LABOR FORCE [ PEOPLE ]
70.5%
PERCENT IN LABOR FORCE
3.0%
UNEMPLOYMENT RATE
Buxton Zip Codes
Buxton Area Codes
Income in Buxton
Income Overview in Buxton
Per Capita Income in Buxton is $38,916, while median incomes of families and households are $103,179 and $87,344 respectively.
| Characteristic | Number | Measure |
| Per Capita Income | 1,477 | $38,916 |
| Median Family Income | 475 | $103,179 |
| Mean Family Income | 475 | $102,487 |
| Median Household Income | 588 | $87,344 |
| Mean Household Income | 588 | $95,236 |
| Income Deficit | 475 | $0 |
| Wage / Income Gap (%) | 1,477 | 14.53% |
| Wage / Income Gap ($) | 1,477 | 85.47¢ per $1 |
| Gini / Inequality Index | 1,477 | 0.34 |
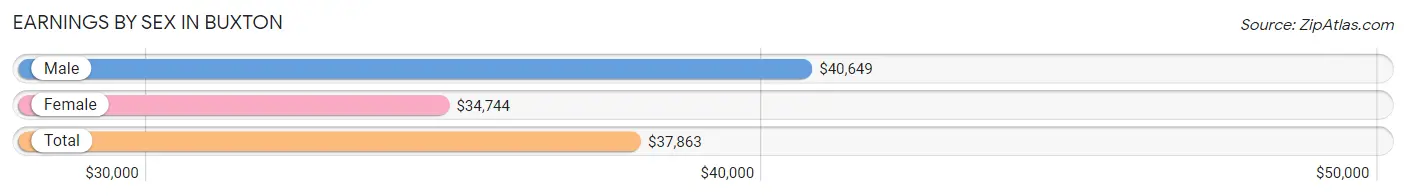
Earnings by Sex in Buxton
Average Earnings in Buxton are $37,863, $40,649 for men and $34,744 for women, a difference of 14.5%.
| Sex | Number | Average Earnings |
| Male | 519 (54.3%) | $40,649 |
| Female | 437 (45.7%) | $34,744 |
| Total | 956 (100.0%) | $37,863 |
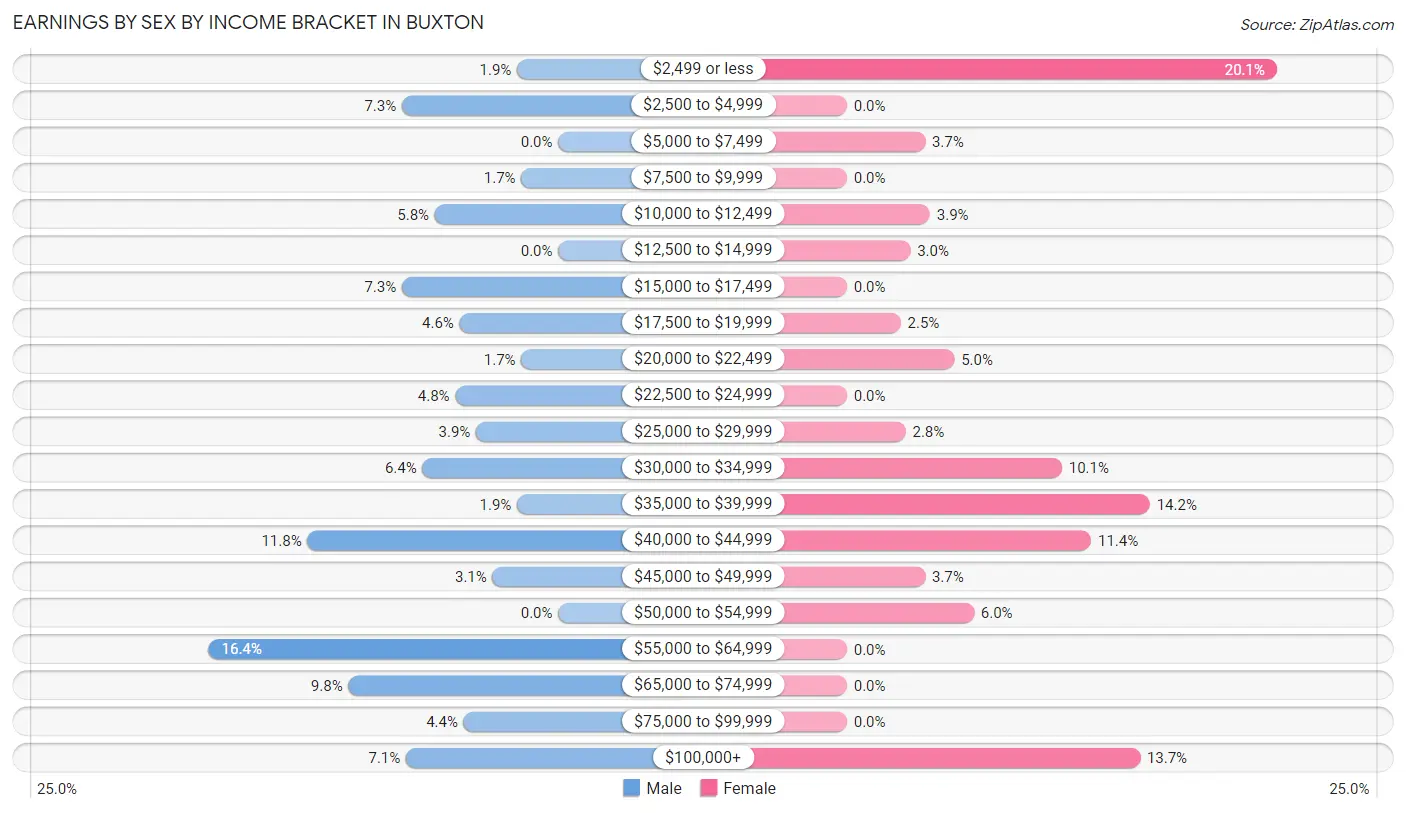
Earnings by Sex by Income Bracket in Buxton
The most common earnings brackets in Buxton are $55,000 to $64,999 for men (85 | 16.4%) and $2,499 or less for women (88 | 20.1%).
| Income | Male | Female |
| $2,499 or less | 10 (1.9%) | 88 (20.1%) |
| $2,500 to $4,999 | 38 (7.3%) | 0 (0.0%) |
| $5,000 to $7,499 | 0 (0.0%) | 16 (3.7%) |
| $7,500 to $9,999 | 9 (1.7%) | 0 (0.0%) |
| $10,000 to $12,499 | 30 (5.8%) | 17 (3.9%) |
| $12,500 to $14,999 | 0 (0.0%) | 13 (3.0%) |
| $15,000 to $17,499 | 38 (7.3%) | 0 (0.0%) |
| $17,500 to $19,999 | 24 (4.6%) | 11 (2.5%) |
| $20,000 to $22,499 | 9 (1.7%) | 22 (5.0%) |
| $22,500 to $24,999 | 25 (4.8%) | 0 (0.0%) |
| $25,000 to $29,999 | 20 (3.8%) | 12 (2.8%) |
| $30,000 to $34,999 | 33 (6.4%) | 44 (10.1%) |
| $35,000 to $39,999 | 10 (1.9%) | 62 (14.2%) |
| $40,000 to $44,999 | 61 (11.7%) | 50 (11.4%) |
| $45,000 to $49,999 | 16 (3.1%) | 16 (3.7%) |
| $50,000 to $54,999 | 0 (0.0%) | 26 (5.9%) |
| $55,000 to $64,999 | 85 (16.4%) | 0 (0.0%) |
| $65,000 to $74,999 | 51 (9.8%) | 0 (0.0%) |
| $75,000 to $99,999 | 23 (4.4%) | 0 (0.0%) |
| $100,000+ | 37 (7.1%) | 60 (13.7%) |
| Total | 519 (100.0%) | 437 (100.0%) |
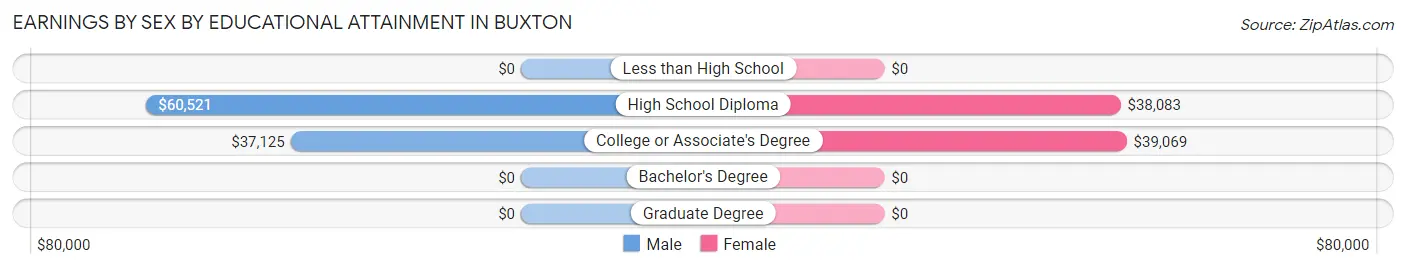
Earnings by Sex by Educational Attainment in Buxton
Average earnings in Buxton are $57,981 for men and $38,831 for women, a difference of 33.0%. Men with an educational attainment of high school diploma enjoy the highest average annual earnings of $60,521, while those with college or associate's degree education earn the least with $37,125. Women with an educational attainment of college or associate's degree earn the most with the average annual earnings of $39,069, while those with high school diploma education have the smallest earnings of $38,083.
| Educational Attainment | Male Income | Female Income |
| Less than High School | - | - |
| High School Diploma | $60,521 | $38,083 |
| College or Associate's Degree | $37,125 | $39,069 |
| Bachelor's Degree | - | - |
| Graduate Degree | - | - |
| Total | $57,981 | $38,831 |
Family Income in Buxton
Family Income Brackets in Buxton
According to the Buxton family income data, there are 132 families falling into the $100,000 to $149,999 income range, which is the most common income bracket and makes up 27.8% of all families.
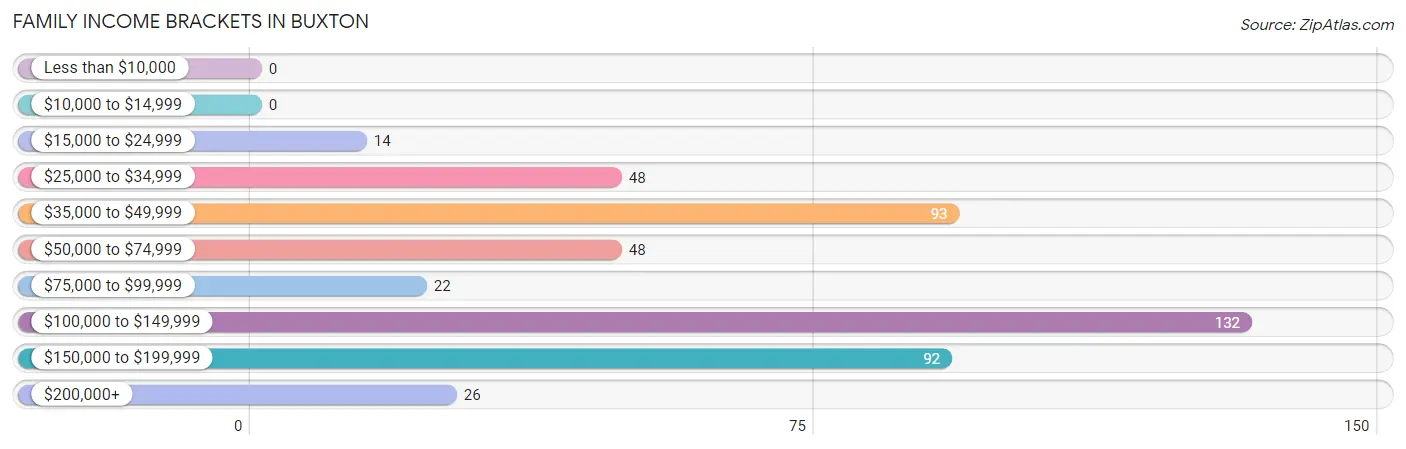
| Income Bracket | # Families | % Families |
| Less than $10,000 | 0 | 0.0% |
| $10,000 to $14,999 | 0 | 0.0% |
| $15,000 to $24,999 | 14 | 2.9% |
| $25,000 to $34,999 | 48 | 10.1% |
| $35,000 to $49,999 | 93 | 19.6% |
| $50,000 to $74,999 | 48 | 10.1% |
| $75,000 to $99,999 | 22 | 4.6% |
| $100,000 to $149,999 | 132 | 27.8% |
| $150,000 to $199,999 | 92 | 19.4% |
| $200,000+ | 26 | 5.5% |
Family Income by Famaliy Size in Buxton
4-person families (51 | 10.7%) account for the highest median family income in Buxton with $202,604 per family, while 4-person families (51 | 10.7%) have the highest median income of $50,651 per family member.
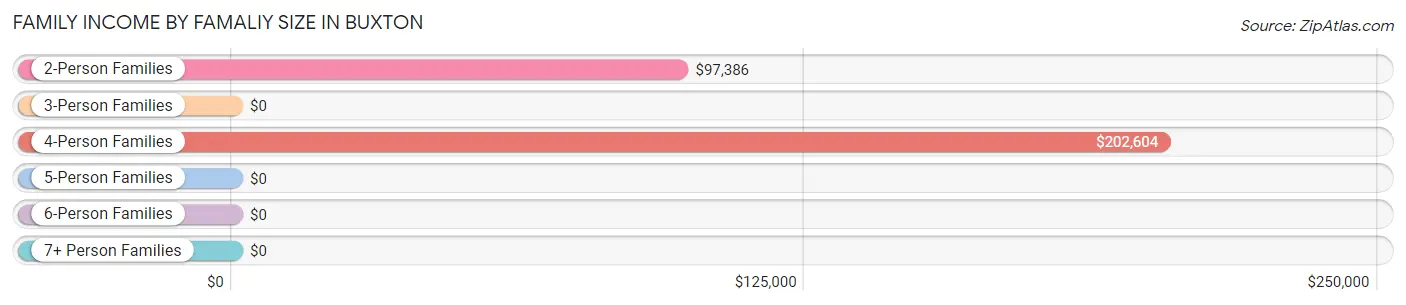
| Income Bracket | # Families | Median Income |
| 2-Person Families | 256 (53.9%) | $97,386 |
| 3-Person Families | 127 (26.7%) | $0 |
| 4-Person Families | 51 (10.7%) | $202,604 |
| 5-Person Families | 41 (8.6%) | $0 |
| 6-Person Families | 0 (0.0%) | $0 |
| 7+ Person Families | 0 (0.0%) | $0 |
| Total | 475 (100.0%) | $103,179 |
Family Income by Number of Earners in Buxton
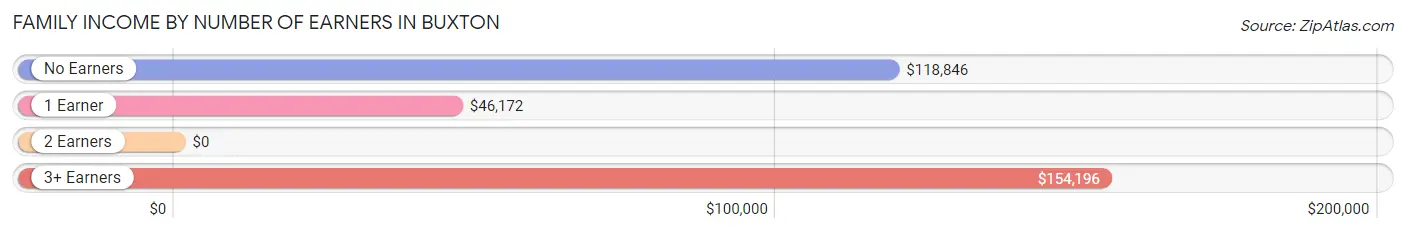
| Number of Earners | # Families | Median Income |
| No Earners | 40 (8.4%) | $118,846 |
| 1 Earner | 99 (20.8%) | $46,172 |
| 2 Earners | 231 (48.6%) | $0 |
| 3+ Earners | 105 (22.1%) | $154,196 |
| Total | 475 (100.0%) | $103,179 |
Household Income in Buxton
Household Income Brackets in Buxton
With 153 households falling in the category, the $100,000 to $149,999 income range is the most frequent in Buxton, accounting for 26.0% of all households.
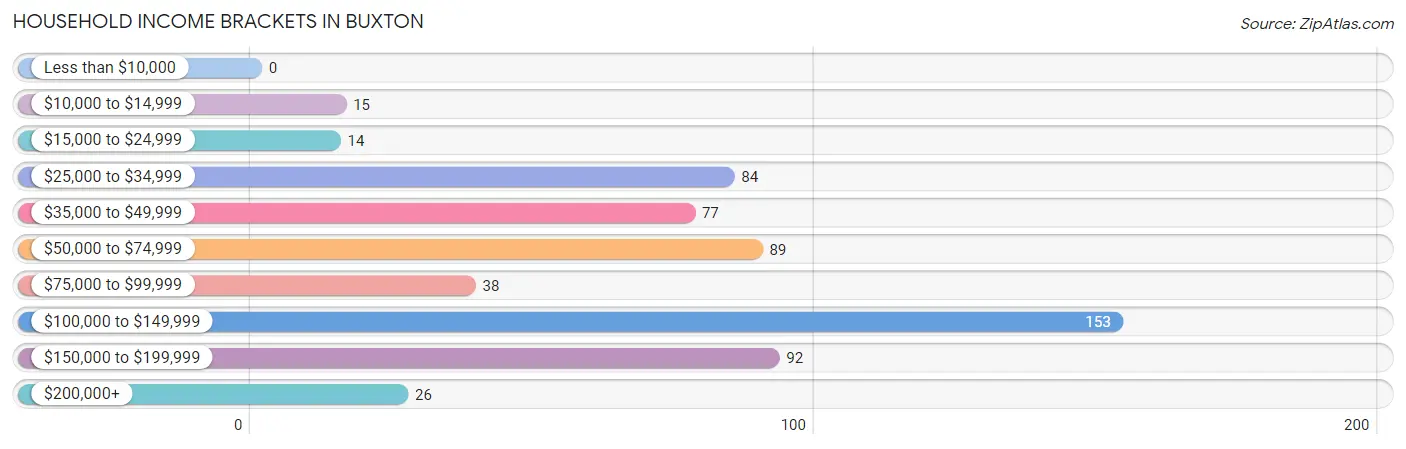
| Income Bracket | # Households | % Households |
| Less than $10,000 | 0 | 0.0% |
| $10,000 to $14,999 | 15 | 2.6% |
| $15,000 to $24,999 | 14 | 2.4% |
| $25,000 to $34,999 | 84 | 14.3% |
| $35,000 to $49,999 | 77 | 13.1% |
| $50,000 to $74,999 | 89 | 15.1% |
| $75,000 to $99,999 | 38 | 6.5% |
| $100,000 to $149,999 | 153 | 26.0% |
| $150,000 to $199,999 | 92 | 15.6% |
| $200,000+ | 26 | 4.4% |
Household Income by Householder Age in Buxton
The median household income in Buxton is $87,344, with the highest median household income of $95,511 found in the 45 to 64 years age bracket for the primary householder. A total of 327 households (55.6%) fall into this category.
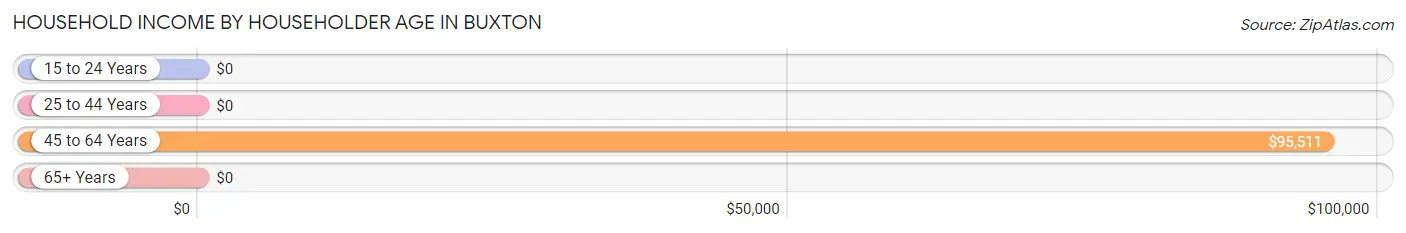
| Income Bracket | # Households | Median Income |
| 15 to 24 Years | 0 (0.0%) | $0 |
| 25 to 44 Years | 124 (21.1%) | $0 |
| 45 to 64 Years | 327 (55.6%) | $95,511 |
| 65+ Years | 137 (23.3%) | $0 |
| Total | 588 (100.0%) | $87,344 |
Poverty in Buxton
Income Below Poverty by Sex and Age in Buxton
With 6.9% poverty level for males and 4.4% for females among the residents of Buxton, under 5 year old males and 18 to 24 year old females are the most vulnerable to poverty, with 13 males (100.0%) and 17 females (21.8%) in their respective age groups living below the poverty level.
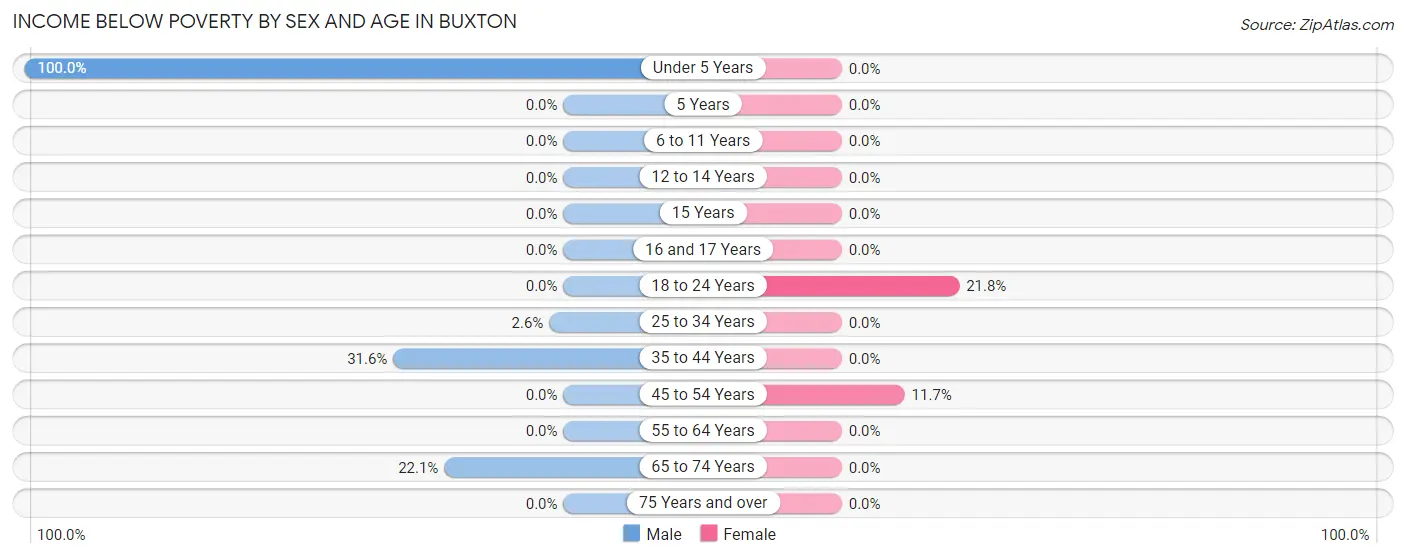
| Age Bracket | Male | Female |
| Under 5 Years | 13 (100.0%) | 0 (0.0%) |
| 5 Years | 0 (0.0%) | 0 (0.0%) |
| 6 to 11 Years | 0 (0.0%) | 0 (0.0%) |
| 12 to 14 Years | 0 (0.0%) | 0 (0.0%) |
| 15 Years | 0 (0.0%) | 0 (0.0%) |
| 16 and 17 Years | 0 (0.0%) | 0 (0.0%) |
| 18 to 24 Years | 0 (0.0%) | 17 (21.8%) |
| 25 to 34 Years | 3 (2.6%) | 0 (0.0%) |
| 35 to 44 Years | 12 (31.6%) | 0 (0.0%) |
| 45 to 54 Years | 0 (0.0%) | 14 (11.7%) |
| 55 to 64 Years | 0 (0.0%) | 0 (0.0%) |
| 65 to 74 Years | 25 (22.1%) | 0 (0.0%) |
| 75 Years and over | 0 (0.0%) | 0 (0.0%) |
| Total | 53 (6.9%) | 31 (4.4%) |
Income Above Poverty by Sex and Age in Buxton
According to the poverty statistics in Buxton, males aged 6 to 11 years and females aged 6 to 11 years are the age groups that are most secure financially, with 100.0% of males and 100.0% of females in these age groups living above the poverty line.
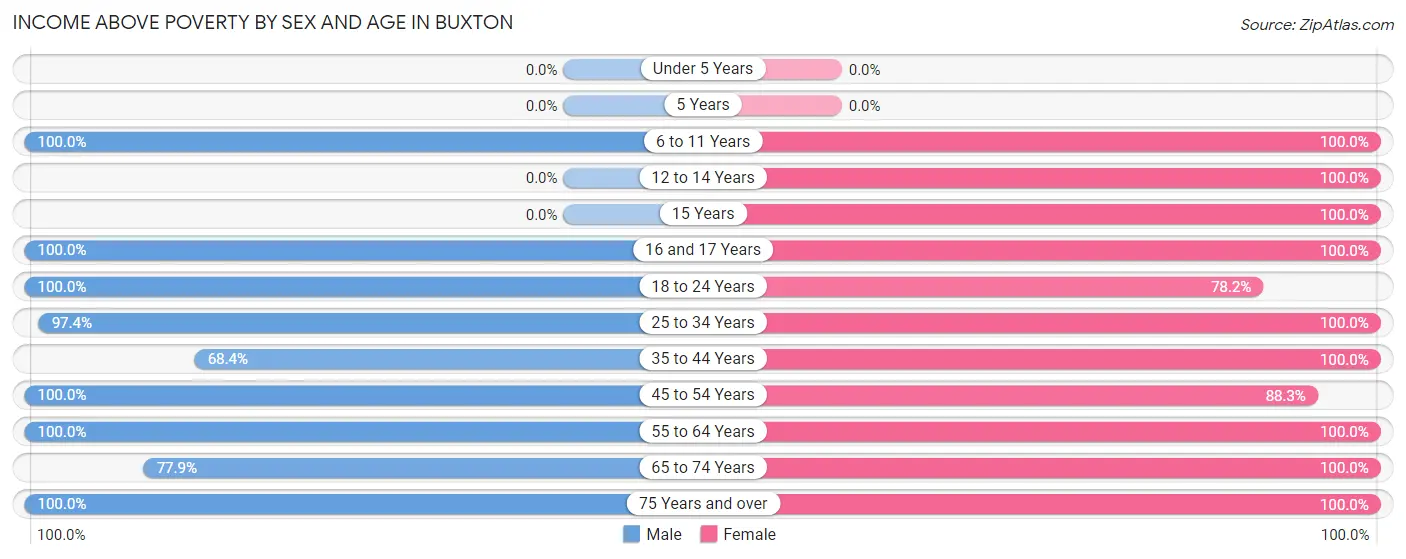
| Age Bracket | Male | Female |
| Under 5 Years | 0 (0.0%) | 0 (0.0%) |
| 5 Years | 0 (0.0%) | 0 (0.0%) |
| 6 to 11 Years | 31 (100.0%) | 45 (100.0%) |
| 12 to 14 Years | 0 (0.0%) | 80 (100.0%) |
| 15 Years | 0 (0.0%) | 21 (100.0%) |
| 16 and 17 Years | 9 (100.0%) | 17 (100.0%) |
| 18 to 24 Years | 123 (100.0%) | 61 (78.2%) |
| 25 to 34 Years | 111 (97.4%) | 49 (100.0%) |
| 35 to 44 Years | 26 (68.4%) | 92 (100.0%) |
| 45 to 54 Years | 68 (100.0%) | 106 (88.3%) |
| 55 to 64 Years | 252 (100.0%) | 121 (100.0%) |
| 65 to 74 Years | 88 (77.9%) | 72 (100.0%) |
| 75 Years and over | 13 (100.0%) | 8 (100.0%) |
| Total | 721 (93.1%) | 672 (95.6%) |
Income Below Poverty Among Married-Couple Families in Buxton
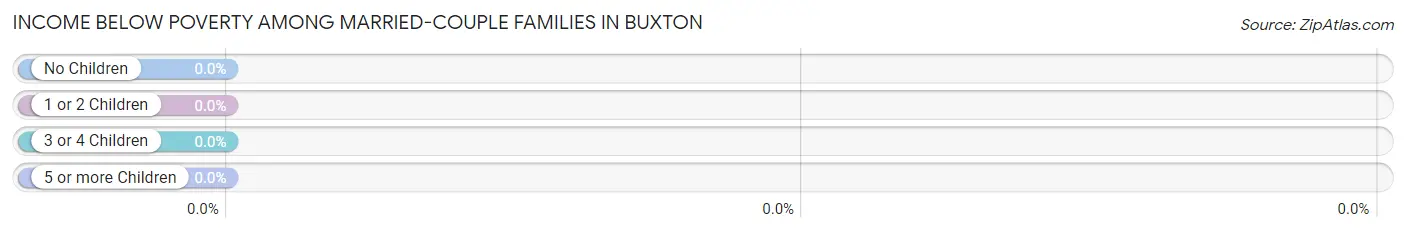
| Children | Above Poverty | Below Poverty |
| No Children | 155 (100.0%) | 0 (0.0%) |
| 1 or 2 Children | 98 (100.0%) | 0 (0.0%) |
| 3 or 4 Children | 0 (0.0%) | 0 (0.0%) |
| 5 or more Children | 0 (0.0%) | 0 (0.0%) |
| Total | 253 (100.0%) | 0 (0.0%) |
Income Below Poverty Among Single-Parent Households in Buxton
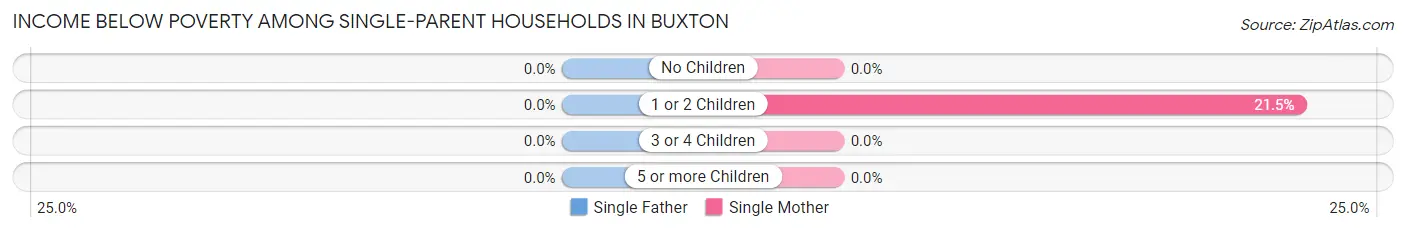
| Children | Single Father | Single Mother |
| No Children | 0 (0.0%) | 0 (0.0%) |
| 1 or 2 Children | 0 (0.0%) | 14 (21.5%) |
| 3 or 4 Children | 0 (0.0%) | 0 (0.0%) |
| 5 or more Children | 0 (0.0%) | 0 (0.0%) |
| Total | 0 (0.0%) | 14 (10.9%) |
Income Below Poverty Among Married-Couple vs Single-Parent Households in Buxton
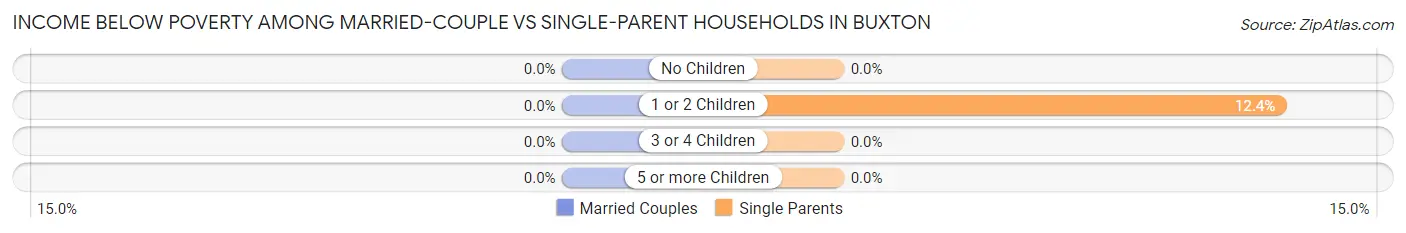
| Children | Married-Couple Families | Single-Parent Households |
| No Children | 0 (0.0%) | 0 (0.0%) |
| 1 or 2 Children | 0 (0.0%) | 14 (12.4%) |
| 3 or 4 Children | 0 (0.0%) | 0 (0.0%) |
| 5 or more Children | 0 (0.0%) | 0 (0.0%) |
| Total | 0 (0.0%) | 14 (6.3%) |
Race in Buxton
The most populous races in Buxton are White / Caucasian (1,413 | 95.7%), Hispanic or Latino (83 | 5.6%), and Native / Alaskan (32 | 2.2%).
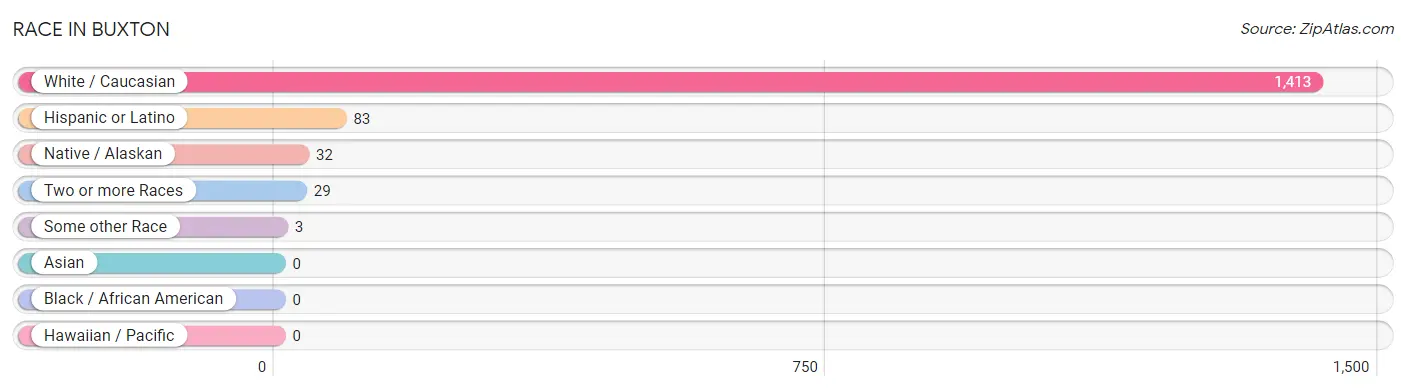
| Race | # Population | % Population |
| Asian | 0 | 0.0% |
| Black / African American | 0 | 0.0% |
| Hawaiian / Pacific | 0 | 0.0% |
| Hispanic or Latino | 83 | 5.6% |
| Native / Alaskan | 32 | 2.2% |
| White / Caucasian | 1,413 | 95.7% |
| Two or more Races | 29 | 2.0% |
| Some other Race | 3 | 0.2% |
| Total | 1,477 | 100.0% |
Ancestry in Buxton
The most populous ancestries reported in Buxton are American (283 | 19.2%), Irish (262 | 17.7%), English (235 | 15.9%), German (155 | 10.5%), and Italian (71 | 4.8%), together accounting for 68.1% of all Buxton residents.
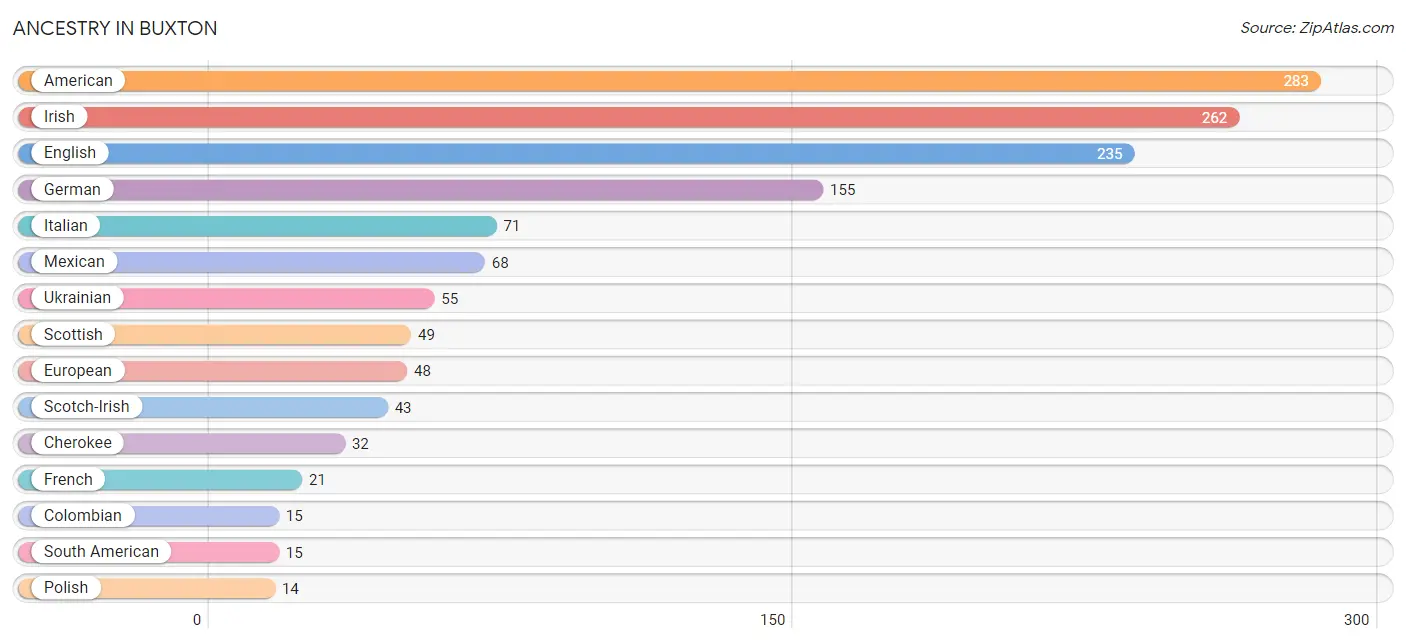
| Ancestry | # Population | % Population |
| American | 283 | 19.2% |
| Cherokee | 32 | 2.2% |
| Colombian | 15 | 1.0% |
| Eastern European | 13 | 0.9% |
| English | 235 | 15.9% |
| European | 48 | 3.3% |
| French | 21 | 1.4% |
| German | 155 | 10.5% |
| Irish | 262 | 17.7% |
| Italian | 71 | 4.8% |
| Mexican | 68 | 4.6% |
| Polish | 14 | 0.9% |
| Scotch-Irish | 43 | 2.9% |
| Scottish | 49 | 3.3% |
| South American | 15 | 1.0% |
| Ukrainian | 55 | 3.7% |
| Welsh | 14 | 0.9% | View All 17 Rows |
Immigrants in Buxton
The most numerous immigrant groups reported in Buxton came from Latin America (46 | 3.1%), Central America (31 | 2.1%), Mexico (31 | 2.1%), Colombia (15 | 1.0%), and South America (15 | 1.0%), together accounting for 9.3% of all Buxton residents.
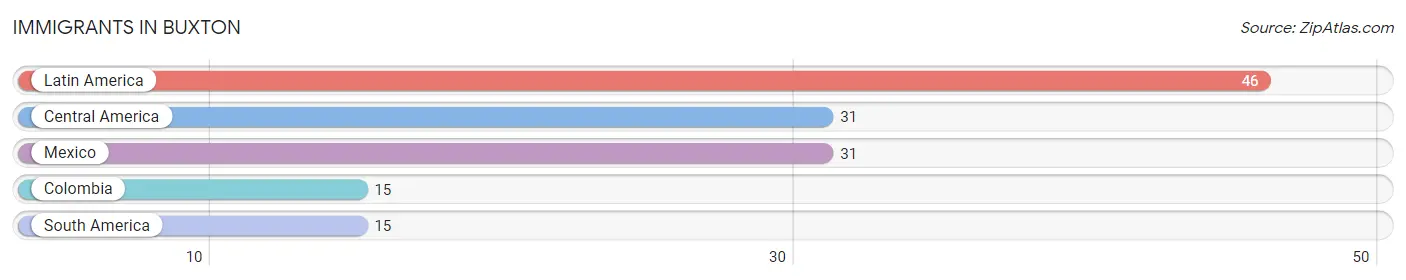
| Immigration Origin | # Population | % Population |
| Central America | 31 | 2.1% |
| Colombia | 15 | 1.0% |
| Latin America | 46 | 3.1% |
| Mexico | 31 | 2.1% |
| South America | 15 | 1.0% | View All 5 Rows |
Sex and Age in Buxton
Sex and Age in Buxton
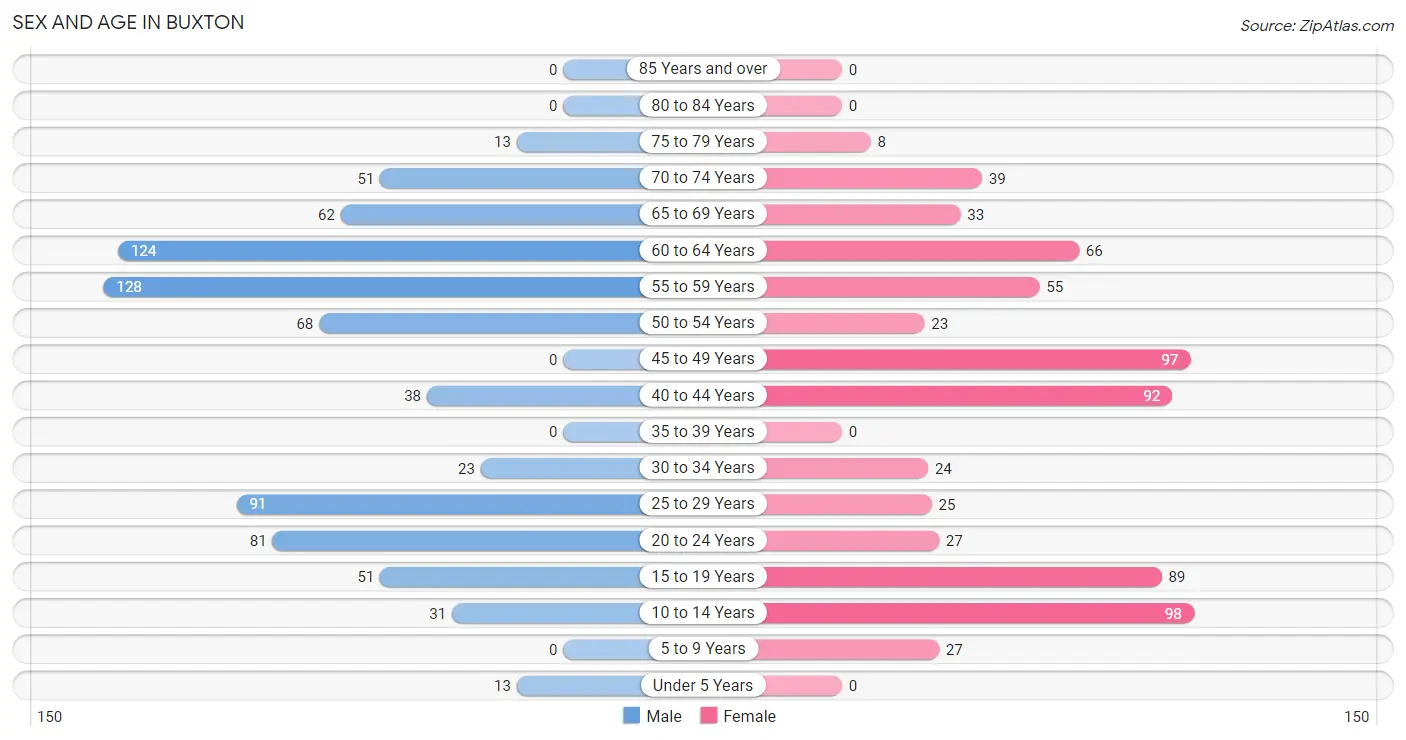
The most populous age groups in Buxton are 55 to 59 Years (128 | 16.5%) for men and 10 to 14 Years (98 | 13.9%) for women.
| Age Bracket | Male | Female |
| Under 5 Years | 13 (1.7%) | 0 (0.0%) |
| 5 to 9 Years | 0 (0.0%) | 27 (3.8%) |
| 10 to 14 Years | 31 (4.0%) | 98 (13.9%) |
| 15 to 19 Years | 51 (6.6%) | 89 (12.7%) |
| 20 to 24 Years | 81 (10.5%) | 27 (3.8%) |
| 25 to 29 Years | 91 (11.8%) | 25 (3.6%) |
| 30 to 34 Years | 23 (3.0%) | 24 (3.4%) |
| 35 to 39 Years | 0 (0.0%) | 0 (0.0%) |
| 40 to 44 Years | 38 (4.9%) | 92 (13.1%) |
| 45 to 49 Years | 0 (0.0%) | 97 (13.8%) |
| 50 to 54 Years | 68 (8.8%) | 23 (3.3%) |
| 55 to 59 Years | 128 (16.5%) | 55 (7.8%) |
| 60 to 64 Years | 124 (16.0%) | 66 (9.4%) |
| 65 to 69 Years | 62 (8.0%) | 33 (4.7%) |
| 70 to 74 Years | 51 (6.6%) | 39 (5.6%) |
| 75 to 79 Years | 13 (1.7%) | 8 (1.1%) |
| 80 to 84 Years | 0 (0.0%) | 0 (0.0%) |
| 85 Years and over | 0 (0.0%) | 0 (0.0%) |
| Total | 774 (100.0%) | 703 (100.0%) |
Families and Households in Buxton
Median Family Size in Buxton
The median family size in Buxton is 2.71 persons per family, with married-couple families (253 | 53.3%) accounting for the largest median family size of 2.98 persons per family. On the other hand, single male/father families (94 | 19.8%) represent the smallest median family size with 2.22 persons per family.
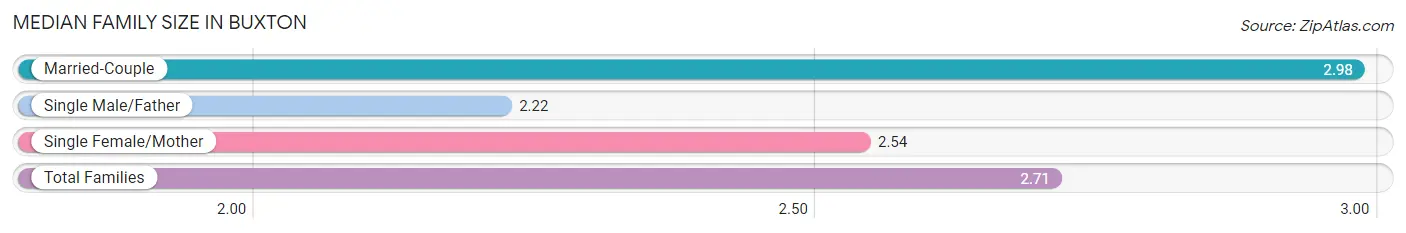
| Family Type | # Families | Family Size |
| Married-Couple | 253 (53.3%) | 2.98 |
| Single Male/Father | 94 (19.8%) | 2.22 |
| Single Female/Mother | 128 (27.0%) | 2.54 |
| Total Families | 475 (100.0%) | 2.71 |
Median Household Size in Buxton
The median household size in Buxton is 2.51 persons per household, with married-couple households (253 | 43.0%) accounting for the largest median household size of 2.98 persons per household. non-family households (113 | 19.2%) represent the smallest median household size with 1.46 persons per household.
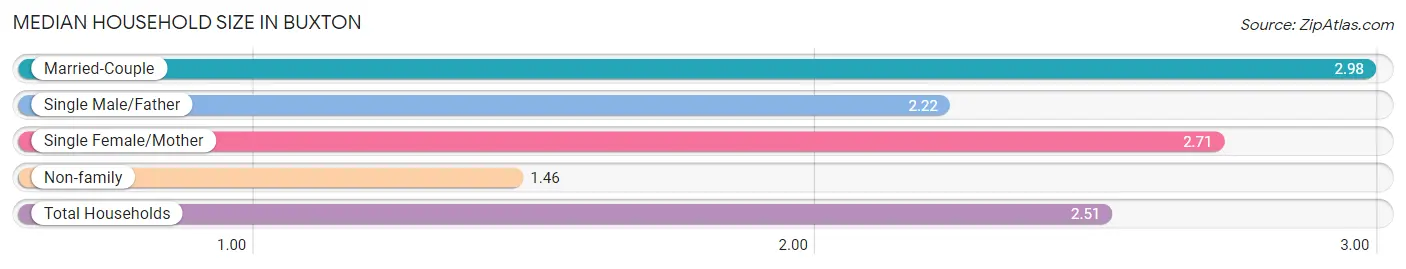
| Household Type | # Households | Household Size |
| Married-Couple | 253 (43.0%) | 2.98 |
| Single Male/Father | 94 (16.0%) | 2.22 |
| Single Female/Mother | 128 (21.8%) | 2.71 |
| Non-family | 113 (19.2%) | 1.46 |
| Total Households | 588 (100.0%) | 2.51 |
Household Size by Marriage Status in Buxton
Out of a total of 588 households in Buxton, 475 (80.8%) are family households, while 113 (19.2%) are nonfamily households. The most numerous type of family households are 2-person households, comprising 240, and the most common type of nonfamily households are 1-person households, comprising 68.
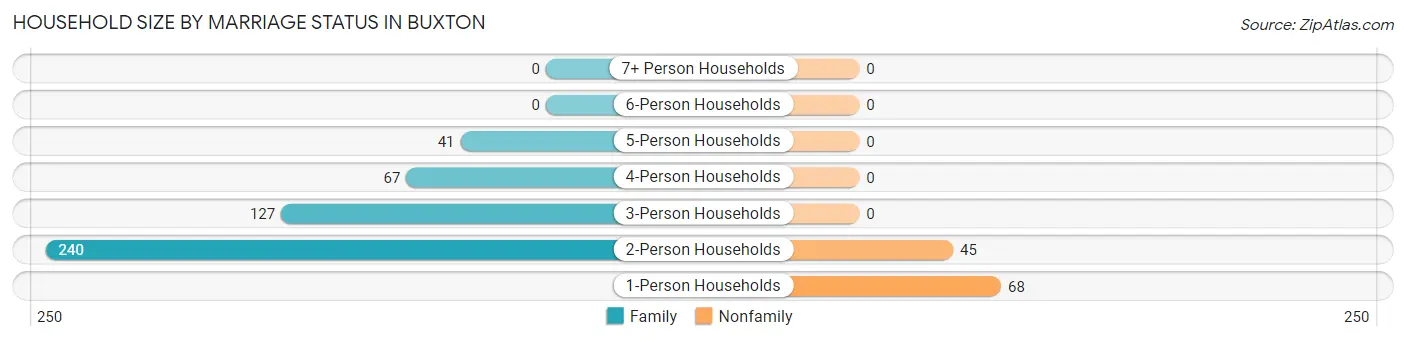
| Household Size | Family Households | Nonfamily Households |
| 1-Person Households | - | 68 (11.6%) |
| 2-Person Households | 240 (40.8%) | 45 (7.6%) |
| 3-Person Households | 127 (21.6%) | 0 (0.0%) |
| 4-Person Households | 67 (11.4%) | 0 (0.0%) |
| 5-Person Households | 41 (7.0%) | 0 (0.0%) |
| 6-Person Households | 0 (0.0%) | 0 (0.0%) |
| 7+ Person Households | 0 (0.0%) | 0 (0.0%) |
| Total | 475 (80.8%) | 113 (19.2%) |
Female Fertility in Buxton
Fertility by Age in Buxton
| Age Bracket | Women with Births | Births / 1,000 Women |
| 15 to 19 years | 0 (0.0%) | 0.0 |
| 20 to 34 years | 0 (0.0%) | 0.0 |
| 35 to 50 years | 0 (0.0%) | 0.0 |
| Total | 0 (0.0%) | 0.0 |
Fertility by Age by Marriage Status in Buxton
| Age Bracket | Married | Unmarried |
| 15 to 19 years | 0 (0.0%) | 0 (0.0%) |
| 20 to 34 years | 0 (0.0%) | 0 (0.0%) |
| 35 to 50 years | 0 (0.0%) | 0 (0.0%) |
| Total | 0 (0.0%) | 0 (0.0%) |
Fertility by Education in Buxton
| Educational Attainment | Women with Births | Births / 1,000 Women |
| Less than High School | 0 (0.0%) | 0.0 |
| High School Diploma | 0 (0.0%) | 0.0 |
| College or Associate's Degree | 0 (0.0%) | 0.0 |
| Bachelor's Degree | 0 (0.0%) | 0.0 |
| Graduate Degree | 0 (0.0%) | 0.0 |
| Total | 0 (0.0%) | 0.0 |
Fertility by Education by Marriage Status in Buxton
| Educational Attainment | Married | Unmarried |
| Less than High School | 0 (0.0%) | 0 (0.0%) |
| High School Diploma | 0 (0.0%) | 0 (0.0%) |
| College or Associate's Degree | 0 (0.0%) | 0 (0.0%) |
| Bachelor's Degree | 0 (0.0%) | 0 (0.0%) |
| Graduate Degree | 0 (0.0%) | 0 (0.0%) |
| Total | 0 (0.0%) | 0 (0.0%) |
Employment Characteristics in Buxton
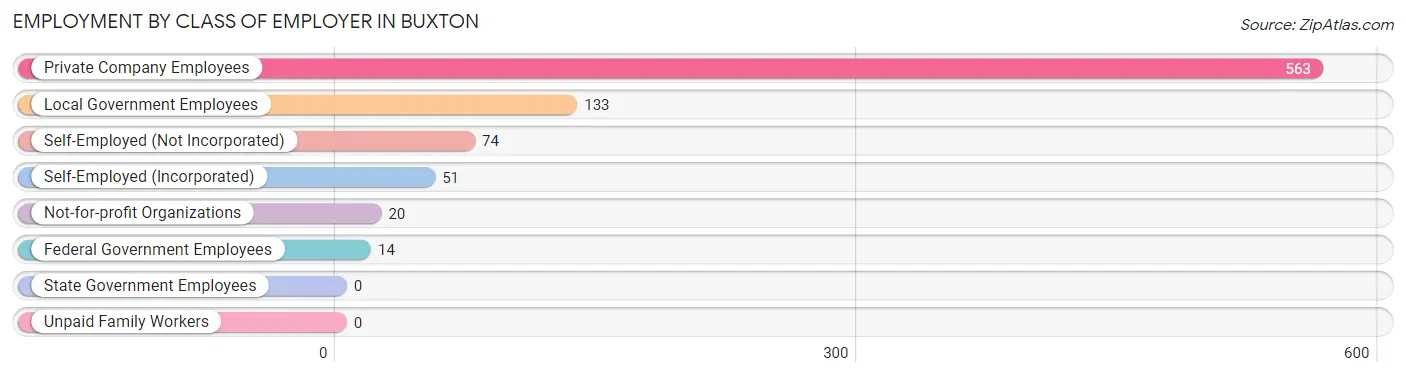
Employment by Class of Employer in Buxton
Among the 855 employed individuals in Buxton, private company employees (563 | 65.8%), local government employees (133 | 15.6%), and self-employed (not incorporated) (74 | 8.6%) make up the most common classes of employment.
| Employer Class | # Employees | % Employees |
| Private Company Employees | 563 | 65.8% |
| Self-Employed (Incorporated) | 51 | 6.0% |
| Self-Employed (Not Incorporated) | 74 | 8.6% |
| Not-for-profit Organizations | 20 | 2.3% |
| Local Government Employees | 133 | 15.6% |
| State Government Employees | 0 | 0.0% |
| Federal Government Employees | 14 | 1.6% |
| Unpaid Family Workers | 0 | 0.0% |
| Total | 855 | 100.0% |
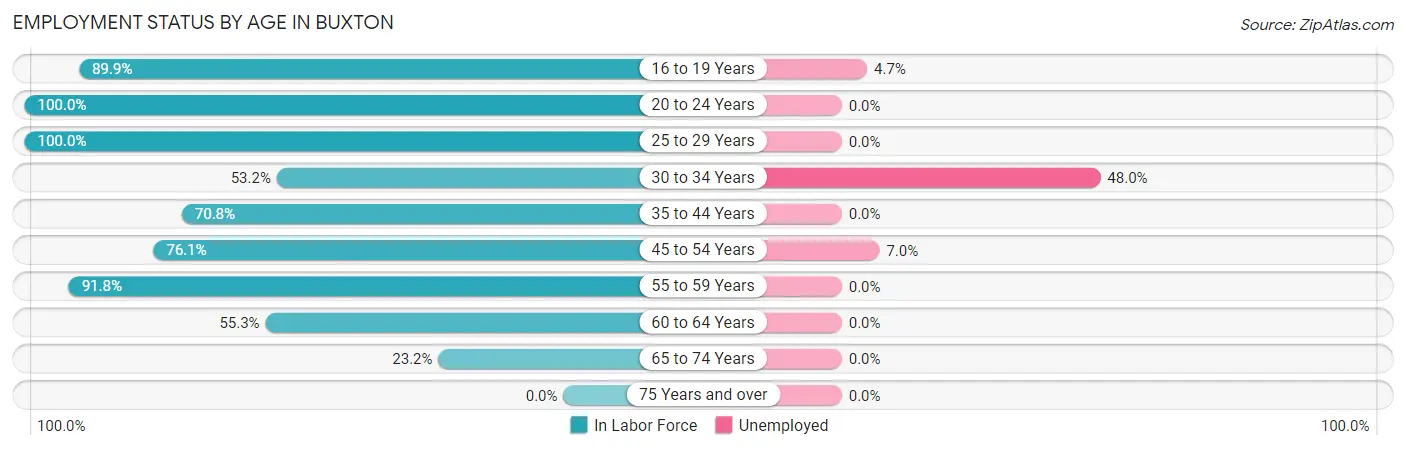
Employment Status by Age in Buxton
According to the labor force statistics for Buxton, out of the total population over 16 years of age (1,287), 70.5% or 907 individuals are in the labor force, with 3.0% or 27 of them unemployed. The age group with the highest labor force participation rate is 20 to 24 years, with 100.0% or 108 individuals in the labor force. Within the labor force, the 30 to 34 years age range has the highest percentage of unemployed individuals, with 48.0% or 12 of them being unemployed.
| Age Bracket | In Labor Force | Unemployed |
| 16 to 19 Years | 107 (89.9%) | 5 (4.7%) |
| 20 to 24 Years | 108 (100.0%) | 0 (0.0%) |
| 25 to 29 Years | 116 (100.0%) | 0 (0.0%) |
| 30 to 34 Years | 25 (53.2%) | 12 (48.0%) |
| 35 to 44 Years | 92 (70.8%) | 0 (0.0%) |
| 45 to 54 Years | 143 (76.1%) | 10 (7.0%) |
| 55 to 59 Years | 168 (91.8%) | 0 (0.0%) |
| 60 to 64 Years | 105 (55.3%) | 0 (0.0%) |
| 65 to 74 Years | 43 (23.2%) | 0 (0.0%) |
| 75 Years and over | 0 (0.0%) | 0 (0.0%) |
| Total | 907 (70.5%) | 27 (3.0%) |
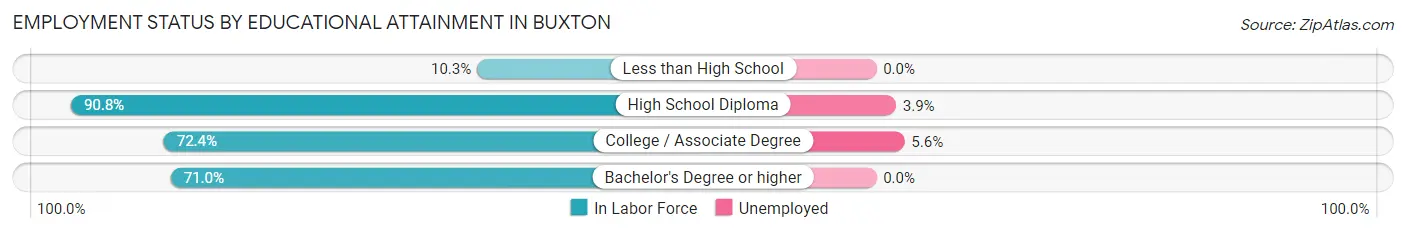
Employment Status by Educational Attainment in Buxton
According to labor force statistics for Buxton, 76.0% of individuals (649) out of the total population between 25 and 64 years of age (854) are in the labor force, with 3.4% or 22 of them being unemployed. The group with the highest labor force participation rate are those with the educational attainment of high school diploma, with 90.8% or 257 individuals in the labor force. Within the labor force, individuals with college / associate degree education have the highest percentage of unemployment, with 5.6% or 12 of them being unemployed.
| Educational Attainment | In Labor Force | Unemployed |
| Less than High School | 3 (10.3%) | 0 (0.0%) |
| High School Diploma | 257 (90.8%) | 11 (3.9%) |
| College / Associate Degree | 213 (72.4%) | 16 (5.6%) |
| Bachelor's Degree or higher | 176 (71.0%) | 0 (0.0%) |
| Total | 649 (76.0%) | 29 (3.4%) |
Employment Occupations by Sex in Buxton
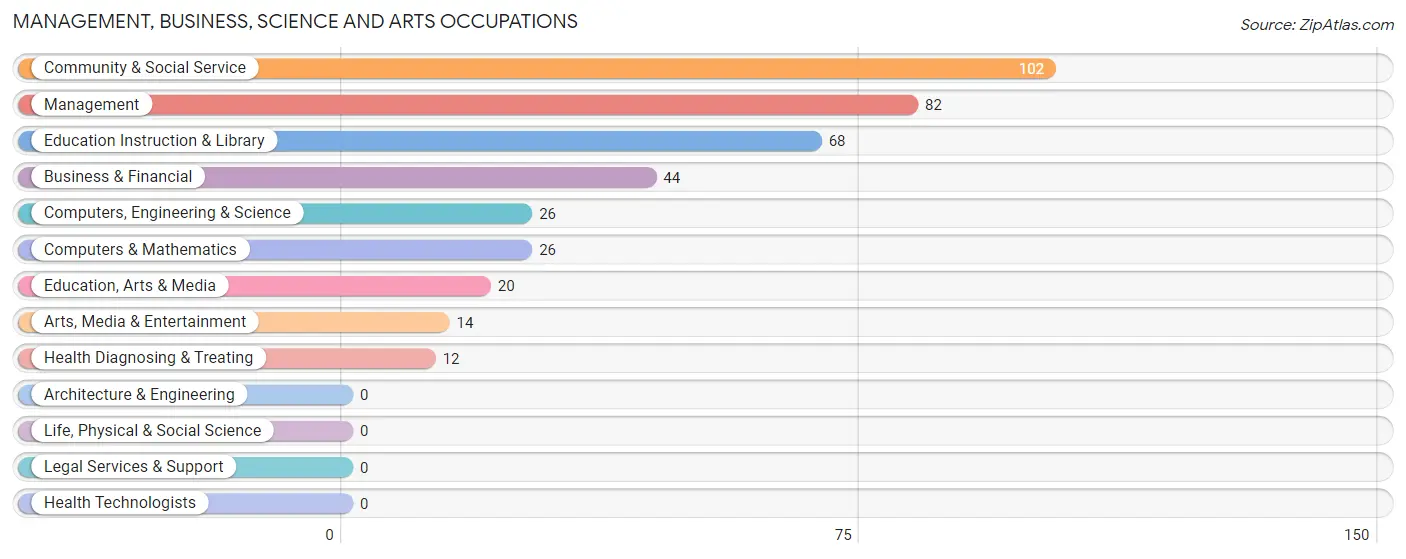
Management, Business, Science and Arts Occupations
The most common Management, Business, Science and Arts occupations in Buxton are Community & Social Service (102 | 11.6%), Management (82 | 9.3%), Education Instruction & Library (68 | 7.7%), Business & Financial (44 | 5.0%), and Computers, Engineering & Science (26 | 2.9%).
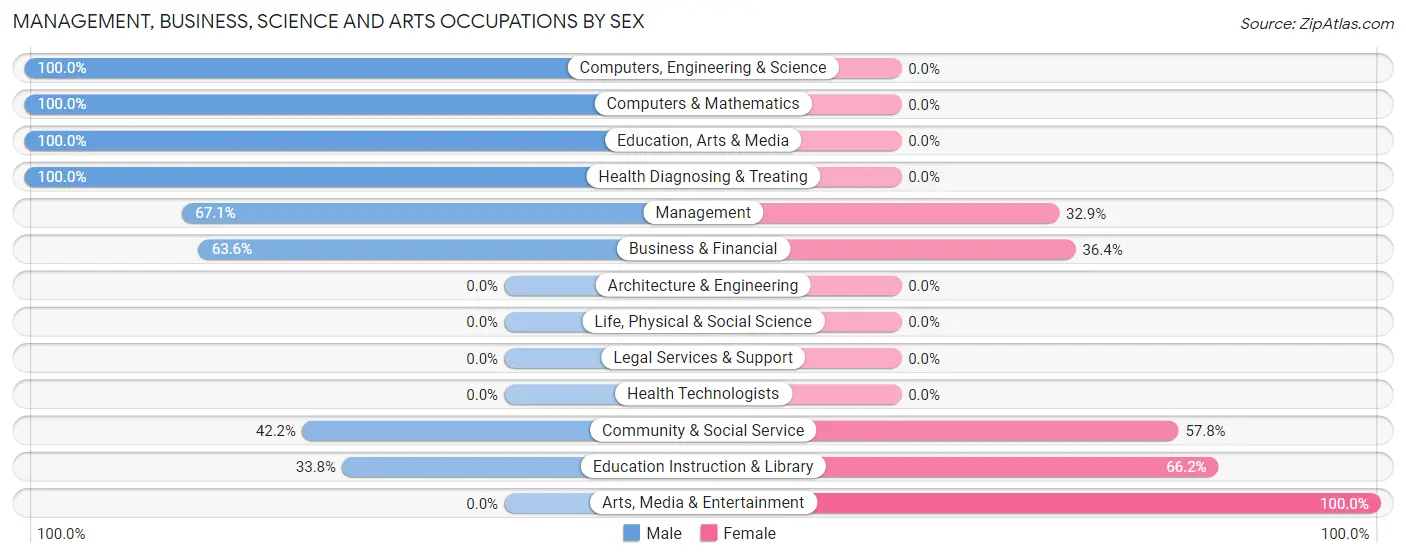
Management, Business, Science and Arts Occupations by Sex
Within the Management, Business, Science and Arts occupations in Buxton, the most male-oriented occupations are Computers, Engineering & Science (100.0%), Computers & Mathematics (100.0%), and Education, Arts & Media (100.0%), while the most female-oriented occupations are Arts, Media & Entertainment (100.0%), Education Instruction & Library (66.2%), and Community & Social Service (57.8%).
| Occupation | Male | Female |
| Management | 55 (67.1%) | 27 (32.9%) |
| Business & Financial | 28 (63.6%) | 16 (36.4%) |
| Computers, Engineering & Science | 26 (100.0%) | 0 (0.0%) |
| Computers & Mathematics | 26 (100.0%) | 0 (0.0%) |
| Architecture & Engineering | 0 (0.0%) | 0 (0.0%) |
| Life, Physical & Social Science | 0 (0.0%) | 0 (0.0%) |
| Community & Social Service | 43 (42.2%) | 59 (57.8%) |
| Education, Arts & Media | 20 (100.0%) | 0 (0.0%) |
| Legal Services & Support | 0 (0.0%) | 0 (0.0%) |
| Education Instruction & Library | 23 (33.8%) | 45 (66.2%) |
| Arts, Media & Entertainment | 0 (0.0%) | 14 (100.0%) |
| Health Diagnosing & Treating | 12 (100.0%) | 0 (0.0%) |
| Health Technologists | 0 (0.0%) | 0 (0.0%) |
| Total (Category) | 164 (61.7%) | 102 (38.4%) |
| Total (Overall) | 471 (53.5%) | 409 (46.5%) |
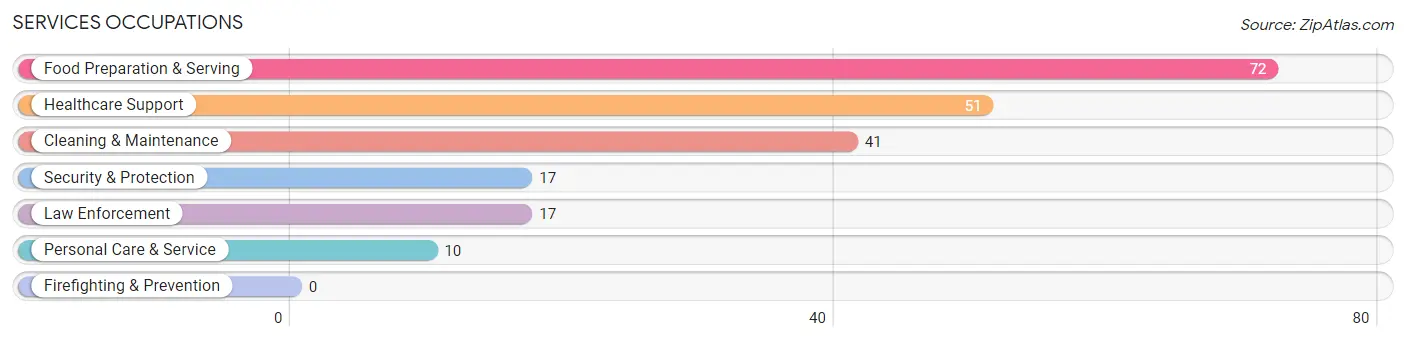
Services Occupations
The most common Services occupations in Buxton are Food Preparation & Serving (72 | 8.2%), Healthcare Support (51 | 5.8%), Cleaning & Maintenance (41 | 4.7%), Security & Protection (17 | 1.9%), and Law Enforcement (17 | 1.9%).
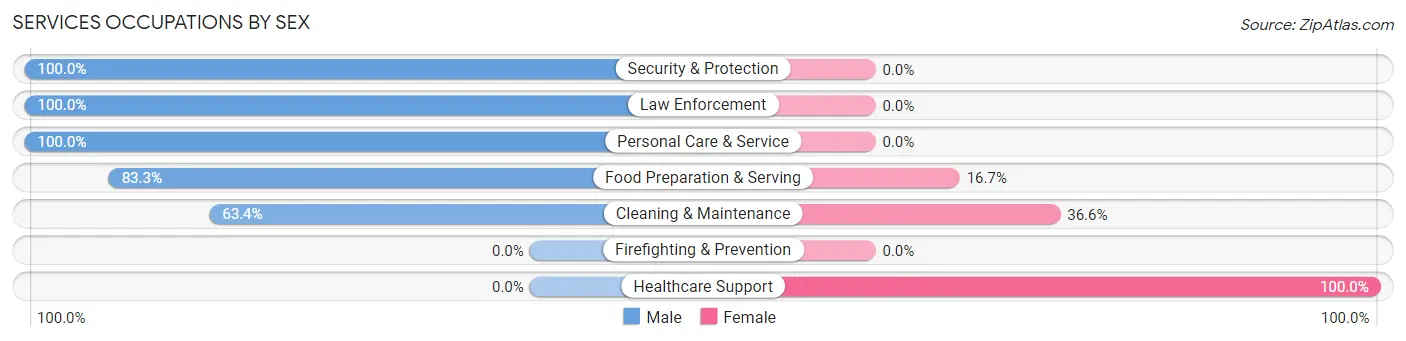
Services Occupations by Sex
Within the Services occupations in Buxton, the most male-oriented occupations are Security & Protection (100.0%), Law Enforcement (100.0%), and Personal Care & Service (100.0%), while the most female-oriented occupations are Healthcare Support (100.0%), Cleaning & Maintenance (36.6%), and Food Preparation & Serving (16.7%).
| Occupation | Male | Female |
| Healthcare Support | 0 (0.0%) | 51 (100.0%) |
| Security & Protection | 17 (100.0%) | 0 (0.0%) |
| Firefighting & Prevention | 0 (0.0%) | 0 (0.0%) |
| Law Enforcement | 17 (100.0%) | 0 (0.0%) |
| Food Preparation & Serving | 60 (83.3%) | 12 (16.7%) |
| Cleaning & Maintenance | 26 (63.4%) | 15 (36.6%) |
| Personal Care & Service | 10 (100.0%) | 0 (0.0%) |
| Total (Category) | 113 (59.2%) | 78 (40.8%) |
| Total (Overall) | 471 (53.5%) | 409 (46.5%) |
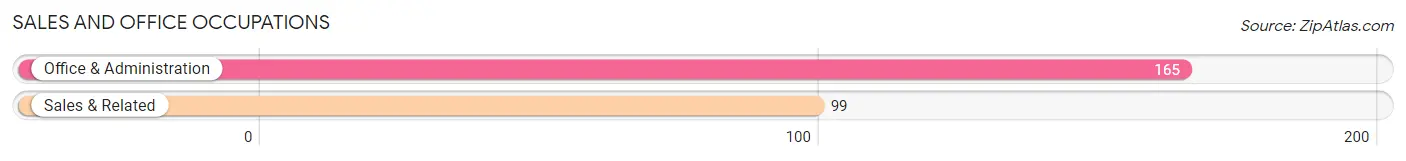
Sales and Office Occupations
The most common Sales and Office occupations in Buxton are Office & Administration (165 | 18.8%), and Sales & Related (99 | 11.3%).
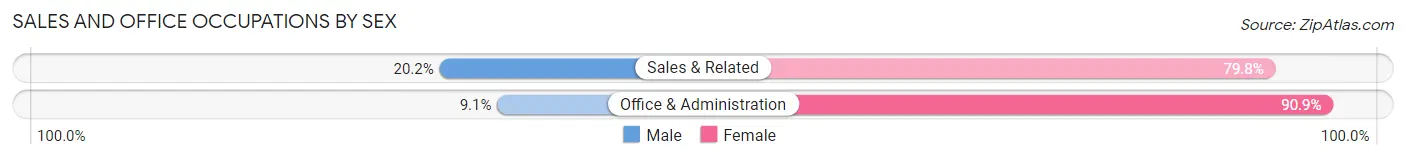
Sales and Office Occupations by Sex
| Occupation | Male | Female |
| Sales & Related | 20 (20.2%) | 79 (79.8%) |
| Office & Administration | 15 (9.1%) | 150 (90.9%) |
| Total (Category) | 35 (13.3%) | 229 (86.7%) |
| Total (Overall) | 471 (53.5%) | 409 (46.5%) |
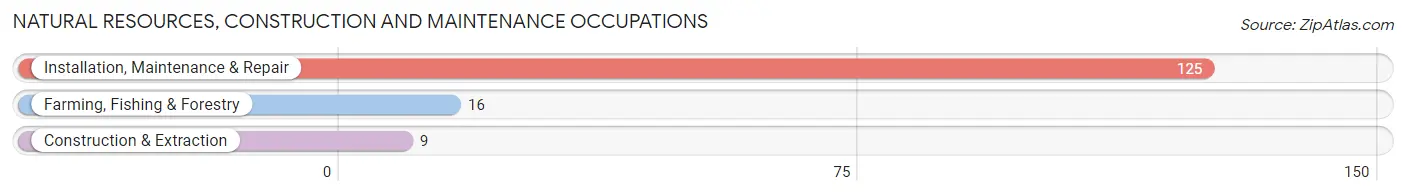
Natural Resources, Construction and Maintenance Occupations
The most common Natural Resources, Construction and Maintenance occupations in Buxton are Installation, Maintenance & Repair (125 | 14.2%), Farming, Fishing & Forestry (16 | 1.8%), and Construction & Extraction (9 | 1.0%).
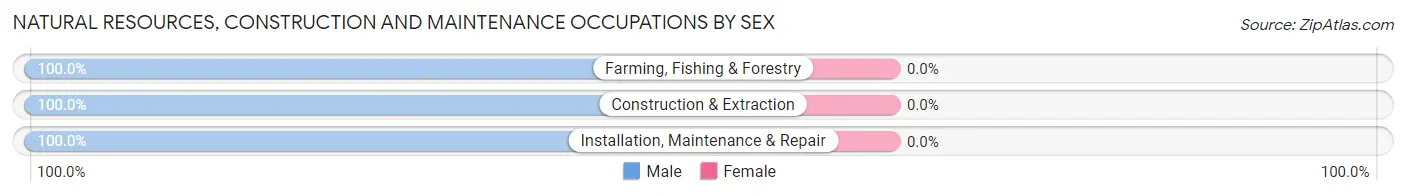
Natural Resources, Construction and Maintenance Occupations by Sex
| Occupation | Male | Female |
| Farming, Fishing & Forestry | 16 (100.0%) | 0 (0.0%) |
| Construction & Extraction | 9 (100.0%) | 0 (0.0%) |
| Installation, Maintenance & Repair | 125 (100.0%) | 0 (0.0%) |
| Total (Category) | 150 (100.0%) | 0 (0.0%) |
| Total (Overall) | 471 (53.5%) | 409 (46.5%) |
Production, Transportation and Moving Occupations
The most common Production, Transportation and Moving occupations in Buxton are , and Production (9 | 1.0%).
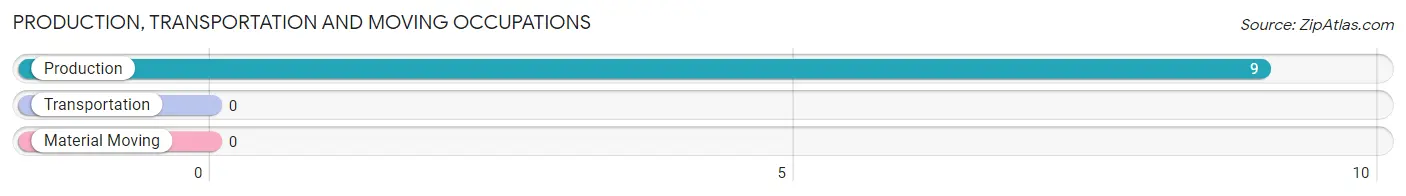
Production, Transportation and Moving Occupations by Sex
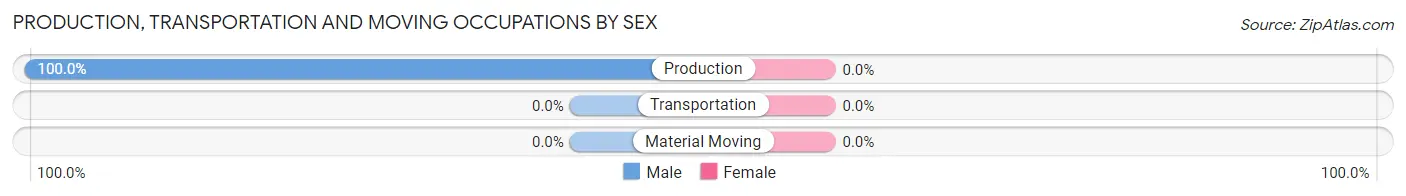
| Occupation | Male | Female |
| Production | 9 (100.0%) | 0 (0.0%) |
| Transportation | 0 (0.0%) | 0 (0.0%) |
| Material Moving | 0 (0.0%) | 0 (0.0%) |
| Total (Category) | 9 (100.0%) | 0 (0.0%) |
| Total (Overall) | 471 (53.5%) | 409 (46.5%) |
Employment Industries by Sex in Buxton
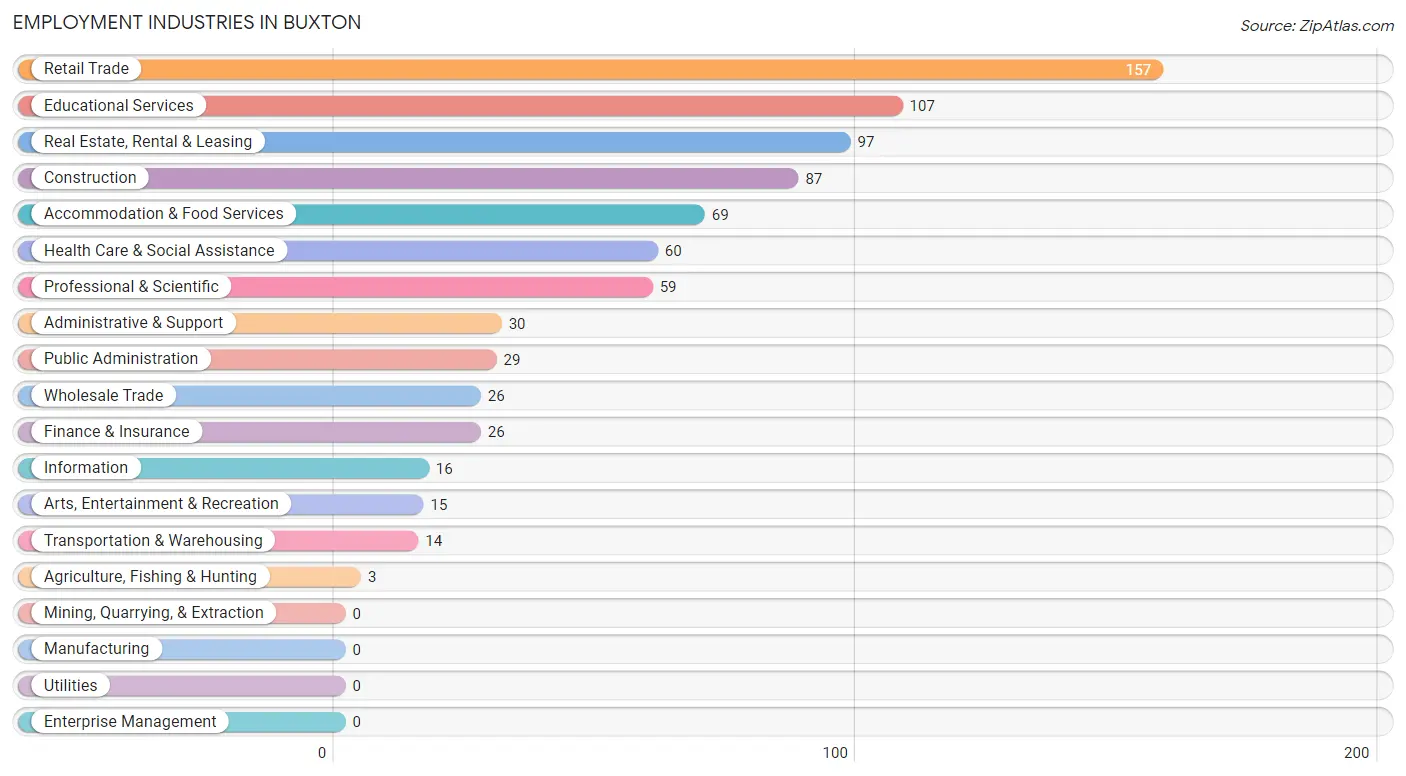
Employment Industries in Buxton
The major employment industries in Buxton include Retail Trade (157 | 17.8%), Educational Services (107 | 12.2%), Real Estate, Rental & Leasing (97 | 11.0%), Construction (87 | 9.9%), and Accommodation & Food Services (69 | 7.8%).
Employment Industries by Sex in Buxton
The Buxton industries that see more men than women are Agriculture, Fishing & Hunting (100.0%), Wholesale Trade (100.0%), and Finance & Insurance (100.0%), whereas the industries that tend to have a higher number of women are Transportation & Warehousing (100.0%), Information (100.0%), and Health Care & Social Assistance (100.0%).
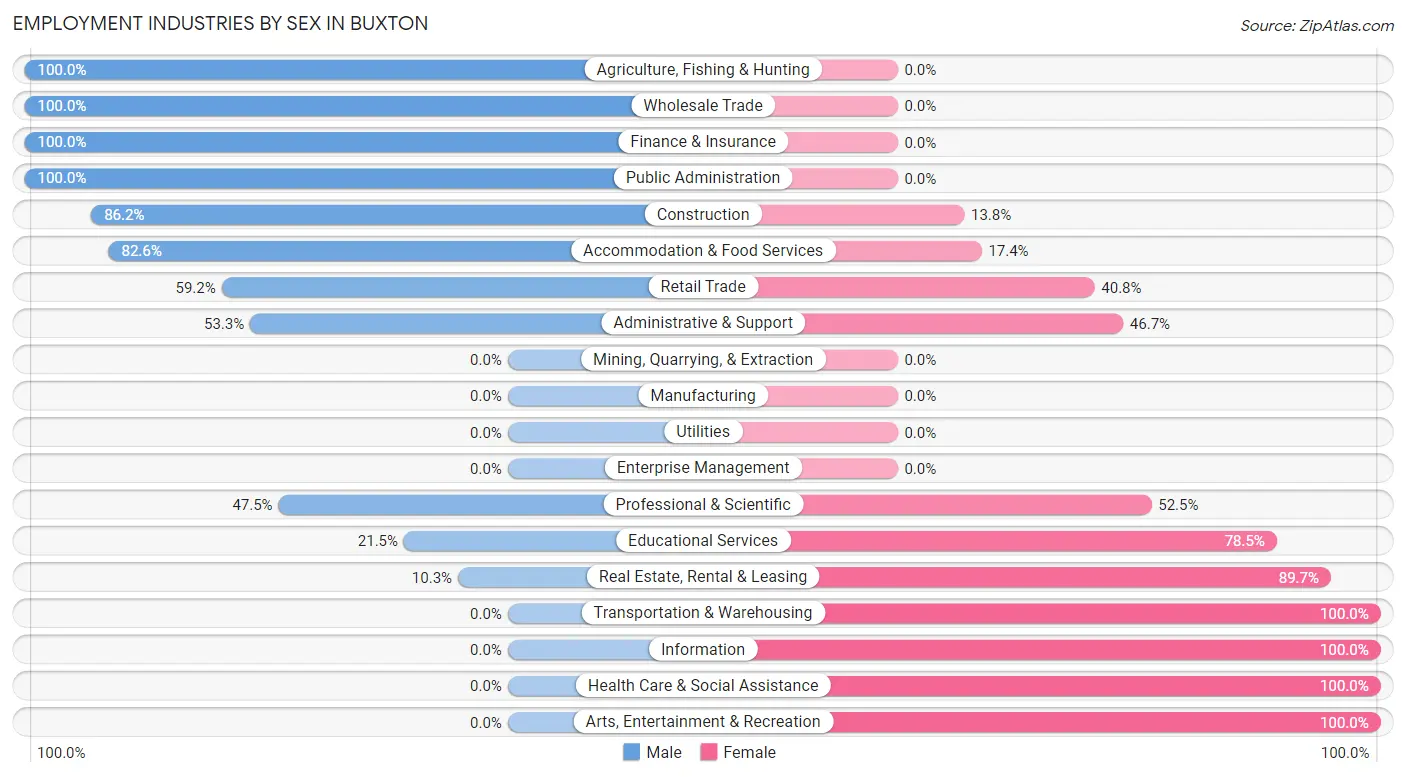
| Industry | Male | Female |
| Agriculture, Fishing & Hunting | 3 (100.0%) | 0 (0.0%) |
| Mining, Quarrying, & Extraction | 0 (0.0%) | 0 (0.0%) |
| Construction | 75 (86.2%) | 12 (13.8%) |
| Manufacturing | 0 (0.0%) | 0 (0.0%) |
| Wholesale Trade | 26 (100.0%) | 0 (0.0%) |
| Retail Trade | 93 (59.2%) | 64 (40.8%) |
| Transportation & Warehousing | 0 (0.0%) | 14 (100.0%) |
| Utilities | 0 (0.0%) | 0 (0.0%) |
| Information | 0 (0.0%) | 16 (100.0%) |
| Finance & Insurance | 26 (100.0%) | 0 (0.0%) |
| Real Estate, Rental & Leasing | 10 (10.3%) | 87 (89.7%) |
| Professional & Scientific | 28 (47.5%) | 31 (52.5%) |
| Enterprise Management | 0 (0.0%) | 0 (0.0%) |
| Administrative & Support | 16 (53.3%) | 14 (46.7%) |
| Educational Services | 23 (21.5%) | 84 (78.5%) |
| Health Care & Social Assistance | 0 (0.0%) | 60 (100.0%) |
| Arts, Entertainment & Recreation | 0 (0.0%) | 15 (100.0%) |
| Accommodation & Food Services | 57 (82.6%) | 12 (17.4%) |
| Public Administration | 29 (100.0%) | 0 (0.0%) |
| Total | 471 (53.5%) | 409 (46.5%) |
Education in Buxton
School Enrollment in Buxton
The most common levels of schooling among the 262 students in Buxton are middle school (96 | 36.6%), high school (92 | 35.1%), and nursery / preschool (27 | 10.3%).
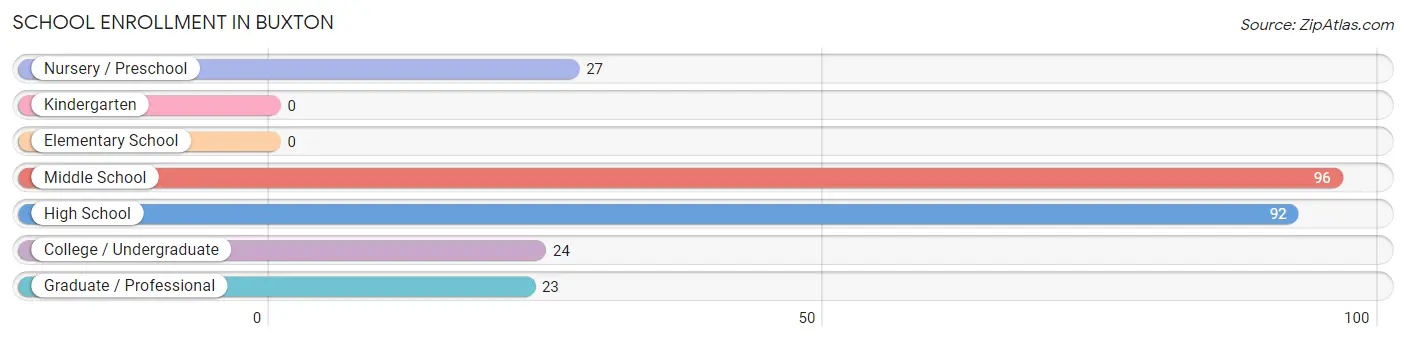
| School Level | # Students | % Students |
| Nursery / Preschool | 27 | 10.3% |
| Kindergarten | 0 | 0.0% |
| Elementary School | 0 | 0.0% |
| Middle School | 96 | 36.6% |
| High School | 92 | 35.1% |
| College / Undergraduate | 24 | 9.2% |
| Graduate / Professional | 23 | 8.8% |
| Total | 262 | 100.0% |
School Enrollment by Age by Funding Source in Buxton
Out of a total of 262 students who are enrolled in schools in Buxton, 44 (16.8%) attend a private institution, while the remaining 218 (83.2%) are enrolled in public schools. The age group of 35 years and over has the highest likelihood of being enrolled in private schools, with 23 (100.0% in the age bracket) enrolled. Conversely, the age group of 5 to 9 year old has the lowest likelihood of being enrolled in a private school, with 27 (100.0% in the age bracket) attending a public institution.
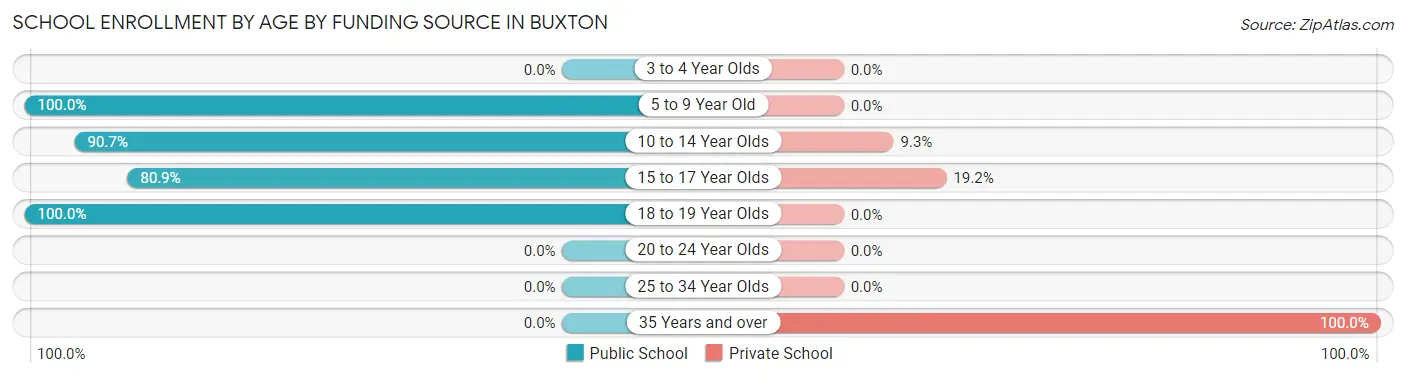
| Age Bracket | Public School | Private School |
| 3 to 4 Year Olds | 0 (0.0%) | 0 (0.0%) |
| 5 to 9 Year Old | 27 (100.0%) | 0 (0.0%) |
| 10 to 14 Year Olds | 117 (90.7%) | 12 (9.3%) |
| 15 to 17 Year Olds | 38 (80.8%) | 9 (19.2%) |
| 18 to 19 Year Olds | 36 (100.0%) | 0 (0.0%) |
| 20 to 24 Year Olds | 0 (0.0%) | 0 (0.0%) |
| 25 to 34 Year Olds | 0 (0.0%) | 0 (0.0%) |
| 35 Years and over | 0 (0.0%) | 23 (100.0%) |
| Total | 218 (83.2%) | 44 (16.8%) |
Educational Attainment by Field of Study in Buxton
Education (62 | 19.8%), arts & humanities (53 | 16.9%), engineering (47 | 15.0%), bio, nature & agricultural (40 | 12.7%), and science & technology (40 | 12.7%) are the most common fields of study among 314 individuals in Buxton who have obtained a bachelor's degree or higher.
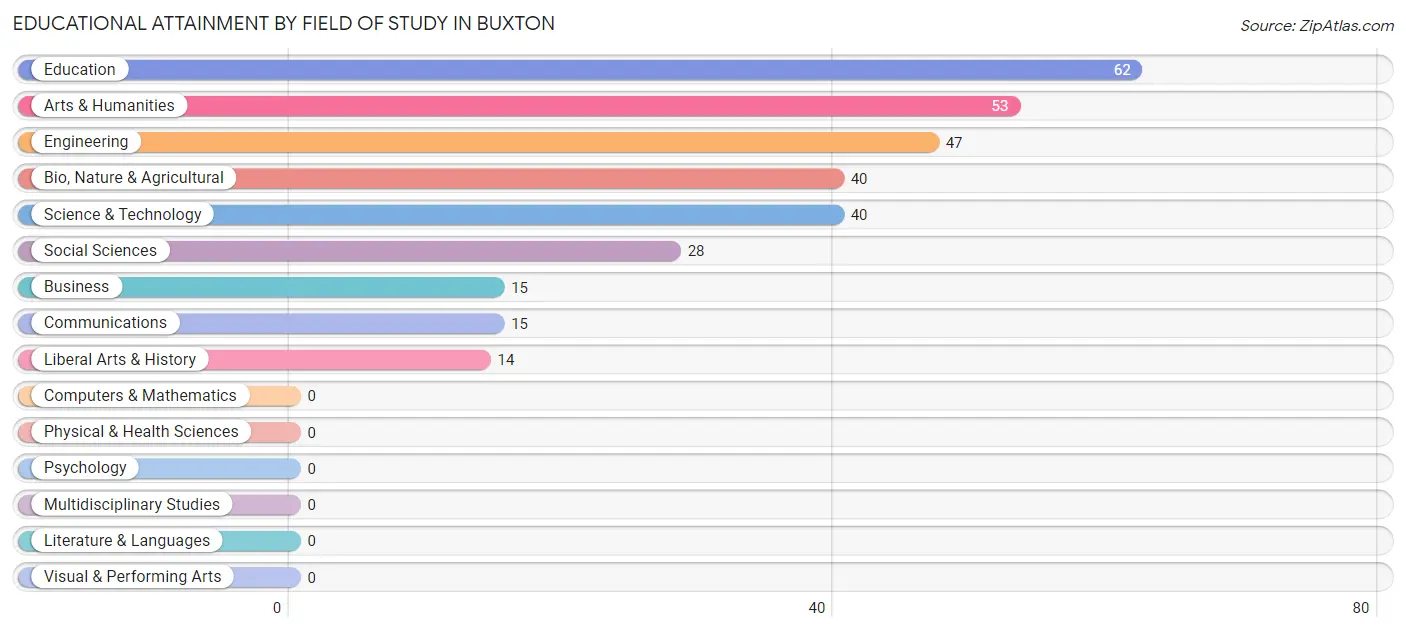
| Field of Study | # Graduates | % Graduates |
| Computers & Mathematics | 0 | 0.0% |
| Bio, Nature & Agricultural | 40 | 12.7% |
| Physical & Health Sciences | 0 | 0.0% |
| Psychology | 0 | 0.0% |
| Social Sciences | 28 | 8.9% |
| Engineering | 47 | 15.0% |
| Multidisciplinary Studies | 0 | 0.0% |
| Science & Technology | 40 | 12.7% |
| Business | 15 | 4.8% |
| Education | 62 | 19.8% |
| Literature & Languages | 0 | 0.0% |
| Liberal Arts & History | 14 | 4.5% |
| Visual & Performing Arts | 0 | 0.0% |
| Communications | 15 | 4.8% |
| Arts & Humanities | 53 | 16.9% |
| Total | 314 | 100.0% |
Transportation & Commute in Buxton
Vehicle Availability by Sex in Buxton
The most prevalent vehicle ownership categories in Buxton are males with 2 vehicles (201, accounting for 42.9%) and females with 2 vehicles (114, making up 52.3%).
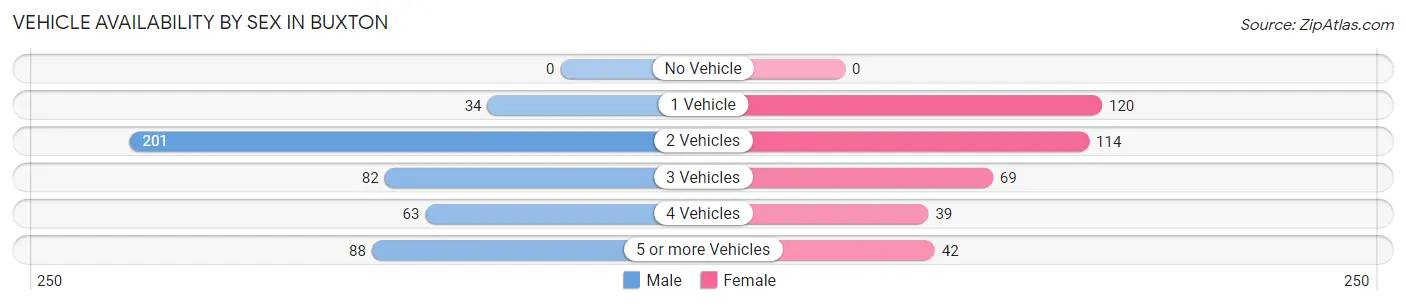
| Vehicles Available | Male | Female |
| No Vehicle | 0 (0.0%) | 0 (0.0%) |
| 1 Vehicle | 34 (7.3%) | 120 (31.2%) |
| 2 Vehicles | 201 (42.9%) | 114 (29.7%) |
| 3 Vehicles | 82 (17.5%) | 69 (18.0%) |
| 4 Vehicles | 63 (13.5%) | 39 (10.2%) |
| 5 or more Vehicles | 88 (18.8%) | 42 (10.9%) |
| Total | 468 (100.0%) | 384 (100.0%) |
Commute Time in Buxton
The most frequently occuring commute durations in Buxton are 15 to 19 minutes (186 commuters, 28.7%), less than 5 minutes (139 commuters, 21.4%), and 5 to 9 minutes (108 commuters, 16.7%).
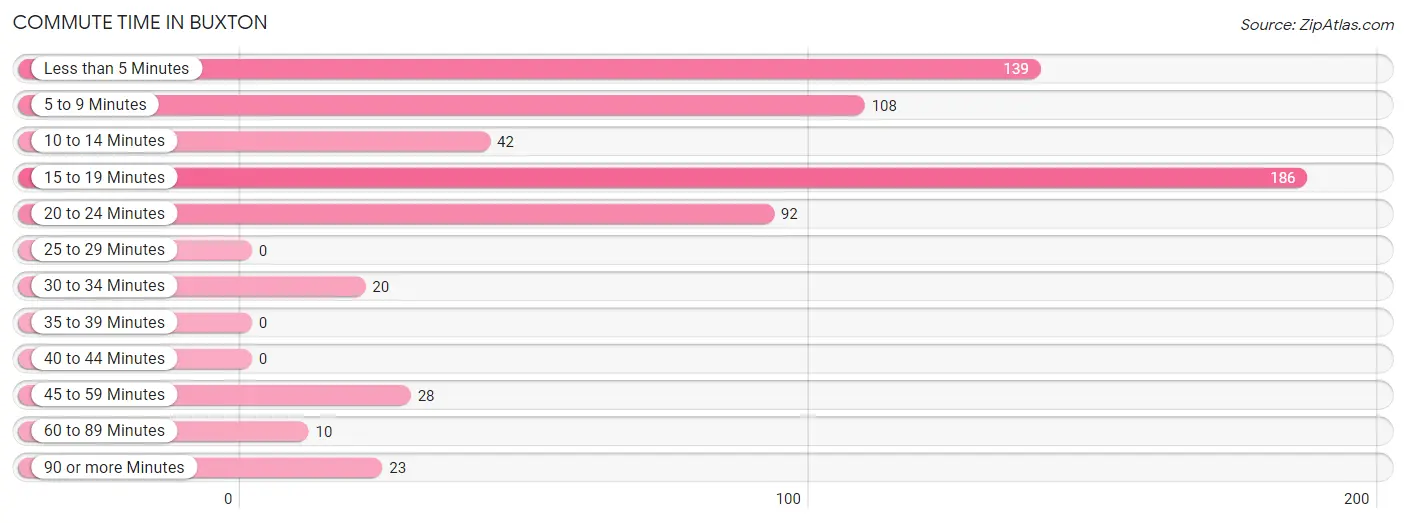
| Commute Time | # Commuters | % Commuters |
| Less than 5 Minutes | 139 | 21.4% |
| 5 to 9 Minutes | 108 | 16.7% |
| 10 to 14 Minutes | 42 | 6.5% |
| 15 to 19 Minutes | 186 | 28.7% |
| 20 to 24 Minutes | 92 | 14.2% |
| 25 to 29 Minutes | 0 | 0.0% |
| 30 to 34 Minutes | 20 | 3.1% |
| 35 to 39 Minutes | 0 | 0.0% |
| 40 to 44 Minutes | 0 | 0.0% |
| 45 to 59 Minutes | 28 | 4.3% |
| 60 to 89 Minutes | 10 | 1.5% |
| 90 or more Minutes | 23 | 3.5% |
Commute Time by Sex in Buxton
The most common commute times in Buxton are 15 to 19 minutes (119 commuters, 31.7%) for males and 15 to 19 minutes (67 commuters, 24.5%) for females.
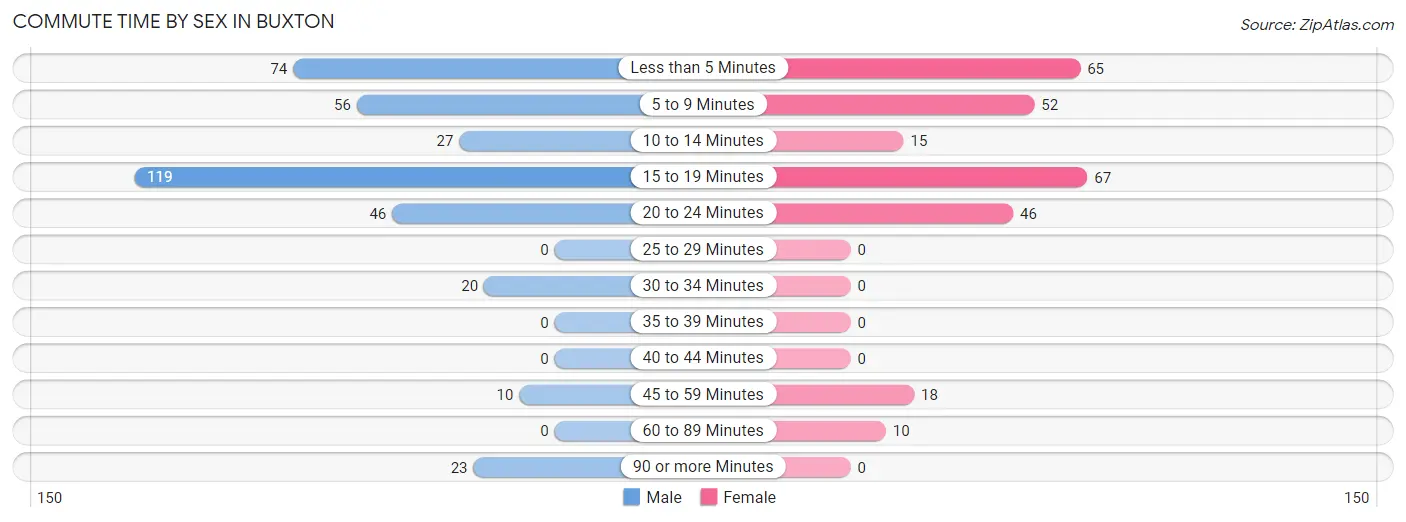
| Commute Time | Male | Female |
| Less than 5 Minutes | 74 (19.7%) | 65 (23.8%) |
| 5 to 9 Minutes | 56 (14.9%) | 52 (19.1%) |
| 10 to 14 Minutes | 27 (7.2%) | 15 (5.5%) |
| 15 to 19 Minutes | 119 (31.7%) | 67 (24.5%) |
| 20 to 24 Minutes | 46 (12.3%) | 46 (16.9%) |
| 25 to 29 Minutes | 0 (0.0%) | 0 (0.0%) |
| 30 to 34 Minutes | 20 (5.3%) | 0 (0.0%) |
| 35 to 39 Minutes | 0 (0.0%) | 0 (0.0%) |
| 40 to 44 Minutes | 0 (0.0%) | 0 (0.0%) |
| 45 to 59 Minutes | 10 (2.7%) | 18 (6.6%) |
| 60 to 89 Minutes | 0 (0.0%) | 10 (3.7%) |
| 90 or more Minutes | 23 (6.1%) | 0 (0.0%) |
Time of Departure to Work by Sex in Buxton
The most frequent times of departure to work in Buxton are 8:00 AM to 8:29 AM (90, 24.0%) for males and 8:30 AM to 8:59 AM (52, 19.1%) for females.
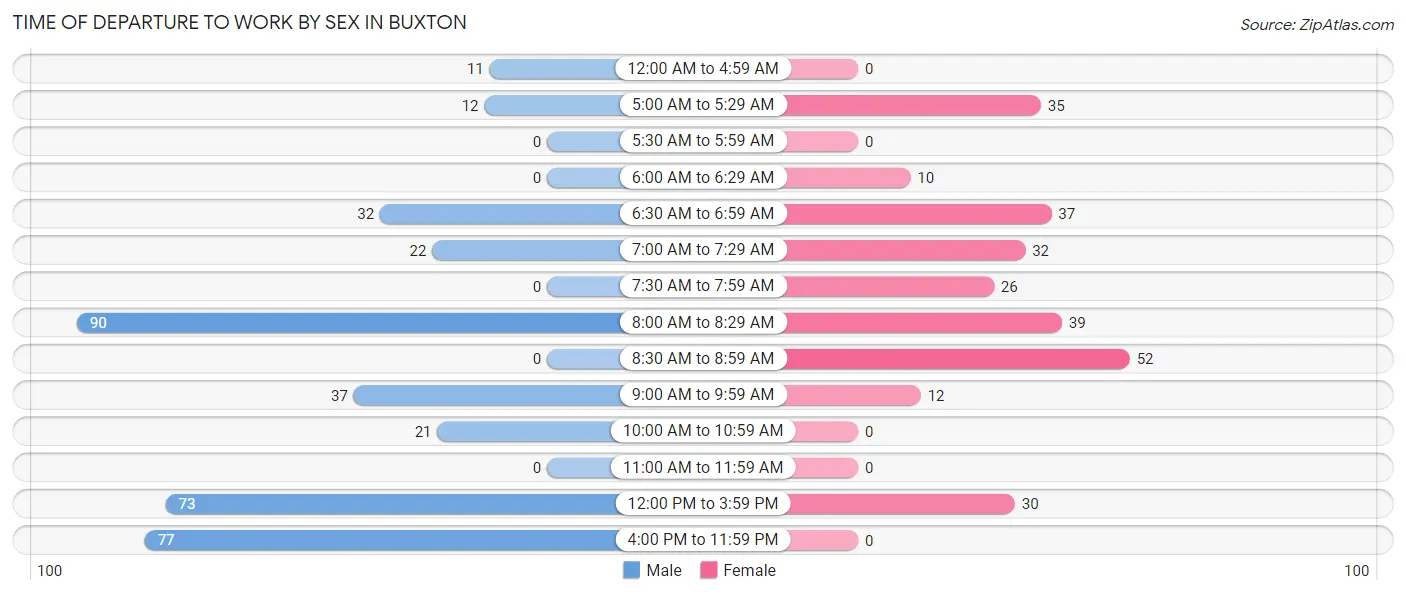
| Time of Departure | Male | Female |
| 12:00 AM to 4:59 AM | 11 (2.9%) | 0 (0.0%) |
| 5:00 AM to 5:29 AM | 12 (3.2%) | 35 (12.8%) |
| 5:30 AM to 5:59 AM | 0 (0.0%) | 0 (0.0%) |
| 6:00 AM to 6:29 AM | 0 (0.0%) | 10 (3.7%) |
| 6:30 AM to 6:59 AM | 32 (8.5%) | 37 (13.6%) |
| 7:00 AM to 7:29 AM | 22 (5.9%) | 32 (11.7%) |
| 7:30 AM to 7:59 AM | 0 (0.0%) | 26 (9.5%) |
| 8:00 AM to 8:29 AM | 90 (24.0%) | 39 (14.3%) |
| 8:30 AM to 8:59 AM | 0 (0.0%) | 52 (19.1%) |
| 9:00 AM to 9:59 AM | 37 (9.9%) | 12 (4.4%) |
| 10:00 AM to 10:59 AM | 21 (5.6%) | 0 (0.0%) |
| 11:00 AM to 11:59 AM | 0 (0.0%) | 0 (0.0%) |
| 12:00 PM to 3:59 PM | 73 (19.5%) | 30 (11.0%) |
| 4:00 PM to 11:59 PM | 77 (20.5%) | 0 (0.0%) |
| Total | 375 (100.0%) | 273 (100.0%) |
Housing Occupancy in Buxton
Occupancy by Ownership in Buxton
Of the total 588 dwellings in Buxton, owner-occupied units account for 466 (79.2%), while renter-occupied units make up 122 (20.7%).
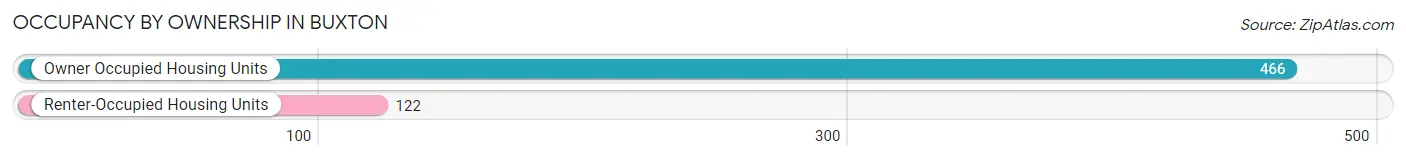
| Occupancy | # Housing Units | % Housing Units |
| Owner Occupied Housing Units | 466 | 79.2% |
| Renter-Occupied Housing Units | 122 | 20.7% |
| Total Occupied Housing Units | 588 | 100.0% |
Occupancy by Household Size in Buxton
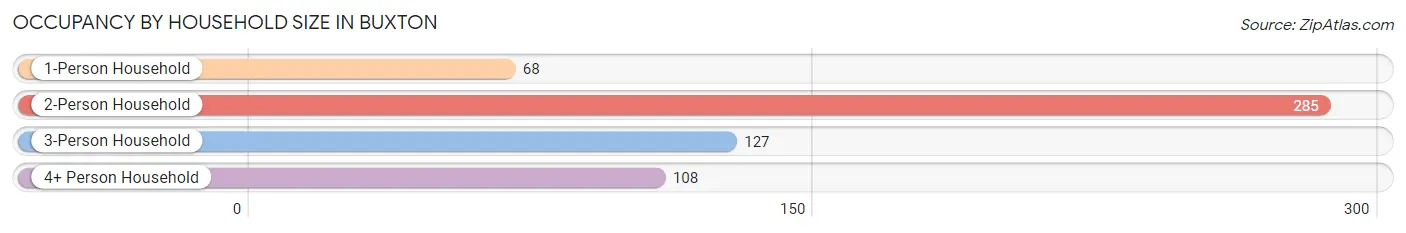
| Household Size | # Housing Units | % Housing Units |
| 1-Person Household | 68 | 11.6% |
| 2-Person Household | 285 | 48.5% |
| 3-Person Household | 127 | 21.6% |
| 4+ Person Household | 108 | 18.4% |
| Total Housing Units | 588 | 100.0% |
Occupancy by Ownership by Household Size in Buxton
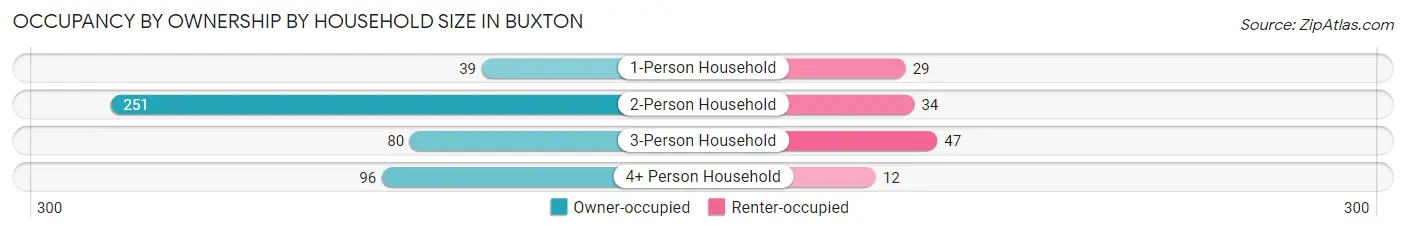
| Household Size | Owner-occupied | Renter-occupied |
| 1-Person Household | 39 (57.4%) | 29 (42.6%) |
| 2-Person Household | 251 (88.1%) | 34 (11.9%) |
| 3-Person Household | 80 (63.0%) | 47 (37.0%) |
| 4+ Person Household | 96 (88.9%) | 12 (11.1%) |
| Total Housing Units | 466 (79.2%) | 122 (20.7%) |
Occupancy by Educational Attainment in Buxton
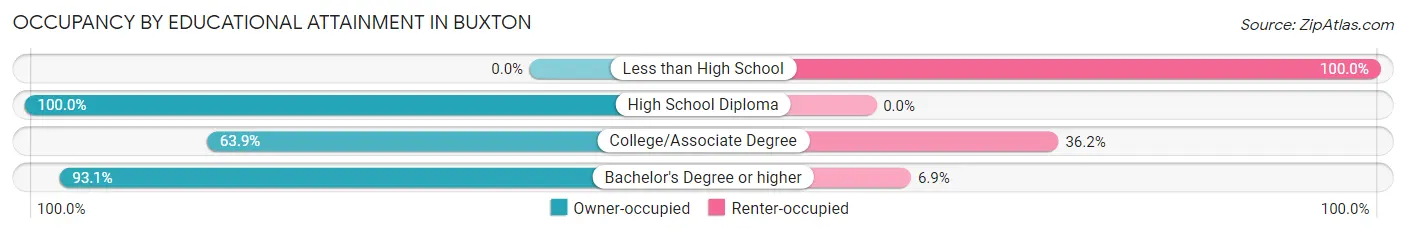
| Household Size | Owner-occupied | Renter-occupied |
| Less than High School | 0 (0.0%) | 14 (100.0%) |
| High School Diploma | 111 (100.0%) | 0 (0.0%) |
| College/Associate Degree | 166 (63.8%) | 94 (36.1%) |
| Bachelor's Degree or higher | 189 (93.1%) | 14 (6.9%) |
Occupancy by Age of Householder in Buxton
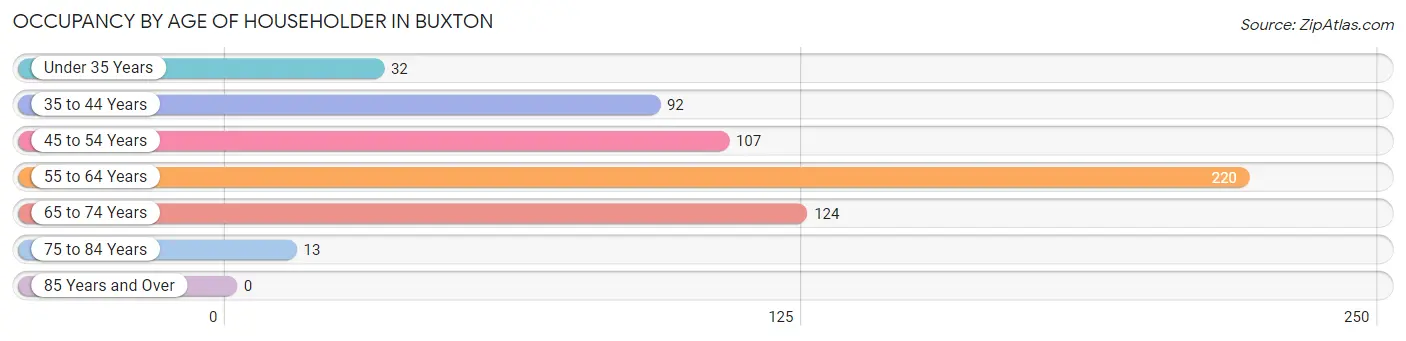
| Age Bracket | # Households | % Households |
| Under 35 Years | 32 | 5.4% |
| 35 to 44 Years | 92 | 15.7% |
| 45 to 54 Years | 107 | 18.2% |
| 55 to 64 Years | 220 | 37.4% |
| 65 to 74 Years | 124 | 21.1% |
| 75 to 84 Years | 13 | 2.2% |
| 85 Years and Over | 0 | 0.0% |
| Total | 588 | 100.0% |
Housing Finances in Buxton
Median Income by Occupancy in Buxton
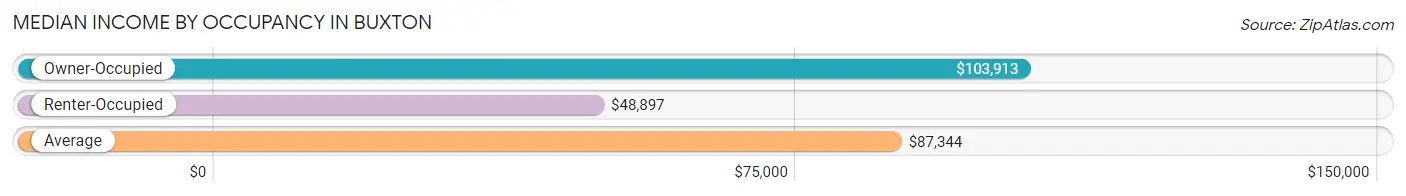
| Occupancy Type | # Households | Median Income |
| Owner-Occupied | 466 (79.2%) | $103,913 |
| Renter-Occupied | 122 (20.7%) | $48,897 |
| Average | 588 (100.0%) | $87,344 |
Occupancy by Householder Income Bracket in Buxton
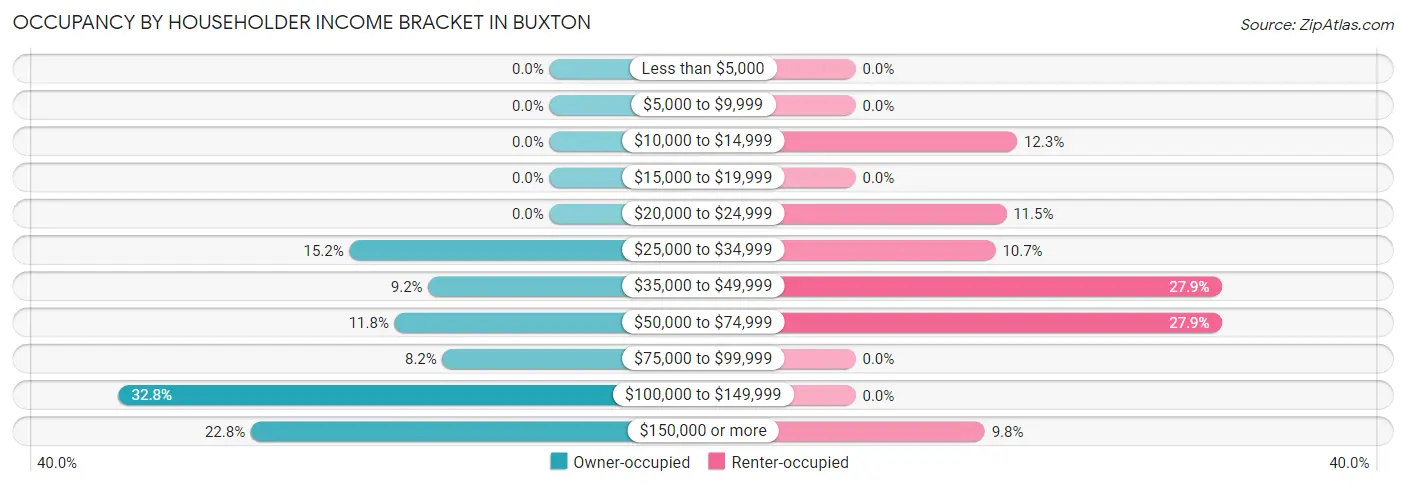
| Income Bracket | Owner-occupied | Renter-occupied |
| Less than $5,000 | 0 (0.0%) | 0 (0.0%) |
| $5,000 to $9,999 | 0 (0.0%) | 0 (0.0%) |
| $10,000 to $14,999 | 0 (0.0%) | 15 (12.3%) |
| $15,000 to $19,999 | 0 (0.0%) | 0 (0.0%) |
| $20,000 to $24,999 | 0 (0.0%) | 14 (11.5%) |
| $25,000 to $34,999 | 71 (15.2%) | 13 (10.7%) |
| $35,000 to $49,999 | 43 (9.2%) | 34 (27.9%) |
| $50,000 to $74,999 | 55 (11.8%) | 34 (27.9%) |
| $75,000 to $99,999 | 38 (8.2%) | 0 (0.0%) |
| $100,000 to $149,999 | 153 (32.8%) | 0 (0.0%) |
| $150,000 or more | 106 (22.8%) | 12 (9.8%) |
| Total | 466 (100.0%) | 122 (100.0%) |
Monthly Housing Cost Tiers in Buxton
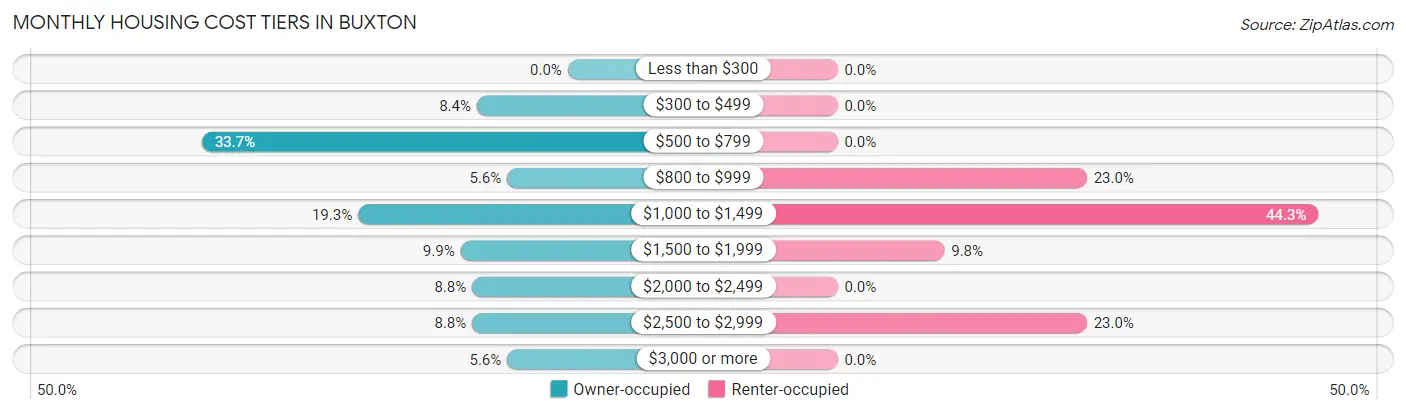
| Monthly Cost | Owner-occupied | Renter-occupied |
| Less than $300 | 0 (0.0%) | 0 (0.0%) |
| $300 to $499 | 39 (8.4%) | 0 (0.0%) |
| $500 to $799 | 157 (33.7%) | 0 (0.0%) |
| $800 to $999 | 26 (5.6%) | 28 (23.0%) |
| $1,000 to $1,499 | 90 (19.3%) | 54 (44.3%) |
| $1,500 to $1,999 | 46 (9.9%) | 12 (9.8%) |
| $2,000 to $2,499 | 41 (8.8%) | 0 (0.0%) |
| $2,500 to $2,999 | 41 (8.8%) | 28 (23.0%) |
| $3,000 or more | 26 (5.6%) | 0 (0.0%) |
| Total | 466 (100.0%) | 122 (100.0%) |
Physical Housing Characteristics in Buxton
Housing Structures in Buxton
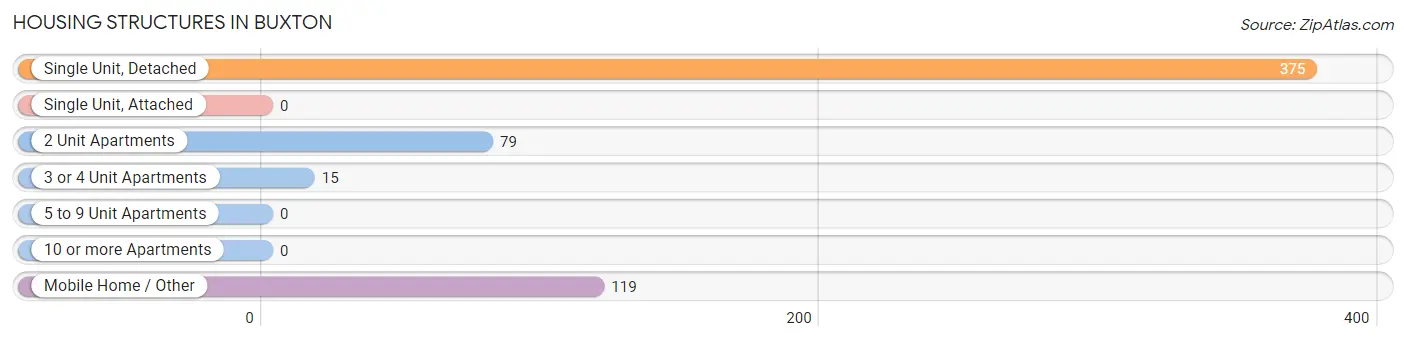
| Structure Type | # Housing Units | % Housing Units |
| Single Unit, Detached | 375 | 63.8% |
| Single Unit, Attached | 0 | 0.0% |
| 2 Unit Apartments | 79 | 13.4% |
| 3 or 4 Unit Apartments | 15 | 2.5% |
| 5 to 9 Unit Apartments | 0 | 0.0% |
| 10 or more Apartments | 0 | 0.0% |
| Mobile Home / Other | 119 | 20.2% |
| Total | 588 | 100.0% |
Housing Structures by Occupancy in Buxton
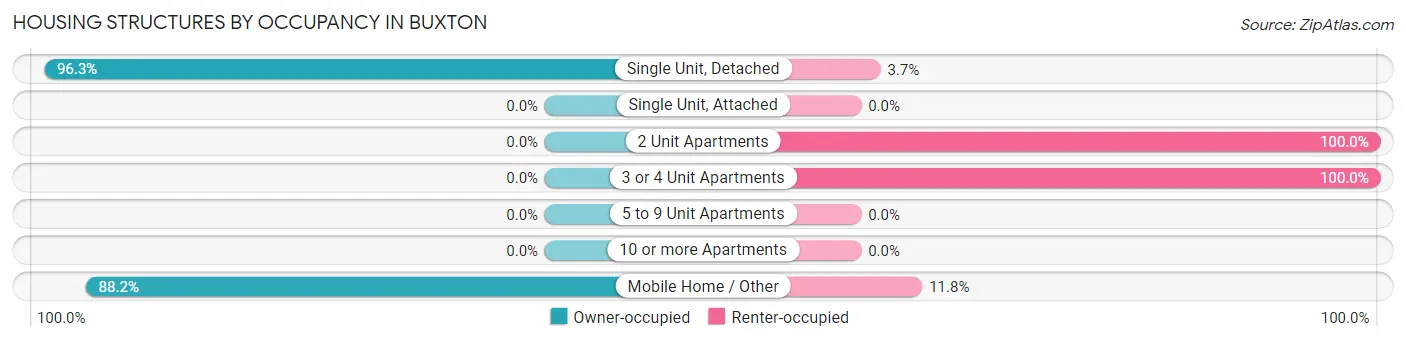
| Structure Type | Owner-occupied | Renter-occupied |
| Single Unit, Detached | 361 (96.3%) | 14 (3.7%) |
| Single Unit, Attached | 0 (0.0%) | 0 (0.0%) |
| 2 Unit Apartments | 0 (0.0%) | 79 (100.0%) |
| 3 or 4 Unit Apartments | 0 (0.0%) | 15 (100.0%) |
| 5 to 9 Unit Apartments | 0 (0.0%) | 0 (0.0%) |
| 10 or more Apartments | 0 (0.0%) | 0 (0.0%) |
| Mobile Home / Other | 105 (88.2%) | 14 (11.8%) |
| Total | 466 (79.2%) | 122 (20.7%) |
Housing Structures by Number of Rooms in Buxton
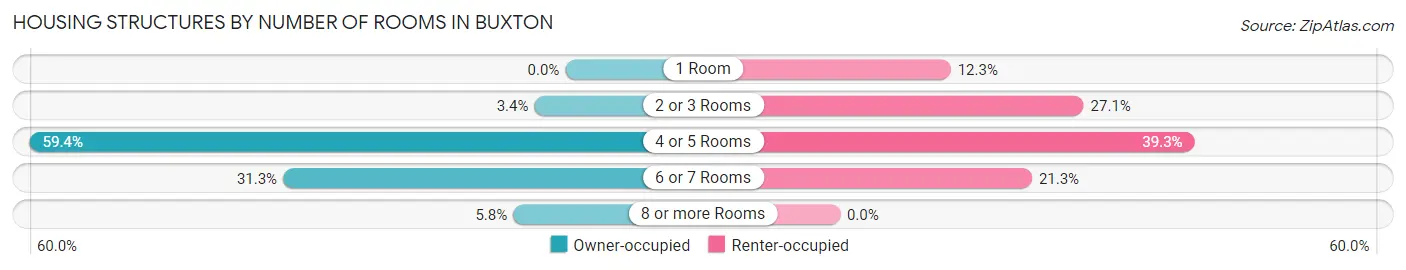
| Number of Rooms | Owner-occupied | Renter-occupied |
| 1 Room | 0 (0.0%) | 15 (12.3%) |
| 2 or 3 Rooms | 16 (3.4%) | 33 (27.1%) |
| 4 or 5 Rooms | 277 (59.4%) | 48 (39.3%) |
| 6 or 7 Rooms | 146 (31.3%) | 26 (21.3%) |
| 8 or more Rooms | 27 (5.8%) | 0 (0.0%) |
| Total | 466 (100.0%) | 122 (100.0%) |
Housing Structure by Heating Type in Buxton
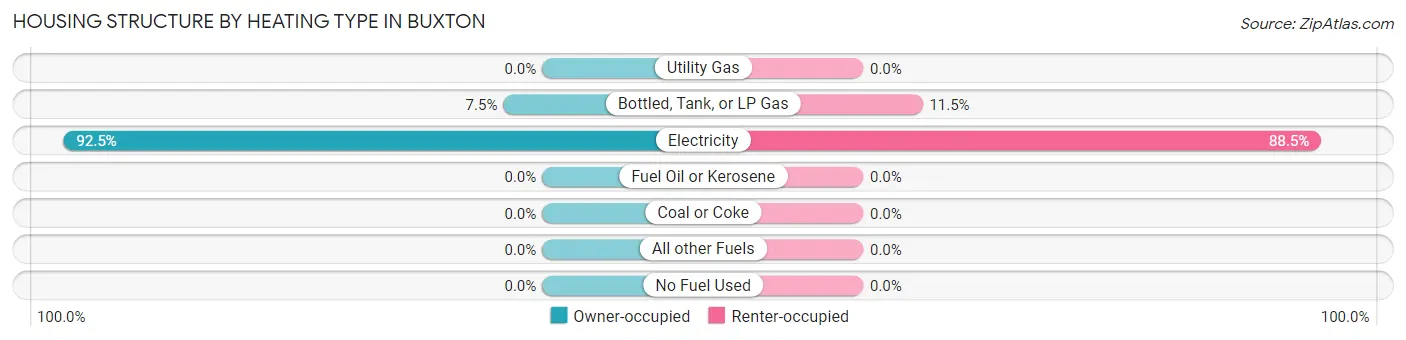
| Heating Type | Owner-occupied | Renter-occupied |
| Utility Gas | 0 (0.0%) | 0 (0.0%) |
| Bottled, Tank, or LP Gas | 35 (7.5%) | 14 (11.5%) |
| Electricity | 431 (92.5%) | 108 (88.5%) |
| Fuel Oil or Kerosene | 0 (0.0%) | 0 (0.0%) |
| Coal or Coke | 0 (0.0%) | 0 (0.0%) |
| All other Fuels | 0 (0.0%) | 0 (0.0%) |
| No Fuel Used | 0 (0.0%) | 0 (0.0%) |
| Total | 466 (100.0%) | 122 (100.0%) |
Household Vehicle Usage in Buxton
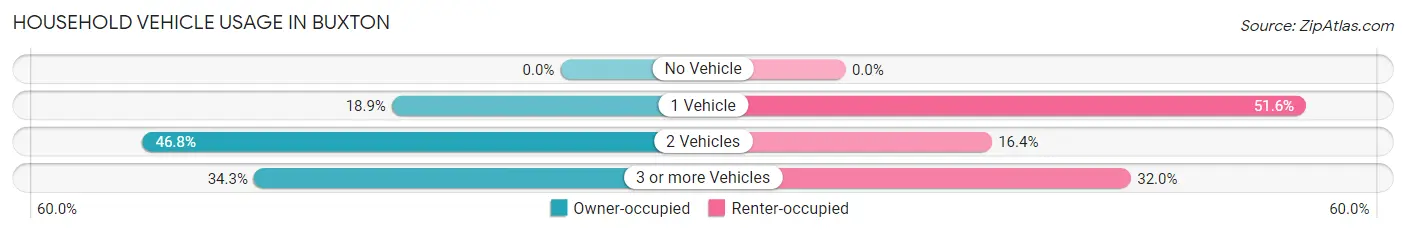
| Vehicles per Household | Owner-occupied | Renter-occupied |
| No Vehicle | 0 (0.0%) | 0 (0.0%) |
| 1 Vehicle | 88 (18.9%) | 63 (51.6%) |
| 2 Vehicles | 218 (46.8%) | 20 (16.4%) |
| 3 or more Vehicles | 160 (34.3%) | 39 (32.0%) |
| Total | 466 (100.0%) | 122 (100.0%) |
Real Estate & Mortgages in Buxton
Real Estate and Mortgage Overview in Buxton
| Characteristic | Without Mortgage | With Mortgage |
| Housing Units | 210 | 256 |
| Median Property Value | $295,700 | $359,600 |
| Median Household Income | $102,935 | $78 |
| Monthly Housing Costs | $588 | $26 |
| Real Estate Taxes | $1,755 | $0 |
Property Value by Mortgage Status in Buxton
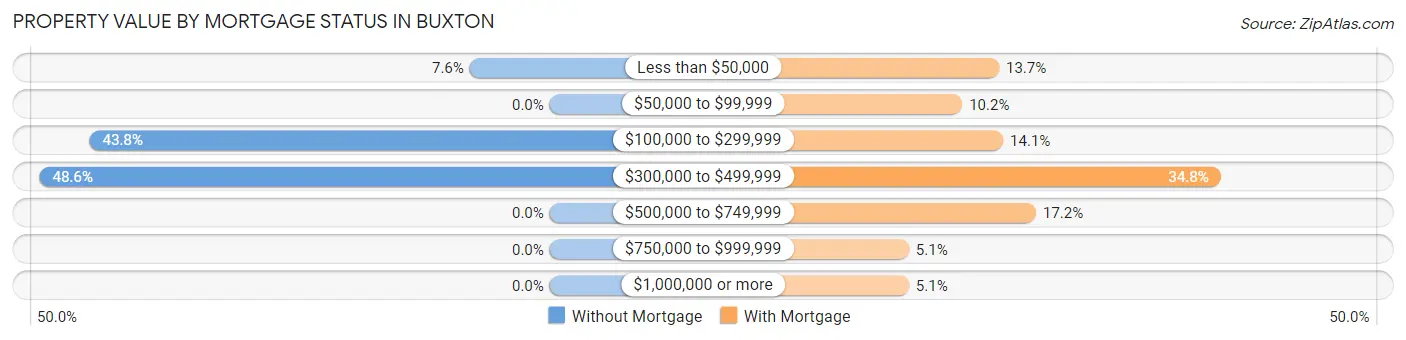
| Property Value | Without Mortgage | With Mortgage |
| Less than $50,000 | 16 (7.6%) | 35 (13.7%) |
| $50,000 to $99,999 | 0 (0.0%) | 26 (10.2%) |
| $100,000 to $299,999 | 92 (43.8%) | 36 (14.1%) |
| $300,000 to $499,999 | 102 (48.6%) | 89 (34.8%) |
| $500,000 to $749,999 | 0 (0.0%) | 44 (17.2%) |
| $750,000 to $999,999 | 0 (0.0%) | 13 (5.1%) |
| $1,000,000 or more | 0 (0.0%) | 13 (5.1%) |
| Total | 210 (100.0%) | 256 (100.0%) |
Household Income by Mortgage Status in Buxton
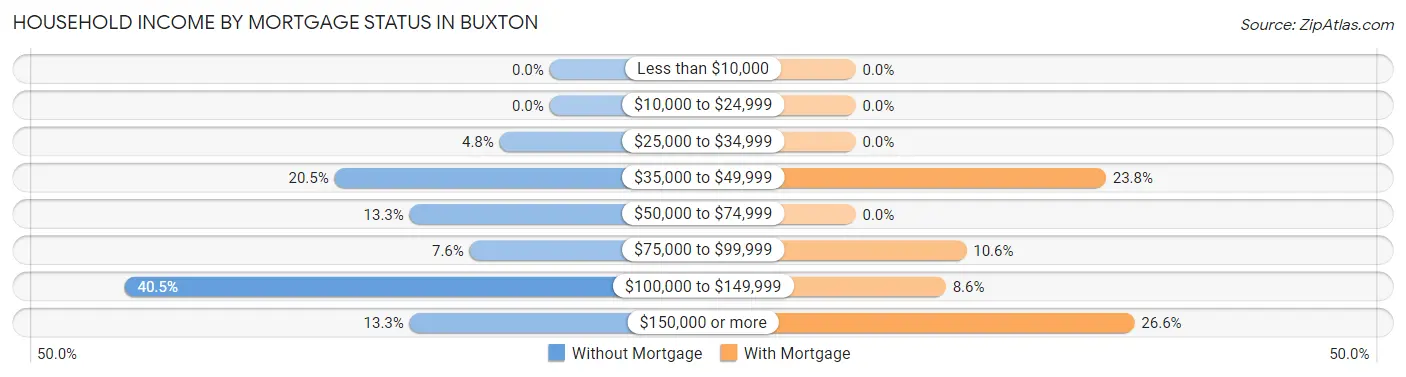
| Household Income | Without Mortgage | With Mortgage |
| Less than $10,000 | 0 (0.0%) | 0 (0.0%) |
| $10,000 to $24,999 | 0 (0.0%) | 0 (0.0%) |
| $25,000 to $34,999 | 10 (4.8%) | 0 (0.0%) |
| $35,000 to $49,999 | 43 (20.5%) | 61 (23.8%) |
| $50,000 to $74,999 | 28 (13.3%) | 0 (0.0%) |
| $75,000 to $99,999 | 16 (7.6%) | 27 (10.5%) |
| $100,000 to $149,999 | 85 (40.5%) | 22 (8.6%) |
| $150,000 or more | 28 (13.3%) | 68 (26.6%) |
| Total | 210 (100.0%) | 256 (100.0%) |
Property Value to Household Income Ratio in Buxton
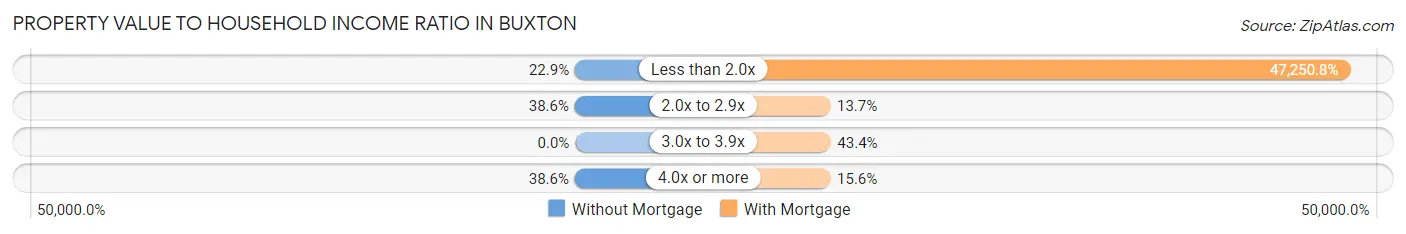
| Value-to-Income Ratio | Without Mortgage | With Mortgage |
| Less than 2.0x | 48 (22.9%) | 120,962 (47,250.8%) |
| 2.0x to 2.9x | 81 (38.6%) | 35 (13.7%) |
| 3.0x to 3.9x | 0 (0.0%) | 111 (43.4%) |
| 4.0x or more | 81 (38.6%) | 40 (15.6%) |
| Total | 210 (100.0%) | 256 (100.0%) |
Real Estate Taxes by Mortgage Status in Buxton
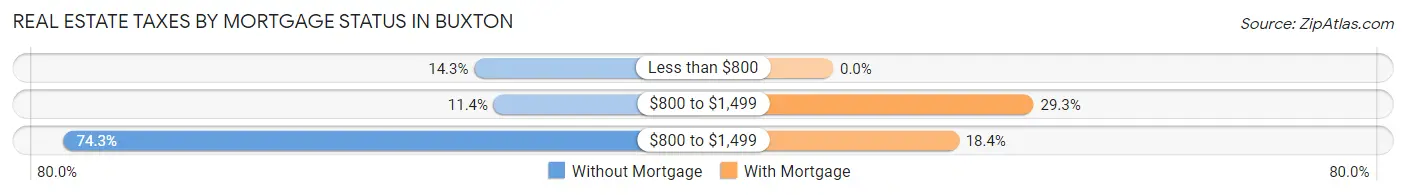
| Property Taxes | Without Mortgage | With Mortgage |
| Less than $800 | 30 (14.3%) | 0 (0.0%) |
| $800 to $1,499 | 24 (11.4%) | 75 (29.3%) |
| $800 to $1,499 | 156 (74.3%) | 47 (18.4%) |
| Total | 210 (100.0%) | 256 (100.0%) |
Health & Disability in Buxton
Health Insurance Coverage by Age in Buxton
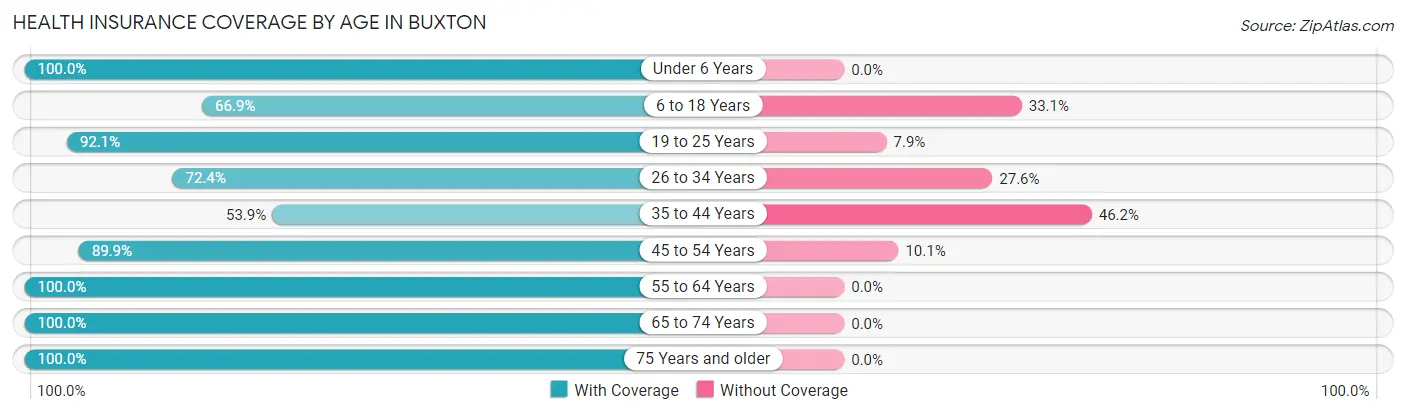
| Age Bracket | With Coverage | Without Coverage |
| Under 6 Years | 13 (100.0%) | 0 (0.0%) |
| 6 to 18 Years | 194 (66.9%) | 96 (33.1%) |
| 19 to 25 Years | 105 (92.1%) | 9 (7.9%) |
| 26 to 34 Years | 118 (72.4%) | 45 (27.6%) |
| 35 to 44 Years | 70 (53.8%) | 60 (46.2%) |
| 45 to 54 Years | 169 (89.9%) | 19 (10.1%) |
| 55 to 64 Years | 373 (100.0%) | 0 (0.0%) |
| 65 to 74 Years | 185 (100.0%) | 0 (0.0%) |
| 75 Years and older | 21 (100.0%) | 0 (0.0%) |
| Total | 1,248 (84.5%) | 229 (15.5%) |
Health Insurance Coverage by Citizenship Status in Buxton
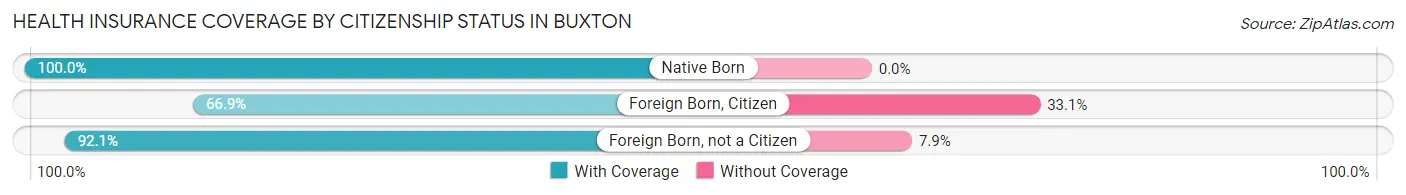
| Citizenship Status | With Coverage | Without Coverage |
| Native Born | 13 (100.0%) | 0 (0.0%) |
| Foreign Born, Citizen | 194 (66.9%) | 96 (33.1%) |
| Foreign Born, not a Citizen | 105 (92.1%) | 9 (7.9%) |
Health Insurance Coverage by Household Income in Buxton
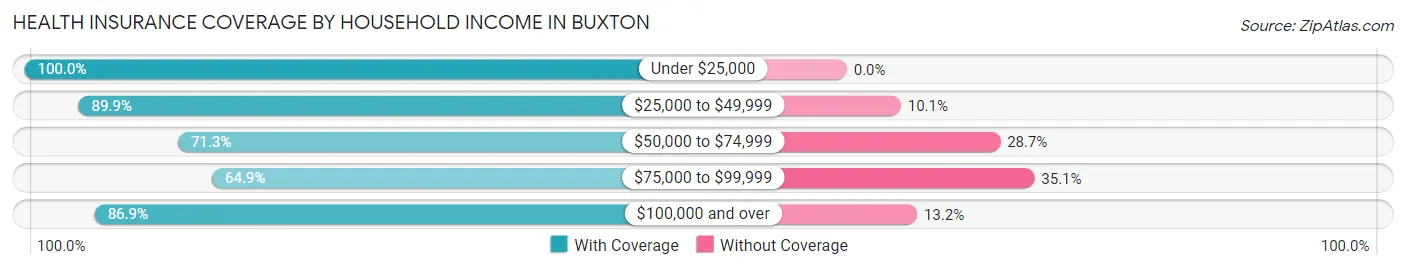
| Household Income | With Coverage | Without Coverage |
| Under $25,000 | 59 (100.0%) | 0 (0.0%) |
| $25,000 to $49,999 | 311 (89.9%) | 35 (10.1%) |
| $50,000 to $74,999 | 119 (71.3%) | 48 (28.7%) |
| $75,000 to $99,999 | 72 (64.9%) | 39 (35.1%) |
| $100,000 and over | 687 (86.9%) | 104 (13.2%) |
Public vs Private Health Insurance Coverage by Age in Buxton
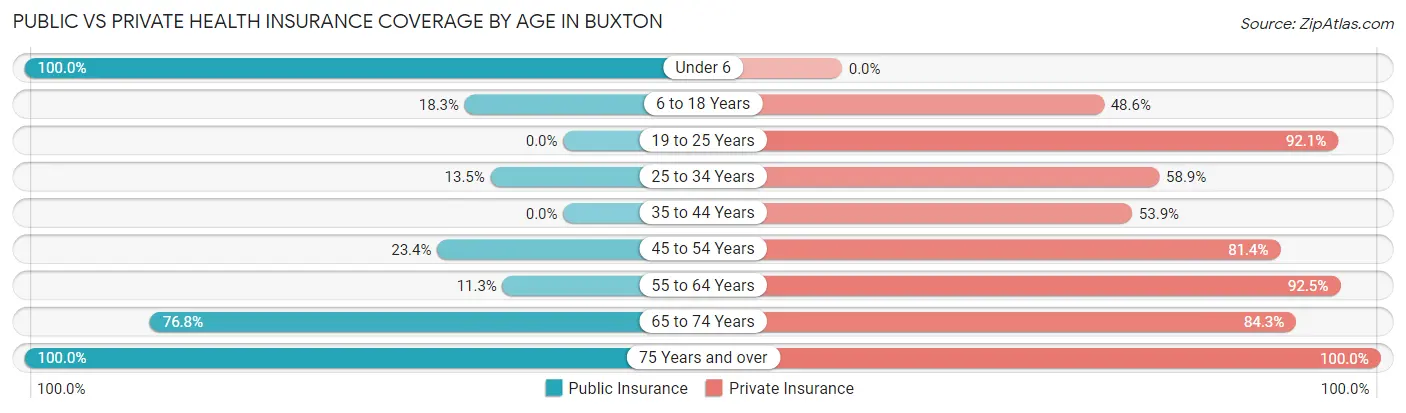
| Age Bracket | Public Insurance | Private Insurance |
| Under 6 | 13 (100.0%) | 0 (0.0%) |
| 6 to 18 Years | 53 (18.3%) | 141 (48.6%) |
| 19 to 25 Years | 0 (0.0%) | 105 (92.1%) |
| 25 to 34 Years | 22 (13.5%) | 96 (58.9%) |
| 35 to 44 Years | 0 (0.0%) | 70 (53.8%) |
| 45 to 54 Years | 44 (23.4%) | 153 (81.4%) |
| 55 to 64 Years | 42 (11.3%) | 345 (92.5%) |
| 65 to 74 Years | 142 (76.8%) | 156 (84.3%) |
| 75 Years and over | 21 (100.0%) | 21 (100.0%) |
| Total | 337 (22.8%) | 1,087 (73.6%) |
Disability Status by Sex by Age in Buxton
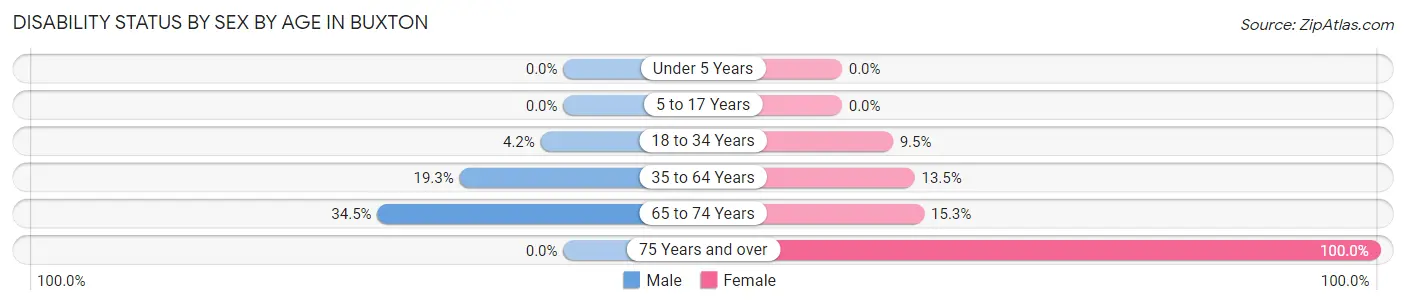
| Age Bracket | Male | Female |
| Under 5 Years | 0 (0.0%) | 0 (0.0%) |
| 5 to 17 Years | 0 (0.0%) | 0 (0.0%) |
| 18 to 34 Years | 10 (4.2%) | 12 (9.5%) |
| 35 to 64 Years | 69 (19.3%) | 45 (13.5%) |
| 65 to 74 Years | 39 (34.5%) | 11 (15.3%) |
| 75 Years and over | 0 (0.0%) | 8 (100.0%) |
Disability Class by Sex by Age in Buxton
Disability Class: Hearing Difficulty
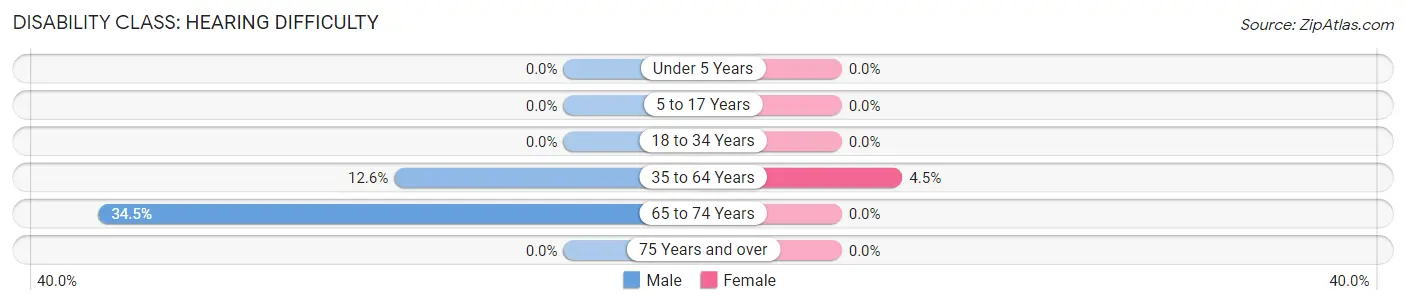
| Age Bracket | Male | Female |
| Under 5 Years | 0 (0.0%) | 0 (0.0%) |
| 5 to 17 Years | 0 (0.0%) | 0 (0.0%) |
| 18 to 34 Years | 0 (0.0%) | 0 (0.0%) |
| 35 to 64 Years | 45 (12.6%) | 15 (4.5%) |
| 65 to 74 Years | 39 (34.5%) | 0 (0.0%) |
| 75 Years and over | 0 (0.0%) | 0 (0.0%) |
Disability Class: Vision Difficulty
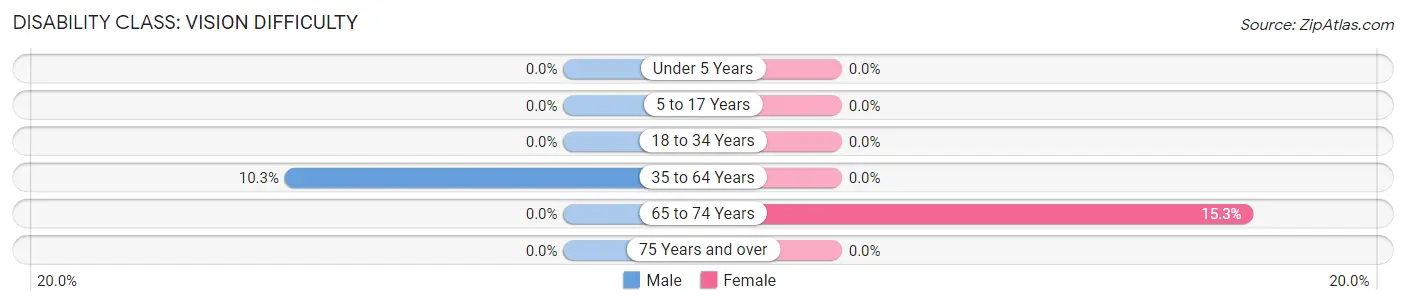
| Age Bracket | Male | Female |
| Under 5 Years | 0 (0.0%) | 0 (0.0%) |
| 5 to 17 Years | 0 (0.0%) | 0 (0.0%) |
| 18 to 34 Years | 0 (0.0%) | 0 (0.0%) |
| 35 to 64 Years | 37 (10.3%) | 0 (0.0%) |
| 65 to 74 Years | 0 (0.0%) | 11 (15.3%) |
| 75 Years and over | 0 (0.0%) | 0 (0.0%) |
Disability Class: Cognitive Difficulty
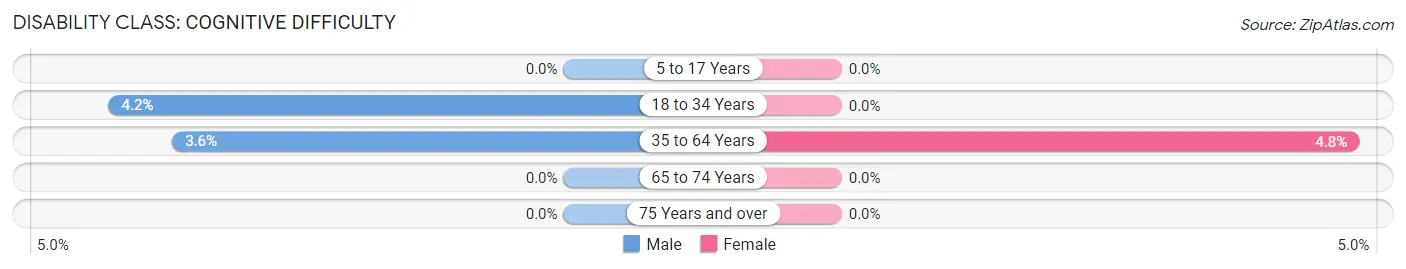
| Age Bracket | Male | Female |
| 5 to 17 Years | 0 (0.0%) | 0 (0.0%) |
| 18 to 34 Years | 10 (4.2%) | 0 (0.0%) |
| 35 to 64 Years | 13 (3.6%) | 16 (4.8%) |
| 65 to 74 Years | 0 (0.0%) | 0 (0.0%) |
| 75 Years and over | 0 (0.0%) | 0 (0.0%) |
Disability Class: Ambulatory Difficulty
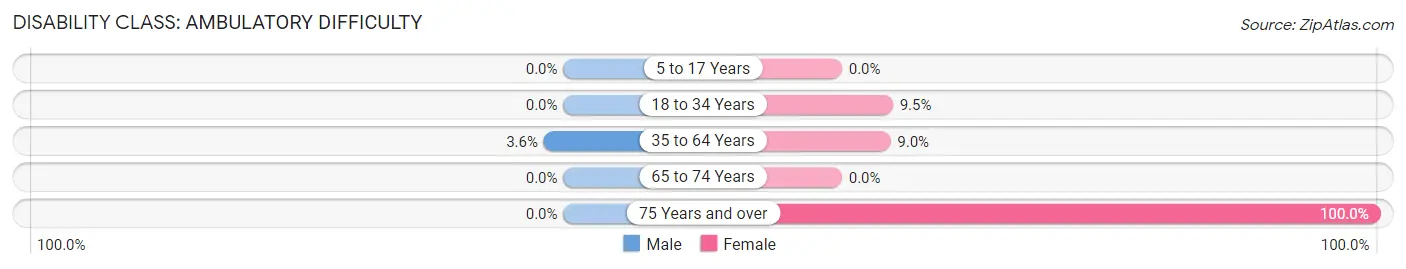
| Age Bracket | Male | Female |
| 5 to 17 Years | 0 (0.0%) | 0 (0.0%) |
| 18 to 34 Years | 0 (0.0%) | 12 (9.5%) |
| 35 to 64 Years | 13 (3.6%) | 30 (9.0%) |
| 65 to 74 Years | 0 (0.0%) | 0 (0.0%) |
| 75 Years and over | 0 (0.0%) | 8 (100.0%) |
Disability Class: Self-Care Difficulty
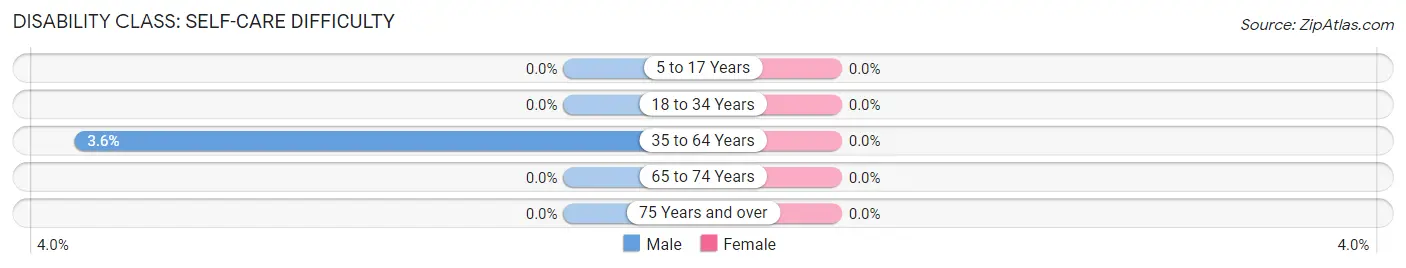
| Age Bracket | Male | Female |
| 5 to 17 Years | 0 (0.0%) | 0 (0.0%) |
| 18 to 34 Years | 0 (0.0%) | 0 (0.0%) |
| 35 to 64 Years | 13 (3.6%) | 0 (0.0%) |
| 65 to 74 Years | 0 (0.0%) | 0 (0.0%) |
| 75 Years and over | 0 (0.0%) | 0 (0.0%) |
Technology Access in Buxton
Computing Device Access in Buxton
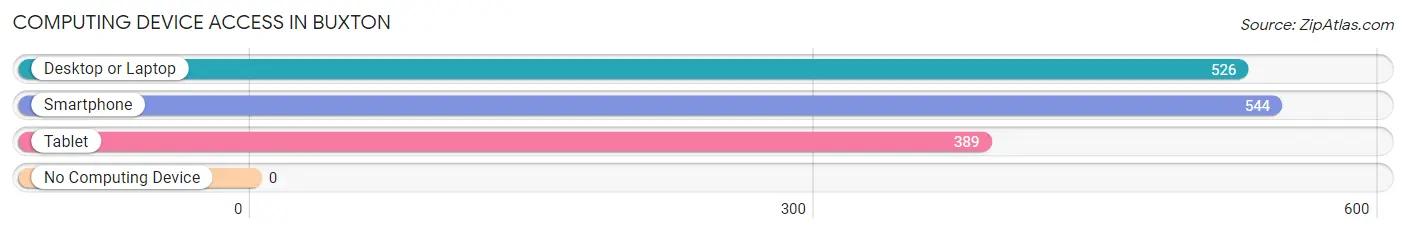
| Device Type | # Households | % Households |
| Desktop or Laptop | 526 | 89.5% |
| Smartphone | 544 | 92.5% |
| Tablet | 389 | 66.2% |
| No Computing Device | 0 | 0.0% |
| Total | 588 | 100.0% |
Internet Access in Buxton
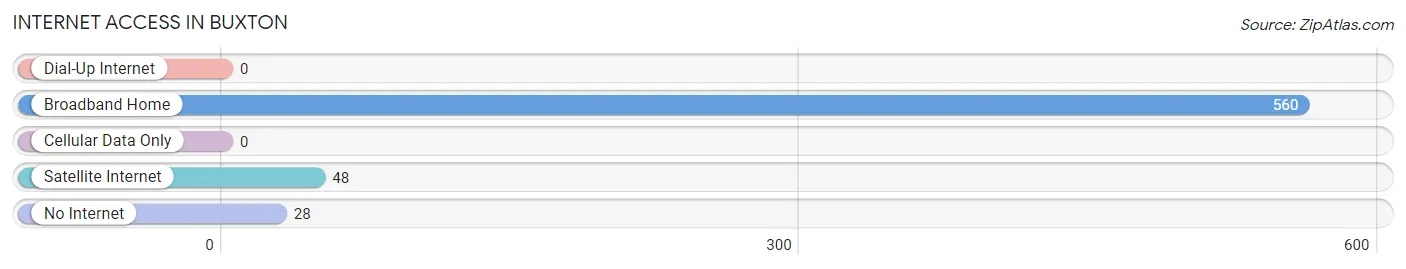
| Internet Type | # Households | % Households |
| Dial-Up Internet | 0 | 0.0% |
| Broadband Home | 560 | 95.2% |
| Cellular Data Only | 0 | 0.0% |
| Satellite Internet | 48 | 8.2% |
| No Internet | 28 | 4.8% |
| Total | 588 | 100.0% |
Buxton Summary
Buxton is a small unincorporated community located in Dare County, North Carolina. It is situated on the Outer Banks, a chain of barrier islands off the coast of North Carolina. The town is located on Hatteras Island, the largest of the barrier islands, and is the southernmost town in Dare County. Buxton is known for its beautiful beaches, fishing, and surfing.
History
The area that is now Buxton was first inhabited by Native Americans, including the Croatan, Hatteras, and Pamlico tribes. The first European settlers arrived in the area in the late 1600s, and the town of Buxton was officially established in 1720. The town was named after the nearby Cape Buxton, which was named after the British explorer William Buxton.
In the early 1800s, Buxton was a thriving port town, with a bustling fishing industry and a large number of ships coming and going. The town was also home to a number of shipbuilding companies, and the local economy was largely based on the maritime industry.
In the late 1800s, the town began to decline as the fishing industry moved elsewhere. The town was largely abandoned by the early 1900s, and the population dwindled to just a few hundred people.
In the mid-1900s, the town began to experience a resurgence as tourists began to flock to the area. The town was incorporated in 1953, and the population has grown steadily since then.
Geography
Buxton is located on the Outer Banks of North Carolina, on Hatteras Island. The town is situated on the northern end of the island, and is bordered by the Atlantic Ocean to the east and the Pamlico Sound to the west.
The town is located in a temperate climate, with mild winters and warm summers. The average temperature in the summer is around 80 degrees Fahrenheit, and the average temperature in the winter is around 50 degrees Fahrenheit.
The town is located in a hurricane-prone area, and is vulnerable to storms and flooding. The town has experienced several major hurricanes in recent years, including Hurricane Isabel in 2003 and Hurricane Irene in 2011.
Economy
The economy of Buxton is largely based on tourism. The town is home to several popular beaches, and is a popular destination for fishing, surfing, and other outdoor activities. The town is also home to a number of restaurants, shops, and other businesses catering to tourists.
The town is also home to a number of commercial fishing operations, and the local economy is supported by the fishing industry.
Demographics
As of the 2010 census, the population of Buxton was 1,845. The population is largely white (94.3%), with a small minority population (5.7%). The median household income is $45,000, and the median age is 44.
Conclusion
Buxton is a small unincorporated community located on the Outer Banks of North Carolina. The town is known for its beautiful beaches, fishing, and surfing, and is a popular tourist destination. The local economy is largely based on tourism and fishing, and the population is largely white. Buxton is vulnerable to storms and flooding, and has experienced several major hurricanes in recent years.
Common Questions
What is Per Capita Income in Buxton?
Per Capita income in Buxton is $38,916.
What is the Median Family Income in Buxton?
Median Family Income in Buxton is $103,179.
What is the Median Household income in Buxton?
Median Household Income in Buxton is $87,344.
What is Income or Wage Gap in Buxton?
Income or Wage Gap in Buxton is 14.5%.
Women in Buxton earn 85.5 cents for every dollar earned by a man.
What is Inequality or Gini Index in Buxton?
Inequality or Gini Index in Buxton is 0.34.
What is the Total Population of Buxton?
Total Population of Buxton is 1,477.
What is the Total Male Population of Buxton?
Total Male Population of Buxton is 774.
What is the Total Female Population of Buxton?
Total Female Population of Buxton is 703.
What is the Ratio of Males per 100 Females in Buxton?
There are 110.10 Males per 100 Females in Buxton.
What is the Ratio of Females per 100 Males in Buxton?
There are 90.83 Females per 100 Males in Buxton.
What is the Median Population Age in Buxton?
Median Population Age in Buxton is 46.5 Years.
What is the Average Family Size in Buxton
Average Family Size in Buxton is 2.7 People.
What is the Average Household Size in Buxton
Average Household Size in Buxton is 2.5 People.
How Large is the Labor Force in Buxton?
There are 907 People in the Labor Forcein in Buxton.
What is the Percentage of People in the Labor Force in Buxton?
70.5% of People are in the Labor Force in Buxton.
What is the Unemployment Rate in Buxton?
Unemployment Rate in Buxton is 3.0%.