Peachland, NC Map & Demographics
Peachland Map
Peachland Overview
$25,484
PER CAPITA INCOME
$73,125
AVG FAMILY INCOME
$70,096
AVG HOUSEHOLD INCOME
23.8%
WAGE / INCOME GAP [ % ]
76.2¢/ $1
WAGE / INCOME GAP [ $ ]
0.37
INEQUALITY / GINI INDEX
465
TOTAL POPULATION
295
MALE POPULATION
170
FEMALE POPULATION
173.53
MALES / 100 FEMALES
57.63
FEMALES / 100 MALES
37.6
MEDIAN AGE
3.7
AVG FAMILY SIZE
3.2
AVG HOUSEHOLD SIZE
159
LABOR FORCE [ PEOPLE ]
39.2%
PERCENT IN LABOR FORCE
1.3%
UNEMPLOYMENT RATE
Peachland Zip Codes
Peachland Area Codes
Income in Peachland
Income Overview in Peachland
Per Capita Income in Peachland is $25,484, while median incomes of families and households are $73,125 and $70,096 respectively.
| Characteristic | Number | Measure |
| Per Capita Income | 465 | $25,484 |
| Median Family Income | 117 | $73,125 |
| Mean Family Income | 117 | $79,340 |
| Median Household Income | 145 | $70,096 |
| Mean Household Income | 145 | $70,134 |
| Income Deficit | 117 | $0 |
| Wage / Income Gap (%) | 465 | 23.84% |
| Wage / Income Gap ($) | 465 | 76.16¢ per $1 |
| Gini / Inequality Index | 465 | 0.37 |
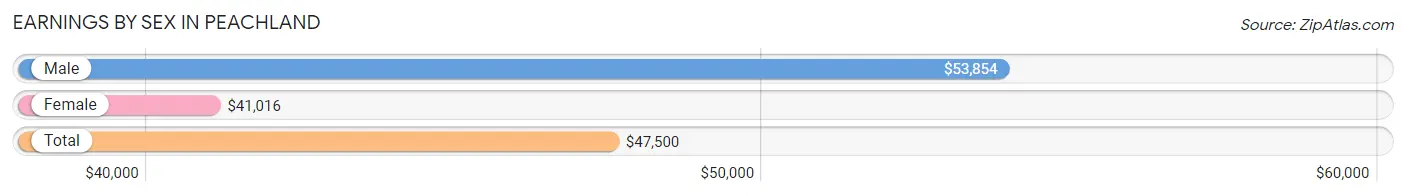
Earnings by Sex in Peachland
Average Earnings in Peachland are $47,500, $53,854 for men and $41,016 for women, a difference of 23.8%.
| Sex | Number | Average Earnings |
| Male | 79 (48.8%) | $53,854 |
| Female | 83 (51.2%) | $41,016 |
| Total | 162 (100.0%) | $47,500 |
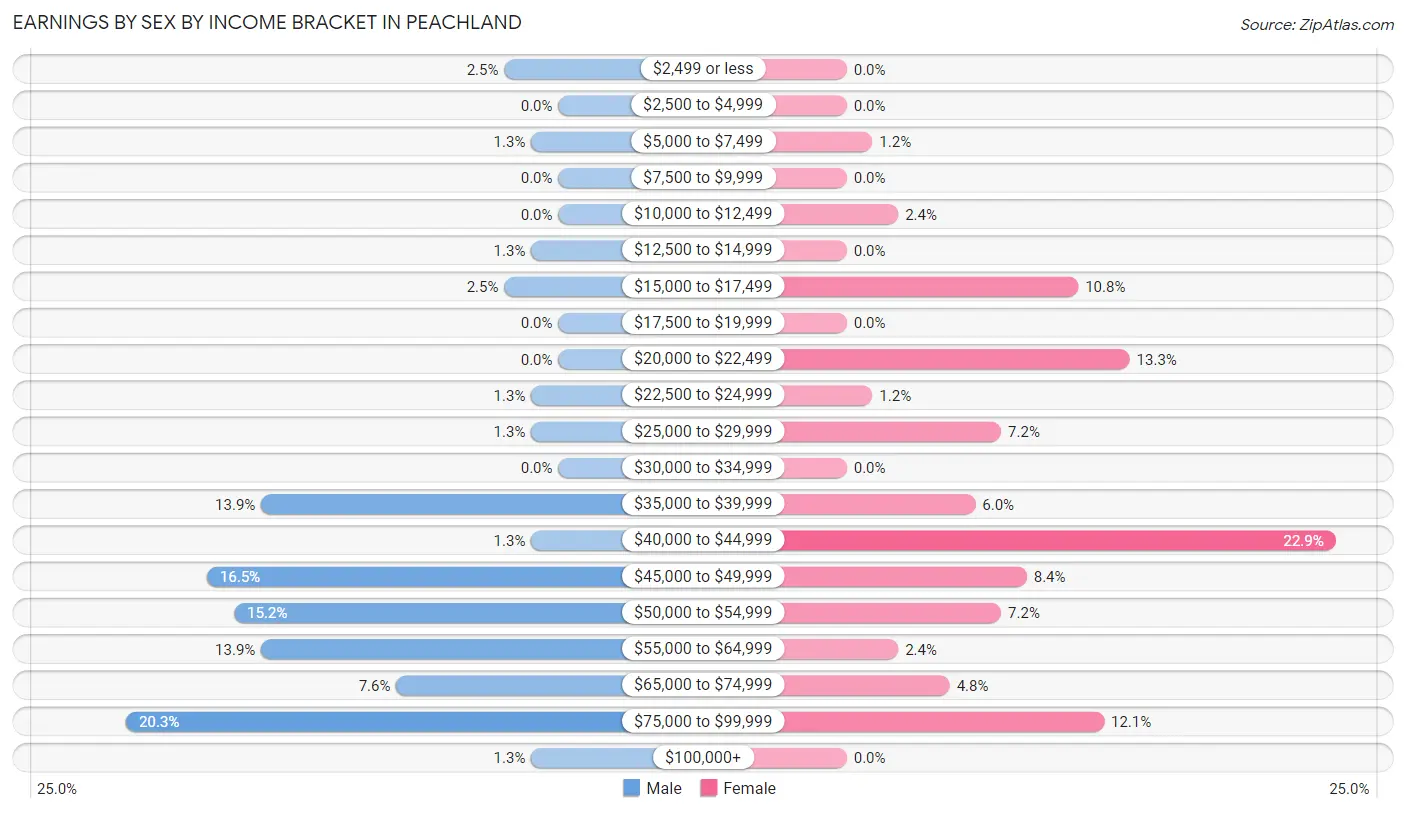
Earnings by Sex by Income Bracket in Peachland
The most common earnings brackets in Peachland are $75,000 to $99,999 for men (16 | 20.3%) and $40,000 to $44,999 for women (19 | 22.9%).
| Income | Male | Female |
| $2,499 or less | 2 (2.5%) | 0 (0.0%) |
| $2,500 to $4,999 | 0 (0.0%) | 0 (0.0%) |
| $5,000 to $7,499 | 1 (1.3%) | 1 (1.2%) |
| $7,500 to $9,999 | 0 (0.0%) | 0 (0.0%) |
| $10,000 to $12,499 | 0 (0.0%) | 2 (2.4%) |
| $12,500 to $14,999 | 1 (1.3%) | 0 (0.0%) |
| $15,000 to $17,499 | 2 (2.5%) | 9 (10.8%) |
| $17,500 to $19,999 | 0 (0.0%) | 0 (0.0%) |
| $20,000 to $22,499 | 0 (0.0%) | 11 (13.3%) |
| $22,500 to $24,999 | 1 (1.3%) | 1 (1.2%) |
| $25,000 to $29,999 | 1 (1.3%) | 6 (7.2%) |
| $30,000 to $34,999 | 0 (0.0%) | 0 (0.0%) |
| $35,000 to $39,999 | 11 (13.9%) | 5 (6.0%) |
| $40,000 to $44,999 | 1 (1.3%) | 19 (22.9%) |
| $45,000 to $49,999 | 13 (16.5%) | 7 (8.4%) |
| $50,000 to $54,999 | 12 (15.2%) | 6 (7.2%) |
| $55,000 to $64,999 | 11 (13.9%) | 2 (2.4%) |
| $65,000 to $74,999 | 6 (7.6%) | 4 (4.8%) |
| $75,000 to $99,999 | 16 (20.3%) | 10 (12.0%) |
| $100,000+ | 1 (1.3%) | 0 (0.0%) |
| Total | 79 (100.0%) | 83 (100.0%) |
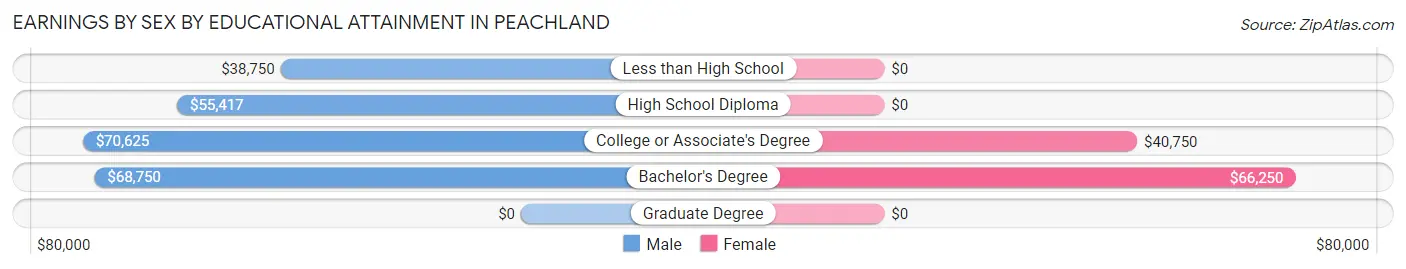
Earnings by Sex by Educational Attainment in Peachland
Average earnings in Peachland are $53,958 for men and $41,016 for women, a difference of 24.0%. Men with an educational attainment of college or associate's degree enjoy the highest average annual earnings of $70,625, while those with less than high school education earn the least with $38,750. Women with an educational attainment of bachelor's degree earn the most with the average annual earnings of $66,250, while those with college or associate's degree education have the smallest earnings of $40,750.
| Educational Attainment | Male Income | Female Income |
| Less than High School | $38,750 | $0 |
| High School Diploma | $55,417 | $0 |
| College or Associate's Degree | $70,625 | $40,750 |
| Bachelor's Degree | $68,750 | $66,250 |
| Graduate Degree | - | - |
| Total | $53,958 | $41,016 |
Family Income in Peachland
Family Income Brackets in Peachland
According to the Peachland family income data, there are 30 families falling into the $100,000 to $149,999 income range, which is the most common income bracket and makes up 25.6% of all families.
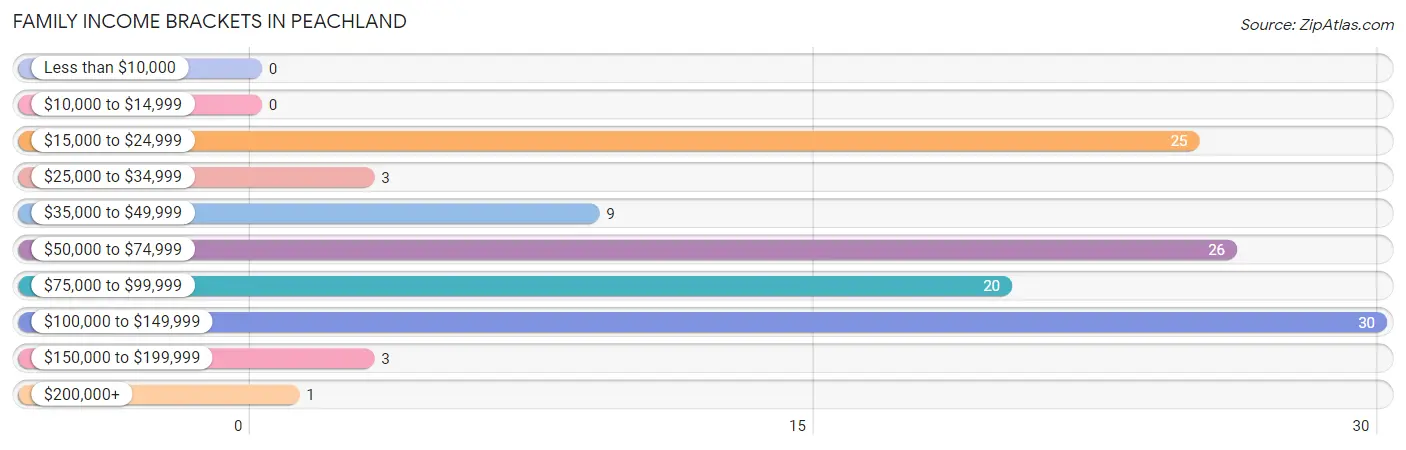
| Income Bracket | # Families | % Families |
| Less than $10,000 | 0 | 0.0% |
| $10,000 to $14,999 | 0 | 0.0% |
| $15,000 to $24,999 | 25 | 21.4% |
| $25,000 to $34,999 | 3 | 2.6% |
| $35,000 to $49,999 | 9 | 7.7% |
| $50,000 to $74,999 | 26 | 22.2% |
| $75,000 to $99,999 | 20 | 17.1% |
| $100,000 to $149,999 | 30 | 25.6% |
| $150,000 to $199,999 | 3 | 2.6% |
| $200,000+ | 1 | 0.9% |
Family Income by Famaliy Size in Peachland
4-person families (19 | 16.2%) account for the highest median family income in Peachland with $95,568 per family, while 2-person families (57 | 48.7%) have the highest median income of $44,375 per family member.
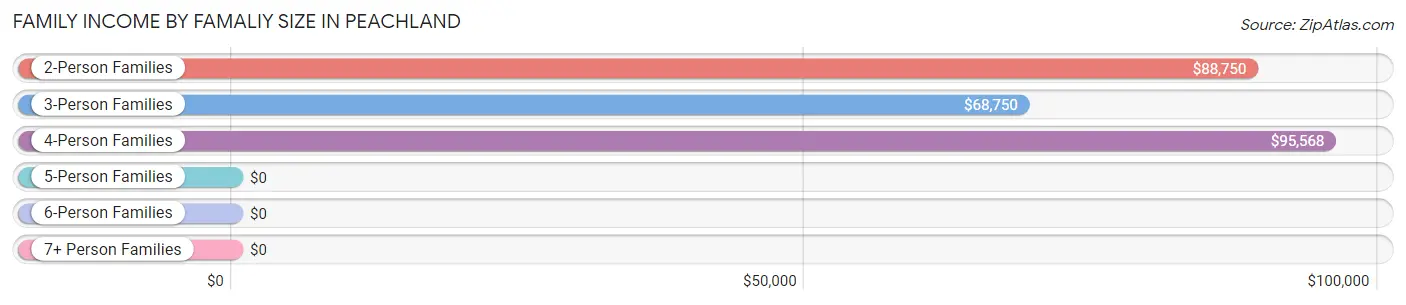
| Income Bracket | # Families | Median Income |
| 2-Person Families | 57 (48.7%) | $88,750 |
| 3-Person Families | 34 (29.1%) | $68,750 |
| 4-Person Families | 19 (16.2%) | $95,568 |
| 5-Person Families | 6 (5.1%) | $0 |
| 6-Person Families | 1 (0.9%) | $0 |
| 7+ Person Families | 0 (0.0%) | $0 |
| Total | 117 (100.0%) | $73,125 |
Family Income by Number of Earners in Peachland
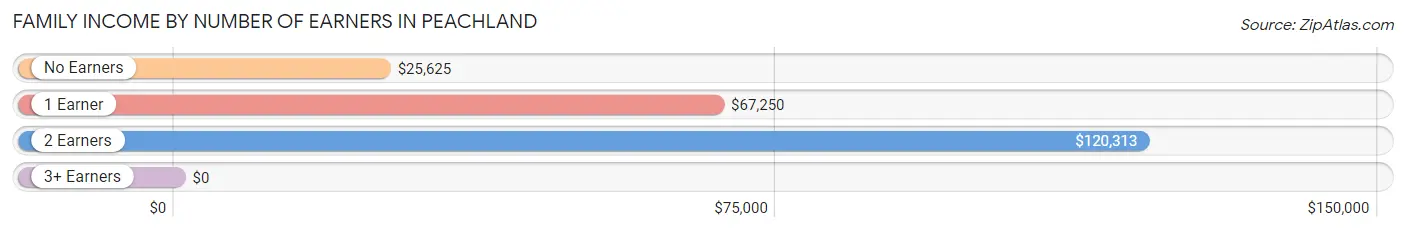
| Number of Earners | # Families | Median Income |
| No Earners | 15 (12.8%) | $25,625 |
| 1 Earner | 57 (48.7%) | $67,250 |
| 2 Earners | 43 (36.7%) | $120,313 |
| 3+ Earners | 2 (1.7%) | $0 |
| Total | 117 (100.0%) | $73,125 |
Household Income in Peachland
Household Income Brackets in Peachland
With 35 households falling in the category, the $50,000 to $74,999 income range is the most frequent in Peachland, accounting for 24.1% of all households.
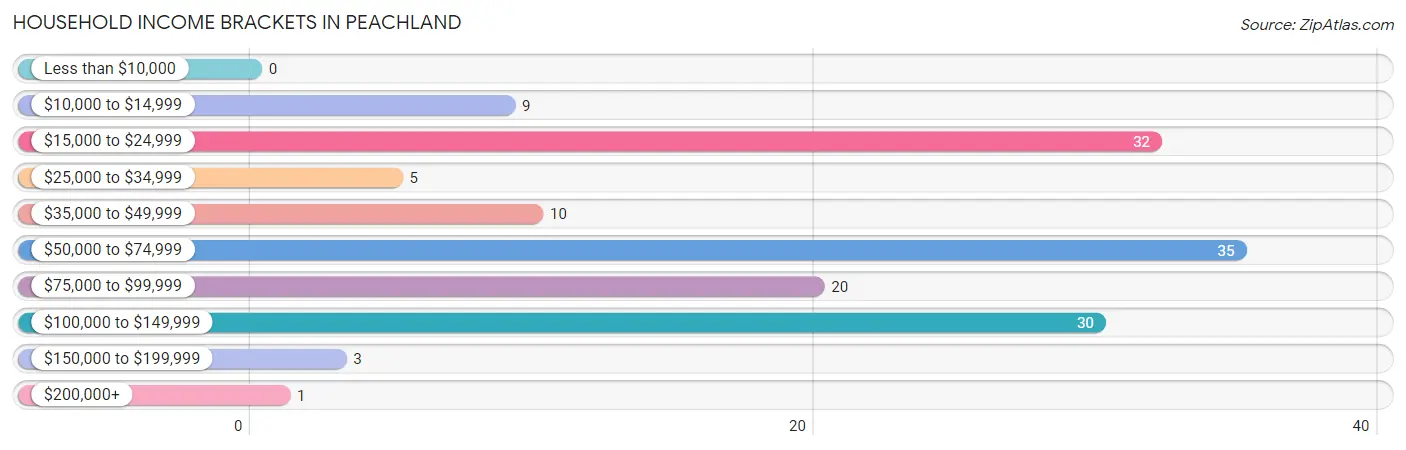
| Income Bracket | # Households | % Households |
| Less than $10,000 | 0 | 0.0% |
| $10,000 to $14,999 | 9 | 6.2% |
| $15,000 to $24,999 | 32 | 22.1% |
| $25,000 to $34,999 | 5 | 3.4% |
| $35,000 to $49,999 | 10 | 6.9% |
| $50,000 to $74,999 | 35 | 24.1% |
| $75,000 to $99,999 | 20 | 13.8% |
| $100,000 to $149,999 | 30 | 20.7% |
| $150,000 to $199,999 | 3 | 2.1% |
| $200,000+ | 1 | 0.7% |
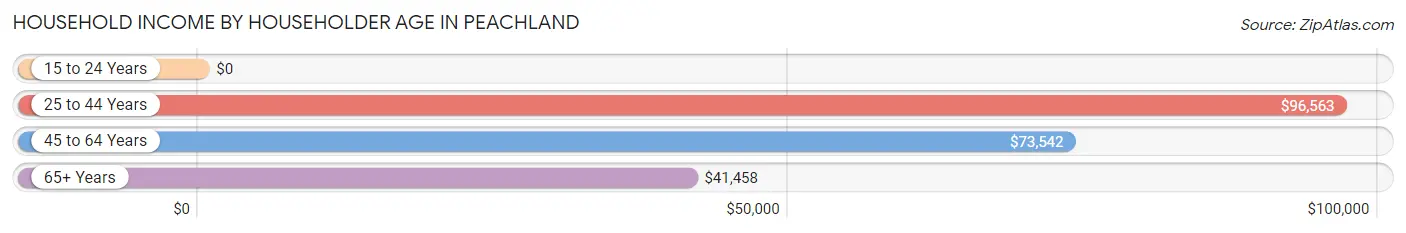
Household Income by Householder Age in Peachland
The median household income in Peachland is $70,096, with the highest median household income of $96,563 found in the 25 to 44 years age bracket for the primary householder. A total of 31 households (21.4%) fall into this category.
| Income Bracket | # Households | Median Income |
| 15 to 24 Years | 0 (0.0%) | $0 |
| 25 to 44 Years | 31 (21.4%) | $96,563 |
| 45 to 64 Years | 59 (40.7%) | $73,542 |
| 65+ Years | 55 (37.9%) | $41,458 |
| Total | 145 (100.0%) | $70,096 |
Poverty in Peachland
Income Below Poverty by Sex and Age in Peachland
With 4.8% poverty level for males and 10.6% for females among the residents of Peachland, under 5 year old males and 12 to 14 year old females are the most vulnerable to poverty, with 6 males (28.6%) and 3 females (42.9%) in their respective age groups living below the poverty level.
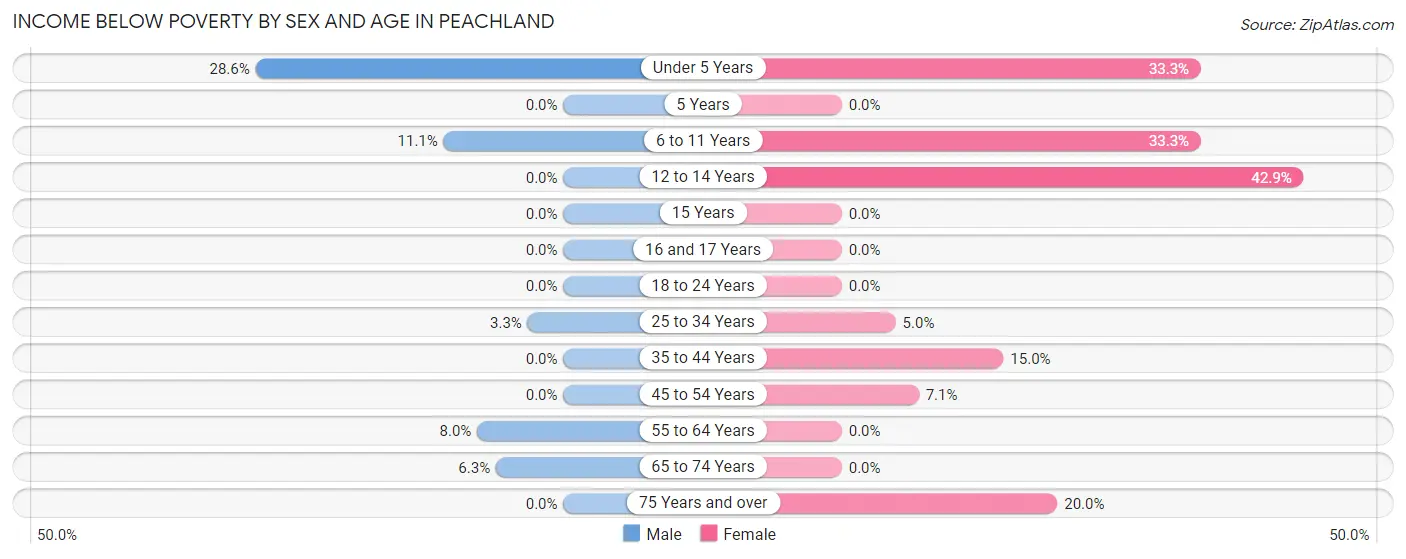
| Age Bracket | Male | Female |
| Under 5 Years | 6 (28.6%) | 1 (33.3%) |
| 5 Years | 0 (0.0%) | 0 (0.0%) |
| 6 to 11 Years | 1 (11.1%) | 3 (33.3%) |
| 12 to 14 Years | 0 (0.0%) | 3 (42.9%) |
| 15 Years | 0 (0.0%) | 0 (0.0%) |
| 16 and 17 Years | 0 (0.0%) | 0 (0.0%) |
| 18 to 24 Years | 0 (0.0%) | 0 (0.0%) |
| 25 to 34 Years | 4 (3.3%) | 1 (5.0%) |
| 35 to 44 Years | 0 (0.0%) | 3 (15.0%) |
| 45 to 54 Years | 0 (0.0%) | 3 (7.1%) |
| 55 to 64 Years | 2 (8.0%) | 0 (0.0%) |
| 65 to 74 Years | 1 (6.2%) | 0 (0.0%) |
| 75 Years and over | 0 (0.0%) | 4 (20.0%) |
| Total | 14 (4.8%) | 18 (10.6%) |
Income Above Poverty by Sex and Age in Peachland
According to the poverty statistics in Peachland, males aged 12 to 14 years and females aged 5 years are the age groups that are most secure financially, with 100.0% of males and 100.0% of females in these age groups living above the poverty line.
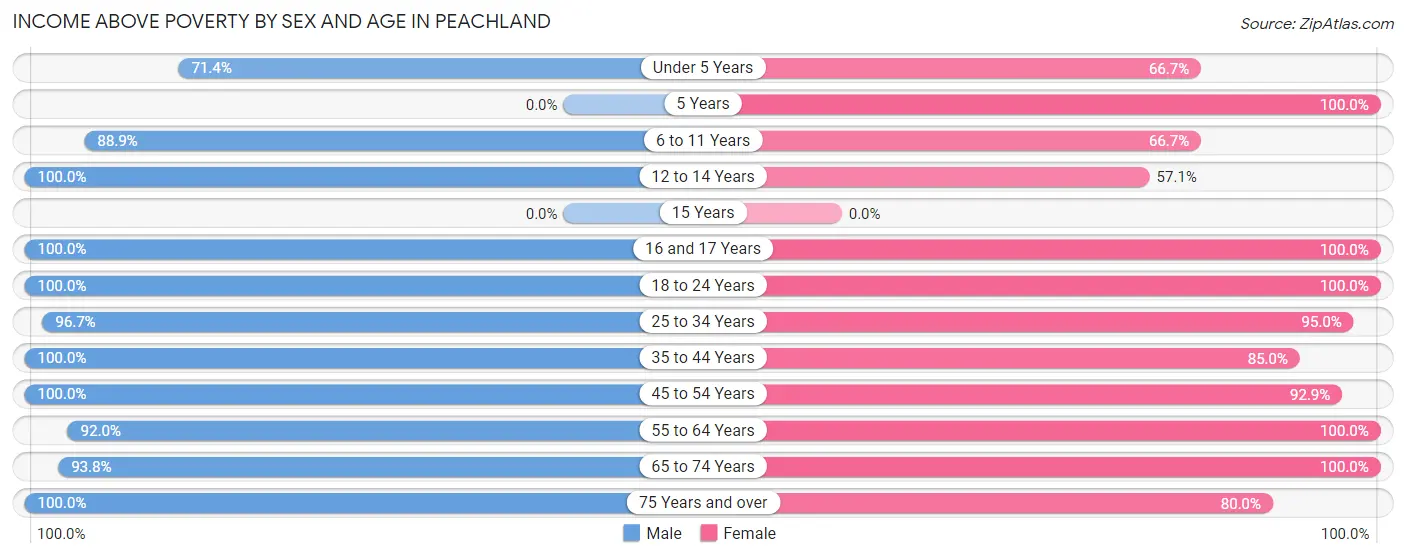
| Age Bracket | Male | Female |
| Under 5 Years | 15 (71.4%) | 2 (66.7%) |
| 5 Years | 0 (0.0%) | 3 (100.0%) |
| 6 to 11 Years | 8 (88.9%) | 6 (66.7%) |
| 12 to 14 Years | 7 (100.0%) | 4 (57.1%) |
| 15 Years | 0 (0.0%) | 0 (0.0%) |
| 16 and 17 Years | 9 (100.0%) | 2 (100.0%) |
| 18 to 24 Years | 1 (100.0%) | 3 (100.0%) |
| 25 to 34 Years | 117 (96.7%) | 19 (95.0%) |
| 35 to 44 Years | 41 (100.0%) | 17 (85.0%) |
| 45 to 54 Years | 41 (100.0%) | 39 (92.9%) |
| 55 to 64 Years | 23 (92.0%) | 19 (100.0%) |
| 65 to 74 Years | 15 (93.8%) | 22 (100.0%) |
| 75 Years and over | 4 (100.0%) | 16 (80.0%) |
| Total | 281 (95.3%) | 152 (89.4%) |
Income Below Poverty Among Married-Couple Families in Peachland
The poverty statistics for married-couple families in Peachland show that 3.5% or 3 of the total 87 families live below the poverty line. Families with 3 or 4 children have the highest poverty rate of 100.0%, comprising of 1 families. On the other hand, families with 1 or 2 children have the lowest poverty rate of 0.0%, which includes 0 families.
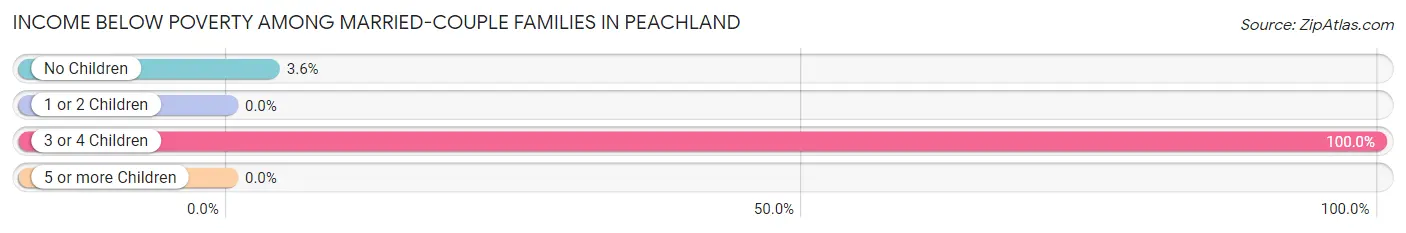
| Children | Above Poverty | Below Poverty |
| No Children | 53 (96.4%) | 2 (3.6%) |
| 1 or 2 Children | 31 (100.0%) | 0 (0.0%) |
| 3 or 4 Children | 0 (0.0%) | 1 (100.0%) |
| 5 or more Children | 0 (0.0%) | 0 (0.0%) |
| Total | 84 (96.6%) | 3 (3.5%) |
Income Below Poverty Among Single-Parent Households in Peachland
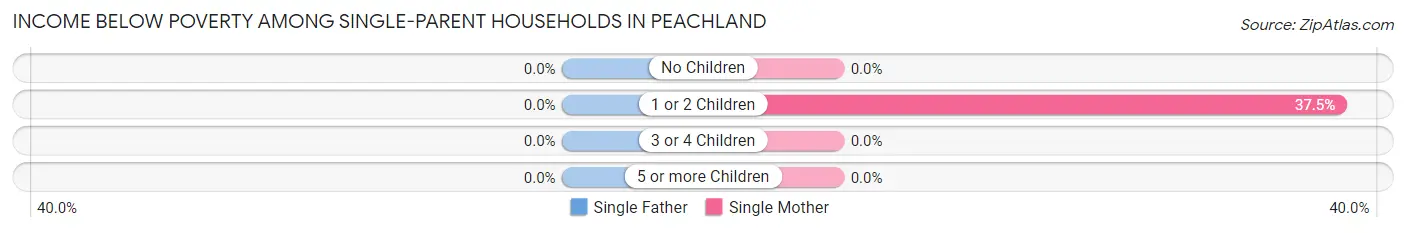
| Children | Single Father | Single Mother |
| No Children | 0 (0.0%) | 0 (0.0%) |
| 1 or 2 Children | 0 (0.0%) | 3 (37.5%) |
| 3 or 4 Children | 0 (0.0%) | 0 (0.0%) |
| 5 or more Children | 0 (0.0%) | 0 (0.0%) |
| Total | 0 (0.0%) | 3 (11.5%) |
Income Below Poverty Among Married-Couple vs Single-Parent Households in Peachland
The poverty data for Peachland shows that 3 of the married-couple family households (3.5%) and 3 of the single-parent households (10.0%) are living below the poverty level. Within the married-couple family households, those with 3 or 4 children have the highest poverty rate, with 1 households (100.0%) falling below the poverty line. Among the single-parent households, those with 1 or 2 children have the highest poverty rate, with 3 household (33.3%) living below poverty.
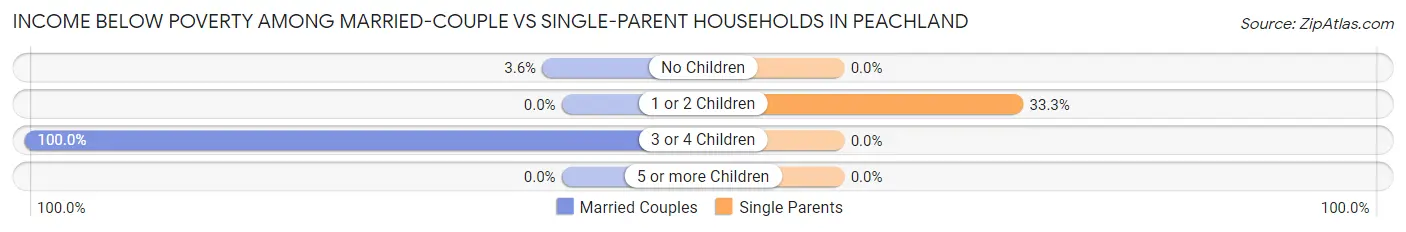
| Children | Married-Couple Families | Single-Parent Households |
| No Children | 2 (3.6%) | 0 (0.0%) |
| 1 or 2 Children | 0 (0.0%) | 3 (33.3%) |
| 3 or 4 Children | 1 (100.0%) | 0 (0.0%) |
| 5 or more Children | 0 (0.0%) | 0 (0.0%) |
| Total | 3 (3.5%) | 3 (10.0%) |
Race in Peachland
The most populous races in Peachland are Black / African American (235 | 50.5%), White / Caucasian (202 | 43.4%), and Two or more Races (19 | 4.1%).
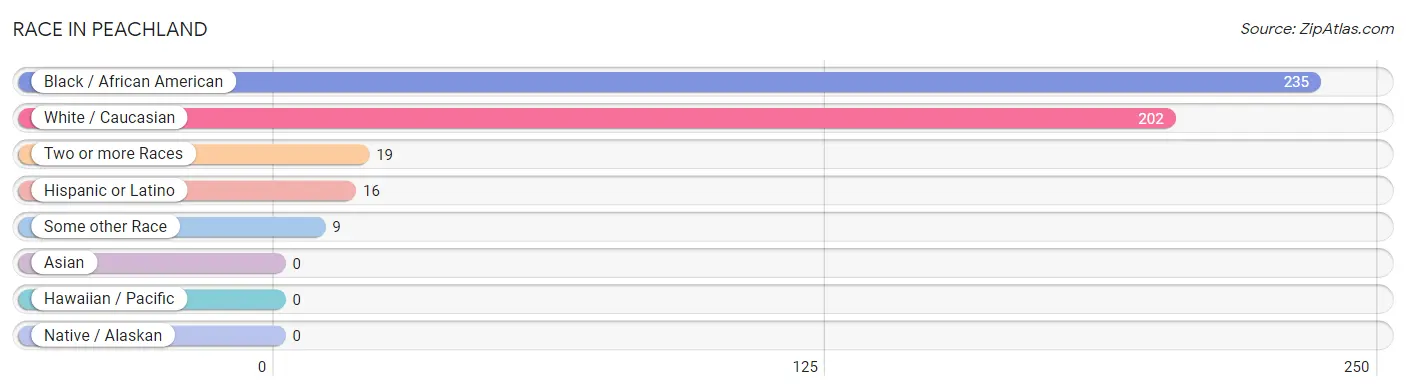
| Race | # Population | % Population |
| Asian | 0 | 0.0% |
| Black / African American | 235 | 50.5% |
| Hawaiian / Pacific | 0 | 0.0% |
| Hispanic or Latino | 16 | 3.4% |
| Native / Alaskan | 0 | 0.0% |
| White / Caucasian | 202 | 43.4% |
| Two or more Races | 19 | 4.1% |
| Some other Race | 9 | 1.9% |
| Total | 465 | 100.0% |
Ancestry in Peachland
The most populous ancestries reported in Peachland are English (36 | 7.7%), German (29 | 6.2%), American (24 | 5.2%), Irish (20 | 4.3%), and Colombian (9 | 1.9%), together accounting for 25.4% of all Peachland residents.
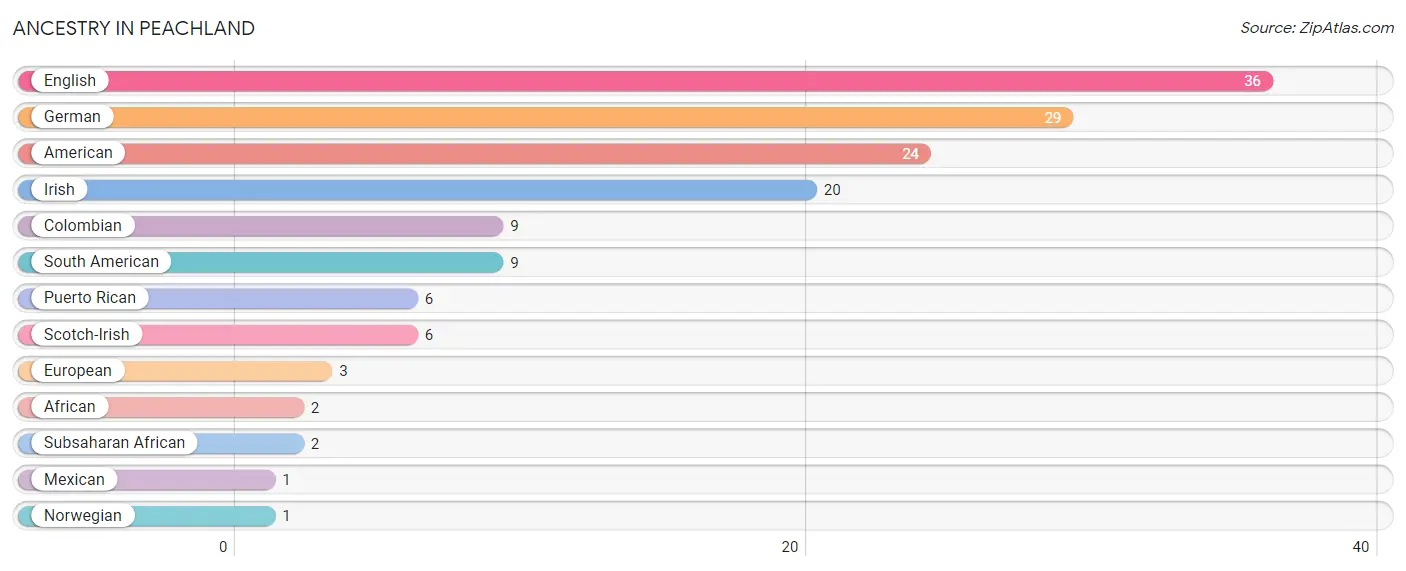
| Ancestry | # Population | % Population |
| African | 2 | 0.4% |
| American | 24 | 5.2% |
| Colombian | 9 | 1.9% |
| English | 36 | 7.7% |
| European | 3 | 0.6% |
| German | 29 | 6.2% |
| Irish | 20 | 4.3% |
| Mexican | 1 | 0.2% |
| Norwegian | 1 | 0.2% |
| Puerto Rican | 6 | 1.3% |
| Scotch-Irish | 6 | 1.3% |
| South American | 9 | 1.9% |
| Subsaharan African | 2 | 0.4% | View All 13 Rows |
Immigrants in Peachland
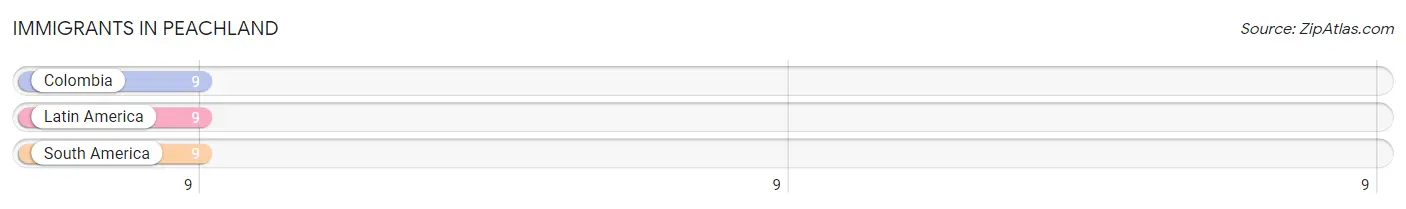
The most numerous immigrant groups reported in Peachland came from Colombia (9 | 1.9%), Latin America (9 | 1.9%), and South America (9 | 1.9%), together accounting for 5.8% of all Peachland residents.
| Immigration Origin | # Population | % Population |
| Colombia | 9 | 1.9% |
| Latin America | 9 | 1.9% |
| South America | 9 | 1.9% | View All 3 Rows |
Sex and Age in Peachland
Sex and Age in Peachland
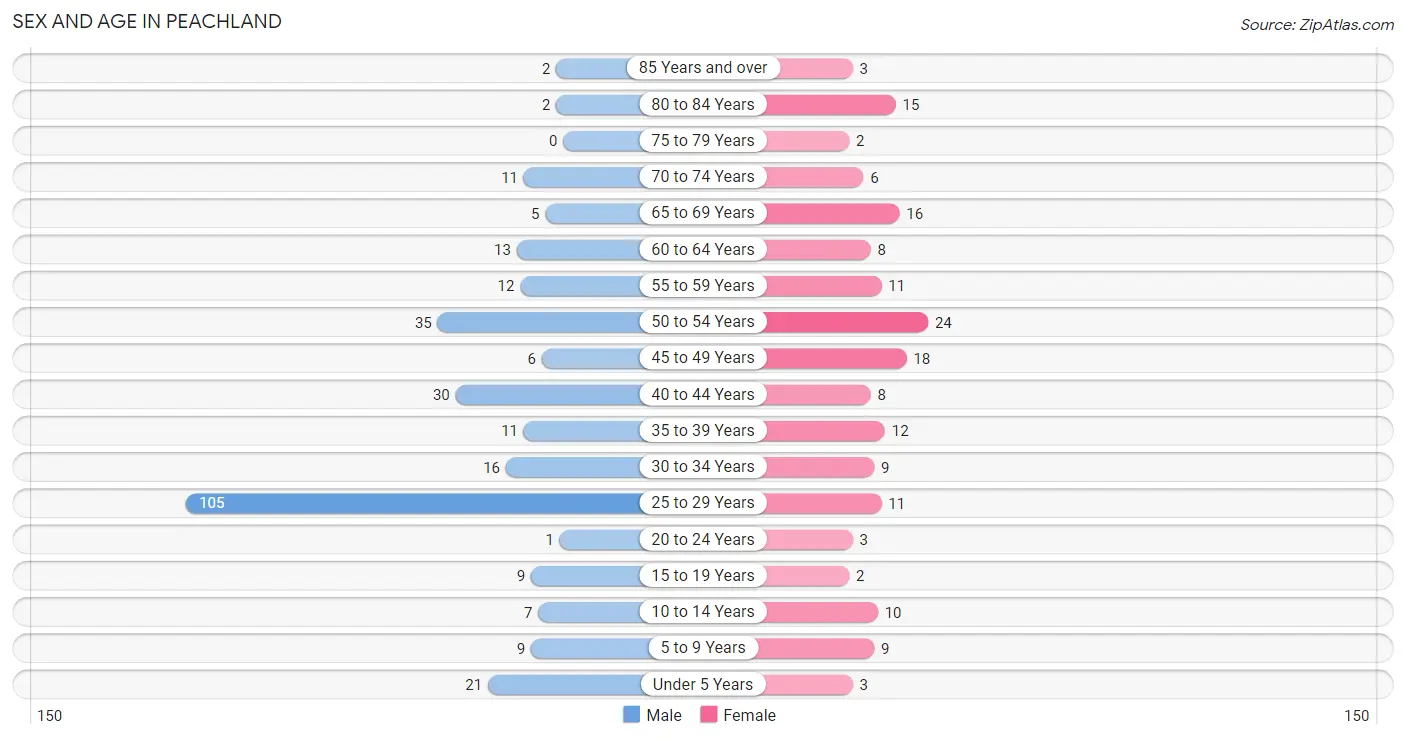
The most populous age groups in Peachland are 25 to 29 Years (105 | 35.6%) for men and 50 to 54 Years (24 | 14.1%) for women.
| Age Bracket | Male | Female |
| Under 5 Years | 21 (7.1%) | 3 (1.8%) |
| 5 to 9 Years | 9 (3.0%) | 9 (5.3%) |
| 10 to 14 Years | 7 (2.4%) | 10 (5.9%) |
| 15 to 19 Years | 9 (3.0%) | 2 (1.2%) |
| 20 to 24 Years | 1 (0.3%) | 3 (1.8%) |
| 25 to 29 Years | 105 (35.6%) | 11 (6.5%) |
| 30 to 34 Years | 16 (5.4%) | 9 (5.3%) |
| 35 to 39 Years | 11 (3.7%) | 12 (7.1%) |
| 40 to 44 Years | 30 (10.2%) | 8 (4.7%) |
| 45 to 49 Years | 6 (2.0%) | 18 (10.6%) |
| 50 to 54 Years | 35 (11.9%) | 24 (14.1%) |
| 55 to 59 Years | 12 (4.1%) | 11 (6.5%) |
| 60 to 64 Years | 13 (4.4%) | 8 (4.7%) |
| 65 to 69 Years | 5 (1.7%) | 16 (9.4%) |
| 70 to 74 Years | 11 (3.7%) | 6 (3.5%) |
| 75 to 79 Years | 0 (0.0%) | 2 (1.2%) |
| 80 to 84 Years | 2 (0.7%) | 15 (8.8%) |
| 85 Years and over | 2 (0.7%) | 3 (1.8%) |
| Total | 295 (100.0%) | 170 (100.0%) |
Families and Households in Peachland
Median Family Size in Peachland
The median family size in Peachland is 3.73 persons per family, with single female/mother families (26 | 22.2%) accounting for the largest median family size of 3.85 persons per family. On the other hand, single male/father families (4 | 3.4%) represent the smallest median family size with 3.50 persons per family.
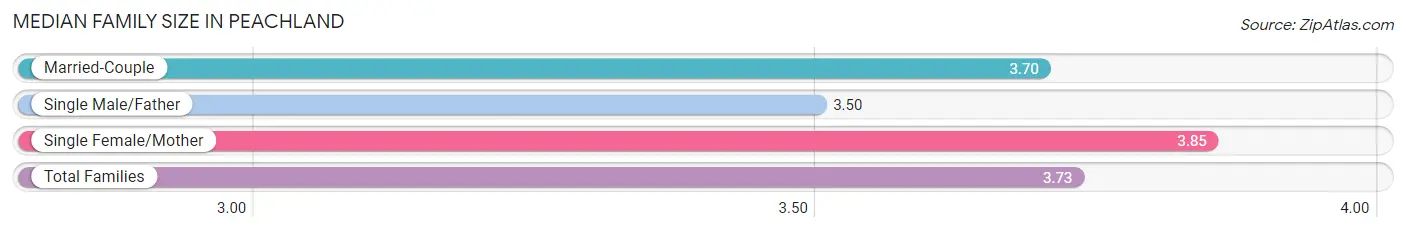
| Family Type | # Families | Family Size |
| Married-Couple | 87 (74.4%) | 3.70 |
| Single Male/Father | 4 (3.4%) | 3.50 |
| Single Female/Mother | 26 (22.2%) | 3.85 |
| Total Families | 117 (100.0%) | 3.73 |
Median Household Size in Peachland
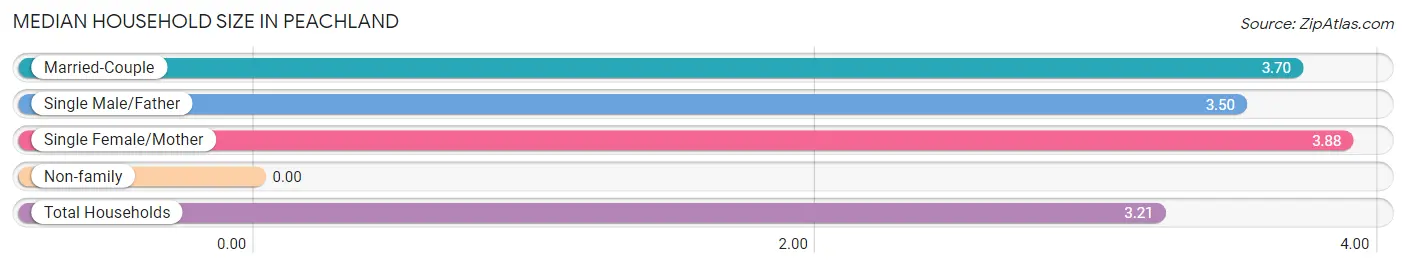
| Household Type | # Households | Household Size |
| Married-Couple | 87 (60.0%) | 3.70 |
| Single Male/Father | 4 (2.8%) | 3.50 |
| Single Female/Mother | 26 (17.9%) | 3.88 |
| Non-family | 28 (19.3%) | - |
| Total Households | 145 (100.0%) | 3.21 |
Household Size by Marriage Status in Peachland
Out of a total of 145 households in Peachland, 117 (80.7%) are family households, while 28 (19.3%) are nonfamily households. The most numerous type of family households are 2-person households, comprising 55, and the most common type of nonfamily households are 1-person households, comprising 28.
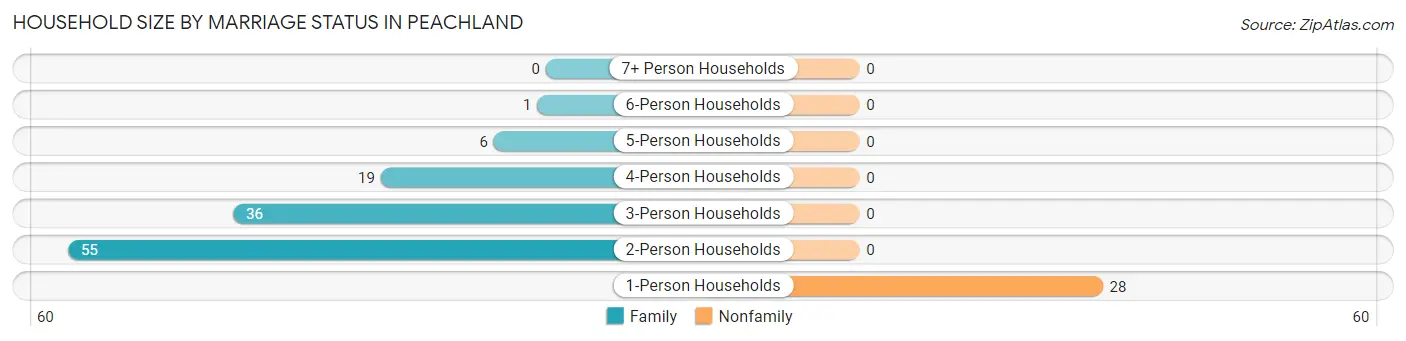
| Household Size | Family Households | Nonfamily Households |
| 1-Person Households | - | 28 (19.3%) |
| 2-Person Households | 55 (37.9%) | 0 (0.0%) |
| 3-Person Households | 36 (24.8%) | 0 (0.0%) |
| 4-Person Households | 19 (13.1%) | 0 (0.0%) |
| 5-Person Households | 6 (4.1%) | 0 (0.0%) |
| 6-Person Households | 1 (0.7%) | 0 (0.0%) |
| 7+ Person Households | 0 (0.0%) | 0 (0.0%) |
| Total | 117 (80.7%) | 28 (19.3%) |
Female Fertility in Peachland
Fertility by Age in Peachland
Average fertility rate in Peachland is 15.0 births per 1,000 women. Women in the age bracket of 20 to 34 years have the highest fertility rate with 43.0 births per 1,000 women. Women in the age bracket of 20 to 34 years acount for 100.0% of all women with births.
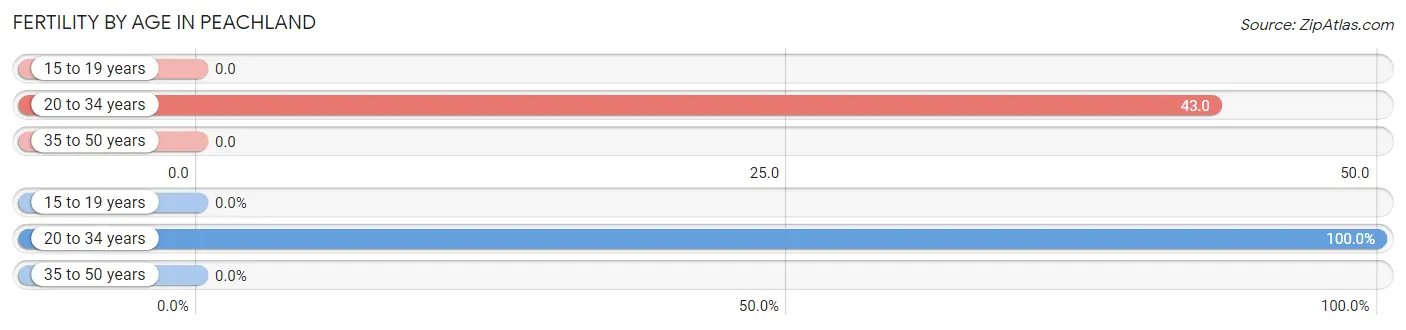
| Age Bracket | Women with Births | Births / 1,000 Women |
| 15 to 19 years | 0 (0.0%) | 0.0 |
| 20 to 34 years | 1 (100.0%) | 43.0 |
| 35 to 50 years | 0 (0.0%) | 0.0 |
| Total | 1 (100.0%) | 15.0 |
Fertility by Age by Marriage Status in Peachland
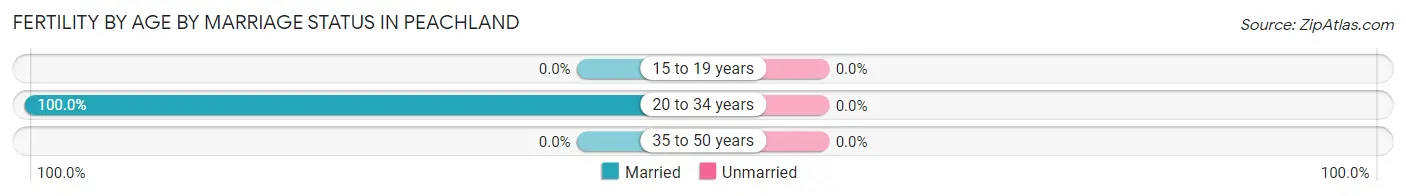
| Age Bracket | Married | Unmarried |
| 15 to 19 years | 0 (0.0%) | 0 (0.0%) |
| 20 to 34 years | 1 (100.0%) | 0 (0.0%) |
| 35 to 50 years | 0 (0.0%) | 0 (0.0%) |
| Total | 1 (100.0%) | 0 (0.0%) |
Fertility by Education in Peachland
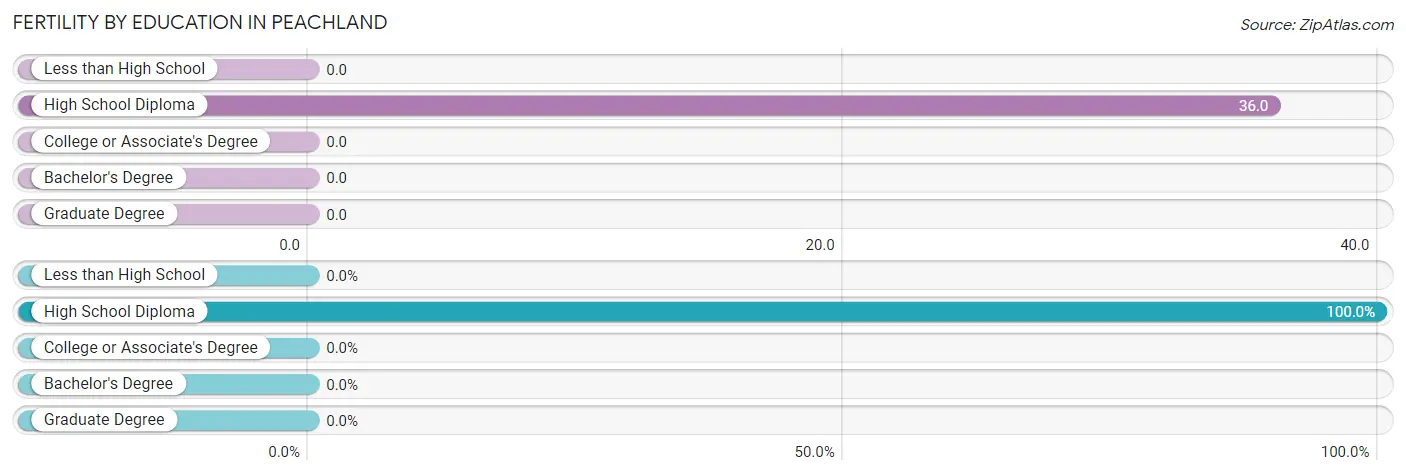
| Educational Attainment | Women with Births | Births / 1,000 Women |
| Less than High School | 0 (0.0%) | 0.0 |
| High School Diploma | 1 (100.0%) | 36.0 |
| College or Associate's Degree | 0 (0.0%) | 0.0 |
| Bachelor's Degree | 0 (0.0%) | 0.0 |
| Graduate Degree | 0 (0.0%) | 0.0 |
| Total | 1 (100.0%) | 15.0 |
Fertility by Education by Marriage Status in Peachland
| Educational Attainment | Married | Unmarried |
| Less than High School | 0 (0.0%) | 0 (0.0%) |
| High School Diploma | 1 (100.0%) | 0 (0.0%) |
| College or Associate's Degree | 0 (0.0%) | 0 (0.0%) |
| Bachelor's Degree | 0 (0.0%) | 0 (0.0%) |
| Graduate Degree | 0 (0.0%) | 0 (0.0%) |
| Total | 1 (100.0%) | 0 (0.0%) |
Employment Characteristics in Peachland
Employment by Class of Employer in Peachland
Among the 157 employed individuals in Peachland, private company employees (107 | 68.1%), state government employees (21 | 13.4%), and not-for-profit organizations (17 | 10.8%) make up the most common classes of employment.
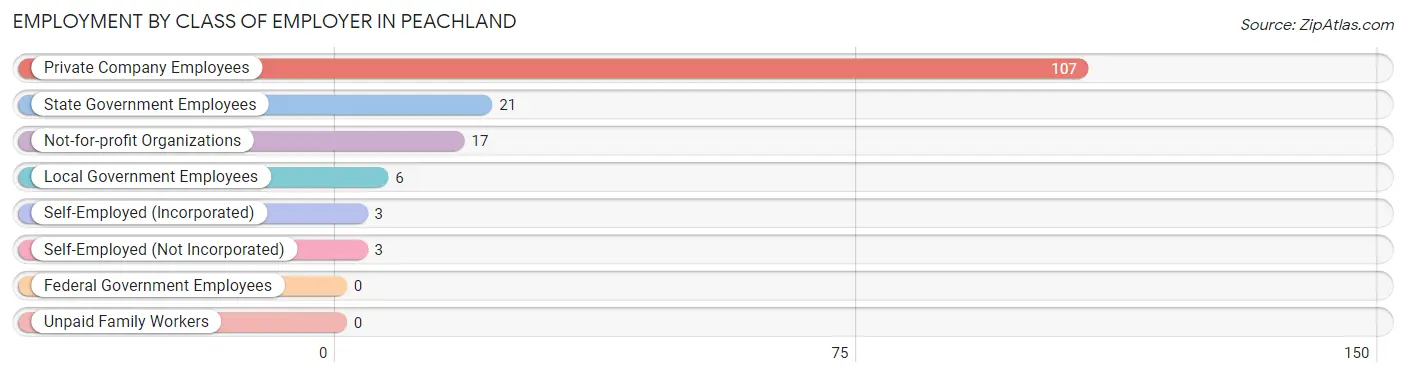
| Employer Class | # Employees | % Employees |
| Private Company Employees | 107 | 68.1% |
| Self-Employed (Incorporated) | 3 | 1.9% |
| Self-Employed (Not Incorporated) | 3 | 1.9% |
| Not-for-profit Organizations | 17 | 10.8% |
| Local Government Employees | 6 | 3.8% |
| State Government Employees | 21 | 13.4% |
| Federal Government Employees | 0 | 0.0% |
| Unpaid Family Workers | 0 | 0.0% |
| Total | 157 | 100.0% |
Employment Status by Age in Peachland
According to the labor force statistics for Peachland, out of the total population over 16 years of age (406), 39.2% or 159 individuals are in the labor force, with 1.3% or 2 of them unemployed. The age group with the highest labor force participation rate is 30 to 34 years, with 80.0% or 20 individuals in the labor force. Within the labor force, the 65 to 74 years age range has the highest percentage of unemployed individuals, with 28.6% or 2 of them being unemployed.
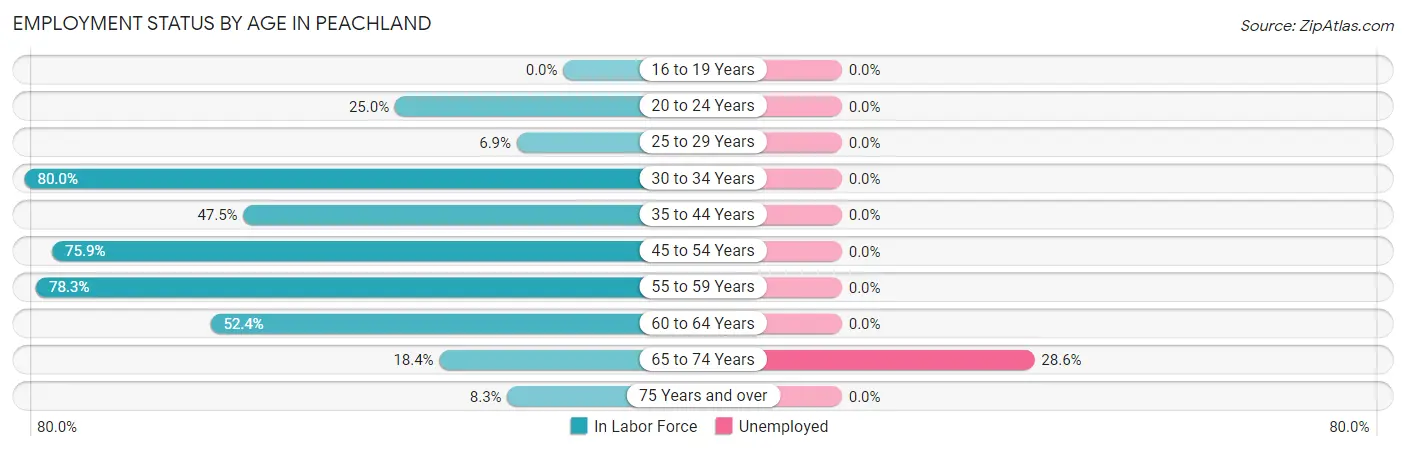
| Age Bracket | In Labor Force | Unemployed |
| 16 to 19 Years | 0 (0.0%) | 0 (0.0%) |
| 20 to 24 Years | 1 (25.0%) | 0 (0.0%) |
| 25 to 29 Years | 8 (6.9%) | 0 (0.0%) |
| 30 to 34 Years | 20 (80.0%) | 0 (0.0%) |
| 35 to 44 Years | 29 (47.5%) | 0 (0.0%) |
| 45 to 54 Years | 63 (75.9%) | 0 (0.0%) |
| 55 to 59 Years | 18 (78.3%) | 0 (0.0%) |
| 60 to 64 Years | 11 (52.4%) | 0 (0.0%) |
| 65 to 74 Years | 7 (18.4%) | 2 (28.6%) |
| 75 Years and over | 2 (8.3%) | 0 (0.0%) |
| Total | 159 (39.2%) | 2 (1.3%) |
Employment Status by Educational Attainment in Peachland
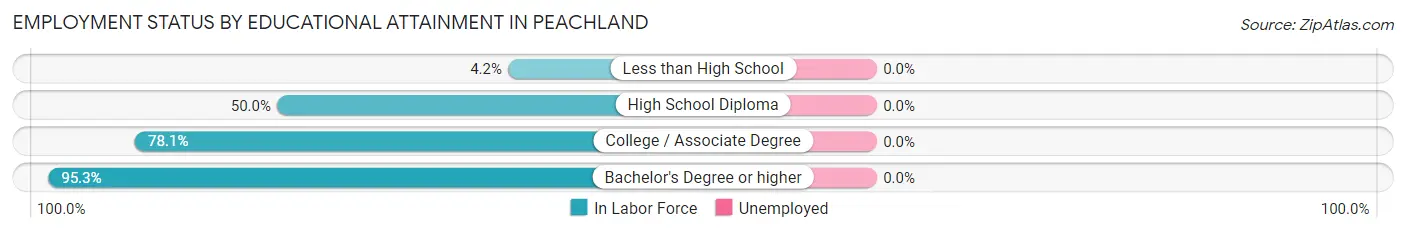
| Educational Attainment | In Labor Force | Unemployed |
| Less than High School | 4 (4.2%) | 0 (0.0%) |
| High School Diploma | 79 (50.0%) | 0 (0.0%) |
| College / Associate Degree | 25 (78.1%) | 0 (0.0%) |
| Bachelor's Degree or higher | 41 (95.3%) | 0 (0.0%) |
| Total | 149 (45.3%) | 0 (0.0%) |
Employment Occupations by Sex in Peachland
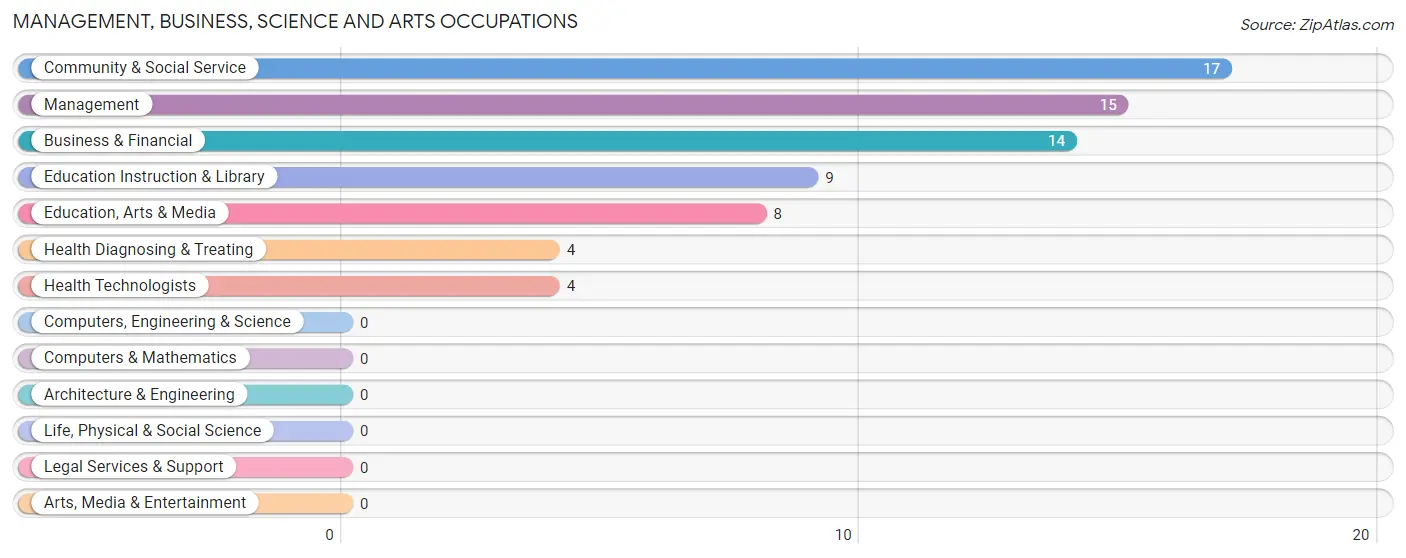
Management, Business, Science and Arts Occupations
The most common Management, Business, Science and Arts occupations in Peachland are Community & Social Service (17 | 10.8%), Management (15 | 9.6%), Business & Financial (14 | 8.9%), Education Instruction & Library (9 | 5.7%), and Education, Arts & Media (8 | 5.1%).
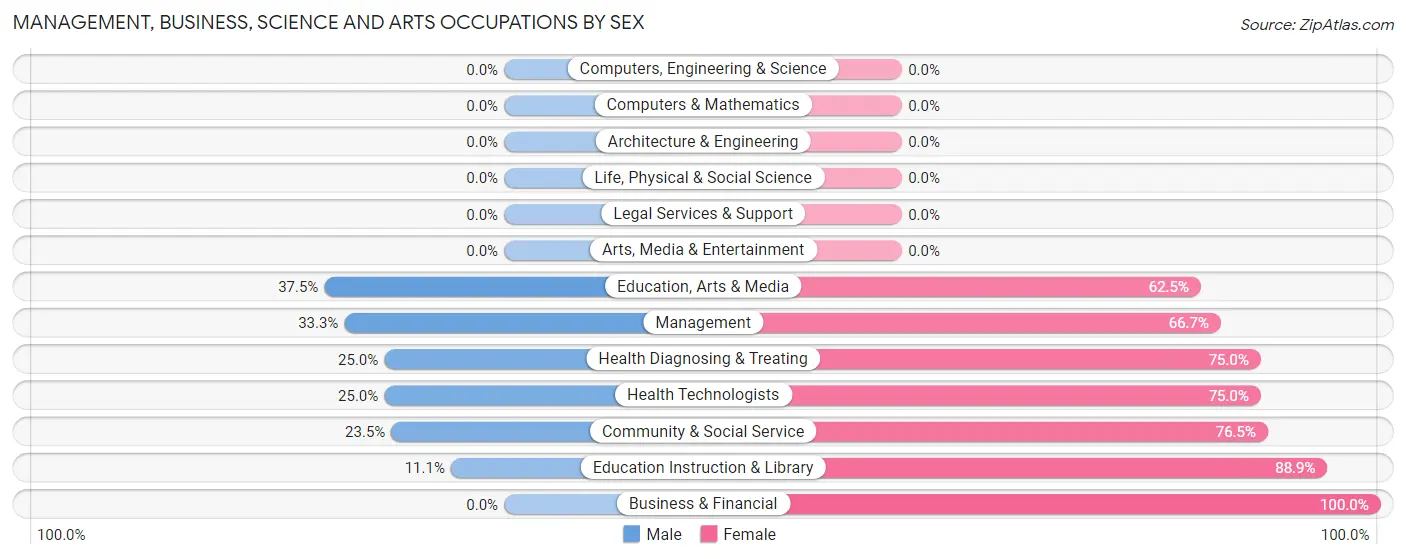
Management, Business, Science and Arts Occupations by Sex
Within the Management, Business, Science and Arts occupations in Peachland, the most male-oriented occupations are Education, Arts & Media (37.5%), Management (33.3%), and Health Diagnosing & Treating (25.0%), while the most female-oriented occupations are Business & Financial (100.0%), Education Instruction & Library (88.9%), and Community & Social Service (76.5%).
| Occupation | Male | Female |
| Management | 5 (33.3%) | 10 (66.7%) |
| Business & Financial | 0 (0.0%) | 14 (100.0%) |
| Computers, Engineering & Science | 0 (0.0%) | 0 (0.0%) |
| Computers & Mathematics | 0 (0.0%) | 0 (0.0%) |
| Architecture & Engineering | 0 (0.0%) | 0 (0.0%) |
| Life, Physical & Social Science | 0 (0.0%) | 0 (0.0%) |
| Community & Social Service | 4 (23.5%) | 13 (76.5%) |
| Education, Arts & Media | 3 (37.5%) | 5 (62.5%) |
| Legal Services & Support | 0 (0.0%) | 0 (0.0%) |
| Education Instruction & Library | 1 (11.1%) | 8 (88.9%) |
| Arts, Media & Entertainment | 0 (0.0%) | 0 (0.0%) |
| Health Diagnosing & Treating | 1 (25.0%) | 3 (75.0%) |
| Health Technologists | 1 (25.0%) | 3 (75.0%) |
| Total (Category) | 10 (20.0%) | 40 (80.0%) |
| Total (Overall) | 77 (49.0%) | 80 (51.0%) |
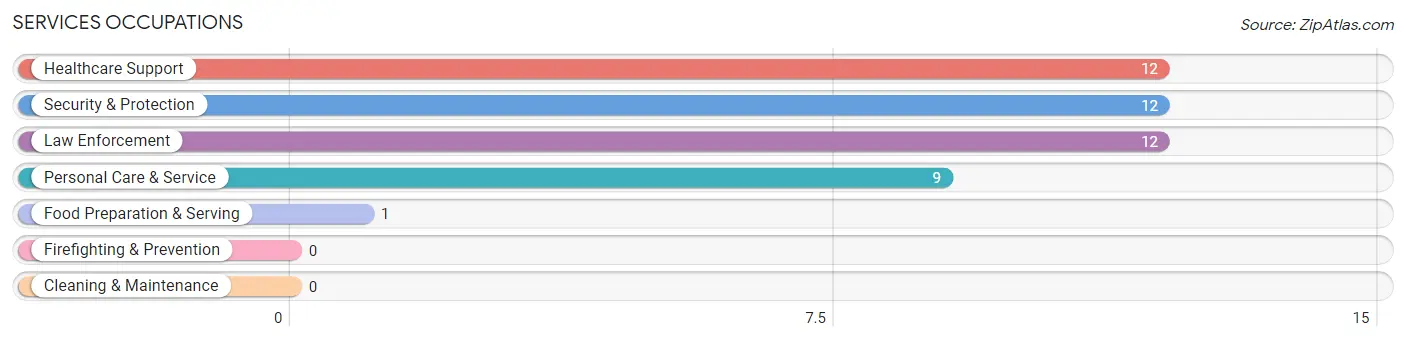
Services Occupations
The most common Services occupations in Peachland are Healthcare Support (12 | 7.6%), Security & Protection (12 | 7.6%), Law Enforcement (12 | 7.6%), Personal Care & Service (9 | 5.7%), and Food Preparation & Serving (1 | 0.6%).
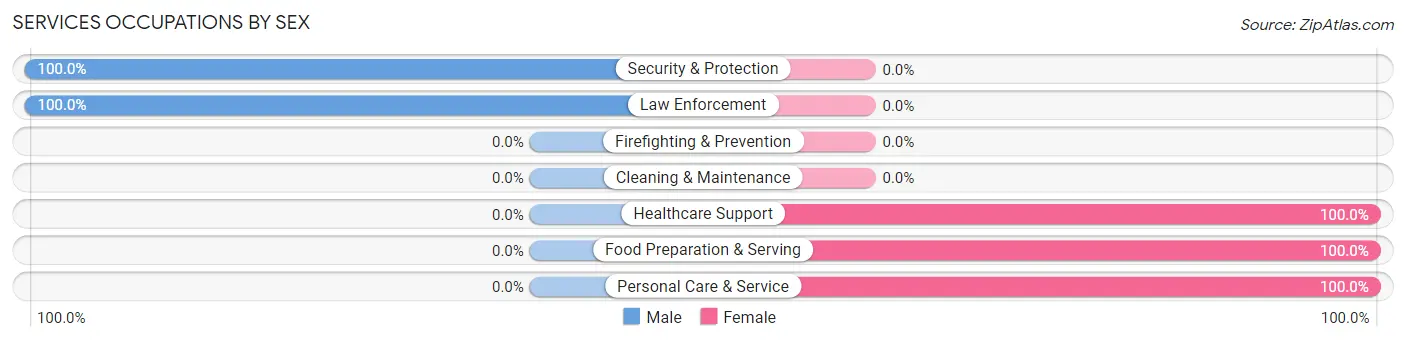
Services Occupations by Sex
Within the Services occupations in Peachland, the most male-oriented occupations are Security & Protection (100.0%), and Law Enforcement (100.0%), while the most female-oriented occupations are Healthcare Support (100.0%), Food Preparation & Serving (100.0%), and Personal Care & Service (100.0%).
| Occupation | Male | Female |
| Healthcare Support | 0 (0.0%) | 12 (100.0%) |
| Security & Protection | 12 (100.0%) | 0 (0.0%) |
| Firefighting & Prevention | 0 (0.0%) | 0 (0.0%) |
| Law Enforcement | 12 (100.0%) | 0 (0.0%) |
| Food Preparation & Serving | 0 (0.0%) | 1 (100.0%) |
| Cleaning & Maintenance | 0 (0.0%) | 0 (0.0%) |
| Personal Care & Service | 0 (0.0%) | 9 (100.0%) |
| Total (Category) | 12 (35.3%) | 22 (64.7%) |
| Total (Overall) | 77 (49.0%) | 80 (51.0%) |
Sales and Office Occupations
The most common Sales and Office occupations in Peachland are Office & Administration (9 | 5.7%), and Sales & Related (2 | 1.3%).
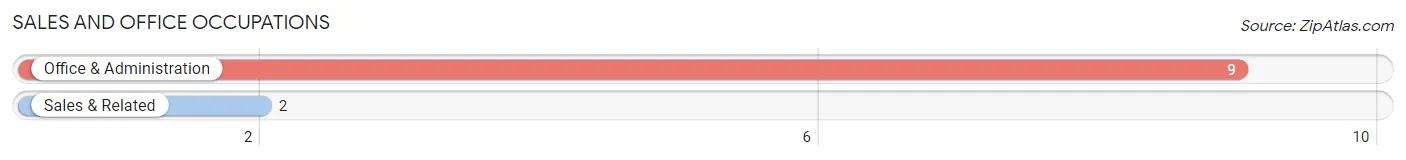
Sales and Office Occupations by Sex
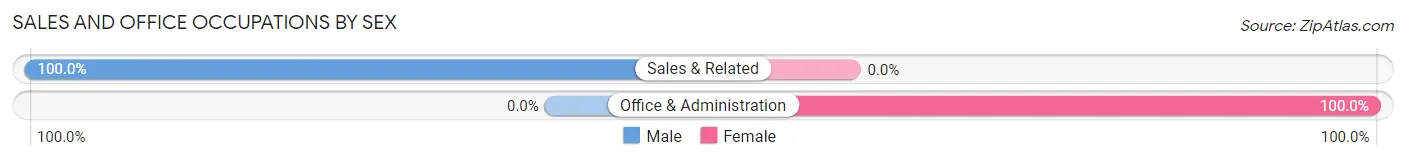
| Occupation | Male | Female |
| Sales & Related | 2 (100.0%) | 0 (0.0%) |
| Office & Administration | 0 (0.0%) | 9 (100.0%) |
| Total (Category) | 2 (18.2%) | 9 (81.8%) |
| Total (Overall) | 77 (49.0%) | 80 (51.0%) |
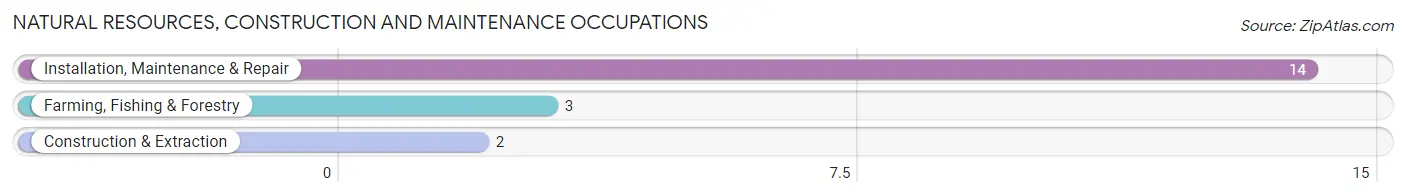
Natural Resources, Construction and Maintenance Occupations
The most common Natural Resources, Construction and Maintenance occupations in Peachland are Installation, Maintenance & Repair (14 | 8.9%), Farming, Fishing & Forestry (3 | 1.9%), and Construction & Extraction (2 | 1.3%).
Natural Resources, Construction and Maintenance Occupations by Sex
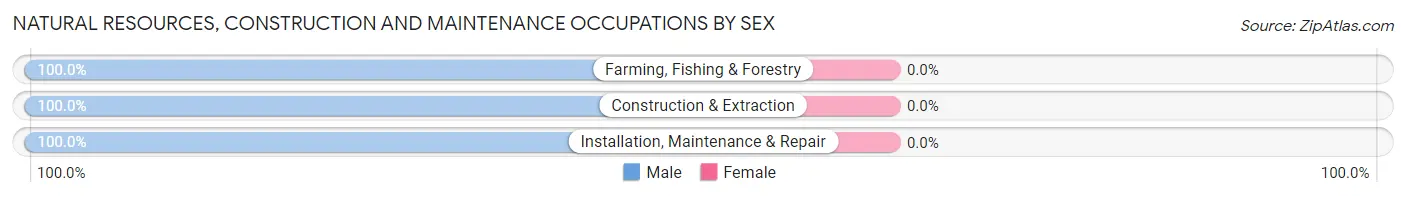
| Occupation | Male | Female |
| Farming, Fishing & Forestry | 3 (100.0%) | 0 (0.0%) |
| Construction & Extraction | 2 (100.0%) | 0 (0.0%) |
| Installation, Maintenance & Repair | 14 (100.0%) | 0 (0.0%) |
| Total (Category) | 19 (100.0%) | 0 (0.0%) |
| Total (Overall) | 77 (49.0%) | 80 (51.0%) |
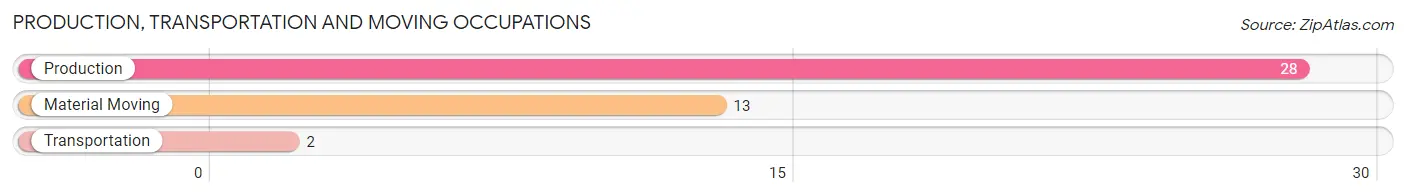
Production, Transportation and Moving Occupations
The most common Production, Transportation and Moving occupations in Peachland are Production (28 | 17.8%), Material Moving (13 | 8.3%), and Transportation (2 | 1.3%).
Production, Transportation and Moving Occupations by Sex
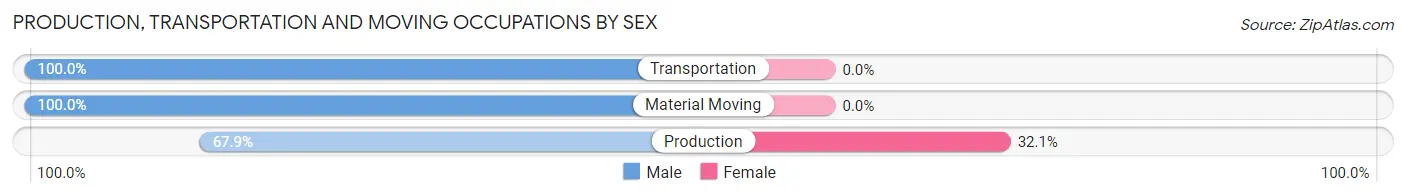
| Occupation | Male | Female |
| Production | 19 (67.9%) | 9 (32.1%) |
| Transportation | 2 (100.0%) | 0 (0.0%) |
| Material Moving | 13 (100.0%) | 0 (0.0%) |
| Total (Category) | 34 (79.1%) | 9 (20.9%) |
| Total (Overall) | 77 (49.0%) | 80 (51.0%) |
Employment Industries by Sex in Peachland
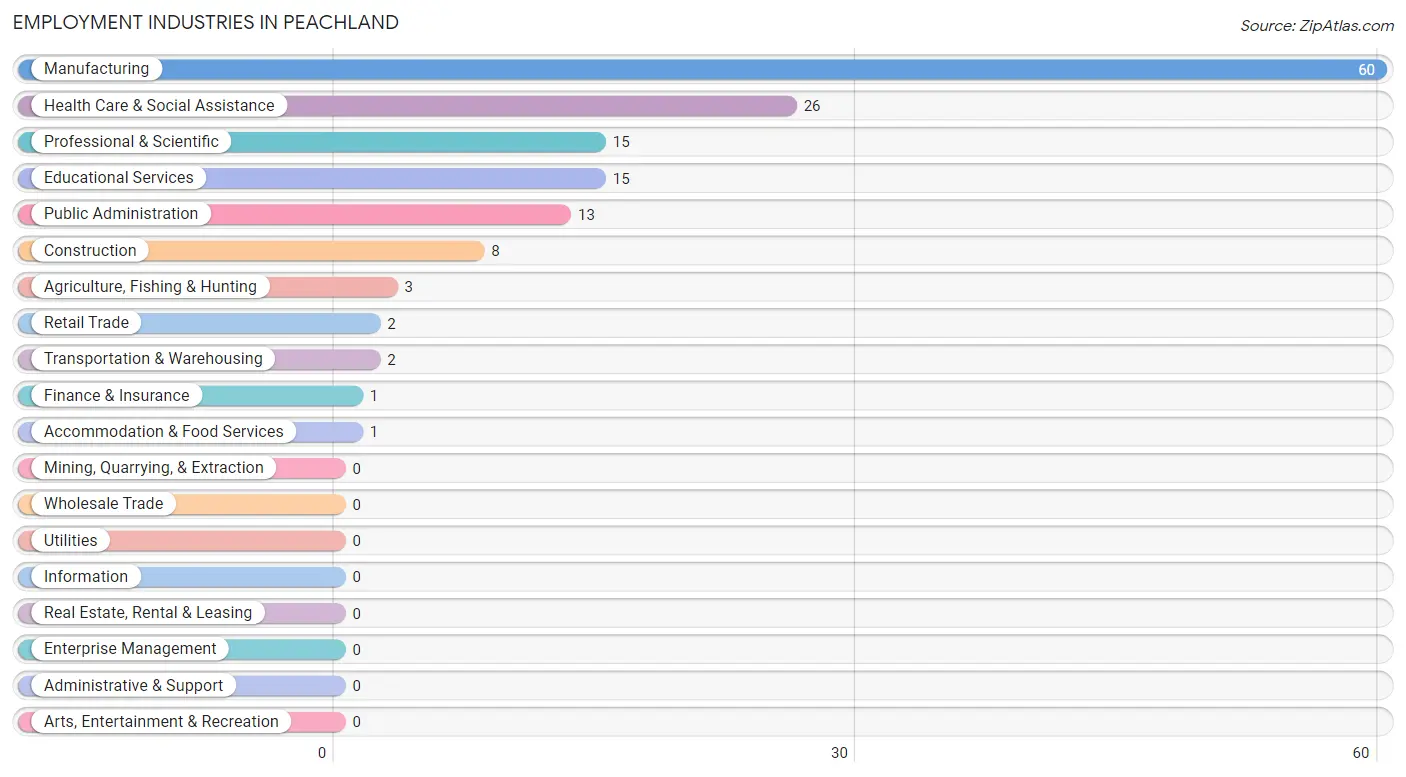
Employment Industries in Peachland
The major employment industries in Peachland include Manufacturing (60 | 38.2%), Health Care & Social Assistance (26 | 16.6%), Professional & Scientific (15 | 9.6%), Educational Services (15 | 9.6%), and Public Administration (13 | 8.3%).
Employment Industries by Sex in Peachland
The Peachland industries that see more men than women are Agriculture, Fishing & Hunting (100.0%), Retail Trade (100.0%), and Transportation & Warehousing (100.0%), whereas the industries that tend to have a higher number of women are Finance & Insurance (100.0%), Professional & Scientific (100.0%), and Accommodation & Food Services (100.0%).
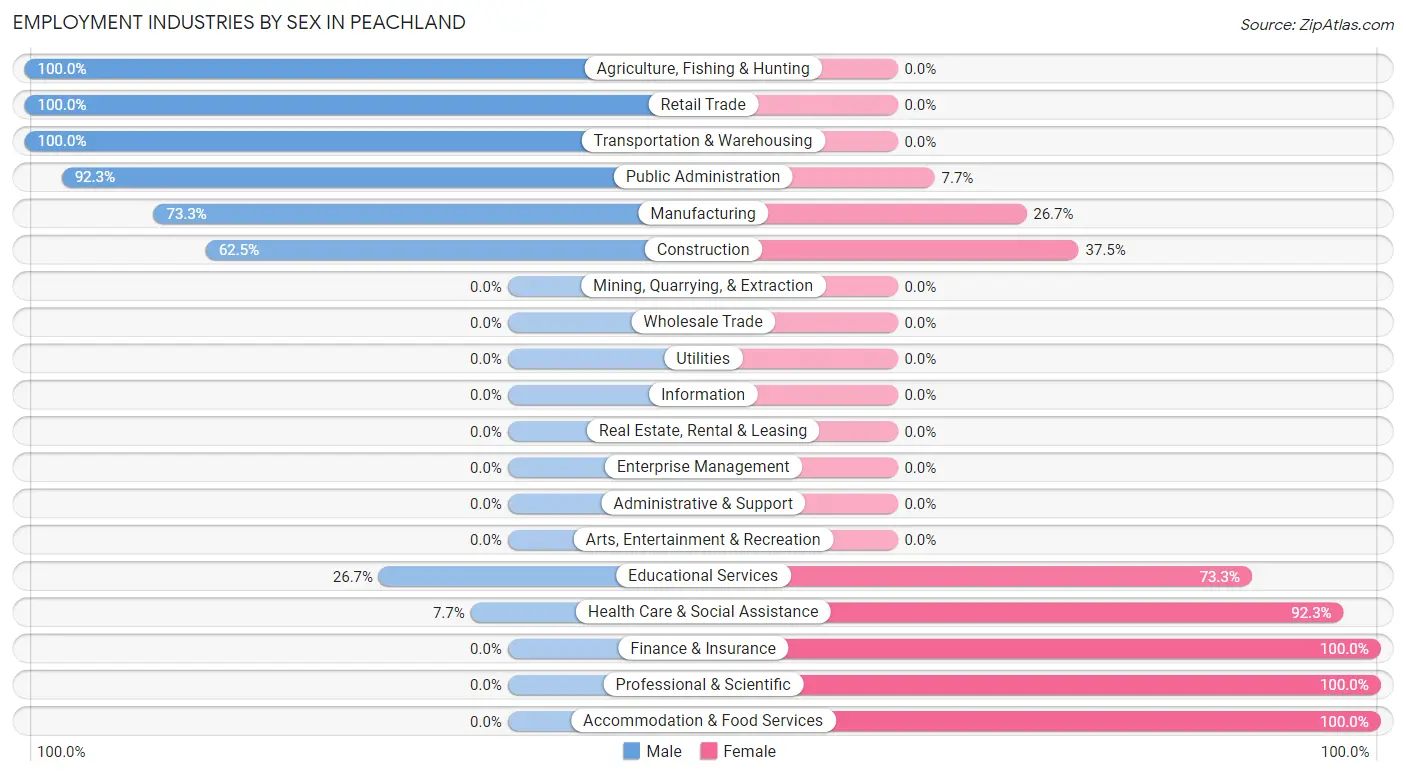
| Industry | Male | Female |
| Agriculture, Fishing & Hunting | 3 (100.0%) | 0 (0.0%) |
| Mining, Quarrying, & Extraction | 0 (0.0%) | 0 (0.0%) |
| Construction | 5 (62.5%) | 3 (37.5%) |
| Manufacturing | 44 (73.3%) | 16 (26.7%) |
| Wholesale Trade | 0 (0.0%) | 0 (0.0%) |
| Retail Trade | 2 (100.0%) | 0 (0.0%) |
| Transportation & Warehousing | 2 (100.0%) | 0 (0.0%) |
| Utilities | 0 (0.0%) | 0 (0.0%) |
| Information | 0 (0.0%) | 0 (0.0%) |
| Finance & Insurance | 0 (0.0%) | 1 (100.0%) |
| Real Estate, Rental & Leasing | 0 (0.0%) | 0 (0.0%) |
| Professional & Scientific | 0 (0.0%) | 15 (100.0%) |
| Enterprise Management | 0 (0.0%) | 0 (0.0%) |
| Administrative & Support | 0 (0.0%) | 0 (0.0%) |
| Educational Services | 4 (26.7%) | 11 (73.3%) |
| Health Care & Social Assistance | 2 (7.7%) | 24 (92.3%) |
| Arts, Entertainment & Recreation | 0 (0.0%) | 0 (0.0%) |
| Accommodation & Food Services | 0 (0.0%) | 1 (100.0%) |
| Public Administration | 12 (92.3%) | 1 (7.7%) |
| Total | 77 (49.0%) | 80 (51.0%) |
Education in Peachland
School Enrollment in Peachland
The most common levels of schooling among the 47 students in Peachland are middle school (17 | 36.2%), high school (11 | 23.4%), and elementary school (10 | 21.3%).
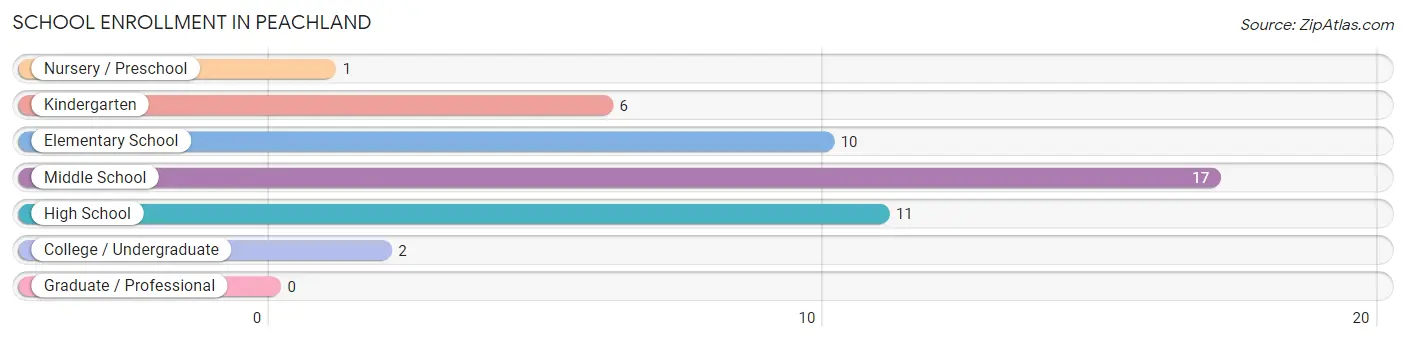
| School Level | # Students | % Students |
| Nursery / Preschool | 1 | 2.1% |
| Kindergarten | 6 | 12.8% |
| Elementary School | 10 | 21.3% |
| Middle School | 17 | 36.2% |
| High School | 11 | 23.4% |
| College / Undergraduate | 2 | 4.3% |
| Graduate / Professional | 0 | 0.0% |
| Total | 47 | 100.0% |
School Enrollment by Age by Funding Source in Peachland
Out of a total of 47 students who are enrolled in schools in Peachland, 10 (21.3%) attend a private institution, while the remaining 37 (78.7%) are enrolled in public schools. The age group of 5 to 9 year old has the highest likelihood of being enrolled in private schools, with 5 (31.2% in the age bracket) enrolled. Conversely, the age group of 3 to 4 year olds has the lowest likelihood of being enrolled in a private school, with 1 (100.0% in the age bracket) attending a public institution.
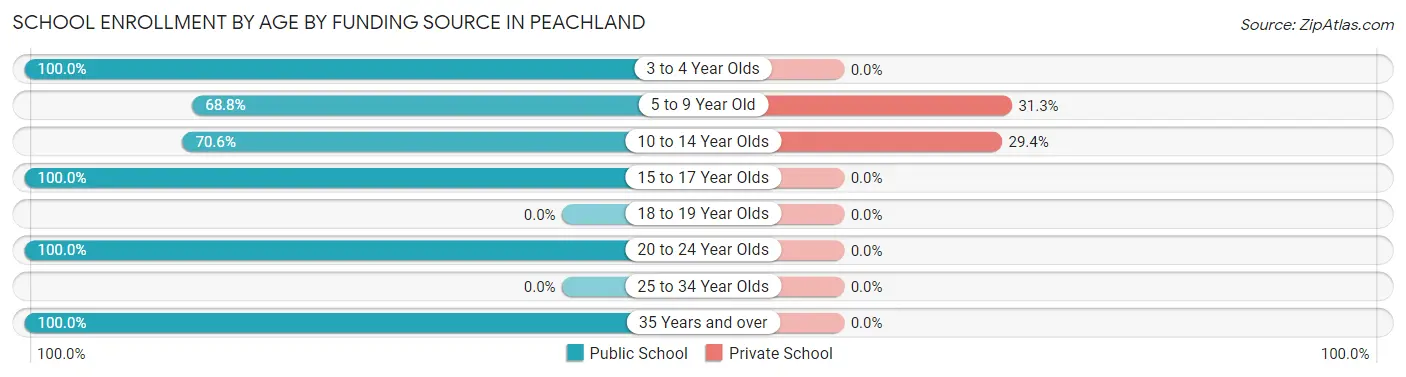
| Age Bracket | Public School | Private School |
| 3 to 4 Year Olds | 1 (100.0%) | 0 (0.0%) |
| 5 to 9 Year Old | 11 (68.8%) | 5 (31.2%) |
| 10 to 14 Year Olds | 12 (70.6%) | 5 (29.4%) |
| 15 to 17 Year Olds | 11 (100.0%) | 0 (0.0%) |
| 18 to 19 Year Olds | 0 (0.0%) | 0 (0.0%) |
| 20 to 24 Year Olds | 1 (100.0%) | 0 (0.0%) |
| 25 to 34 Year Olds | 0 (0.0%) | 0 (0.0%) |
| 35 Years and over | 1 (100.0%) | 0 (0.0%) |
| Total | 37 (78.7%) | 10 (21.3%) |
Educational Attainment by Field of Study in Peachland
Education (14 | 29.2%), social sciences (10 | 20.8%), business (10 | 20.8%), arts & humanities (6 | 12.5%), and science & technology (4 | 8.3%) are the most common fields of study among 48 individuals in Peachland who have obtained a bachelor's degree or higher.
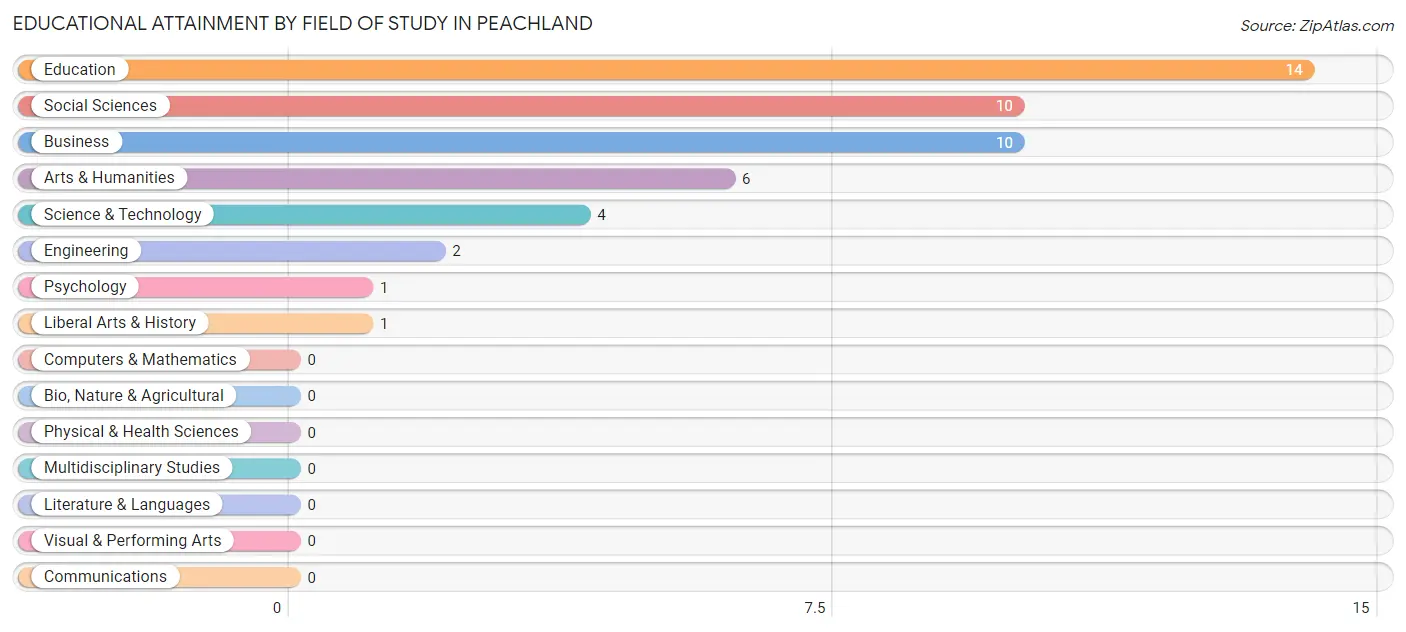
| Field of Study | # Graduates | % Graduates |
| Computers & Mathematics | 0 | 0.0% |
| Bio, Nature & Agricultural | 0 | 0.0% |
| Physical & Health Sciences | 0 | 0.0% |
| Psychology | 1 | 2.1% |
| Social Sciences | 10 | 20.8% |
| Engineering | 2 | 4.2% |
| Multidisciplinary Studies | 0 | 0.0% |
| Science & Technology | 4 | 8.3% |
| Business | 10 | 20.8% |
| Education | 14 | 29.2% |
| Literature & Languages | 0 | 0.0% |
| Liberal Arts & History | 1 | 2.1% |
| Visual & Performing Arts | 0 | 0.0% |
| Communications | 0 | 0.0% |
| Arts & Humanities | 6 | 12.5% |
| Total | 48 | 100.0% |
Transportation & Commute in Peachland
Vehicle Availability by Sex in Peachland
The most prevalent vehicle ownership categories in Peachland are males with 2 vehicles (38, accounting for 49.3%) and females with 2 vehicles (32, making up 47.5%).
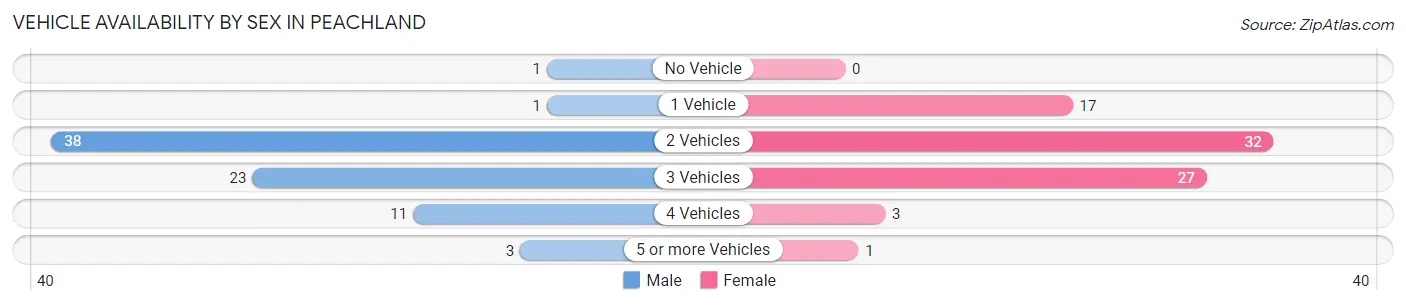
| Vehicles Available | Male | Female |
| No Vehicle | 1 (1.3%) | 0 (0.0%) |
| 1 Vehicle | 1 (1.3%) | 17 (21.2%) |
| 2 Vehicles | 38 (49.3%) | 32 (40.0%) |
| 3 Vehicles | 23 (29.9%) | 27 (33.8%) |
| 4 Vehicles | 11 (14.3%) | 3 (3.7%) |
| 5 or more Vehicles | 3 (3.9%) | 1 (1.3%) |
| Total | 77 (100.0%) | 80 (100.0%) |
Commute Time in Peachland
The most frequently occuring commute durations in Peachland are 20 to 24 minutes (26 commuters, 17.4%), 25 to 29 minutes (25 commuters, 16.8%), and 10 to 14 minutes (23 commuters, 15.4%).
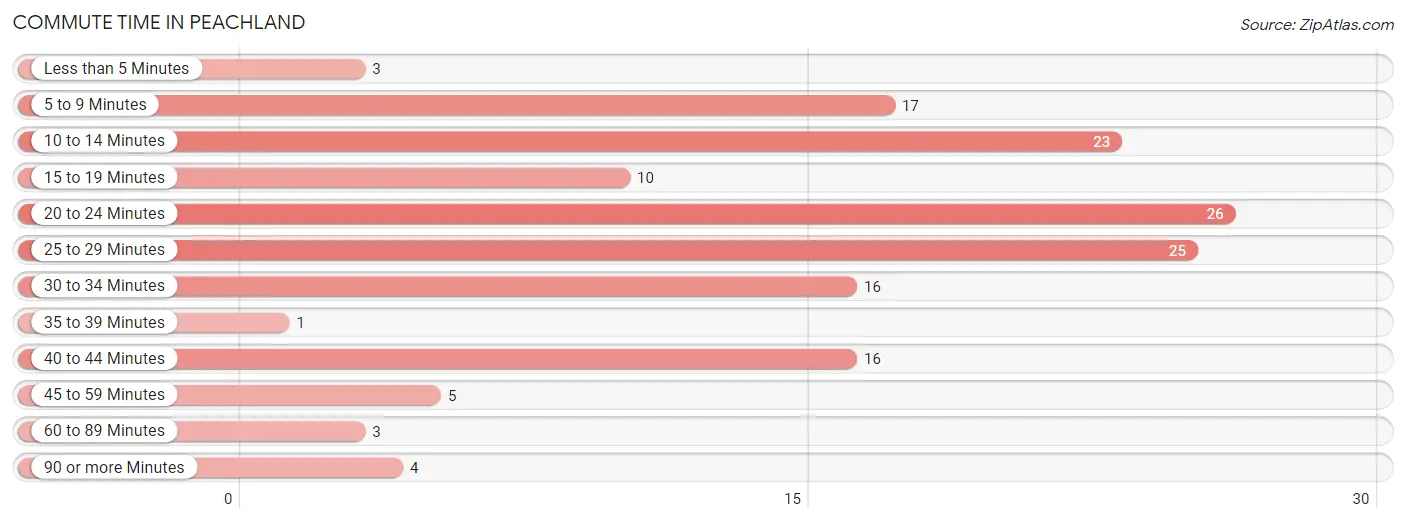
| Commute Time | # Commuters | % Commuters |
| Less than 5 Minutes | 3 | 2.0% |
| 5 to 9 Minutes | 17 | 11.4% |
| 10 to 14 Minutes | 23 | 15.4% |
| 15 to 19 Minutes | 10 | 6.7% |
| 20 to 24 Minutes | 26 | 17.4% |
| 25 to 29 Minutes | 25 | 16.8% |
| 30 to 34 Minutes | 16 | 10.7% |
| 35 to 39 Minutes | 1 | 0.7% |
| 40 to 44 Minutes | 16 | 10.7% |
| 45 to 59 Minutes | 5 | 3.4% |
| 60 to 89 Minutes | 3 | 2.0% |
| 90 or more Minutes | 4 | 2.7% |
Commute Time by Sex in Peachland
The most common commute times in Peachland are 10 to 14 minutes (23 commuters, 29.9%) for males and 5 to 9 minutes (16 commuters, 22.2%) for females.
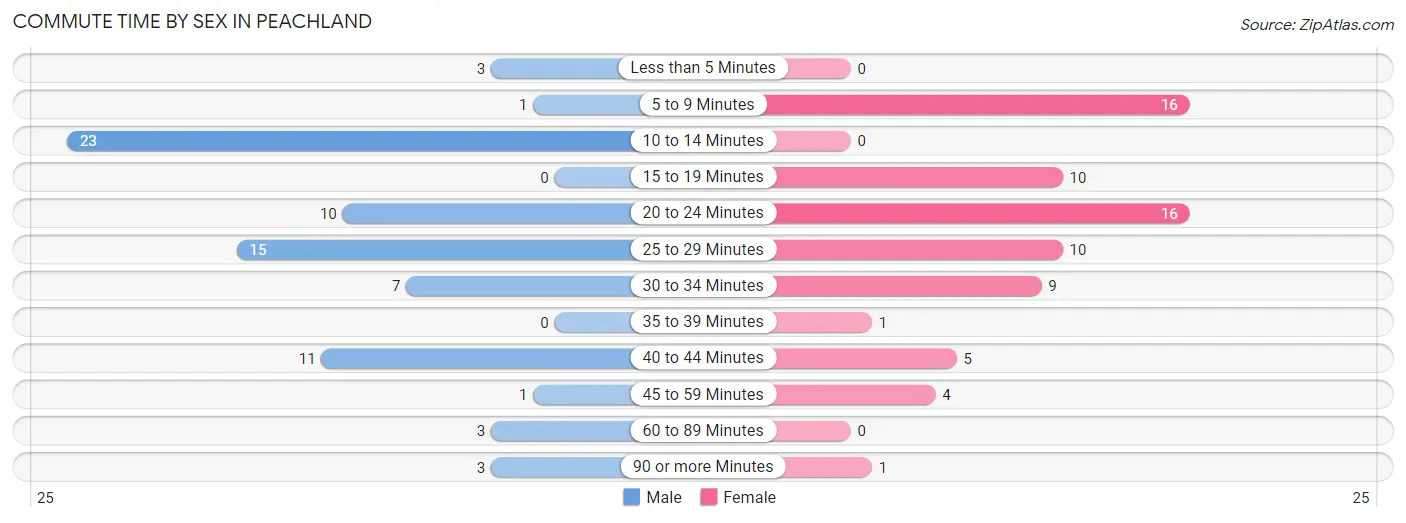
| Commute Time | Male | Female |
| Less than 5 Minutes | 3 (3.9%) | 0 (0.0%) |
| 5 to 9 Minutes | 1 (1.3%) | 16 (22.2%) |
| 10 to 14 Minutes | 23 (29.9%) | 0 (0.0%) |
| 15 to 19 Minutes | 0 (0.0%) | 10 (13.9%) |
| 20 to 24 Minutes | 10 (13.0%) | 16 (22.2%) |
| 25 to 29 Minutes | 15 (19.5%) | 10 (13.9%) |
| 30 to 34 Minutes | 7 (9.1%) | 9 (12.5%) |
| 35 to 39 Minutes | 0 (0.0%) | 1 (1.4%) |
| 40 to 44 Minutes | 11 (14.3%) | 5 (6.9%) |
| 45 to 59 Minutes | 1 (1.3%) | 4 (5.6%) |
| 60 to 89 Minutes | 3 (3.9%) | 0 (0.0%) |
| 90 or more Minutes | 3 (3.9%) | 1 (1.4%) |
Time of Departure to Work by Sex in Peachland
The most frequent times of departure to work in Peachland are 4:00 PM to 11:59 PM (23, 29.9%) for males and 4:00 PM to 11:59 PM (13, 18.1%) for females.
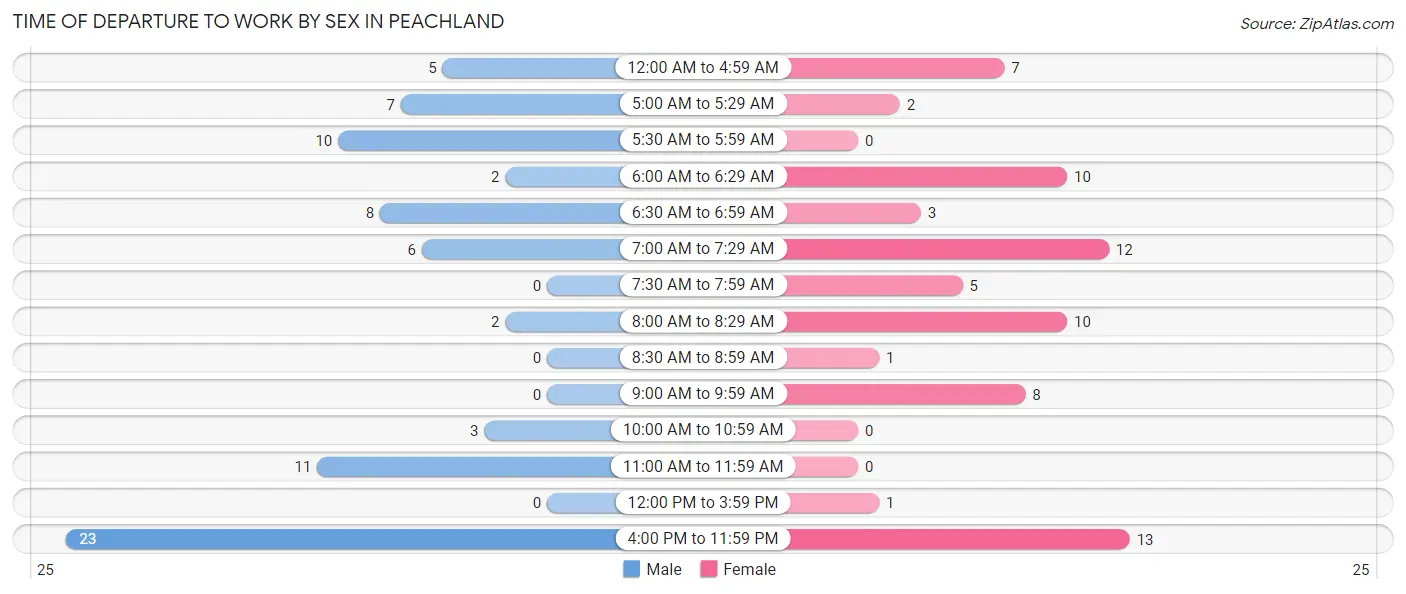
| Time of Departure | Male | Female |
| 12:00 AM to 4:59 AM | 5 (6.5%) | 7 (9.7%) |
| 5:00 AM to 5:29 AM | 7 (9.1%) | 2 (2.8%) |
| 5:30 AM to 5:59 AM | 10 (13.0%) | 0 (0.0%) |
| 6:00 AM to 6:29 AM | 2 (2.6%) | 10 (13.9%) |
| 6:30 AM to 6:59 AM | 8 (10.4%) | 3 (4.2%) |
| 7:00 AM to 7:29 AM | 6 (7.8%) | 12 (16.7%) |
| 7:30 AM to 7:59 AM | 0 (0.0%) | 5 (6.9%) |
| 8:00 AM to 8:29 AM | 2 (2.6%) | 10 (13.9%) |
| 8:30 AM to 8:59 AM | 0 (0.0%) | 1 (1.4%) |
| 9:00 AM to 9:59 AM | 0 (0.0%) | 8 (11.1%) |
| 10:00 AM to 10:59 AM | 3 (3.9%) | 0 (0.0%) |
| 11:00 AM to 11:59 AM | 11 (14.3%) | 0 (0.0%) |
| 12:00 PM to 3:59 PM | 0 (0.0%) | 1 (1.4%) |
| 4:00 PM to 11:59 PM | 23 (29.9%) | 13 (18.1%) |
| Total | 77 (100.0%) | 72 (100.0%) |
Housing Occupancy in Peachland
Occupancy by Ownership in Peachland
Of the total 145 dwellings in Peachland, owner-occupied units account for 106 (73.1%), while renter-occupied units make up 39 (26.9%).
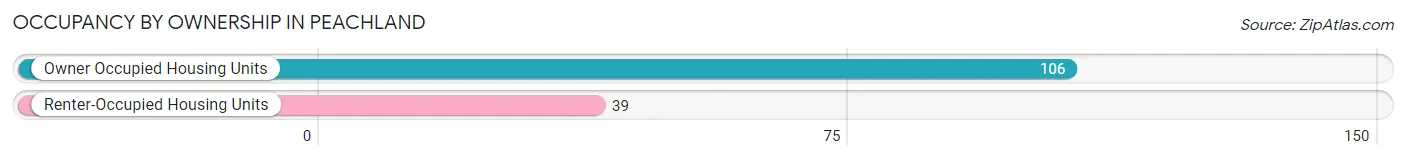
| Occupancy | # Housing Units | % Housing Units |
| Owner Occupied Housing Units | 106 | 73.1% |
| Renter-Occupied Housing Units | 39 | 26.9% |
| Total Occupied Housing Units | 145 | 100.0% |
Occupancy by Household Size in Peachland
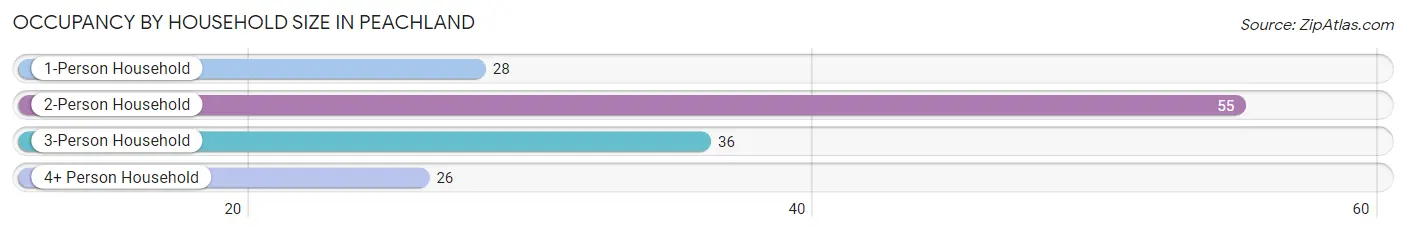
| Household Size | # Housing Units | % Housing Units |
| 1-Person Household | 28 | 19.3% |
| 2-Person Household | 55 | 37.9% |
| 3-Person Household | 36 | 24.8% |
| 4+ Person Household | 26 | 17.9% |
| Total Housing Units | 145 | 100.0% |
Occupancy by Ownership by Household Size in Peachland
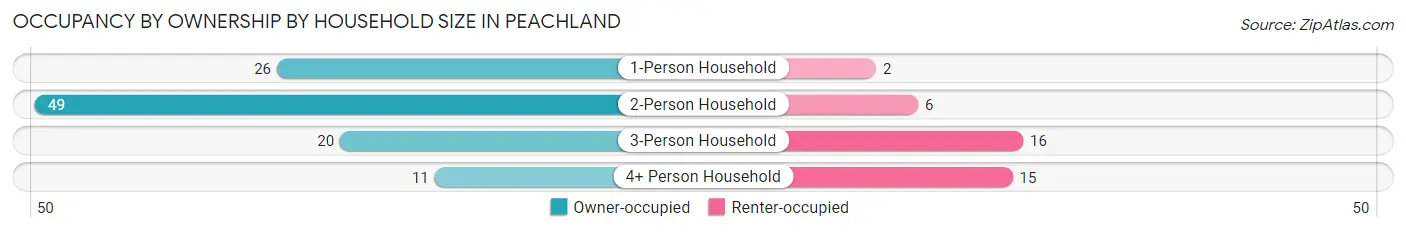
| Household Size | Owner-occupied | Renter-occupied |
| 1-Person Household | 26 (92.9%) | 2 (7.1%) |
| 2-Person Household | 49 (89.1%) | 6 (10.9%) |
| 3-Person Household | 20 (55.6%) | 16 (44.4%) |
| 4+ Person Household | 11 (42.3%) | 15 (57.7%) |
| Total Housing Units | 106 (73.1%) | 39 (26.9%) |
Occupancy by Educational Attainment in Peachland
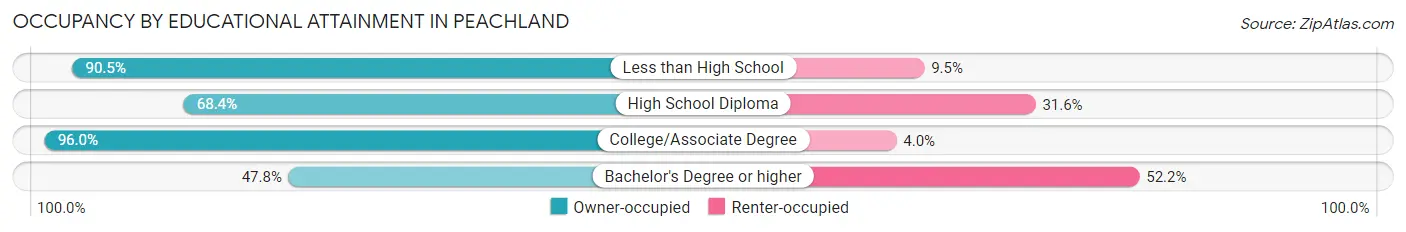
| Household Size | Owner-occupied | Renter-occupied |
| Less than High School | 19 (90.5%) | 2 (9.5%) |
| High School Diploma | 52 (68.4%) | 24 (31.6%) |
| College/Associate Degree | 24 (96.0%) | 1 (4.0%) |
| Bachelor's Degree or higher | 11 (47.8%) | 12 (52.2%) |
Occupancy by Age of Householder in Peachland
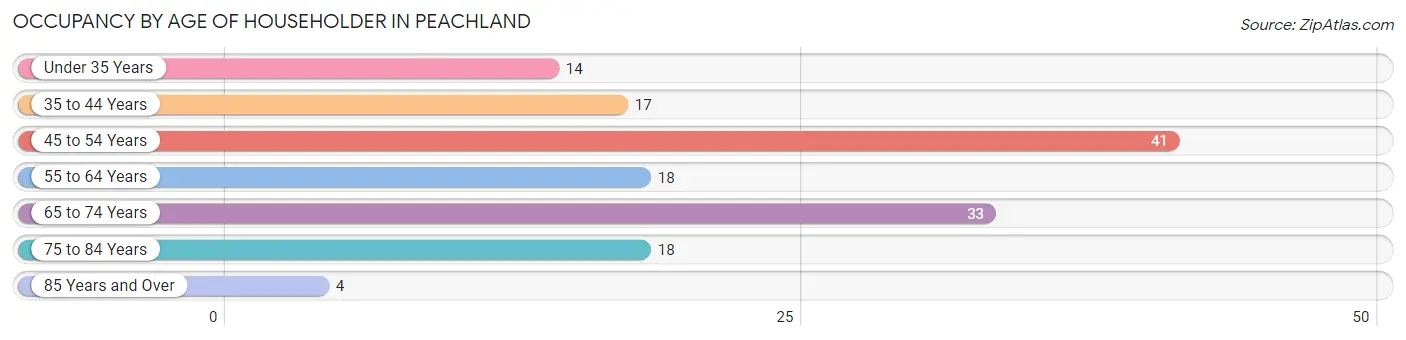
| Age Bracket | # Households | % Households |
| Under 35 Years | 14 | 9.7% |
| 35 to 44 Years | 17 | 11.7% |
| 45 to 54 Years | 41 | 28.3% |
| 55 to 64 Years | 18 | 12.4% |
| 65 to 74 Years | 33 | 22.8% |
| 75 to 84 Years | 18 | 12.4% |
| 85 Years and Over | 4 | 2.8% |
| Total | 145 | 100.0% |
Housing Finances in Peachland
Median Income by Occupancy in Peachland
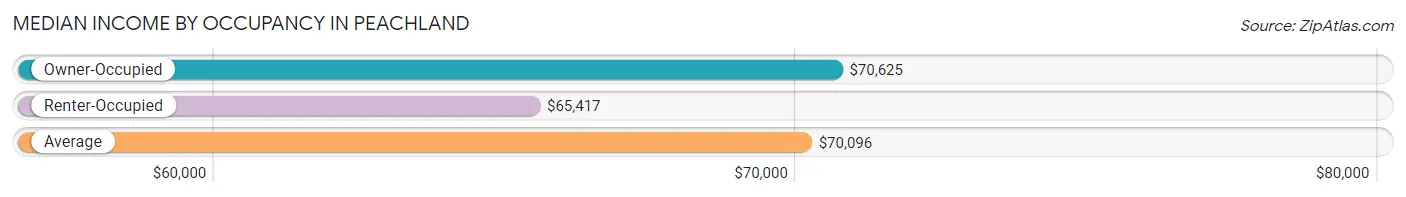
| Occupancy Type | # Households | Median Income |
| Owner-Occupied | 106 (73.1%) | $70,625 |
| Renter-Occupied | 39 (26.9%) | $65,417 |
| Average | 145 (100.0%) | $70,096 |
Occupancy by Householder Income Bracket in Peachland
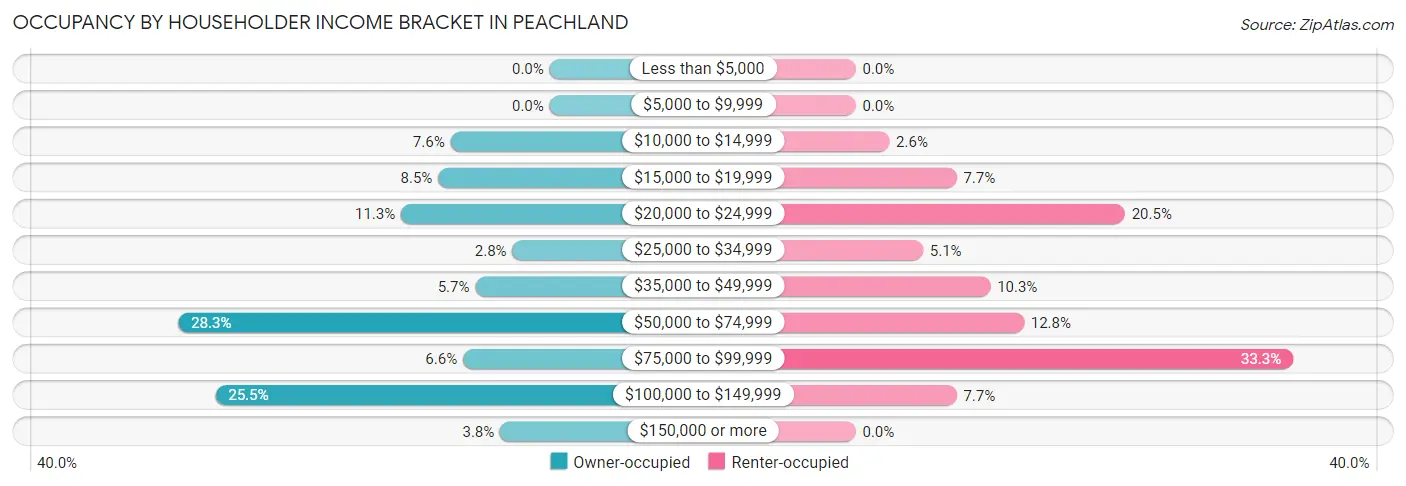
| Income Bracket | Owner-occupied | Renter-occupied |
| Less than $5,000 | 0 (0.0%) | 0 (0.0%) |
| $5,000 to $9,999 | 0 (0.0%) | 0 (0.0%) |
| $10,000 to $14,999 | 8 (7.5%) | 1 (2.6%) |
| $15,000 to $19,999 | 9 (8.5%) | 3 (7.7%) |
| $20,000 to $24,999 | 12 (11.3%) | 8 (20.5%) |
| $25,000 to $34,999 | 3 (2.8%) | 2 (5.1%) |
| $35,000 to $49,999 | 6 (5.7%) | 4 (10.3%) |
| $50,000 to $74,999 | 30 (28.3%) | 5 (12.8%) |
| $75,000 to $99,999 | 7 (6.6%) | 13 (33.3%) |
| $100,000 to $149,999 | 27 (25.5%) | 3 (7.7%) |
| $150,000 or more | 4 (3.8%) | 0 (0.0%) |
| Total | 106 (100.0%) | 39 (100.0%) |
Monthly Housing Cost Tiers in Peachland
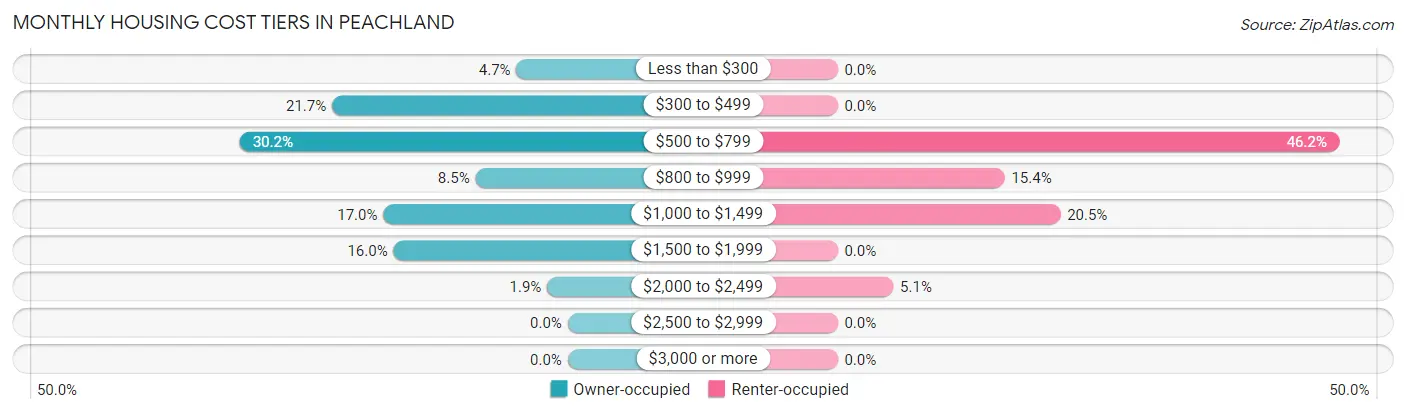
| Monthly Cost | Owner-occupied | Renter-occupied |
| Less than $300 | 5 (4.7%) | 0 (0.0%) |
| $300 to $499 | 23 (21.7%) | 0 (0.0%) |
| $500 to $799 | 32 (30.2%) | 18 (46.2%) |
| $800 to $999 | 9 (8.5%) | 6 (15.4%) |
| $1,000 to $1,499 | 18 (17.0%) | 8 (20.5%) |
| $1,500 to $1,999 | 17 (16.0%) | 0 (0.0%) |
| $2,000 to $2,499 | 2 (1.9%) | 2 (5.1%) |
| $2,500 to $2,999 | 0 (0.0%) | 0 (0.0%) |
| $3,000 or more | 0 (0.0%) | 0 (0.0%) |
| Total | 106 (100.0%) | 39 (100.0%) |
Physical Housing Characteristics in Peachland
Housing Structures in Peachland
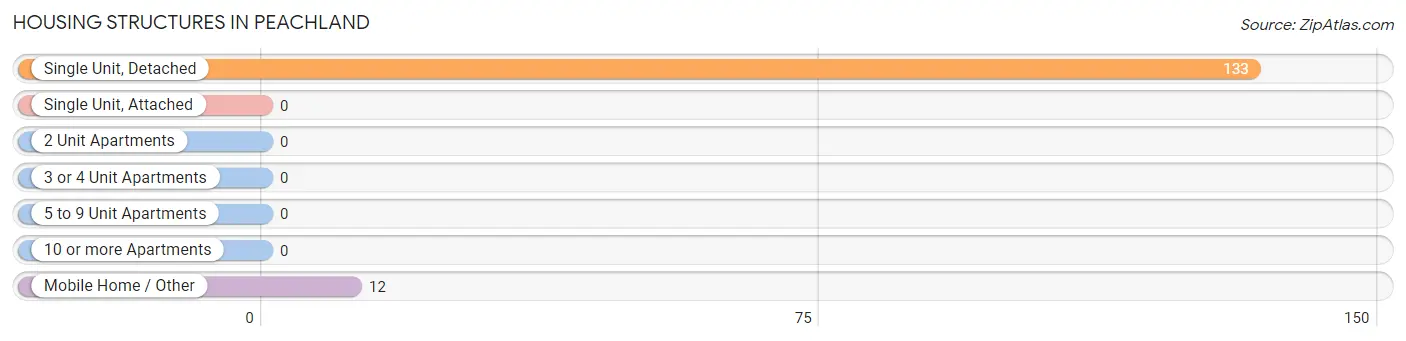
| Structure Type | # Housing Units | % Housing Units |
| Single Unit, Detached | 133 | 91.7% |
| Single Unit, Attached | 0 | 0.0% |
| 2 Unit Apartments | 0 | 0.0% |
| 3 or 4 Unit Apartments | 0 | 0.0% |
| 5 to 9 Unit Apartments | 0 | 0.0% |
| 10 or more Apartments | 0 | 0.0% |
| Mobile Home / Other | 12 | 8.3% |
| Total | 145 | 100.0% |
Housing Structures by Occupancy in Peachland
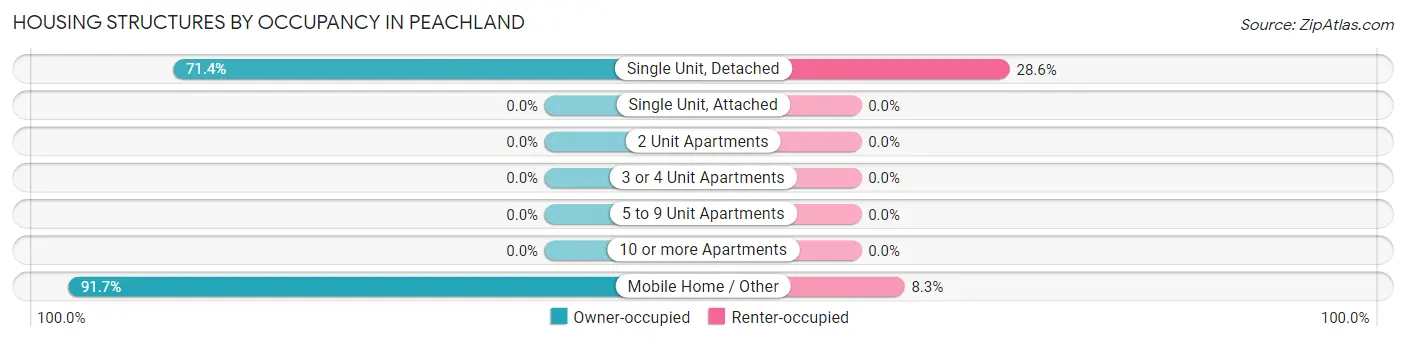
| Structure Type | Owner-occupied | Renter-occupied |
| Single Unit, Detached | 95 (71.4%) | 38 (28.6%) |
| Single Unit, Attached | 0 (0.0%) | 0 (0.0%) |
| 2 Unit Apartments | 0 (0.0%) | 0 (0.0%) |
| 3 or 4 Unit Apartments | 0 (0.0%) | 0 (0.0%) |
| 5 to 9 Unit Apartments | 0 (0.0%) | 0 (0.0%) |
| 10 or more Apartments | 0 (0.0%) | 0 (0.0%) |
| Mobile Home / Other | 11 (91.7%) | 1 (8.3%) |
| Total | 106 (73.1%) | 39 (26.9%) |
Housing Structures by Number of Rooms in Peachland
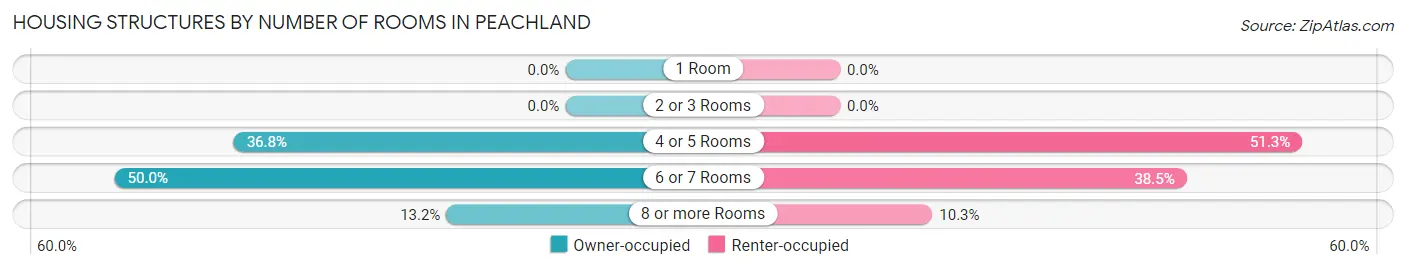
| Number of Rooms | Owner-occupied | Renter-occupied |
| 1 Room | 0 (0.0%) | 0 (0.0%) |
| 2 or 3 Rooms | 0 (0.0%) | 0 (0.0%) |
| 4 or 5 Rooms | 39 (36.8%) | 20 (51.3%) |
| 6 or 7 Rooms | 53 (50.0%) | 15 (38.5%) |
| 8 or more Rooms | 14 (13.2%) | 4 (10.3%) |
| Total | 106 (100.0%) | 39 (100.0%) |
Housing Structure by Heating Type in Peachland
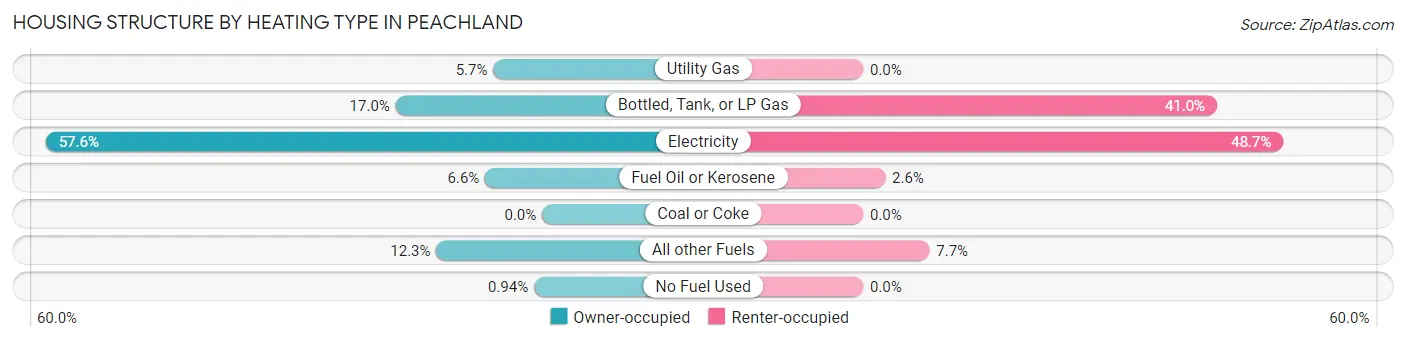
| Heating Type | Owner-occupied | Renter-occupied |
| Utility Gas | 6 (5.7%) | 0 (0.0%) |
| Bottled, Tank, or LP Gas | 18 (17.0%) | 16 (41.0%) |
| Electricity | 61 (57.6%) | 19 (48.7%) |
| Fuel Oil or Kerosene | 7 (6.6%) | 1 (2.6%) |
| Coal or Coke | 0 (0.0%) | 0 (0.0%) |
| All other Fuels | 13 (12.3%) | 3 (7.7%) |
| No Fuel Used | 1 (0.9%) | 0 (0.0%) |
| Total | 106 (100.0%) | 39 (100.0%) |
Household Vehicle Usage in Peachland
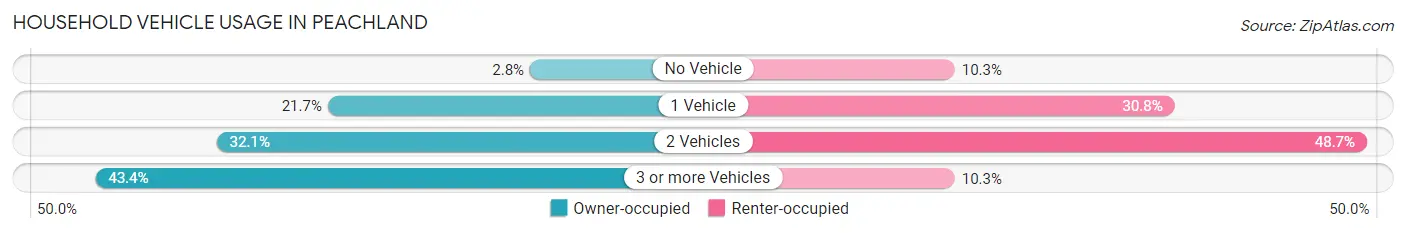
| Vehicles per Household | Owner-occupied | Renter-occupied |
| No Vehicle | 3 (2.8%) | 4 (10.3%) |
| 1 Vehicle | 23 (21.7%) | 12 (30.8%) |
| 2 Vehicles | 34 (32.1%) | 19 (48.7%) |
| 3 or more Vehicles | 46 (43.4%) | 4 (10.3%) |
| Total | 106 (100.0%) | 39 (100.0%) |
Real Estate & Mortgages in Peachland
Real Estate and Mortgage Overview in Peachland
| Characteristic | Without Mortgage | With Mortgage |
| Housing Units | 50 | 56 |
| Median Property Value | $117,600 | $148,100 |
| Median Household Income | $70,250 | $1 |
| Monthly Housing Costs | $475 | $0 |
| Real Estate Taxes | $1,100 | $0 |
Property Value by Mortgage Status in Peachland
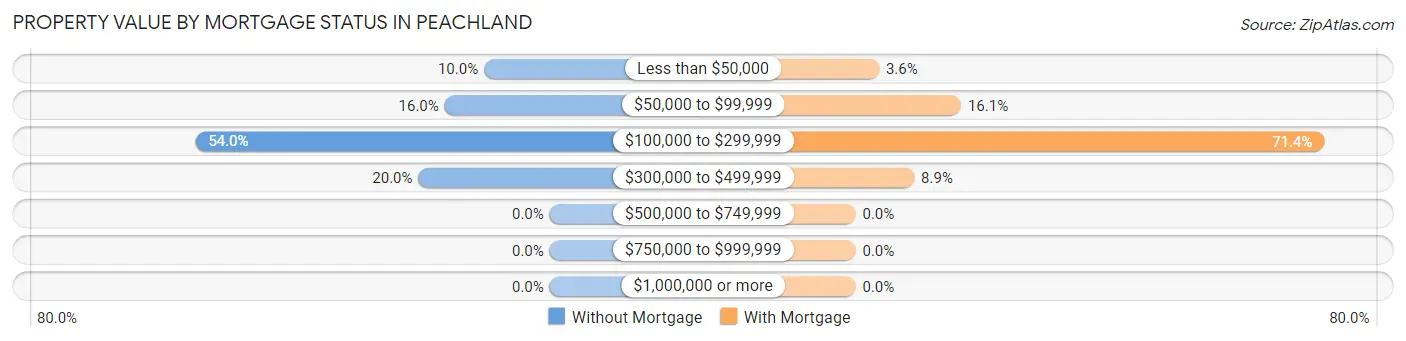
| Property Value | Without Mortgage | With Mortgage |
| Less than $50,000 | 5 (10.0%) | 2 (3.6%) |
| $50,000 to $99,999 | 8 (16.0%) | 9 (16.1%) |
| $100,000 to $299,999 | 27 (54.0%) | 40 (71.4%) |
| $300,000 to $499,999 | 10 (20.0%) | 5 (8.9%) |
| $500,000 to $749,999 | 0 (0.0%) | 0 (0.0%) |
| $750,000 to $999,999 | 0 (0.0%) | 0 (0.0%) |
| $1,000,000 or more | 0 (0.0%) | 0 (0.0%) |
| Total | 50 (100.0%) | 56 (100.0%) |
Household Income by Mortgage Status in Peachland
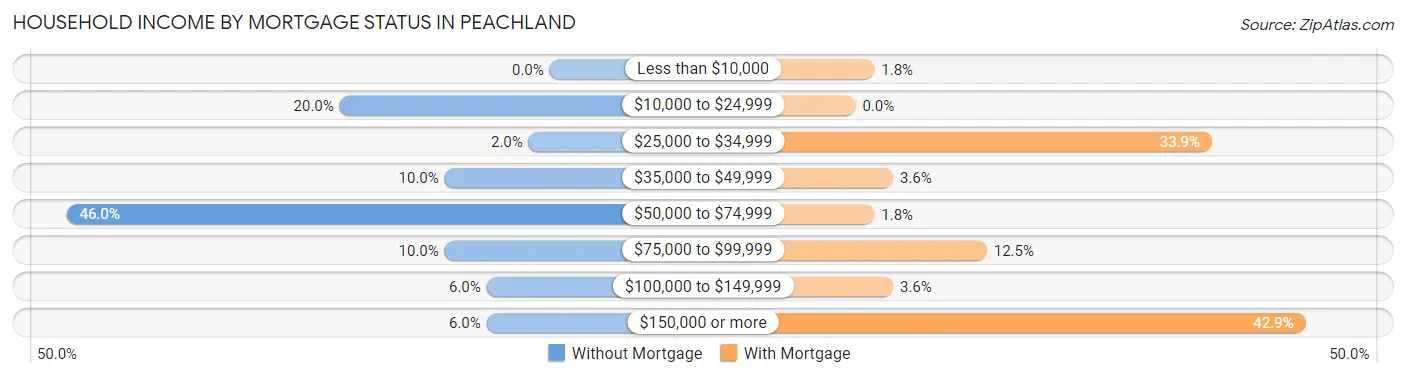
| Household Income | Without Mortgage | With Mortgage |
| Less than $10,000 | 0 (0.0%) | 1 (1.8%) |
| $10,000 to $24,999 | 10 (20.0%) | 0 (0.0%) |
| $25,000 to $34,999 | 1 (2.0%) | 19 (33.9%) |
| $35,000 to $49,999 | 5 (10.0%) | 2 (3.6%) |
| $50,000 to $74,999 | 23 (46.0%) | 1 (1.8%) |
| $75,000 to $99,999 | 5 (10.0%) | 7 (12.5%) |
| $100,000 to $149,999 | 3 (6.0%) | 2 (3.6%) |
| $150,000 or more | 3 (6.0%) | 24 (42.9%) |
| Total | 50 (100.0%) | 56 (100.0%) |
Property Value to Household Income Ratio in Peachland
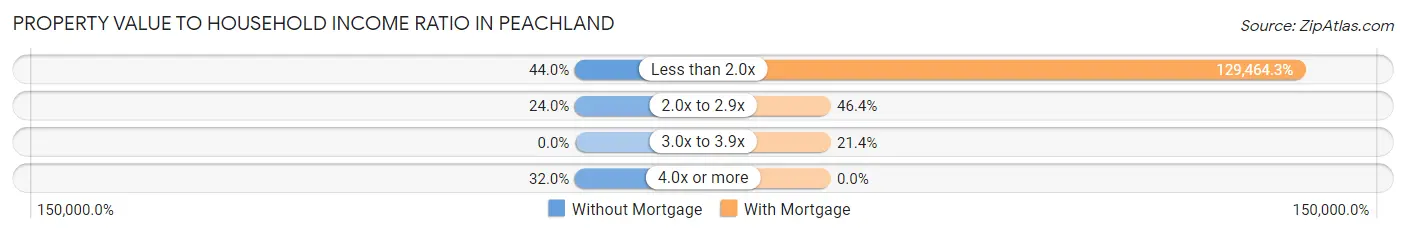
| Value-to-Income Ratio | Without Mortgage | With Mortgage |
| Less than 2.0x | 22 (44.0%) | 72,500 (129,464.3%) |
| 2.0x to 2.9x | 12 (24.0%) | 26 (46.4%) |
| 3.0x to 3.9x | 0 (0.0%) | 12 (21.4%) |
| 4.0x or more | 16 (32.0%) | 0 (0.0%) |
| Total | 50 (100.0%) | 56 (100.0%) |
Real Estate Taxes by Mortgage Status in Peachland
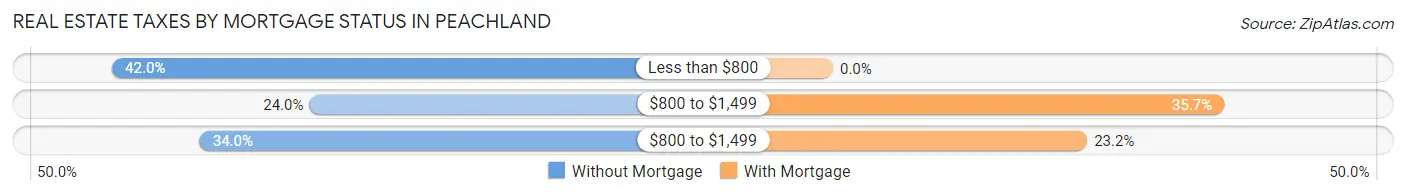
| Property Taxes | Without Mortgage | With Mortgage |
| Less than $800 | 21 (42.0%) | 0 (0.0%) |
| $800 to $1,499 | 12 (24.0%) | 20 (35.7%) |
| $800 to $1,499 | 17 (34.0%) | 13 (23.2%) |
| Total | 50 (100.0%) | 56 (100.0%) |
Health & Disability in Peachland
Health Insurance Coverage by Age in Peachland
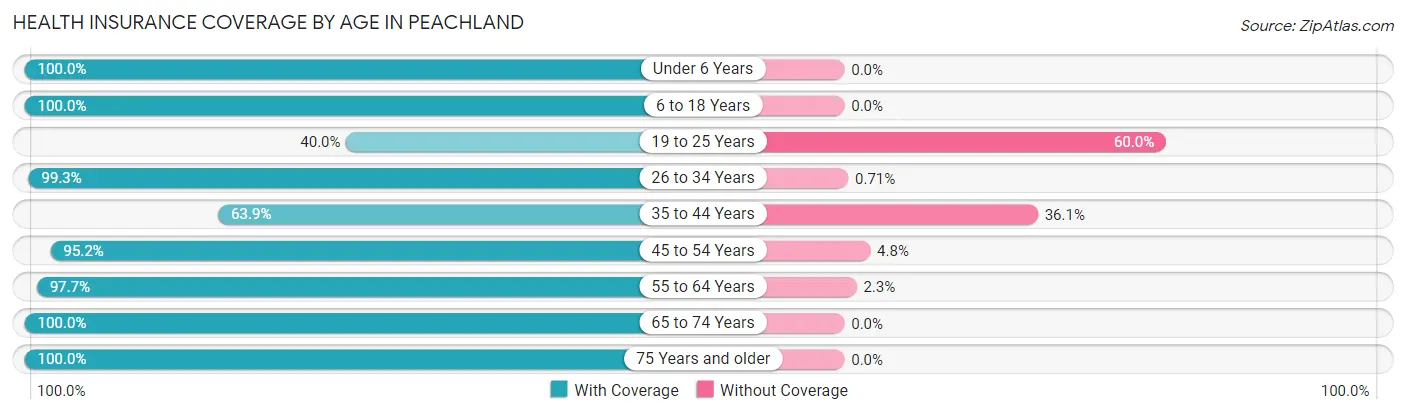
| Age Bracket | With Coverage | Without Coverage |
| Under 6 Years | 27 (100.0%) | 0 (0.0%) |
| 6 to 18 Years | 43 (100.0%) | 0 (0.0%) |
| 19 to 25 Years | 2 (40.0%) | 3 (60.0%) |
| 26 to 34 Years | 139 (99.3%) | 1 (0.7%) |
| 35 to 44 Years | 39 (63.9%) | 22 (36.1%) |
| 45 to 54 Years | 79 (95.2%) | 4 (4.8%) |
| 55 to 64 Years | 43 (97.7%) | 1 (2.3%) |
| 65 to 74 Years | 38 (100.0%) | 0 (0.0%) |
| 75 Years and older | 24 (100.0%) | 0 (0.0%) |
| Total | 434 (93.3%) | 31 (6.7%) |
Health Insurance Coverage by Citizenship Status in Peachland
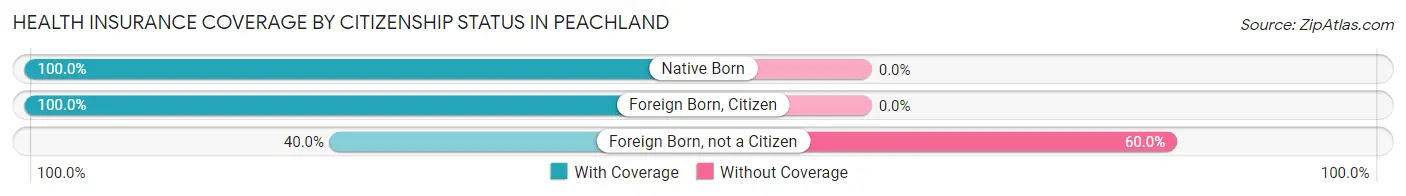
| Citizenship Status | With Coverage | Without Coverage |
| Native Born | 27 (100.0%) | 0 (0.0%) |
| Foreign Born, Citizen | 43 (100.0%) | 0 (0.0%) |
| Foreign Born, not a Citizen | 2 (40.0%) | 3 (60.0%) |
Health Insurance Coverage by Household Income in Peachland
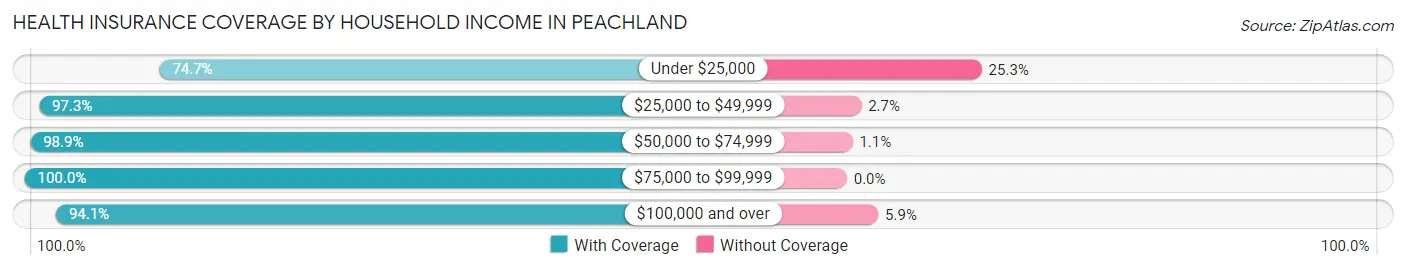
| Household Income | With Coverage | Without Coverage |
| Under $25,000 | 68 (74.7%) | 23 (25.3%) |
| $25,000 to $49,999 | 36 (97.3%) | 1 (2.7%) |
| $50,000 to $74,999 | 186 (98.9%) | 2 (1.1%) |
| $75,000 to $99,999 | 64 (100.0%) | 0 (0.0%) |
| $100,000 and over | 80 (94.1%) | 5 (5.9%) |
Public vs Private Health Insurance Coverage by Age in Peachland
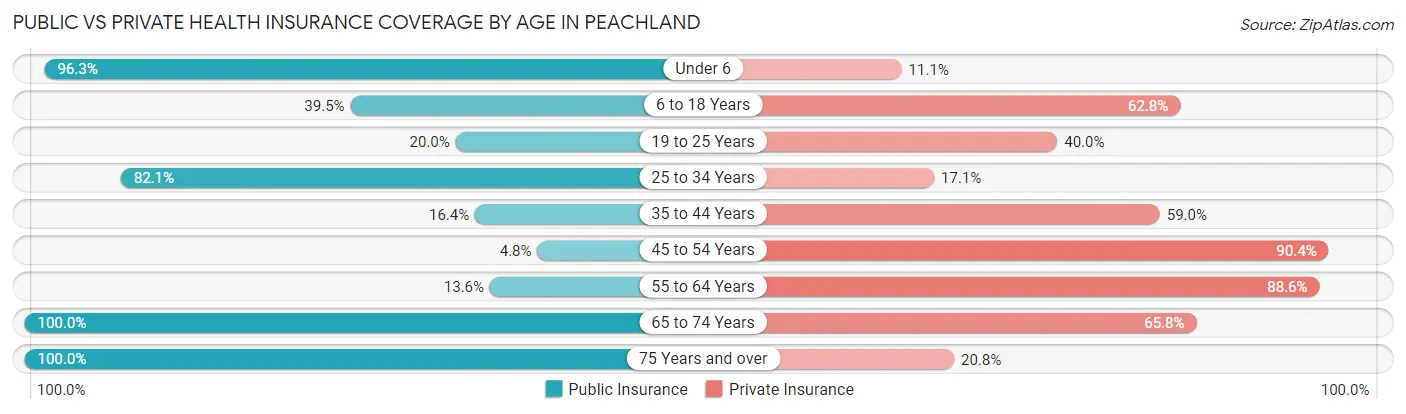
| Age Bracket | Public Insurance | Private Insurance |
| Under 6 | 26 (96.3%) | 3 (11.1%) |
| 6 to 18 Years | 17 (39.5%) | 27 (62.8%) |
| 19 to 25 Years | 1 (20.0%) | 2 (40.0%) |
| 25 to 34 Years | 115 (82.1%) | 24 (17.1%) |
| 35 to 44 Years | 10 (16.4%) | 36 (59.0%) |
| 45 to 54 Years | 4 (4.8%) | 75 (90.4%) |
| 55 to 64 Years | 6 (13.6%) | 39 (88.6%) |
| 65 to 74 Years | 38 (100.0%) | 25 (65.8%) |
| 75 Years and over | 24 (100.0%) | 5 (20.8%) |
| Total | 241 (51.8%) | 236 (50.7%) |
Disability Status by Sex by Age in Peachland
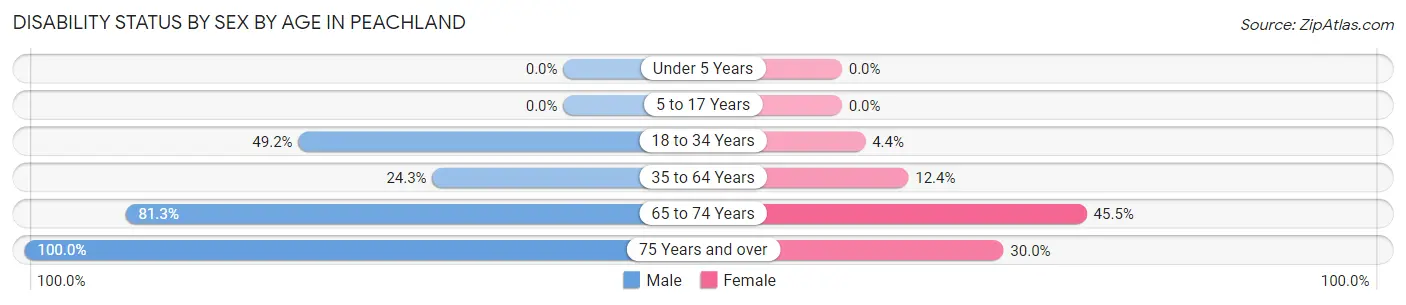
| Age Bracket | Male | Female |
| Under 5 Years | 0 (0.0%) | 0 (0.0%) |
| 5 to 17 Years | 0 (0.0%) | 0 (0.0%) |
| 18 to 34 Years | 60 (49.2%) | 1 (4.3%) |
| 35 to 64 Years | 26 (24.3%) | 10 (12.3%) |
| 65 to 74 Years | 13 (81.2%) | 10 (45.5%) |
| 75 Years and over | 4 (100.0%) | 6 (30.0%) |
Disability Class by Sex by Age in Peachland
Disability Class: Hearing Difficulty
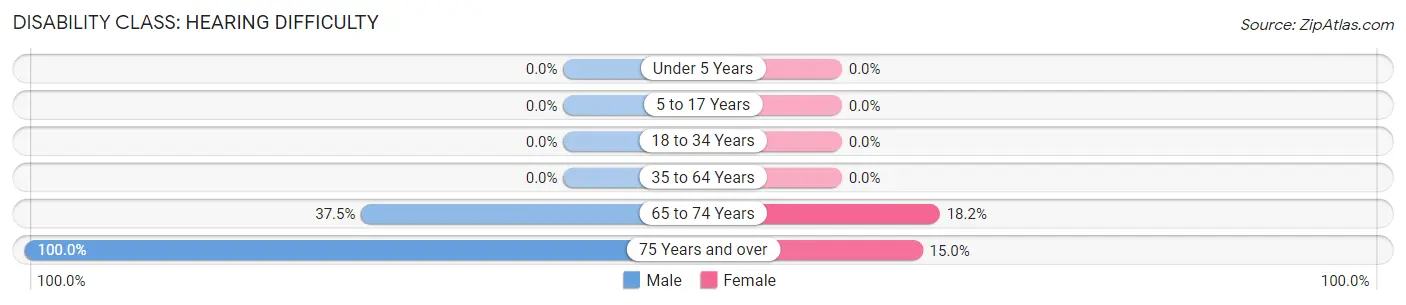
| Age Bracket | Male | Female |
| Under 5 Years | 0 (0.0%) | 0 (0.0%) |
| 5 to 17 Years | 0 (0.0%) | 0 (0.0%) |
| 18 to 34 Years | 0 (0.0%) | 0 (0.0%) |
| 35 to 64 Years | 0 (0.0%) | 0 (0.0%) |
| 65 to 74 Years | 6 (37.5%) | 4 (18.2%) |
| 75 Years and over | 4 (100.0%) | 3 (15.0%) |
Disability Class: Vision Difficulty
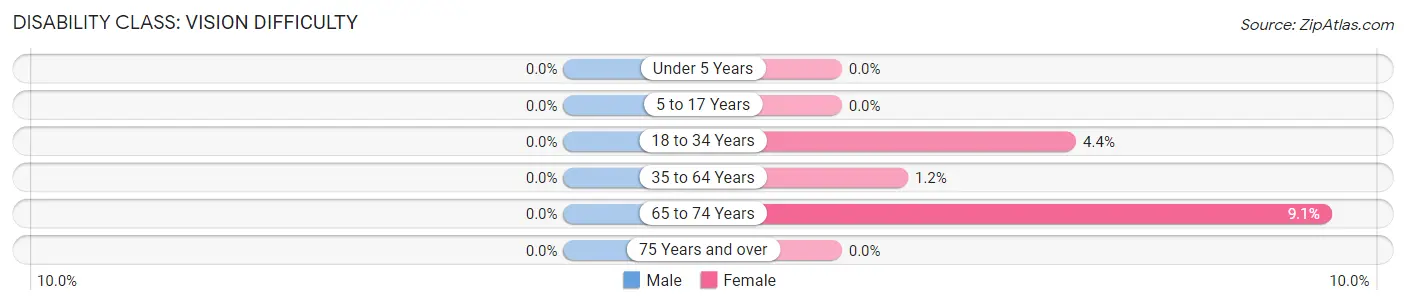
| Age Bracket | Male | Female |
| Under 5 Years | 0 (0.0%) | 0 (0.0%) |
| 5 to 17 Years | 0 (0.0%) | 0 (0.0%) |
| 18 to 34 Years | 0 (0.0%) | 1 (4.3%) |
| 35 to 64 Years | 0 (0.0%) | 1 (1.2%) |
| 65 to 74 Years | 0 (0.0%) | 2 (9.1%) |
| 75 Years and over | 0 (0.0%) | 0 (0.0%) |
Disability Class: Cognitive Difficulty
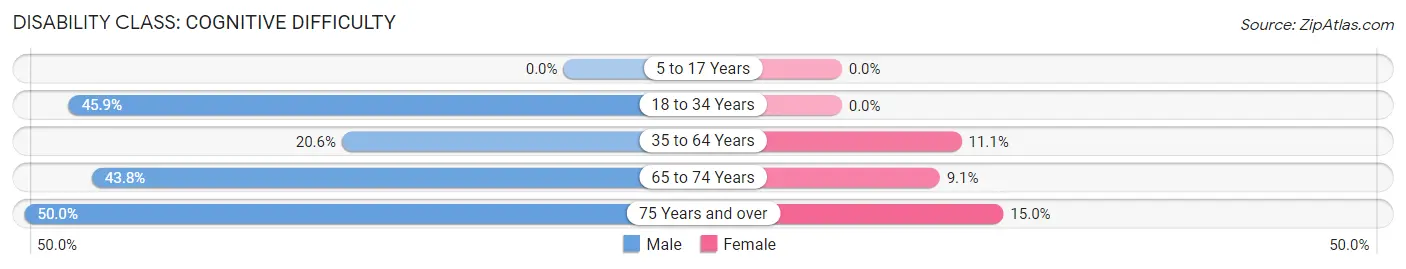
| Age Bracket | Male | Female |
| 5 to 17 Years | 0 (0.0%) | 0 (0.0%) |
| 18 to 34 Years | 56 (45.9%) | 0 (0.0%) |
| 35 to 64 Years | 22 (20.6%) | 9 (11.1%) |
| 65 to 74 Years | 7 (43.8%) | 2 (9.1%) |
| 75 Years and over | 2 (50.0%) | 3 (15.0%) |
Disability Class: Ambulatory Difficulty
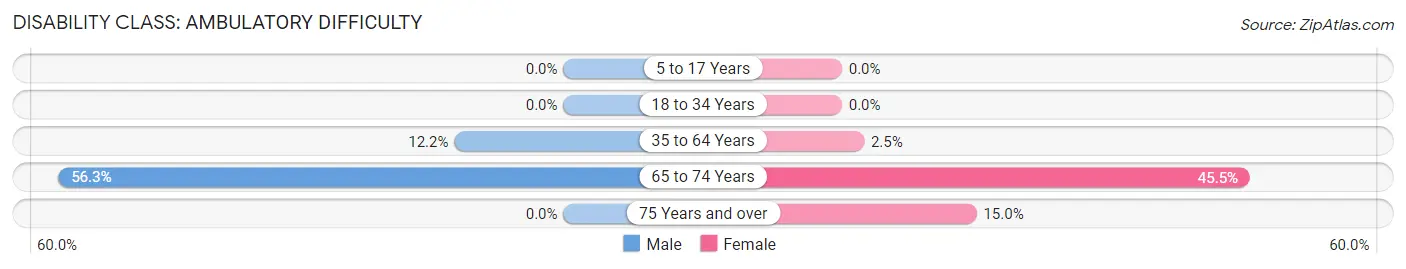
| Age Bracket | Male | Female |
| 5 to 17 Years | 0 (0.0%) | 0 (0.0%) |
| 18 to 34 Years | 0 (0.0%) | 0 (0.0%) |
| 35 to 64 Years | 13 (12.1%) | 2 (2.5%) |
| 65 to 74 Years | 9 (56.2%) | 10 (45.5%) |
| 75 Years and over | 0 (0.0%) | 3 (15.0%) |
Disability Class: Self-Care Difficulty
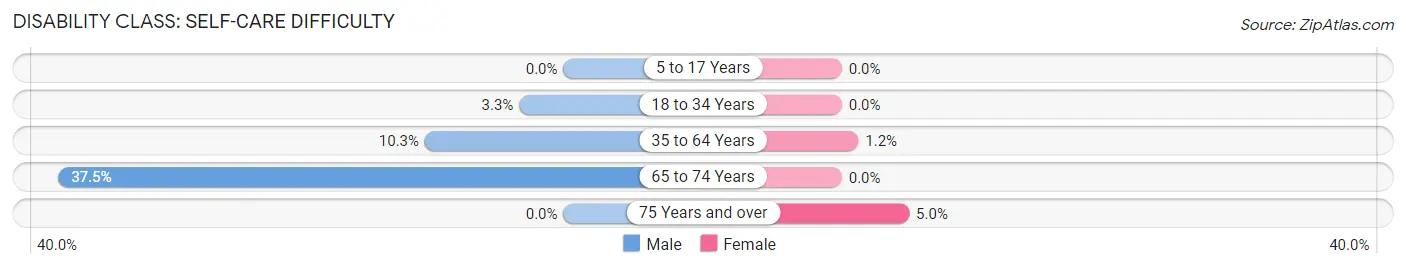
| Age Bracket | Male | Female |
| 5 to 17 Years | 0 (0.0%) | 0 (0.0%) |
| 18 to 34 Years | 4 (3.3%) | 0 (0.0%) |
| 35 to 64 Years | 11 (10.3%) | 1 (1.2%) |
| 65 to 74 Years | 6 (37.5%) | 0 (0.0%) |
| 75 Years and over | 0 (0.0%) | 1 (5.0%) |
Technology Access in Peachland
Computing Device Access in Peachland
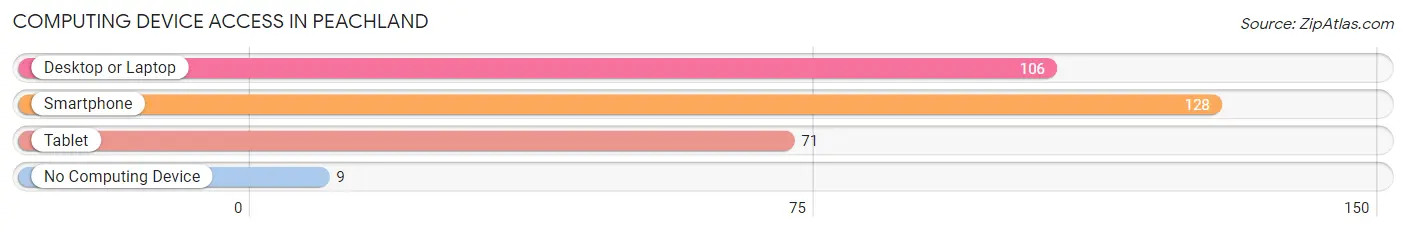
| Device Type | # Households | % Households |
| Desktop or Laptop | 106 | 73.1% |
| Smartphone | 128 | 88.3% |
| Tablet | 71 | 49.0% |
| No Computing Device | 9 | 6.2% |
| Total | 145 | 100.0% |
Internet Access in Peachland
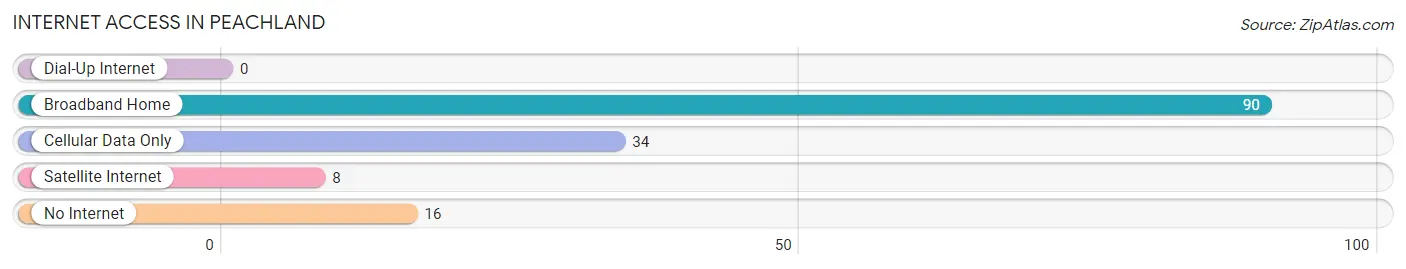
| Internet Type | # Households | % Households |
| Dial-Up Internet | 0 | 0.0% |
| Broadband Home | 90 | 62.1% |
| Cellular Data Only | 34 | 23.4% |
| Satellite Internet | 8 | 5.5% |
| No Internet | 16 | 11.0% |
| Total | 145 | 100.0% |
Peachland Summary
Peachland is a small town located in Anson County, North Carolina. It is situated on the banks of the Pee Dee River, about 25 miles east of Charlotte. The town was founded in 1891 and has a population of approximately 1,000 people.
Geography
Peachland is located in the Piedmont region of North Carolina, which is characterized by rolling hills and flat plains. The town is situated on the banks of the Pee Dee River, which is a major tributary of the Cape Fear River. The town is surrounded by farmland and is located near the towns of Wadesboro and Lilesville.
The climate in Peachland is humid subtropical, with hot, humid summers and mild winters. The average annual temperature is around 70 degrees Fahrenheit, with an average high of around 90 degrees in the summer and an average low of around 40 degrees in the winter.
Economy
The economy of Peachland is largely based on agriculture. The town is home to several farms, which produce a variety of crops, including corn, soybeans, cotton, and tobacco. The town also has a few small businesses, including a grocery store, a hardware store, and a few restaurants.
Demographics
As of the 2010 census, the population of Peachland was 1,000 people. The racial makeup of the town was 95.2% White, 2.2% African American, 0.2% Native American, 0.2% Asian, 0.2% from other races, and 1.2% from two or more races. Hispanic or Latino of any race were 1.2% of the population.
The median household income in Peachland was $30,000, and the median family income was $35,000. The per capita income for the town was $14,000. About 17.2% of families and 20.2% of the population were below the poverty line, including 28.2% of those under age 18 and 10.2% of those age 65 or over.
History
Peachland was founded in 1891 by a group of settlers from the nearby town of Wadesboro. The town was named after the abundance of peach trees in the area. The town quickly grew and by the early 1900s, it had become a thriving agricultural community.
In the 1920s, the town was home to several cotton mills, which provided employment for many of the town’s residents. The mills closed in the 1950s, but the town continued to thrive as an agricultural center.
In the late 20th century, Peachland began to experience a decline in population as many of its residents moved away in search of better job opportunities. However, the town has seen a resurgence in recent years, as many people have moved back to the area to take advantage of its rural charm and close proximity to Charlotte.
Common Questions
What is Per Capita Income in Peachland?
Per Capita income in Peachland is $25,484.
What is the Median Family Income in Peachland?
Median Family Income in Peachland is $73,125.
What is the Median Household income in Peachland?
Median Household Income in Peachland is $70,096.
What is Income or Wage Gap in Peachland?
Income or Wage Gap in Peachland is 23.8%.
Women in Peachland earn 76.2 cents for every dollar earned by a man.
What is Inequality or Gini Index in Peachland?
Inequality or Gini Index in Peachland is 0.37.
What is the Total Population of Peachland?
Total Population of Peachland is 465.
What is the Total Male Population of Peachland?
Total Male Population of Peachland is 295.
What is the Total Female Population of Peachland?
Total Female Population of Peachland is 170.
What is the Ratio of Males per 100 Females in Peachland?
There are 173.53 Males per 100 Females in Peachland.
What is the Ratio of Females per 100 Males in Peachland?
There are 57.63 Females per 100 Males in Peachland.
What is the Median Population Age in Peachland?
Median Population Age in Peachland is 37.6 Years.
What is the Average Family Size in Peachland
Average Family Size in Peachland is 3.7 People.
What is the Average Household Size in Peachland
Average Household Size in Peachland is 3.2 People.
How Large is the Labor Force in Peachland?
There are 159 People in the Labor Forcein in Peachland.
What is the Percentage of People in the Labor Force in Peachland?
39.2% of People are in the Labor Force in Peachland.
What is the Unemployment Rate in Peachland?
Unemployment Rate in Peachland is 1.3%.