Davis, NC Map & Demographics
Davis Map
Davis Overview
$27,111
PER CAPITA INCOME
$91,500
AVG FAMILY INCOME
$90,813
AVG HOUSEHOLD INCOME
22.4%
WAGE / INCOME GAP [ % ]
77.6¢/ $1
WAGE / INCOME GAP [ $ ]
0.18
INEQUALITY / GINI INDEX
275
TOTAL POPULATION
97
MALE POPULATION
178
FEMALE POPULATION
54.49
MALES / 100 FEMALES
183.51
FEMALES / 100 MALES
37.4
MEDIAN AGE
3.3
AVG FAMILY SIZE
2.8
AVG HOUSEHOLD SIZE
148
LABOR FORCE [ PEOPLE ]
76.7%
PERCENT IN LABOR FORCE
Davis Zip Codes
Income in Davis
Income Overview in Davis
Per Capita Income in Davis is $27,111, while median incomes of families and households are $91,500 and $90,813 respectively.
| Characteristic | Number | Measure |
| Per Capita Income | 275 | $27,111 |
| Median Family Income | 76 | $91,500 |
| Mean Family Income | 76 | $87,539 |
| Median Household Income | 98 | $90,813 |
| Mean Household Income | 98 | $77,028 |
| Income Deficit | 76 | $0 |
| Wage / Income Gap (%) | 275 | 22.35% |
| Wage / Income Gap ($) | 275 | 77.65¢ per $1 |
| Gini / Inequality Index | 275 | 0.18 |
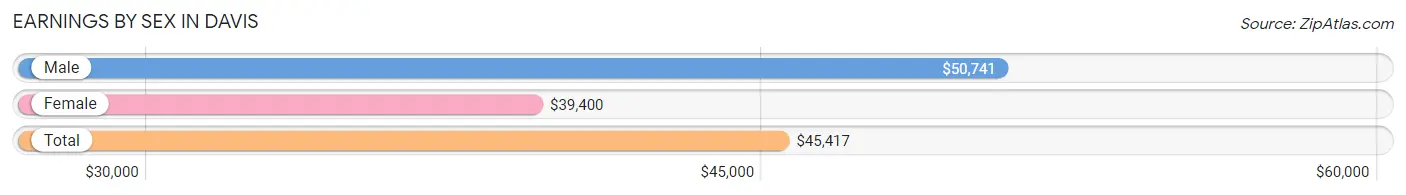
Earnings by Sex in Davis
Average Earnings in Davis are $45,417, $50,741 for men and $39,400 for women, a difference of 22.4%.
| Sex | Number | Average Earnings |
| Male | 76 (48.1%) | $50,741 |
| Female | 82 (51.9%) | $39,400 |
| Total | 158 (100.0%) | $45,417 |
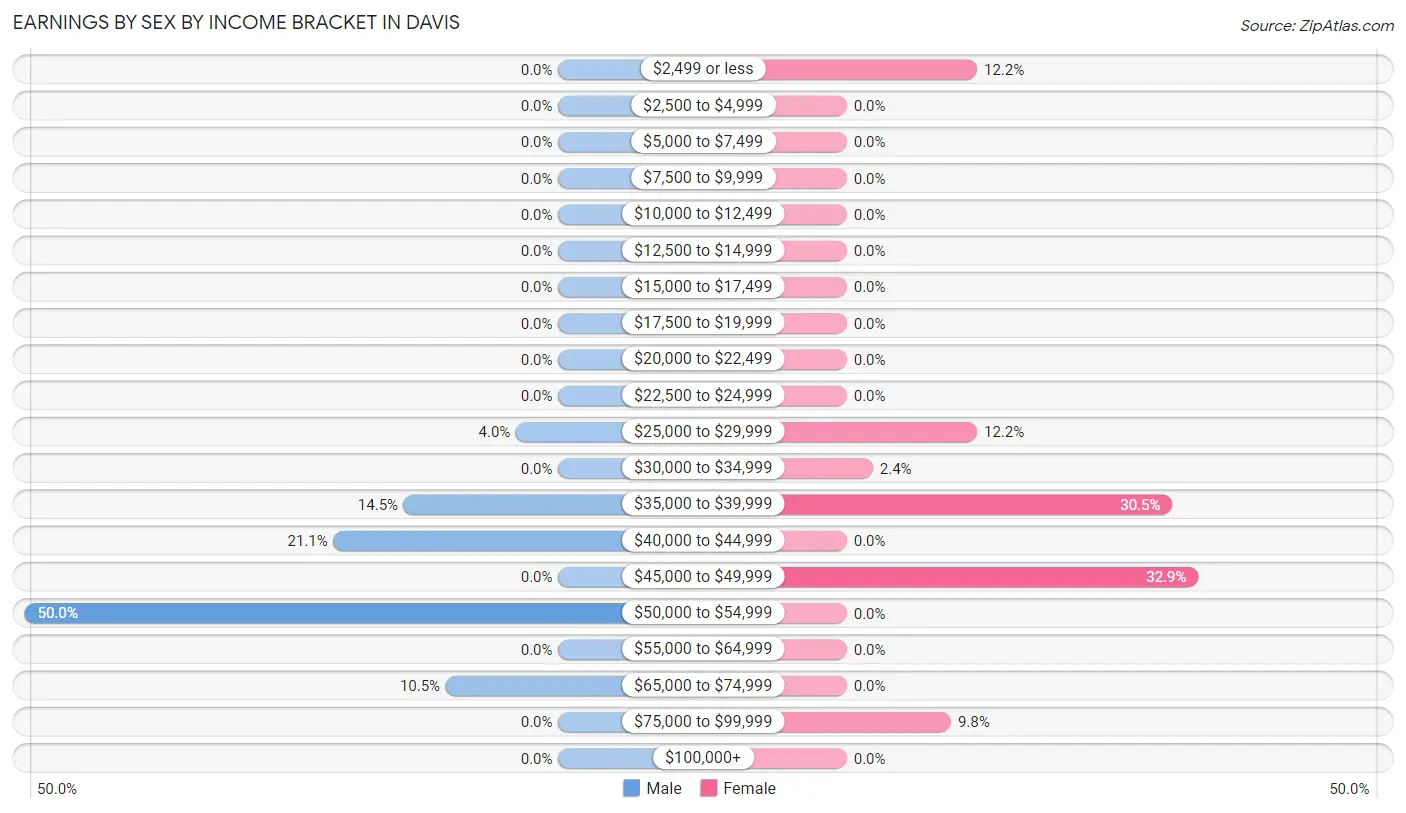
Earnings by Sex by Income Bracket in Davis
The most common earnings brackets in Davis are $50,000 to $54,999 for men (38 | 50.0%) and $45,000 to $49,999 for women (27 | 32.9%).
| Income | Male | Female |
| $2,499 or less | 0 (0.0%) | 10 (12.2%) |
| $2,500 to $4,999 | 0 (0.0%) | 0 (0.0%) |
| $5,000 to $7,499 | 0 (0.0%) | 0 (0.0%) |
| $7,500 to $9,999 | 0 (0.0%) | 0 (0.0%) |
| $10,000 to $12,499 | 0 (0.0%) | 0 (0.0%) |
| $12,500 to $14,999 | 0 (0.0%) | 0 (0.0%) |
| $15,000 to $17,499 | 0 (0.0%) | 0 (0.0%) |
| $17,500 to $19,999 | 0 (0.0%) | 0 (0.0%) |
| $20,000 to $22,499 | 0 (0.0%) | 0 (0.0%) |
| $22,500 to $24,999 | 0 (0.0%) | 0 (0.0%) |
| $25,000 to $29,999 | 3 (4.0%) | 10 (12.2%) |
| $30,000 to $34,999 | 0 (0.0%) | 2 (2.4%) |
| $35,000 to $39,999 | 11 (14.5%) | 25 (30.5%) |
| $40,000 to $44,999 | 16 (21.0%) | 0 (0.0%) |
| $45,000 to $49,999 | 0 (0.0%) | 27 (32.9%) |
| $50,000 to $54,999 | 38 (50.0%) | 0 (0.0%) |
| $55,000 to $64,999 | 0 (0.0%) | 0 (0.0%) |
| $65,000 to $74,999 | 8 (10.5%) | 0 (0.0%) |
| $75,000 to $99,999 | 0 (0.0%) | 8 (9.8%) |
| $100,000+ | 0 (0.0%) | 0 (0.0%) |
| Total | 76 (100.0%) | 82 (100.0%) |
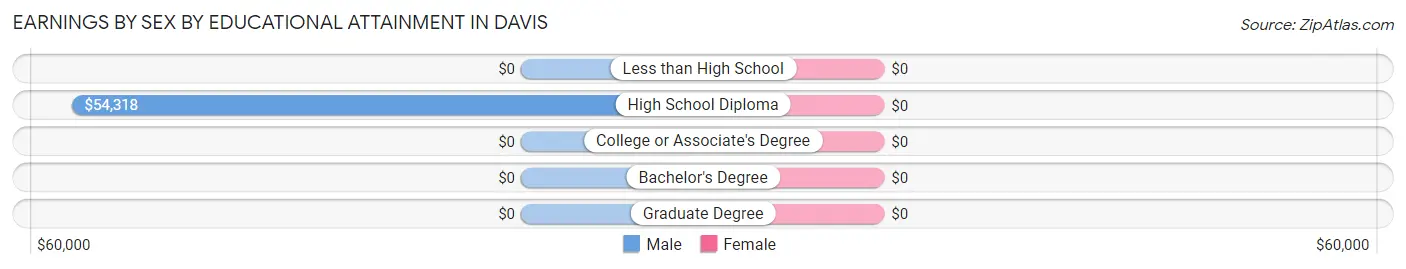
Earnings by Sex by Educational Attainment in Davis
| Educational Attainment | Male Income | Female Income |
| Less than High School | - | - |
| High School Diploma | $54,318 | $0 |
| College or Associate's Degree | - | - |
| Bachelor's Degree | - | - |
| Graduate Degree | - | - |
| Total | $50,741 | $39,400 |
Family Income in Davis
Family Income Brackets in Davis
According to the Davis family income data, there are 40 families falling into the $75,000 to $99,999 income range, which is the most common income bracket and makes up 52.6% of all families.
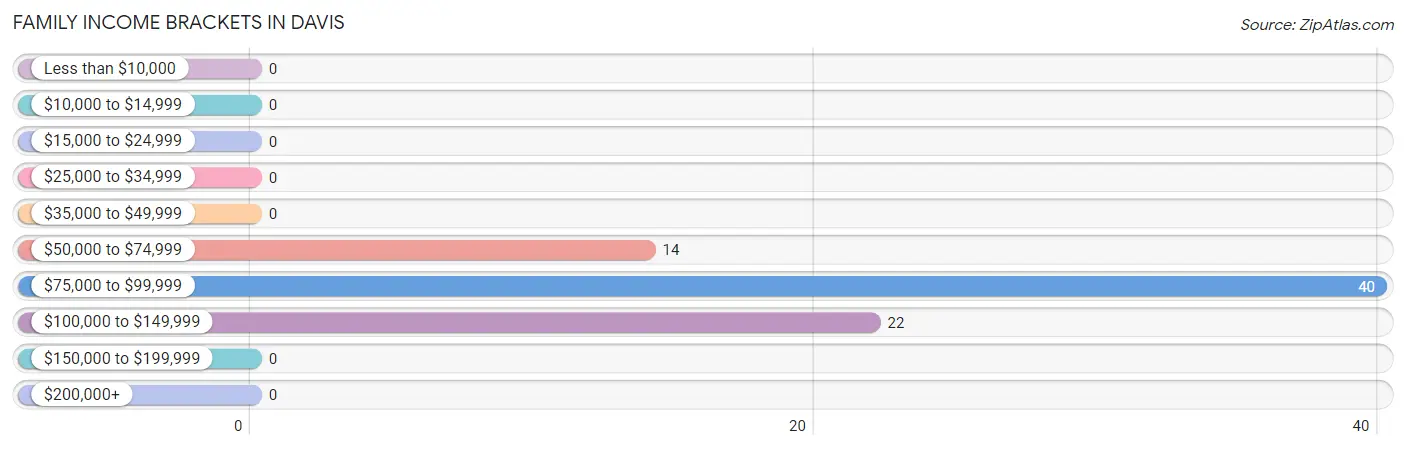
| Income Bracket | # Families | % Families |
| Less than $10,000 | 0 | 0.0% |
| $10,000 to $14,999 | 0 | 0.0% |
| $15,000 to $24,999 | 0 | 0.0% |
| $25,000 to $34,999 | 0 | 0.0% |
| $35,000 to $49,999 | 0 | 0.0% |
| $50,000 to $74,999 | 14 | 18.4% |
| $75,000 to $99,999 | 40 | 52.6% |
| $100,000 to $149,999 | 22 | 28.9% |
| $150,000 to $199,999 | 0 | 0.0% |
| $200,000+ | 0 | 0.0% |
Family Income by Famaliy Size in Davis

| Income Bracket | # Families | Median Income |
| 2-Person Families | 15 (19.7%) | $0 |
| 3-Person Families | 26 (34.2%) | $0 |
| 4-Person Families | 25 (32.9%) | $0 |
| 5-Person Families | 10 (13.2%) | $0 |
| 6-Person Families | 0 (0.0%) | $0 |
| 7+ Person Families | 0 (0.0%) | $0 |
| Total | 76 (100.0%) | $91,500 |
Family Income by Number of Earners in Davis
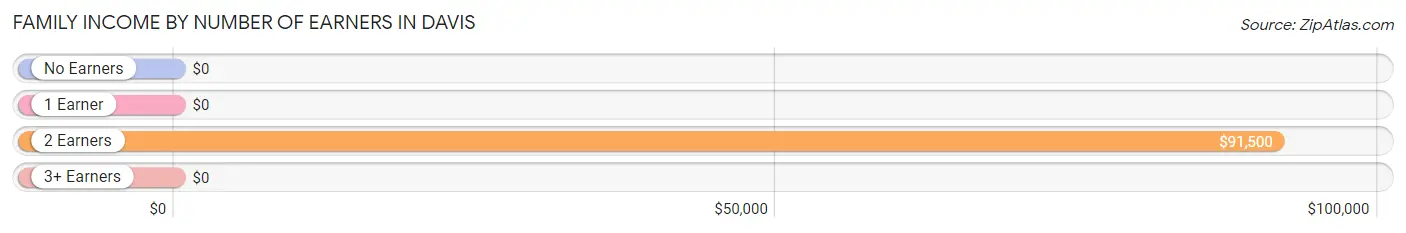
| Number of Earners | # Families | Median Income |
| No Earners | 0 (0.0%) | $0 |
| 1 Earner | 0 (0.0%) | $0 |
| 2 Earners | 76 (100.0%) | $91,500 |
| 3+ Earners | 0 (0.0%) | $0 |
| Total | 76 (100.0%) | $91,500 |
Household Income in Davis
Household Income Brackets in Davis
With 48 households falling in the category, the $75,000 to $99,999 income range is the most frequent in Davis, accounting for 49.0% of all households.
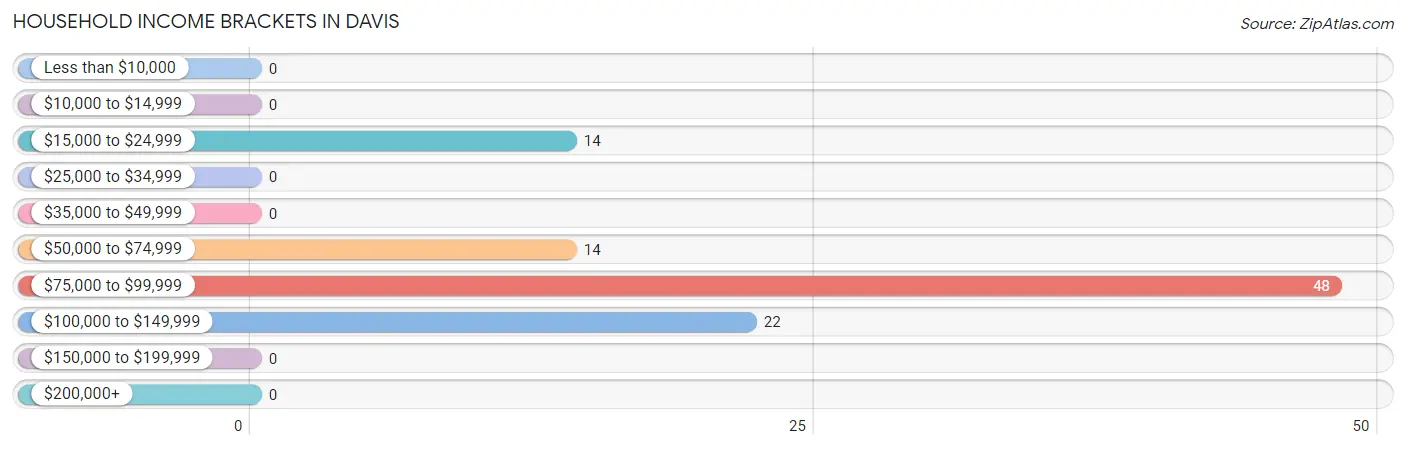
| Income Bracket | # Households | % Households |
| Less than $10,000 | 0 | 0.0% |
| $10,000 to $14,999 | 0 | 0.0% |
| $15,000 to $24,999 | 14 | 14.3% |
| $25,000 to $34,999 | 0 | 0.0% |
| $35,000 to $49,999 | 0 | 0.0% |
| $50,000 to $74,999 | 14 | 14.3% |
| $75,000 to $99,999 | 48 | 49.0% |
| $100,000 to $149,999 | 22 | 22.4% |
| $150,000 to $199,999 | 0 | 0.0% |
| $200,000+ | 0 | 0.0% |
Household Income by Householder Age in Davis
The median household income in Davis is $90,813, with the highest median household income of $90,969 found in the 25 to 44 years age bracket for the primary householder. A total of 69 households (70.4%) fall into this category.
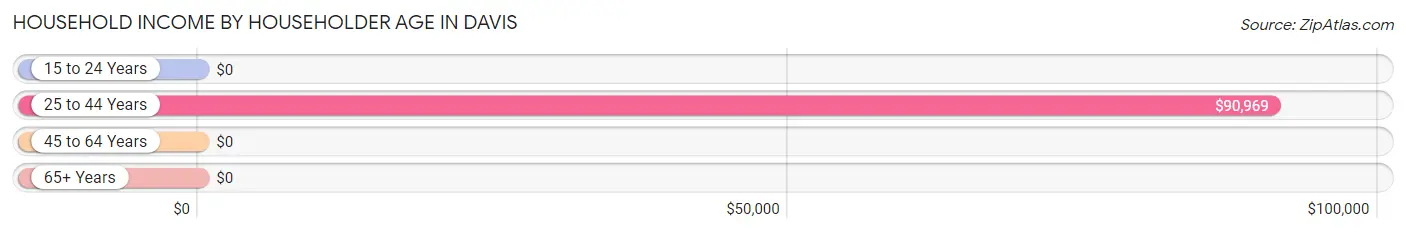
| Income Bracket | # Households | Median Income |
| 15 to 24 Years | 0 (0.0%) | $0 |
| 25 to 44 Years | 69 (70.4%) | $90,969 |
| 45 to 64 Years | 15 (15.3%) | $0 |
| 65+ Years | 14 (14.3%) | $0 |
| Total | 98 (100.0%) | $90,813 |
Poverty in Davis
Income Below Poverty by Sex and Age in Davis
| Age Bracket | Male | Female |
| Under 5 Years | 0 (0.0%) | 0 (0.0%) |
| 5 Years | 0 (0.0%) | 0 (0.0%) |
| 6 to 11 Years | 0 (0.0%) | 0 (0.0%) |
| 12 to 14 Years | 0 (0.0%) | 0 (0.0%) |
| 15 Years | 0 (0.0%) | 0 (0.0%) |
| 16 and 17 Years | 0 (0.0%) | 0 (0.0%) |
| 18 to 24 Years | 0 (0.0%) | 0 (0.0%) |
| 25 to 34 Years | 0 (0.0%) | 0 (0.0%) |
| 35 to 44 Years | 0 (0.0%) | 0 (0.0%) |
| 45 to 54 Years | 0 (0.0%) | 0 (0.0%) |
| 55 to 64 Years | 0 (0.0%) | 0 (0.0%) |
| 65 to 74 Years | 0 (0.0%) | 0 (0.0%) |
| 75 Years and over | 0 (0.0%) | 0 (0.0%) |
| Total | 0 (0.0%) | 0 (0.0%) |
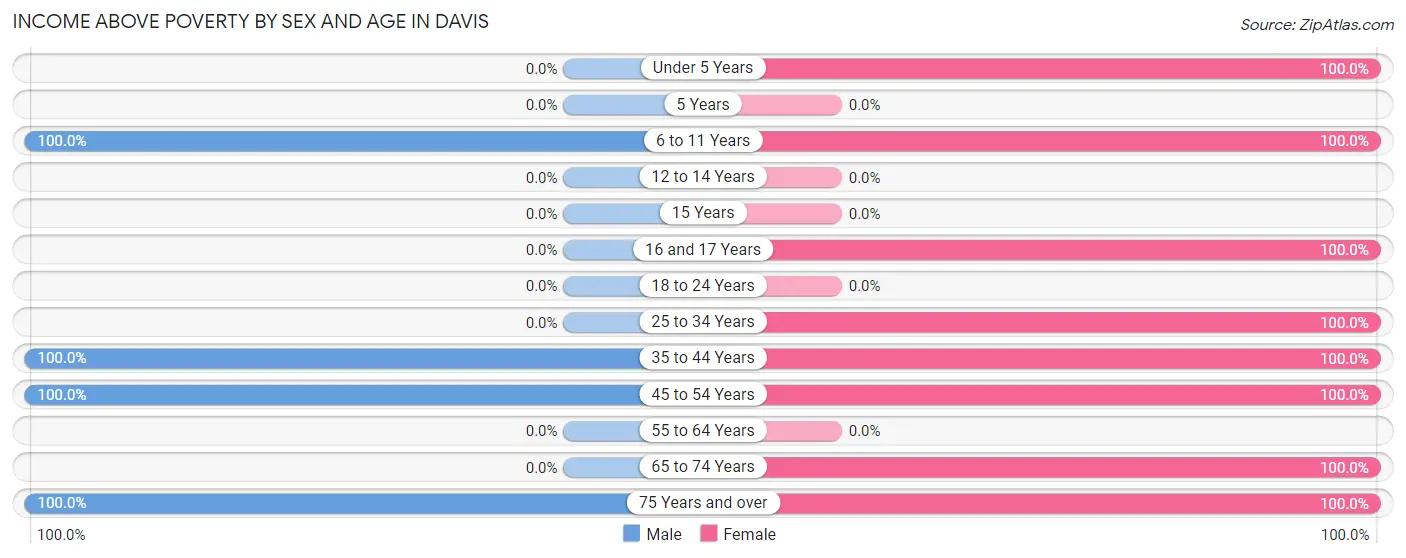
Income Above Poverty by Sex and Age in Davis
According to the poverty statistics in Davis, males aged 6 to 11 years and females aged under 5 years are the age groups that are most secure financially, with 100.0% of males and 100.0% of females in these age groups living above the poverty line.
| Age Bracket | Male | Female |
| Under 5 Years | 0 (0.0%) | 39 (100.0%) |
| 5 Years | 0 (0.0%) | 0 (0.0%) |
| 6 to 11 Years | 14 (100.0%) | 29 (100.0%) |
| 12 to 14 Years | 0 (0.0%) | 0 (0.0%) |
| 15 Years | 0 (0.0%) | 0 (0.0%) |
| 16 and 17 Years | 0 (0.0%) | 10 (100.0%) |
| 18 to 24 Years | 0 (0.0%) | 0 (0.0%) |
| 25 to 34 Years | 0 (0.0%) | 10 (100.0%) |
| 35 to 44 Years | 62 (100.0%) | 60 (100.0%) |
| 45 to 54 Years | 14 (100.0%) | 12 (100.0%) |
| 55 to 64 Years | 0 (0.0%) | 0 (0.0%) |
| 65 to 74 Years | 0 (0.0%) | 11 (100.0%) |
| 75 Years and over | 7 (100.0%) | 7 (100.0%) |
| Total | 97 (100.0%) | 178 (100.0%) |
Income Below Poverty Among Married-Couple Families in Davis
| Children | Above Poverty | Below Poverty |
| No Children | 27 (100.0%) | 0 (0.0%) |
| 1 or 2 Children | 39 (100.0%) | 0 (0.0%) |
| 3 or 4 Children | 10 (100.0%) | 0 (0.0%) |
| 5 or more Children | 0 (0.0%) | 0 (0.0%) |
| Total | 76 (100.0%) | 0 (0.0%) |
Income Below Poverty Among Single-Parent Households in Davis
| Children | Single Father | Single Mother |
| No Children | 0 (0.0%) | 0 (0.0%) |
| 1 or 2 Children | 0 (0.0%) | 0 (0.0%) |
| 3 or 4 Children | 0 (0.0%) | 0 (0.0%) |
| 5 or more Children | 0 (0.0%) | 0 (0.0%) |
| Total | 0 (0.0%) | 0 (0.0%) |
Income Below Poverty Among Married-Couple vs Single-Parent Households in Davis
| Children | Married-Couple Families | Single-Parent Households |
| No Children | 0 (0.0%) | 0 (0.0%) |
| 1 or 2 Children | 0 (0.0%) | 0 (0.0%) |
| 3 or 4 Children | 0 (0.0%) | 0 (0.0%) |
| 5 or more Children | 0 (0.0%) | 0 (0.0%) |
| Total | 0 (0.0%) | 0 (0.0%) |
Race in Davis
The most populous races in Davis are , and White / Caucasian (275 | 100.0%).
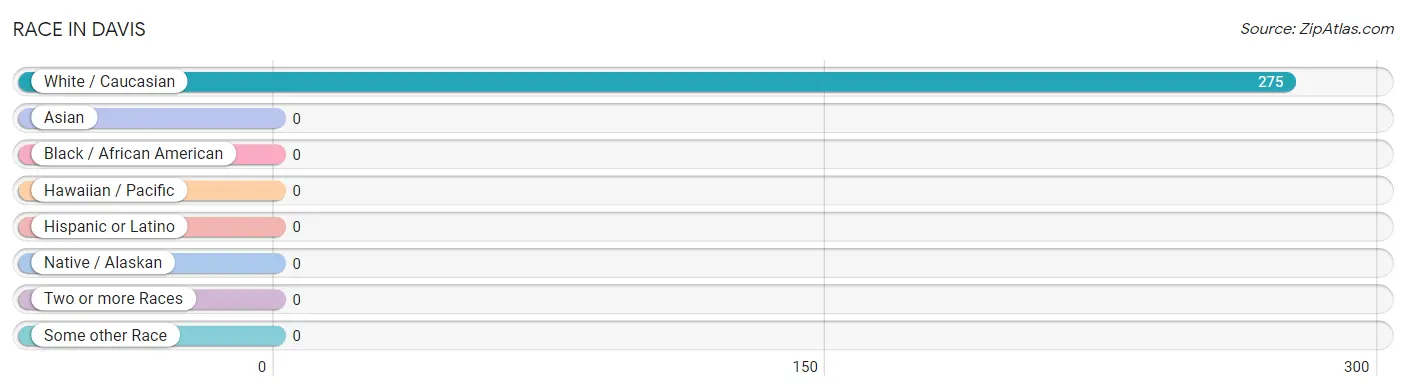
| Race | # Population | % Population |
| Asian | 0 | 0.0% |
| Black / African American | 0 | 0.0% |
| Hawaiian / Pacific | 0 | 0.0% |
| Hispanic or Latino | 0 | 0.0% |
| Native / Alaskan | 0 | 0.0% |
| White / Caucasian | 275 | 100.0% |
| Two or more Races | 0 | 0.0% |
| Some other Race | 0 | 0.0% |
| Total | 275 | 100.0% |
Ancestry in Davis
The most populous ancestries reported in Davis are English (49 | 17.8%), Irish (40 | 14.5%), German (15 | 5.4%), French (12 | 4.4%), and Portuguese (12 | 4.4%), together accounting for 46.5% of all Davis residents.
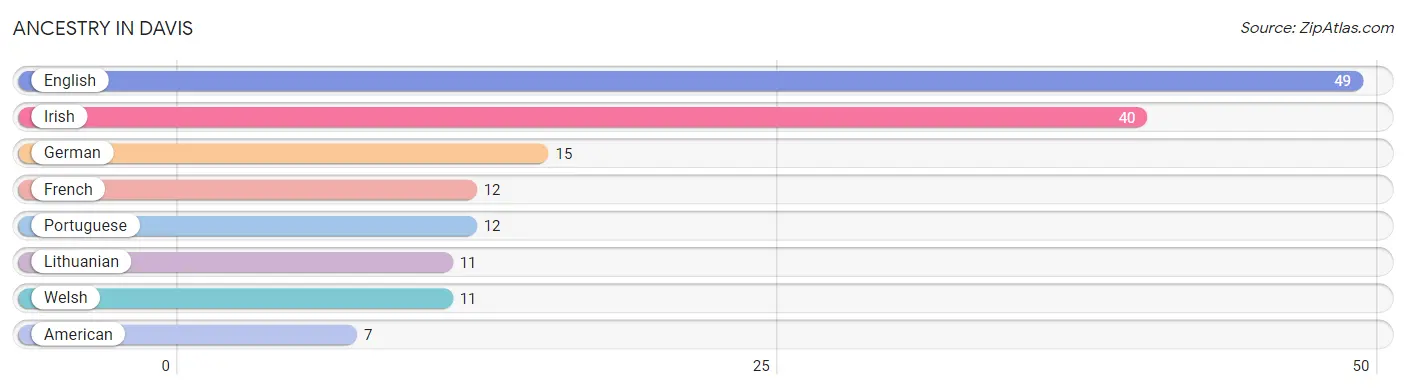
| Ancestry | # Population | % Population |
| American | 7 | 2.5% |
| English | 49 | 17.8% |
| French | 12 | 4.4% |
| German | 15 | 5.4% |
| Irish | 40 | 14.5% |
| Lithuanian | 11 | 4.0% |
| Portuguese | 12 | 4.4% |
| Welsh | 11 | 4.0% | View All 8 Rows |
Immigrants in Davis

| Immigration Origin | # Population | % Population | View All 0 Rows |
Sex and Age in Davis
Sex and Age in Davis
The most populous age groups in Davis are 40 to 44 Years (38 | 39.2%) for men and 35 to 39 Years (42 | 23.6%) for women.
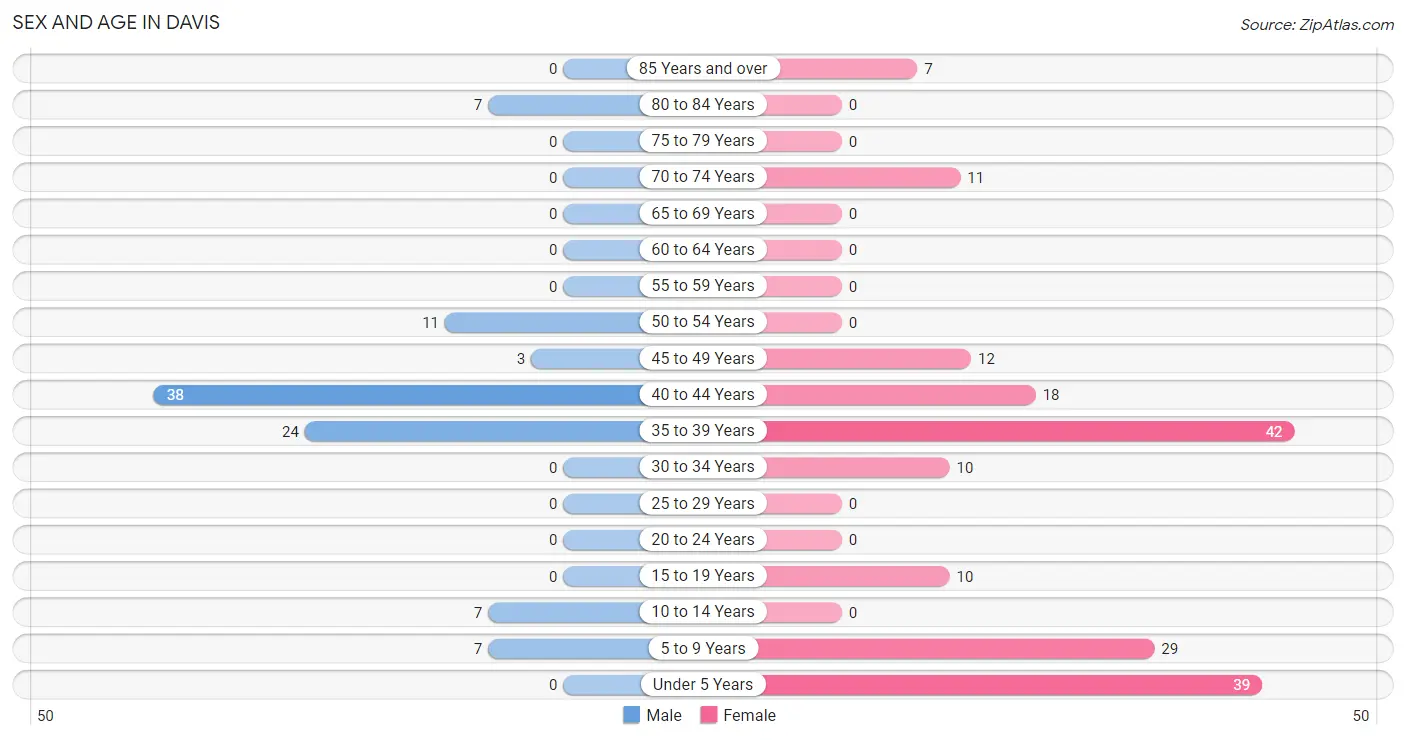
| Age Bracket | Male | Female |
| Under 5 Years | 0 (0.0%) | 39 (21.9%) |
| 5 to 9 Years | 7 (7.2%) | 29 (16.3%) |
| 10 to 14 Years | 7 (7.2%) | 0 (0.0%) |
| 15 to 19 Years | 0 (0.0%) | 10 (5.6%) |
| 20 to 24 Years | 0 (0.0%) | 0 (0.0%) |
| 25 to 29 Years | 0 (0.0%) | 0 (0.0%) |
| 30 to 34 Years | 0 (0.0%) | 10 (5.6%) |
| 35 to 39 Years | 24 (24.7%) | 42 (23.6%) |
| 40 to 44 Years | 38 (39.2%) | 18 (10.1%) |
| 45 to 49 Years | 3 (3.1%) | 12 (6.7%) |
| 50 to 54 Years | 11 (11.3%) | 0 (0.0%) |
| 55 to 59 Years | 0 (0.0%) | 0 (0.0%) |
| 60 to 64 Years | 0 (0.0%) | 0 (0.0%) |
| 65 to 69 Years | 0 (0.0%) | 0 (0.0%) |
| 70 to 74 Years | 0 (0.0%) | 11 (6.2%) |
| 75 to 79 Years | 0 (0.0%) | 0 (0.0%) |
| 80 to 84 Years | 7 (7.2%) | 0 (0.0%) |
| 85 Years and over | 0 (0.0%) | 7 (3.9%) |
| Total | 97 (100.0%) | 178 (100.0%) |
Families and Households in Davis
Median Family Size in Davis
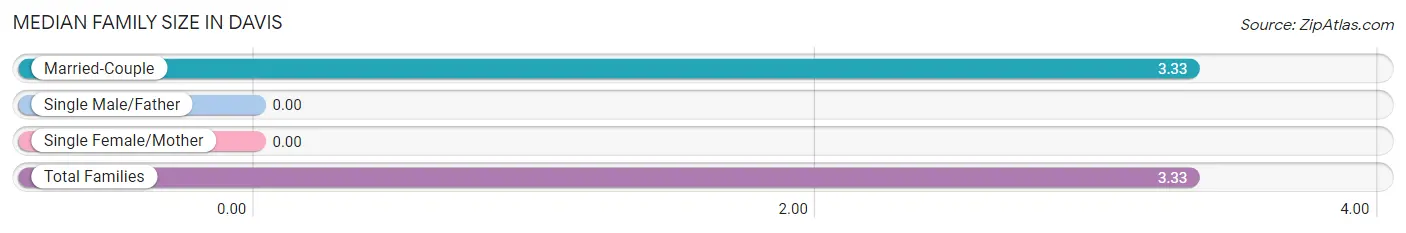
| Family Type | # Families | Family Size |
| Married-Couple | 76 (100.0%) | 3.33 |
| Single Male/Father | 0 (0.0%) | - |
| Single Female/Mother | 0 (0.0%) | - |
| Total Families | 76 (100.0%) | 3.33 |
Median Household Size in Davis
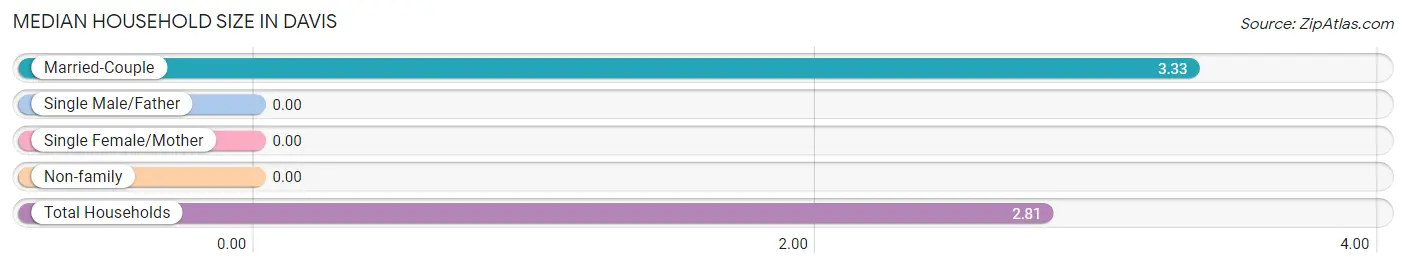
| Household Type | # Households | Household Size |
| Married-Couple | 76 (77.5%) | 3.33 |
| Single Male/Father | 0 (0.0%) | - |
| Single Female/Mother | 0 (0.0%) | - |
| Non-family | 22 (22.5%) | - |
| Total Households | 98 (100.0%) | 2.81 |
Household Size by Marriage Status in Davis
Out of a total of 98 households in Davis, 76 (77.5%) are family households, while 22 (22.5%) are nonfamily households. The most numerous type of family households are 3-person households, comprising 26, and the most common type of nonfamily households are 1-person households, comprising 22.
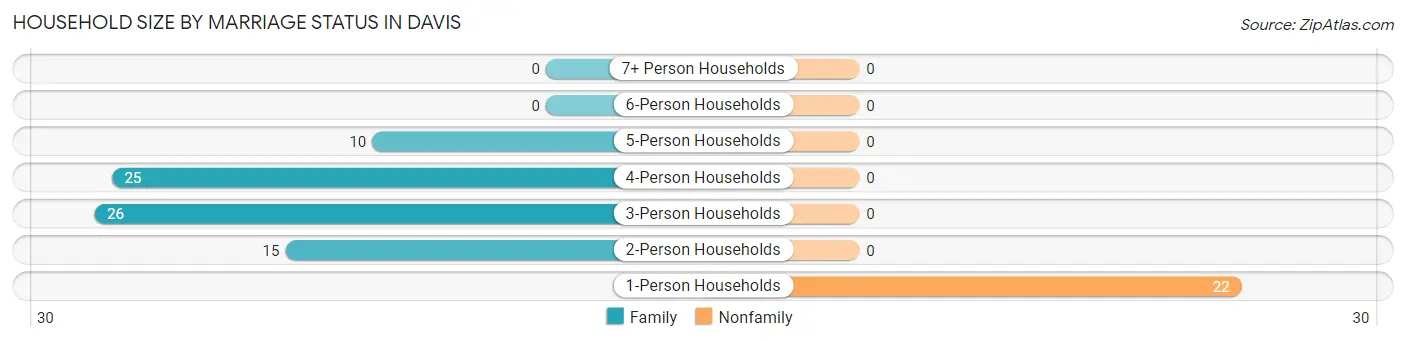
| Household Size | Family Households | Nonfamily Households |
| 1-Person Households | - | 22 (22.5%) |
| 2-Person Households | 15 (15.3%) | 0 (0.0%) |
| 3-Person Households | 26 (26.5%) | 0 (0.0%) |
| 4-Person Households | 25 (25.5%) | 0 (0.0%) |
| 5-Person Households | 10 (10.2%) | 0 (0.0%) |
| 6-Person Households | 0 (0.0%) | 0 (0.0%) |
| 7+ Person Households | 0 (0.0%) | 0 (0.0%) |
| Total | 76 (77.5%) | 22 (22.5%) |
Female Fertility in Davis
Fertility by Age in Davis
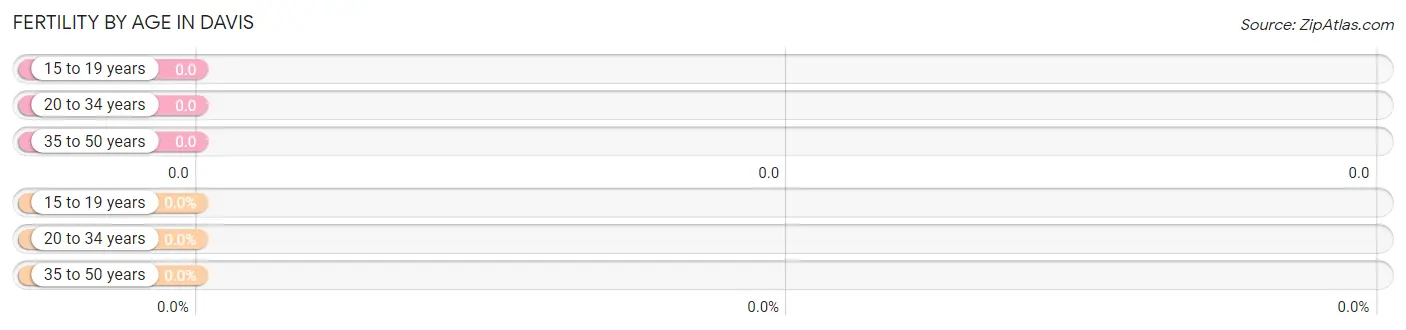
| Age Bracket | Women with Births | Births / 1,000 Women |
| 15 to 19 years | 0 (0.0%) | 0.0 |
| 20 to 34 years | 0 (0.0%) | 0.0 |
| 35 to 50 years | 0 (0.0%) | 0.0 |
| Total | 0 (0.0%) | 0.0 |
Fertility by Age by Marriage Status in Davis
| Age Bracket | Married | Unmarried |
| 15 to 19 years | 0 (0.0%) | 0 (0.0%) |
| 20 to 34 years | 0 (0.0%) | 0 (0.0%) |
| 35 to 50 years | 0 (0.0%) | 0 (0.0%) |
| Total | 0 (0.0%) | 0 (0.0%) |
Fertility by Education in Davis
| Educational Attainment | Women with Births | Births / 1,000 Women |
| Less than High School | 0 (0.0%) | 0.0 |
| High School Diploma | 0 (0.0%) | 0.0 |
| College or Associate's Degree | 0 (0.0%) | 0.0 |
| Bachelor's Degree | 0 (0.0%) | 0.0 |
| Graduate Degree | 0 (0.0%) | 0.0 |
| Total | 0 (0.0%) | 0.0 |
Fertility by Education by Marriage Status in Davis
| Educational Attainment | Married | Unmarried |
| Less than High School | 0 (0.0%) | 0 (0.0%) |
| High School Diploma | 0 (0.0%) | 0 (0.0%) |
| College or Associate's Degree | 0 (0.0%) | 0 (0.0%) |
| Bachelor's Degree | 0 (0.0%) | 0 (0.0%) |
| Graduate Degree | 0 (0.0%) | 0 (0.0%) |
| Total | 0 (0.0%) | 0 (0.0%) |
Employment Characteristics in Davis
Employment by Class of Employer in Davis
Among the 148 employed individuals in Davis, private company employees (49 | 33.1%), self-employed (not incorporated) (38 | 25.7%), and not-for-profit organizations (28 | 18.9%) make up the most common classes of employment.
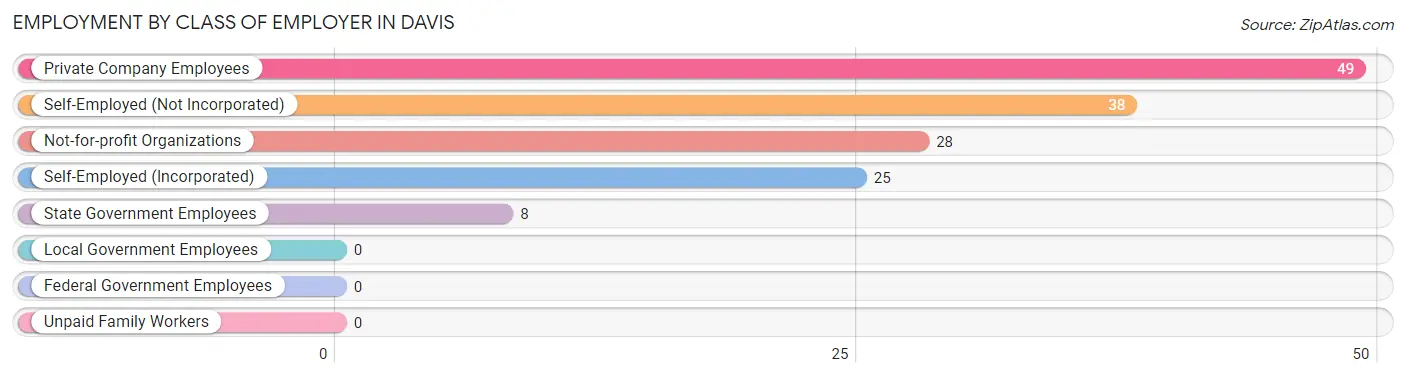
| Employer Class | # Employees | % Employees |
| Private Company Employees | 49 | 33.1% |
| Self-Employed (Incorporated) | 25 | 16.9% |
| Self-Employed (Not Incorporated) | 38 | 25.7% |
| Not-for-profit Organizations | 28 | 18.9% |
| Local Government Employees | 0 | 0.0% |
| State Government Employees | 8 | 5.4% |
| Federal Government Employees | 0 | 0.0% |
| Unpaid Family Workers | 0 | 0.0% |
| Total | 148 | 100.0% |
Employment Status by Age in Davis
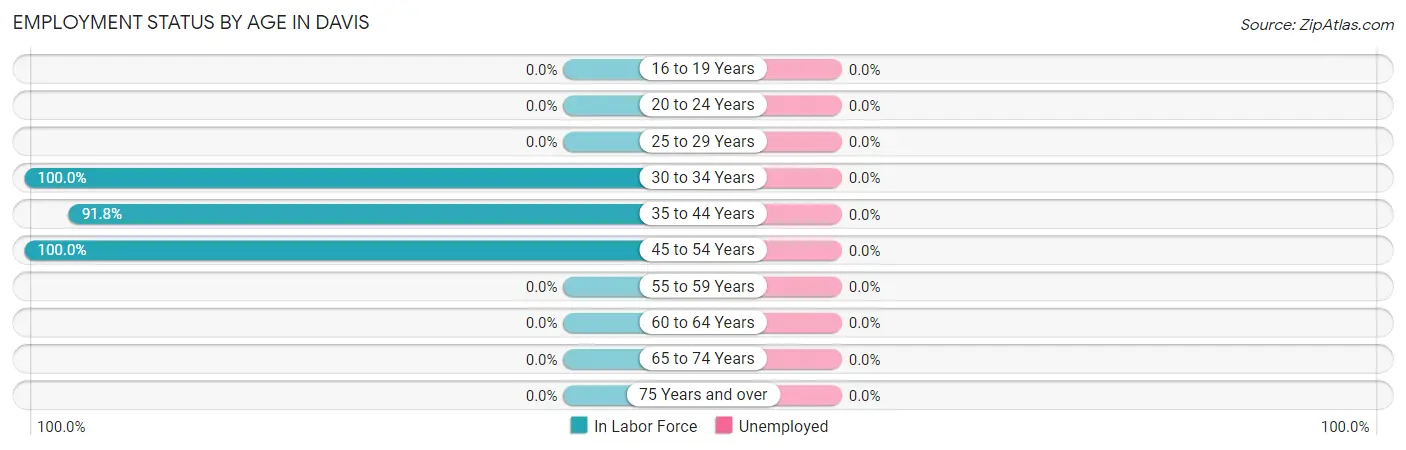
| Age Bracket | In Labor Force | Unemployed |
| 16 to 19 Years | 0 (0.0%) | 0 (0.0%) |
| 20 to 24 Years | 0 (0.0%) | 0 (0.0%) |
| 25 to 29 Years | 0 (0.0%) | 0 (0.0%) |
| 30 to 34 Years | 10 (100.0%) | 0 (0.0%) |
| 35 to 44 Years | 112 (91.8%) | 0 (0.0%) |
| 45 to 54 Years | 26 (100.0%) | 0 (0.0%) |
| 55 to 59 Years | 0 (0.0%) | 0 (0.0%) |
| 60 to 64 Years | 0 (0.0%) | 0 (0.0%) |
| 65 to 74 Years | 0 (0.0%) | 0 (0.0%) |
| 75 Years and over | 0 (0.0%) | 0 (0.0%) |
| Total | 148 (76.7%) | 0 (0.0%) |
Employment Status by Educational Attainment in Davis
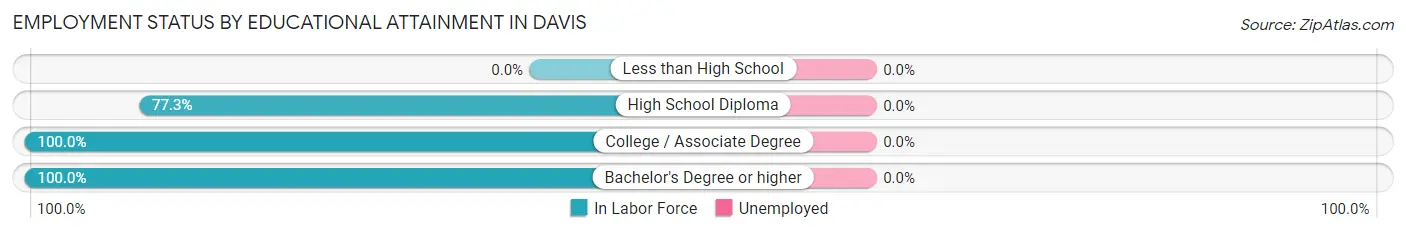
| Educational Attainment | In Labor Force | Unemployed |
| Less than High School | 0 (0.0%) | 0 (0.0%) |
| High School Diploma | 34 (77.3%) | 0 (0.0%) |
| College / Associate Degree | 58 (100.0%) | 0 (0.0%) |
| Bachelor's Degree or higher | 56 (100.0%) | 0 (0.0%) |
| Total | 148 (93.7%) | 0 (0.0%) |
Employment Occupations by Sex in Davis
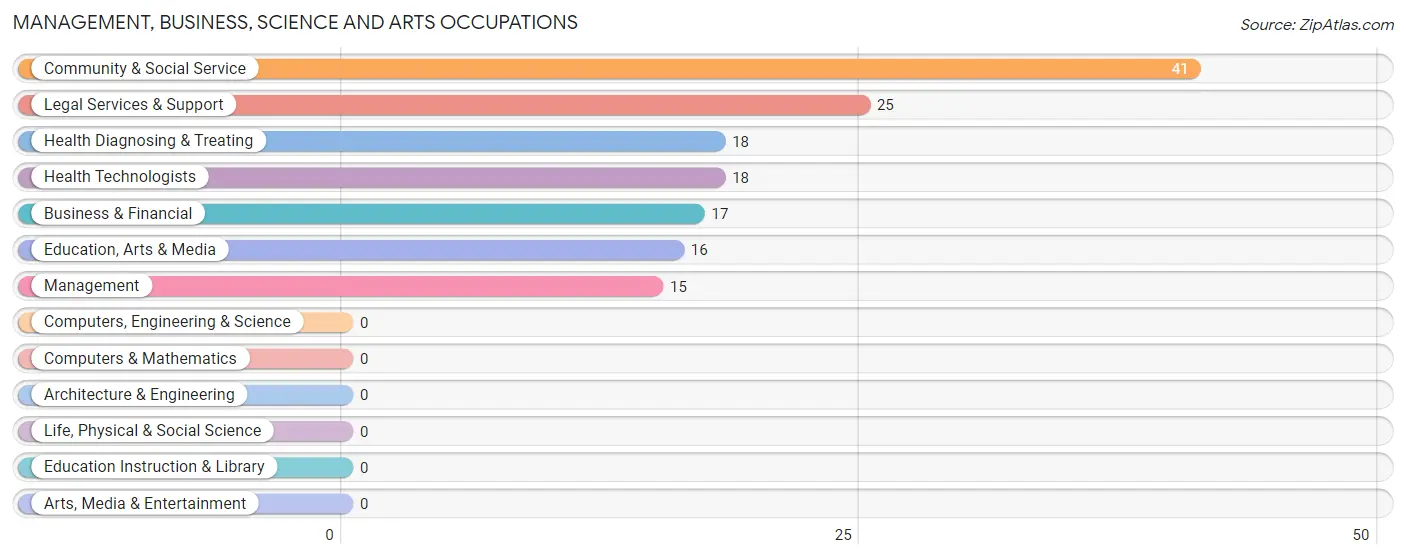
Management, Business, Science and Arts Occupations
The most common Management, Business, Science and Arts occupations in Davis are Community & Social Service (41 | 27.7%), Legal Services & Support (25 | 16.9%), Health Diagnosing & Treating (18 | 12.2%), Health Technologists (18 | 12.2%), and Business & Financial (17 | 11.5%).
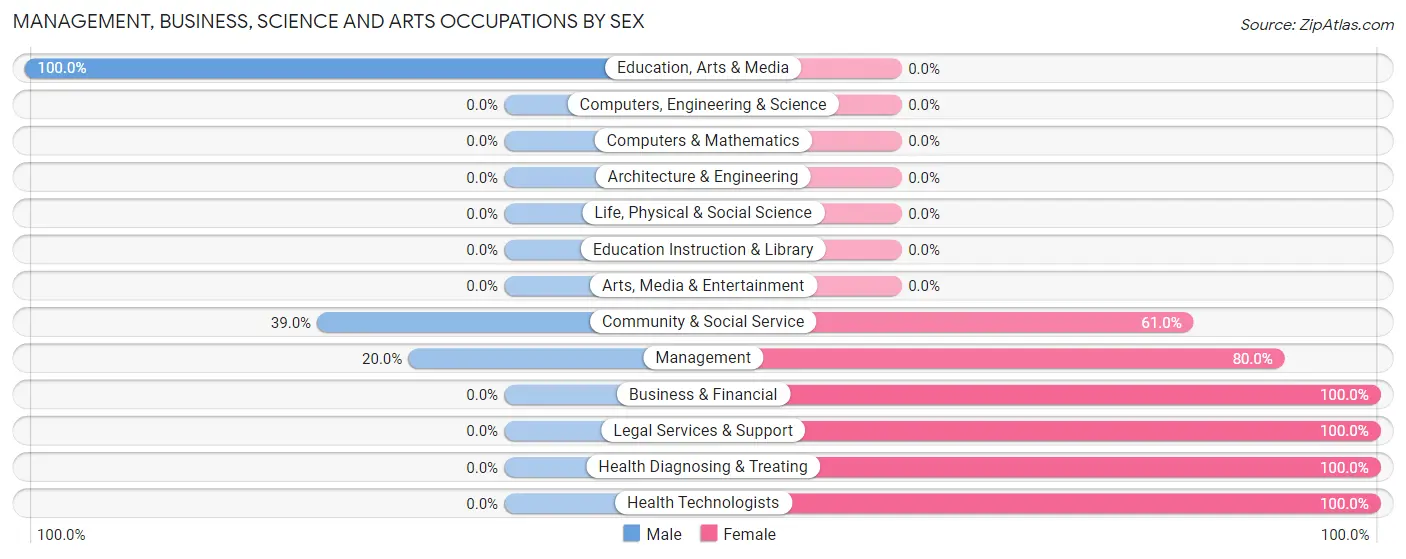
Management, Business, Science and Arts Occupations by Sex
Within the Management, Business, Science and Arts occupations in Davis, the most male-oriented occupations are Education, Arts & Media (100.0%), Community & Social Service (39.0%), and Management (20.0%), while the most female-oriented occupations are Business & Financial (100.0%), Legal Services & Support (100.0%), and Health Diagnosing & Treating (100.0%).
| Occupation | Male | Female |
| Management | 3 (20.0%) | 12 (80.0%) |
| Business & Financial | 0 (0.0%) | 17 (100.0%) |
| Computers, Engineering & Science | 0 (0.0%) | 0 (0.0%) |
| Computers & Mathematics | 0 (0.0%) | 0 (0.0%) |
| Architecture & Engineering | 0 (0.0%) | 0 (0.0%) |
| Life, Physical & Social Science | 0 (0.0%) | 0 (0.0%) |
| Community & Social Service | 16 (39.0%) | 25 (61.0%) |
| Education, Arts & Media | 16 (100.0%) | 0 (0.0%) |
| Legal Services & Support | 0 (0.0%) | 25 (100.0%) |
| Education Instruction & Library | 0 (0.0%) | 0 (0.0%) |
| Arts, Media & Entertainment | 0 (0.0%) | 0 (0.0%) |
| Health Diagnosing & Treating | 0 (0.0%) | 18 (100.0%) |
| Health Technologists | 0 (0.0%) | 18 (100.0%) |
| Total (Category) | 19 (20.9%) | 72 (79.1%) |
| Total (Overall) | 76 (51.3%) | 72 (48.6%) |
Services Occupations
Services Occupations by Sex
| Occupation | Male | Female |
| Healthcare Support | 0 (0.0%) | 0 (0.0%) |
| Security & Protection | 0 (0.0%) | 0 (0.0%) |
| Firefighting & Prevention | 0 (0.0%) | 0 (0.0%) |
| Law Enforcement | 0 (0.0%) | 0 (0.0%) |
| Food Preparation & Serving | 0 (0.0%) | 0 (0.0%) |
| Cleaning & Maintenance | 0 (0.0%) | 0 (0.0%) |
| Personal Care & Service | 0 (0.0%) | 0 (0.0%) |
| Total (Category) | 0 (0.0%) | 0 (0.0%) |
| Total (Overall) | 76 (51.3%) | 72 (48.6%) |
Sales and Office Occupations
Sales and Office Occupations by Sex
| Occupation | Male | Female |
| Sales & Related | 0 (0.0%) | 0 (0.0%) |
| Office & Administration | 0 (0.0%) | 0 (0.0%) |
| Total (Category) | 0 (0.0%) | 0 (0.0%) |
| Total (Overall) | 76 (51.3%) | 72 (48.6%) |
Natural Resources, Construction and Maintenance Occupations
The most common Natural Resources, Construction and Maintenance occupations in Davis are Installation, Maintenance & Repair (38 | 25.7%), and Construction & Extraction (11 | 7.4%).
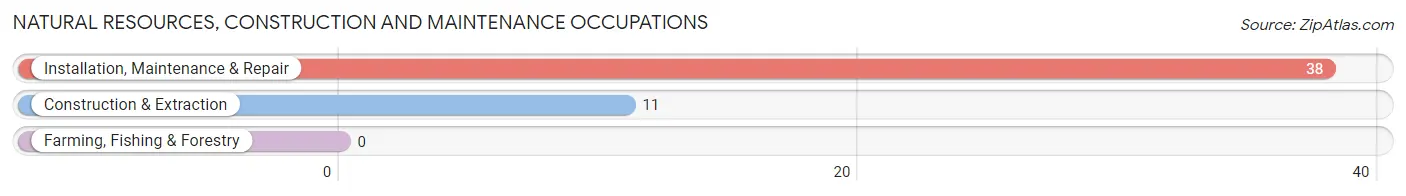
Natural Resources, Construction and Maintenance Occupations by Sex
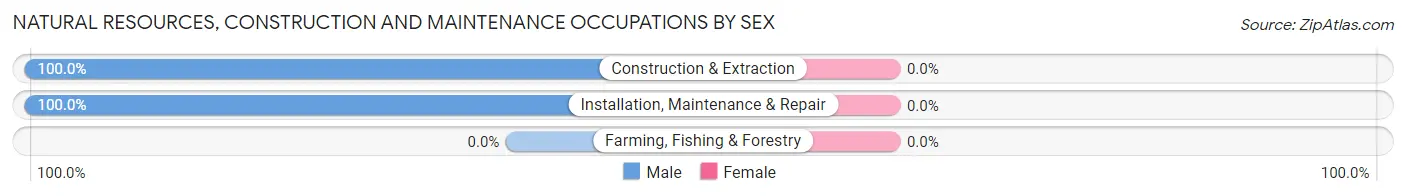
| Occupation | Male | Female |
| Farming, Fishing & Forestry | 0 (0.0%) | 0 (0.0%) |
| Construction & Extraction | 11 (100.0%) | 0 (0.0%) |
| Installation, Maintenance & Repair | 38 (100.0%) | 0 (0.0%) |
| Total (Category) | 49 (100.0%) | 0 (0.0%) |
| Total (Overall) | 76 (51.3%) | 72 (48.6%) |
Production, Transportation and Moving Occupations
The most common Production, Transportation and Moving occupations in Davis are , and Transportation (8 | 5.4%).
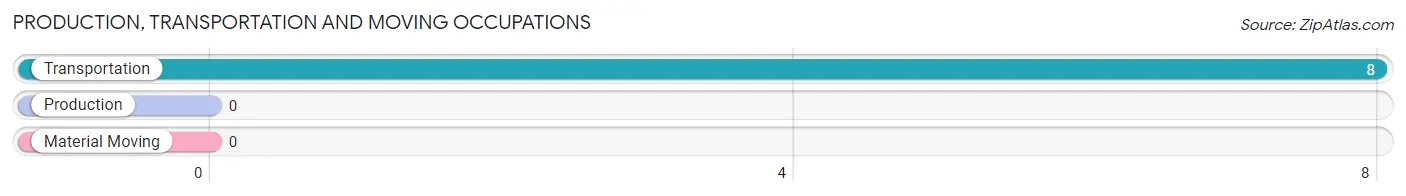
Production, Transportation and Moving Occupations by Sex
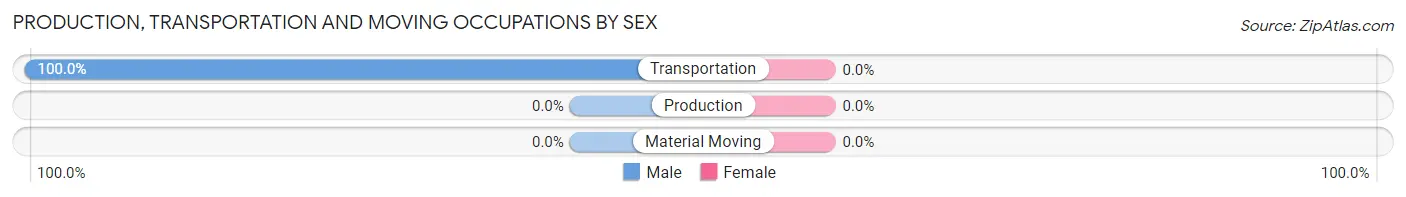
| Occupation | Male | Female |
| Production | 0 (0.0%) | 0 (0.0%) |
| Transportation | 8 (100.0%) | 0 (0.0%) |
| Material Moving | 0 (0.0%) | 0 (0.0%) |
| Total (Category) | 8 (100.0%) | 0 (0.0%) |
| Total (Overall) | 76 (51.3%) | 72 (48.6%) |
Employment Industries by Sex in Davis
Employment Industries in Davis
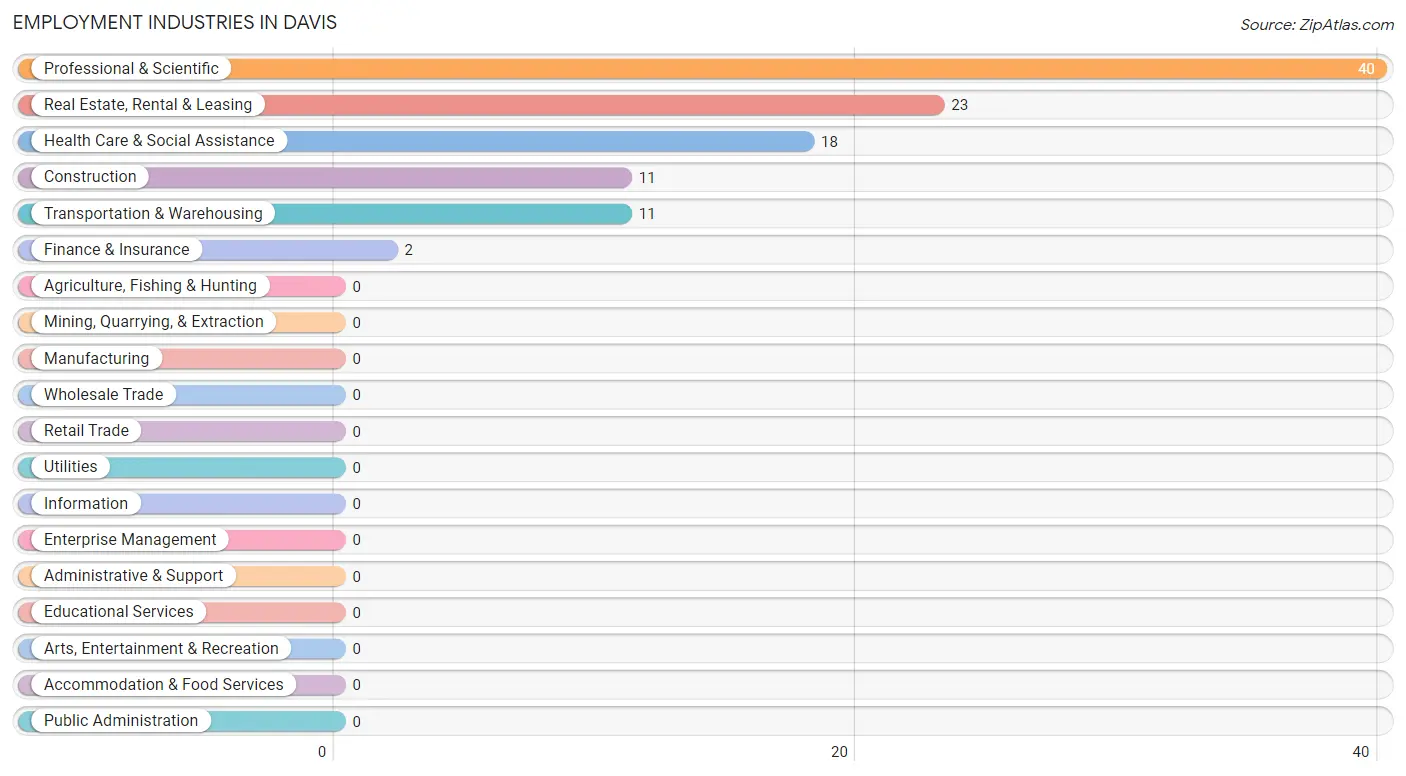
The major employment industries in Davis include Professional & Scientific (40 | 27.0%), Real Estate, Rental & Leasing (23 | 15.5%), Health Care & Social Assistance (18 | 12.2%), Construction (11 | 7.4%), and Transportation & Warehousing (11 | 7.4%).
Employment Industries by Sex in Davis
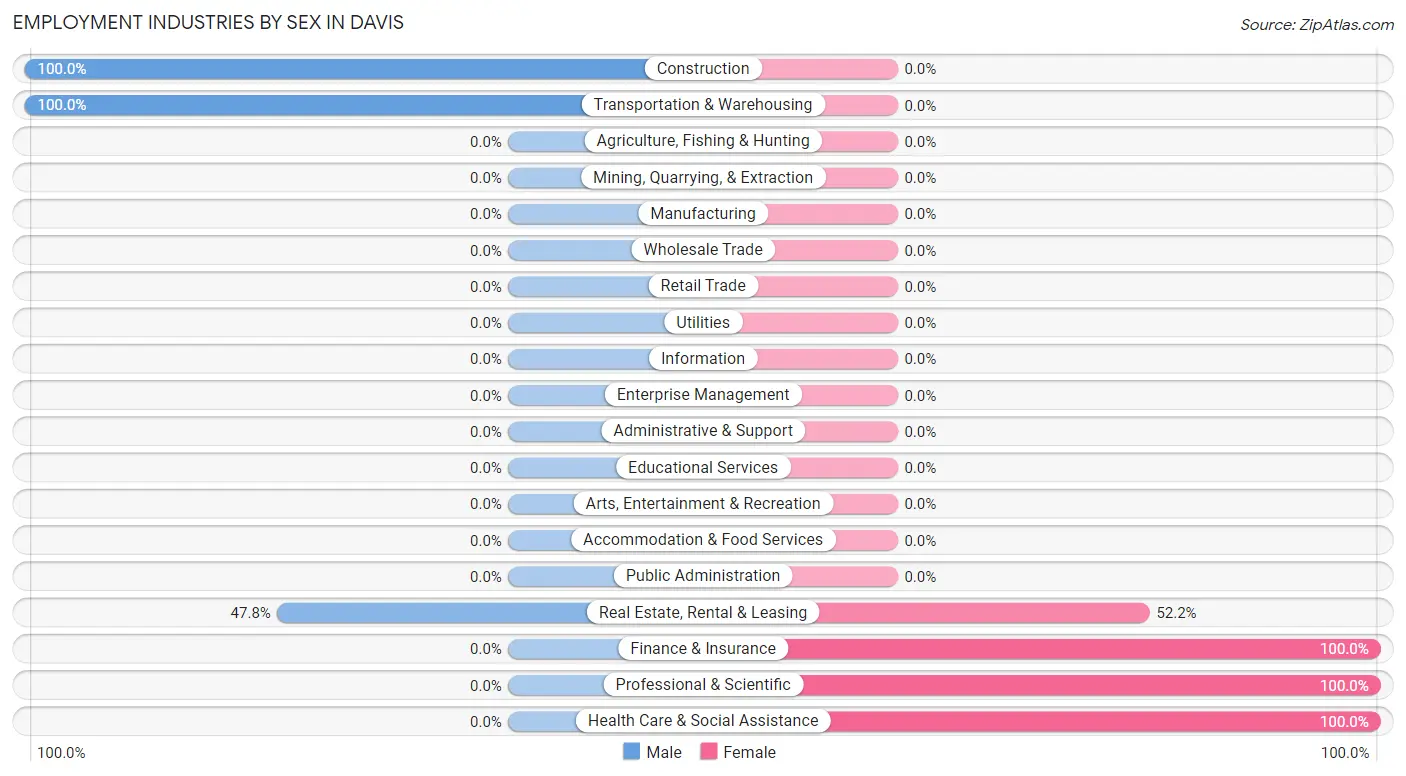
The Davis industries that see more men than women are Construction (100.0%), Transportation & Warehousing (100.0%), and Real Estate, Rental & Leasing (47.8%), whereas the industries that tend to have a higher number of women are Finance & Insurance (100.0%), Professional & Scientific (100.0%), and Health Care & Social Assistance (100.0%).
| Industry | Male | Female |
| Agriculture, Fishing & Hunting | 0 (0.0%) | 0 (0.0%) |
| Mining, Quarrying, & Extraction | 0 (0.0%) | 0 (0.0%) |
| Construction | 11 (100.0%) | 0 (0.0%) |
| Manufacturing | 0 (0.0%) | 0 (0.0%) |
| Wholesale Trade | 0 (0.0%) | 0 (0.0%) |
| Retail Trade | 0 (0.0%) | 0 (0.0%) |
| Transportation & Warehousing | 11 (100.0%) | 0 (0.0%) |
| Utilities | 0 (0.0%) | 0 (0.0%) |
| Information | 0 (0.0%) | 0 (0.0%) |
| Finance & Insurance | 0 (0.0%) | 2 (100.0%) |
| Real Estate, Rental & Leasing | 11 (47.8%) | 12 (52.2%) |
| Professional & Scientific | 0 (0.0%) | 40 (100.0%) |
| Enterprise Management | 0 (0.0%) | 0 (0.0%) |
| Administrative & Support | 0 (0.0%) | 0 (0.0%) |
| Educational Services | 0 (0.0%) | 0 (0.0%) |
| Health Care & Social Assistance | 0 (0.0%) | 18 (100.0%) |
| Arts, Entertainment & Recreation | 0 (0.0%) | 0 (0.0%) |
| Accommodation & Food Services | 0 (0.0%) | 0 (0.0%) |
| Public Administration | 0 (0.0%) | 0 (0.0%) |
| Total | 76 (51.3%) | 72 (48.6%) |
Education in Davis
School Enrollment in Davis
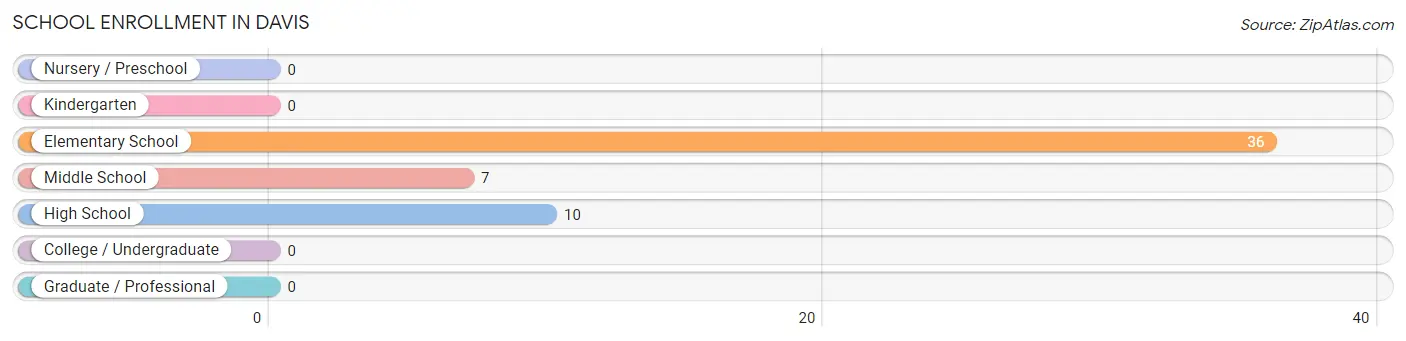
The most common levels of schooling among the 53 students in Davis are elementary school (36 | 67.9%), high school (10 | 18.9%), and middle school (7 | 13.2%).
| School Level | # Students | % Students |
| Nursery / Preschool | 0 | 0.0% |
| Kindergarten | 0 | 0.0% |
| Elementary School | 36 | 67.9% |
| Middle School | 7 | 13.2% |
| High School | 10 | 18.9% |
| College / Undergraduate | 0 | 0.0% |
| Graduate / Professional | 0 | 0.0% |
| Total | 53 | 100.0% |
School Enrollment by Age by Funding Source in Davis
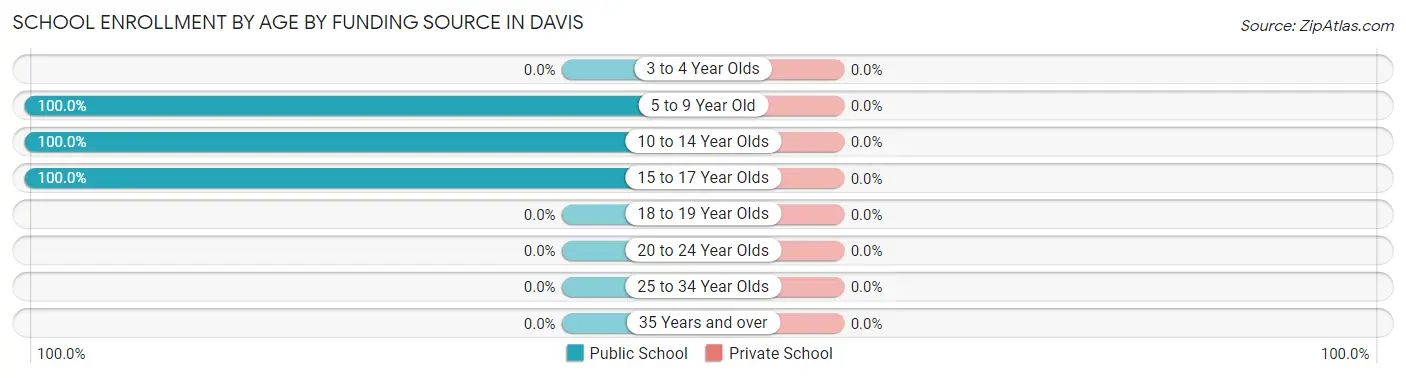
| Age Bracket | Public School | Private School |
| 3 to 4 Year Olds | 0 (0.0%) | 0 (0.0%) |
| 5 to 9 Year Old | 36 (100.0%) | 0 (0.0%) |
| 10 to 14 Year Olds | 7 (100.0%) | 0 (0.0%) |
| 15 to 17 Year Olds | 10 (100.0%) | 0 (0.0%) |
| 18 to 19 Year Olds | 0 (0.0%) | 0 (0.0%) |
| 20 to 24 Year Olds | 0 (0.0%) | 0 (0.0%) |
| 25 to 34 Year Olds | 0 (0.0%) | 0 (0.0%) |
| 35 Years and over | 0 (0.0%) | 0 (0.0%) |
| Total | 53 (100.0%) | 0 (0.0%) |
Educational Attainment by Field of Study in Davis
Education (25 | 35.2%), liberal arts & history (16 | 22.5%), bio, nature & agricultural (15 | 21.1%), and physical & health sciences (15 | 21.1%) are the most common fields of study among 71 individuals in Davis who have obtained a bachelor's degree or higher.
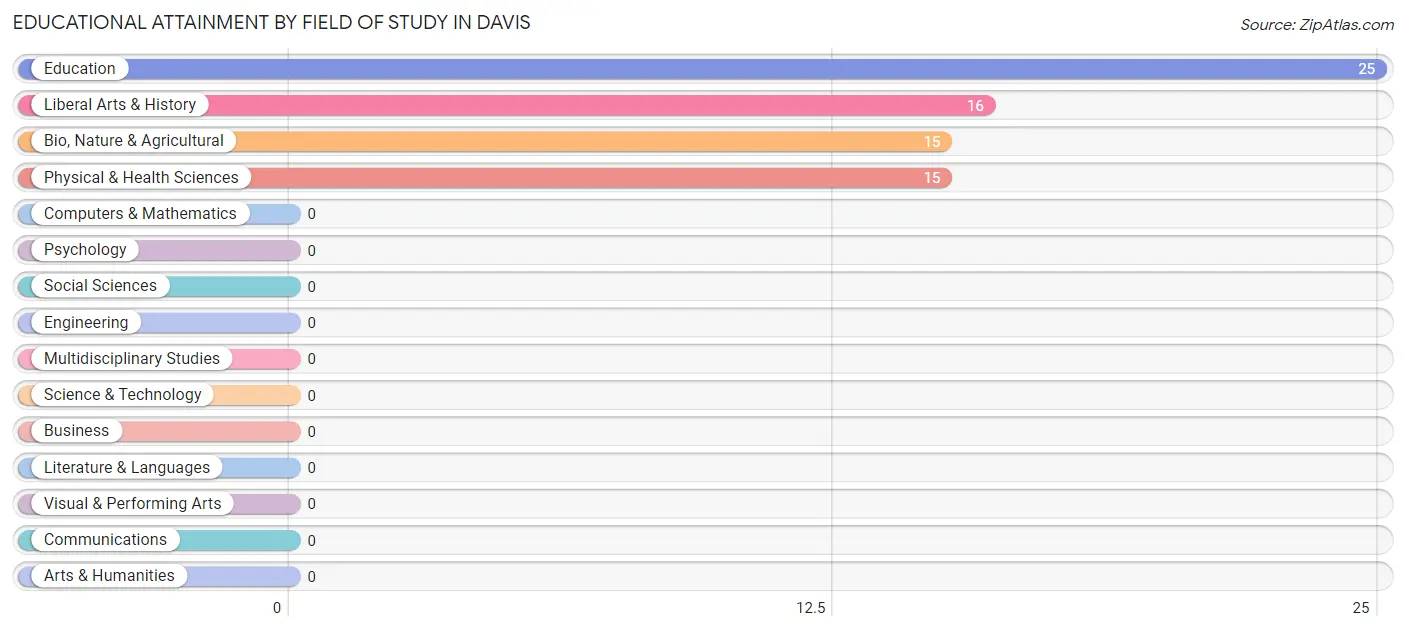
| Field of Study | # Graduates | % Graduates |
| Computers & Mathematics | 0 | 0.0% |
| Bio, Nature & Agricultural | 15 | 21.1% |
| Physical & Health Sciences | 15 | 21.1% |
| Psychology | 0 | 0.0% |
| Social Sciences | 0 | 0.0% |
| Engineering | 0 | 0.0% |
| Multidisciplinary Studies | 0 | 0.0% |
| Science & Technology | 0 | 0.0% |
| Business | 0 | 0.0% |
| Education | 25 | 35.2% |
| Literature & Languages | 0 | 0.0% |
| Liberal Arts & History | 16 | 22.5% |
| Visual & Performing Arts | 0 | 0.0% |
| Communications | 0 | 0.0% |
| Arts & Humanities | 0 | 0.0% |
| Total | 71 | 100.0% |
Transportation & Commute in Davis
Vehicle Availability by Sex in Davis
The most prevalent vehicle ownership categories in Davis are males with 3 vehicles (46, accounting for 60.5%) and females with 3 vehicles (35, making up 63.9%).
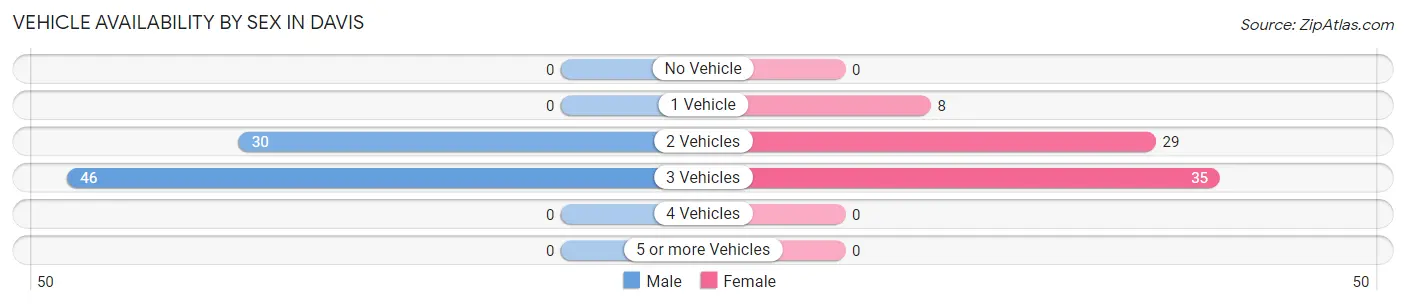
| Vehicles Available | Male | Female |
| No Vehicle | 0 (0.0%) | 0 (0.0%) |
| 1 Vehicle | 0 (0.0%) | 8 (11.1%) |
| 2 Vehicles | 30 (39.5%) | 29 (40.3%) |
| 3 Vehicles | 46 (60.5%) | 35 (48.6%) |
| 4 Vehicles | 0 (0.0%) | 0 (0.0%) |
| 5 or more Vehicles | 0 (0.0%) | 0 (0.0%) |
| Total | 76 (100.0%) | 72 (100.0%) |
Commute Time in Davis
The most frequently occuring commute durations in Davis are 20 to 24 minutes (39 commuters, 36.8%), 40 to 44 minutes (23 commuters, 21.7%), and 5 to 9 minutes (16 commuters, 15.1%).
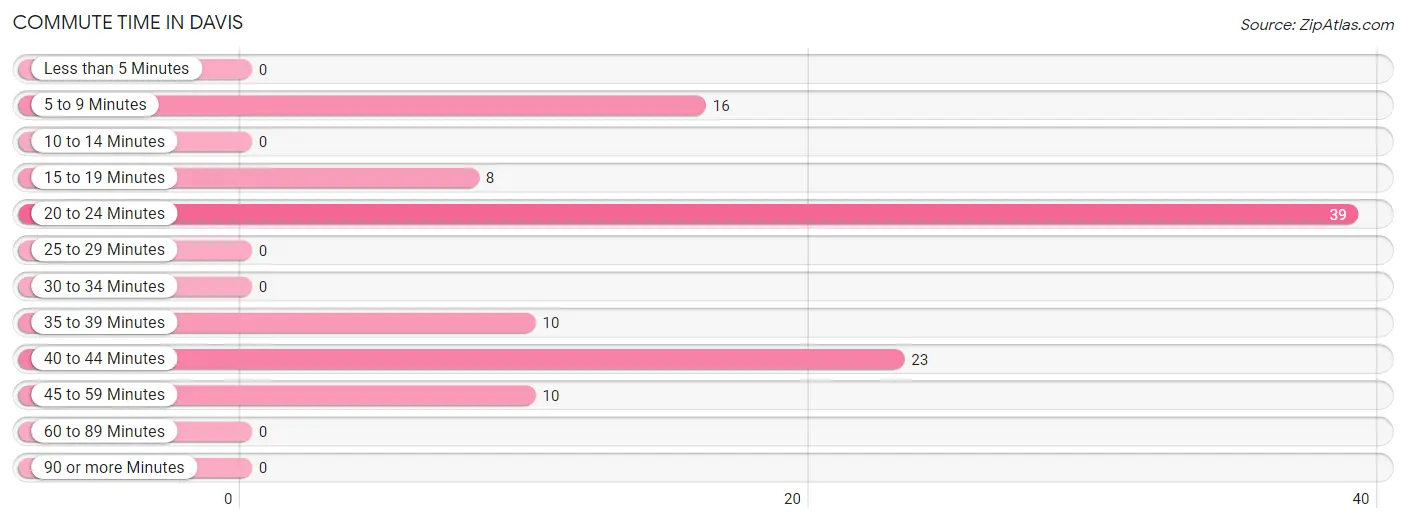
| Commute Time | # Commuters | % Commuters |
| Less than 5 Minutes | 0 | 0.0% |
| 5 to 9 Minutes | 16 | 15.1% |
| 10 to 14 Minutes | 0 | 0.0% |
| 15 to 19 Minutes | 8 | 7.5% |
| 20 to 24 Minutes | 39 | 36.8% |
| 25 to 29 Minutes | 0 | 0.0% |
| 30 to 34 Minutes | 0 | 0.0% |
| 35 to 39 Minutes | 10 | 9.4% |
| 40 to 44 Minutes | 23 | 21.7% |
| 45 to 59 Minutes | 10 | 9.4% |
| 60 to 89 Minutes | 0 | 0.0% |
| 90 or more Minutes | 0 | 0.0% |
Commute Time by Sex in Davis
The most common commute times in Davis are 5 to 9 minutes (16 commuters, 32.7%) for males and 20 to 24 minutes (25 commuters, 43.9%) for females.
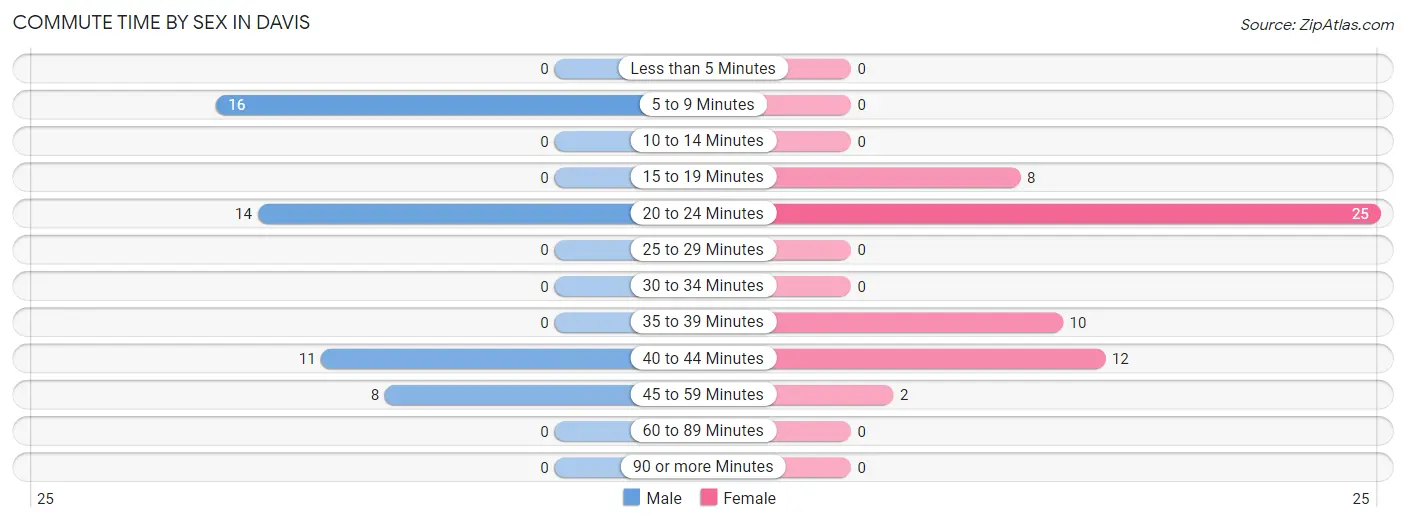
| Commute Time | Male | Female |
| Less than 5 Minutes | 0 (0.0%) | 0 (0.0%) |
| 5 to 9 Minutes | 16 (32.7%) | 0 (0.0%) |
| 10 to 14 Minutes | 0 (0.0%) | 0 (0.0%) |
| 15 to 19 Minutes | 0 (0.0%) | 8 (14.0%) |
| 20 to 24 Minutes | 14 (28.6%) | 25 (43.9%) |
| 25 to 29 Minutes | 0 (0.0%) | 0 (0.0%) |
| 30 to 34 Minutes | 0 (0.0%) | 0 (0.0%) |
| 35 to 39 Minutes | 0 (0.0%) | 10 (17.5%) |
| 40 to 44 Minutes | 11 (22.5%) | 12 (21.0%) |
| 45 to 59 Minutes | 8 (16.3%) | 2 (3.5%) |
| 60 to 89 Minutes | 0 (0.0%) | 0 (0.0%) |
| 90 or more Minutes | 0 (0.0%) | 0 (0.0%) |
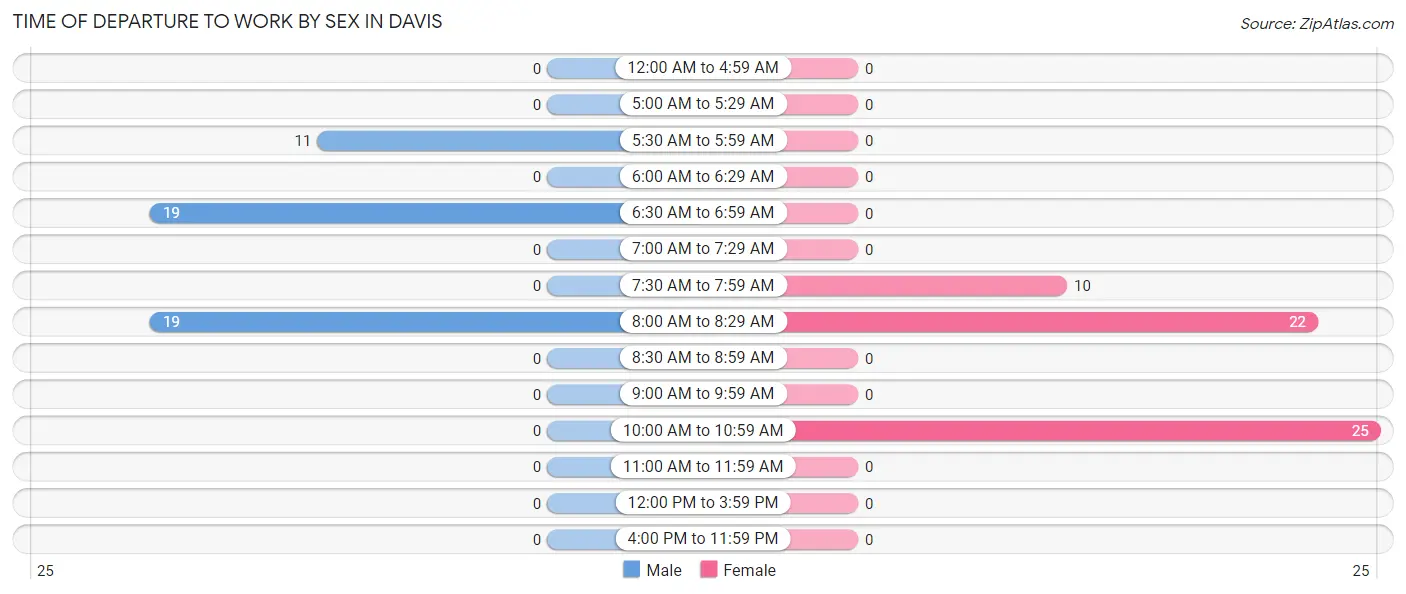
Time of Departure to Work by Sex in Davis
The most frequent times of departure to work in Davis are 6:30 AM to 6:59 AM (19, 38.8%) for males and 10:00 AM to 10:59 AM (25, 43.9%) for females.
| Time of Departure | Male | Female |
| 12:00 AM to 4:59 AM | 0 (0.0%) | 0 (0.0%) |
| 5:00 AM to 5:29 AM | 0 (0.0%) | 0 (0.0%) |
| 5:30 AM to 5:59 AM | 11 (22.5%) | 0 (0.0%) |
| 6:00 AM to 6:29 AM | 0 (0.0%) | 0 (0.0%) |
| 6:30 AM to 6:59 AM | 19 (38.8%) | 0 (0.0%) |
| 7:00 AM to 7:29 AM | 0 (0.0%) | 0 (0.0%) |
| 7:30 AM to 7:59 AM | 0 (0.0%) | 10 (17.5%) |
| 8:00 AM to 8:29 AM | 19 (38.8%) | 22 (38.6%) |
| 8:30 AM to 8:59 AM | 0 (0.0%) | 0 (0.0%) |
| 9:00 AM to 9:59 AM | 0 (0.0%) | 0 (0.0%) |
| 10:00 AM to 10:59 AM | 0 (0.0%) | 25 (43.9%) |
| 11:00 AM to 11:59 AM | 0 (0.0%) | 0 (0.0%) |
| 12:00 PM to 3:59 PM | 0 (0.0%) | 0 (0.0%) |
| 4:00 PM to 11:59 PM | 0 (0.0%) | 0 (0.0%) |
| Total | 49 (100.0%) | 57 (100.0%) |
Housing Occupancy in Davis
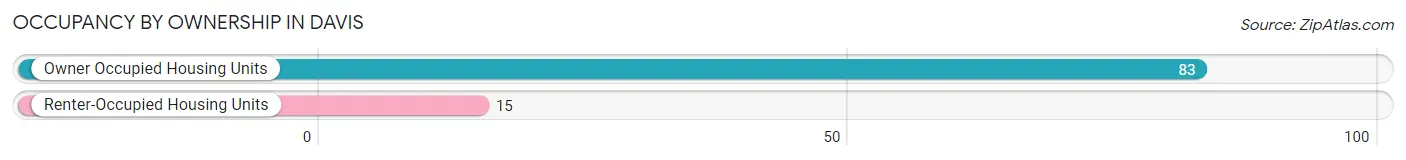
Occupancy by Ownership in Davis
Of the total 98 dwellings in Davis, owner-occupied units account for 83 (84.7%), while renter-occupied units make up 15 (15.3%).
| Occupancy | # Housing Units | % Housing Units |
| Owner Occupied Housing Units | 83 | 84.7% |
| Renter-Occupied Housing Units | 15 | 15.3% |
| Total Occupied Housing Units | 98 | 100.0% |
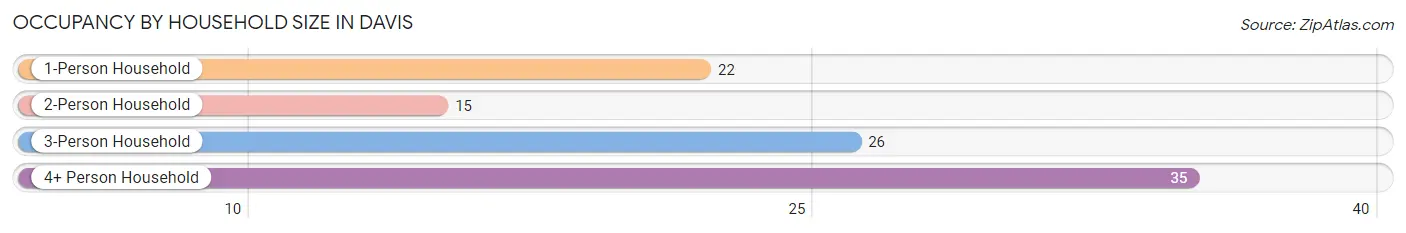
Occupancy by Household Size in Davis
| Household Size | # Housing Units | % Housing Units |
| 1-Person Household | 22 | 22.5% |
| 2-Person Household | 15 | 15.3% |
| 3-Person Household | 26 | 26.5% |
| 4+ Person Household | 35 | 35.7% |
| Total Housing Units | 98 | 100.0% |
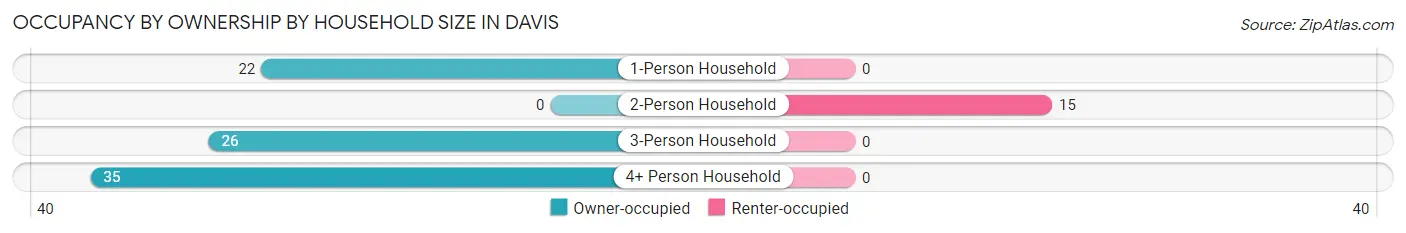
Occupancy by Ownership by Household Size in Davis
| Household Size | Owner-occupied | Renter-occupied |
| 1-Person Household | 22 (100.0%) | 0 (0.0%) |
| 2-Person Household | 0 (0.0%) | 15 (100.0%) |
| 3-Person Household | 26 (100.0%) | 0 (0.0%) |
| 4+ Person Household | 35 (100.0%) | 0 (0.0%) |
| Total Housing Units | 83 (84.7%) | 15 (15.3%) |
Occupancy by Educational Attainment in Davis
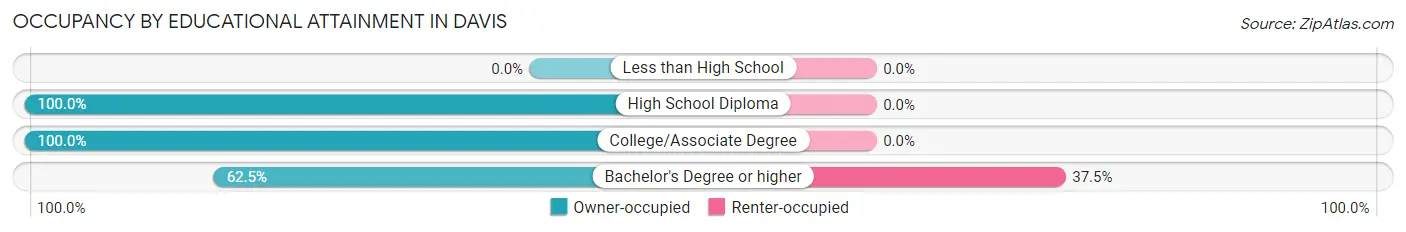
| Household Size | Owner-occupied | Renter-occupied |
| Less than High School | 0 (0.0%) | 0 (0.0%) |
| High School Diploma | 33 (100.0%) | 0 (0.0%) |
| College/Associate Degree | 25 (100.0%) | 0 (0.0%) |
| Bachelor's Degree or higher | 25 (62.5%) | 15 (37.5%) |
Occupancy by Age of Householder in Davis
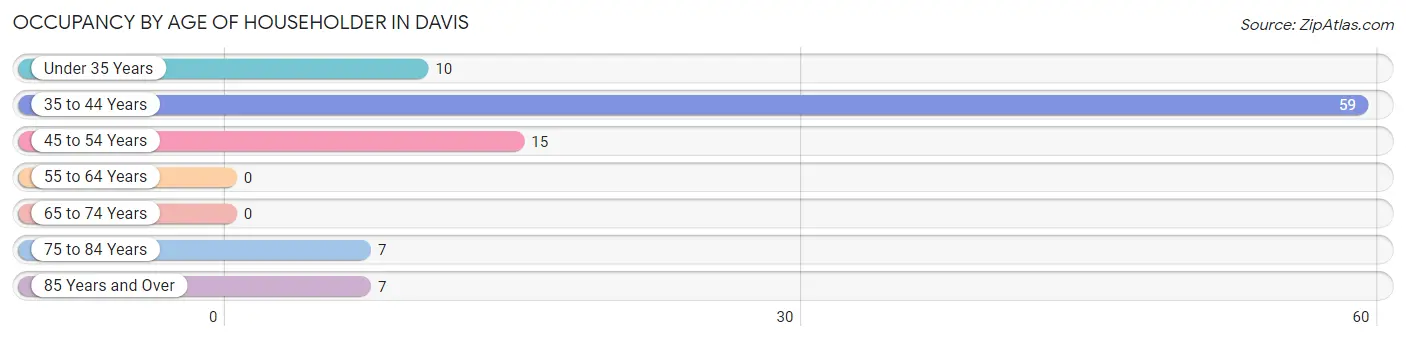
| Age Bracket | # Households | % Households |
| Under 35 Years | 10 | 10.2% |
| 35 to 44 Years | 59 | 60.2% |
| 45 to 54 Years | 15 | 15.3% |
| 55 to 64 Years | 0 | 0.0% |
| 65 to 74 Years | 0 | 0.0% |
| 75 to 84 Years | 7 | 7.1% |
| 85 Years and Over | 7 | 7.1% |
| Total | 98 | 100.0% |
Housing Finances in Davis
Median Income by Occupancy in Davis
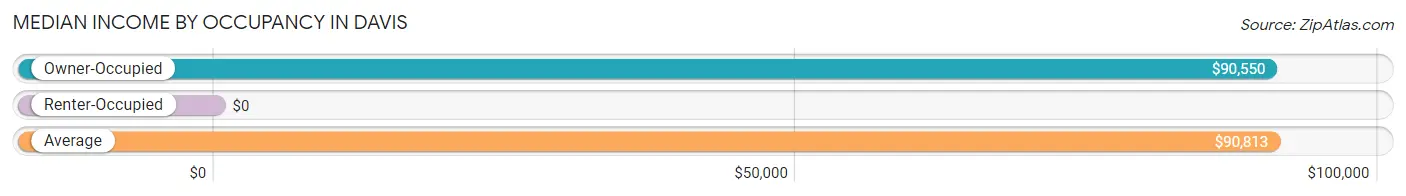
| Occupancy Type | # Households | Median Income |
| Owner-Occupied | 83 (84.7%) | $90,550 |
| Renter-Occupied | 15 (15.3%) | $0 |
| Average | 98 (100.0%) | $90,813 |
Occupancy by Householder Income Bracket in Davis
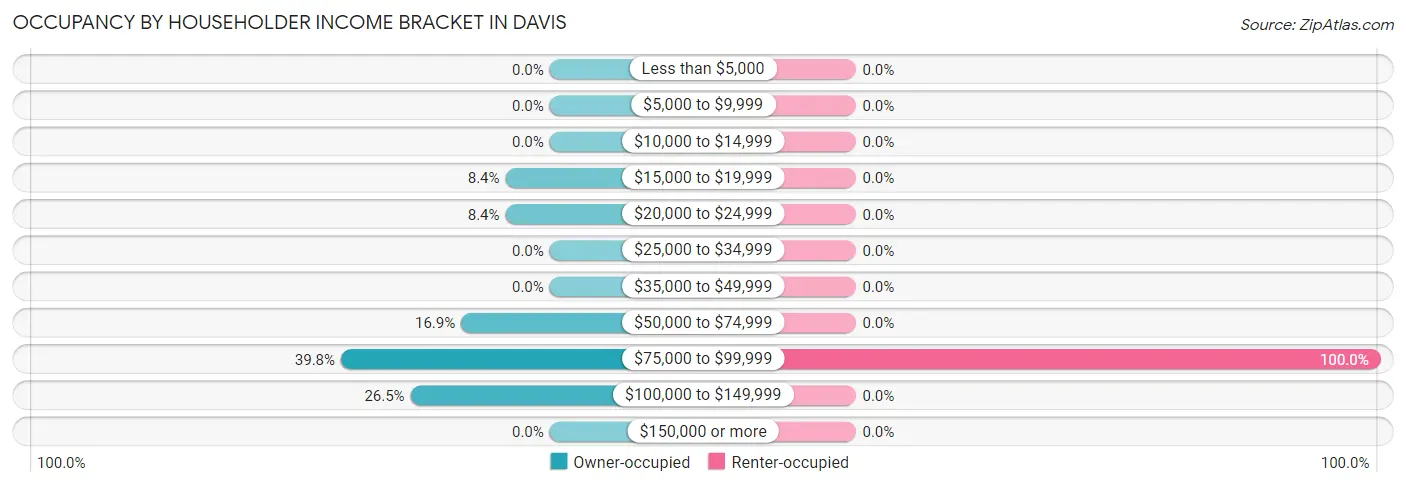
| Income Bracket | Owner-occupied | Renter-occupied |
| Less than $5,000 | 0 (0.0%) | 0 (0.0%) |
| $5,000 to $9,999 | 0 (0.0%) | 0 (0.0%) |
| $10,000 to $14,999 | 0 (0.0%) | 0 (0.0%) |
| $15,000 to $19,999 | 7 (8.4%) | 0 (0.0%) |
| $20,000 to $24,999 | 7 (8.4%) | 0 (0.0%) |
| $25,000 to $34,999 | 0 (0.0%) | 0 (0.0%) |
| $35,000 to $49,999 | 0 (0.0%) | 0 (0.0%) |
| $50,000 to $74,999 | 14 (16.9%) | 0 (0.0%) |
| $75,000 to $99,999 | 33 (39.8%) | 15 (100.0%) |
| $100,000 to $149,999 | 22 (26.5%) | 0 (0.0%) |
| $150,000 or more | 0 (0.0%) | 0 (0.0%) |
| Total | 83 (100.0%) | 15 (100.0%) |
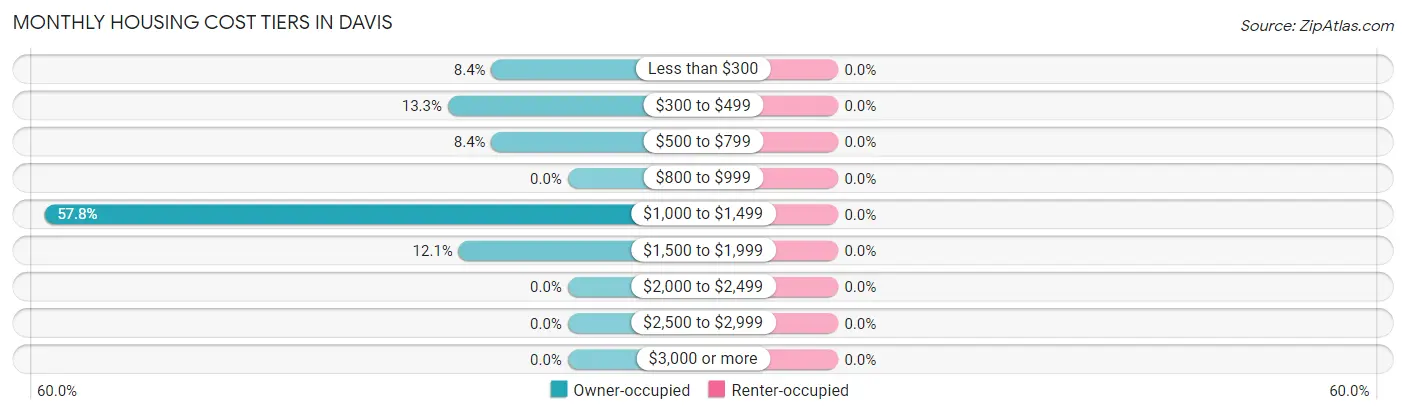
Monthly Housing Cost Tiers in Davis
| Monthly Cost | Owner-occupied | Renter-occupied |
| Less than $300 | 7 (8.4%) | 0 (0.0%) |
| $300 to $499 | 11 (13.3%) | 0 (0.0%) |
| $500 to $799 | 7 (8.4%) | 0 (0.0%) |
| $800 to $999 | 0 (0.0%) | 0 (0.0%) |
| $1,000 to $1,499 | 48 (57.8%) | 0 (0.0%) |
| $1,500 to $1,999 | 10 (12.0%) | 0 (0.0%) |
| $2,000 to $2,499 | 0 (0.0%) | 0 (0.0%) |
| $2,500 to $2,999 | 0 (0.0%) | 0 (0.0%) |
| $3,000 or more | 0 (0.0%) | 0 (0.0%) |
| Total | 83 (100.0%) | 15 (100.0%) |
Physical Housing Characteristics in Davis
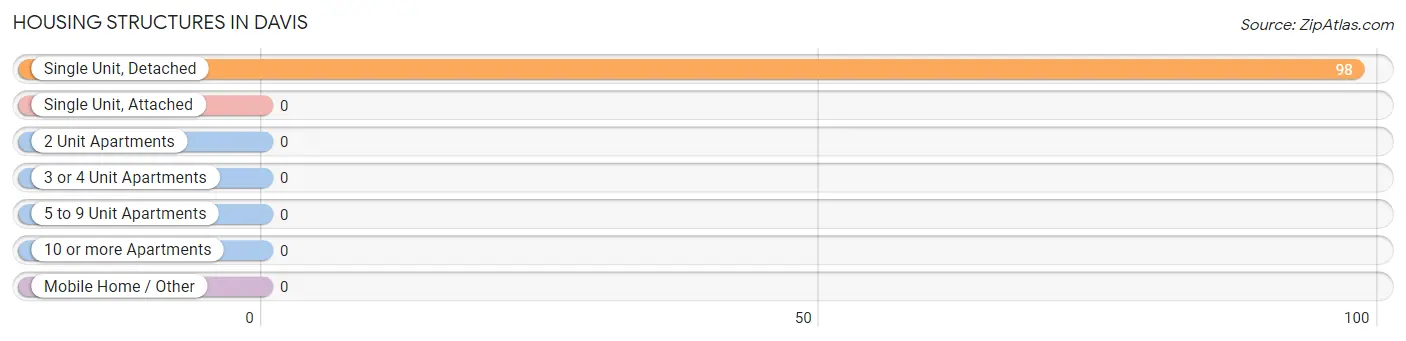
Housing Structures in Davis
| Structure Type | # Housing Units | % Housing Units |
| Single Unit, Detached | 98 | 100.0% |
| Single Unit, Attached | 0 | 0.0% |
| 2 Unit Apartments | 0 | 0.0% |
| 3 or 4 Unit Apartments | 0 | 0.0% |
| 5 to 9 Unit Apartments | 0 | 0.0% |
| 10 or more Apartments | 0 | 0.0% |
| Mobile Home / Other | 0 | 0.0% |
| Total | 98 | 100.0% |
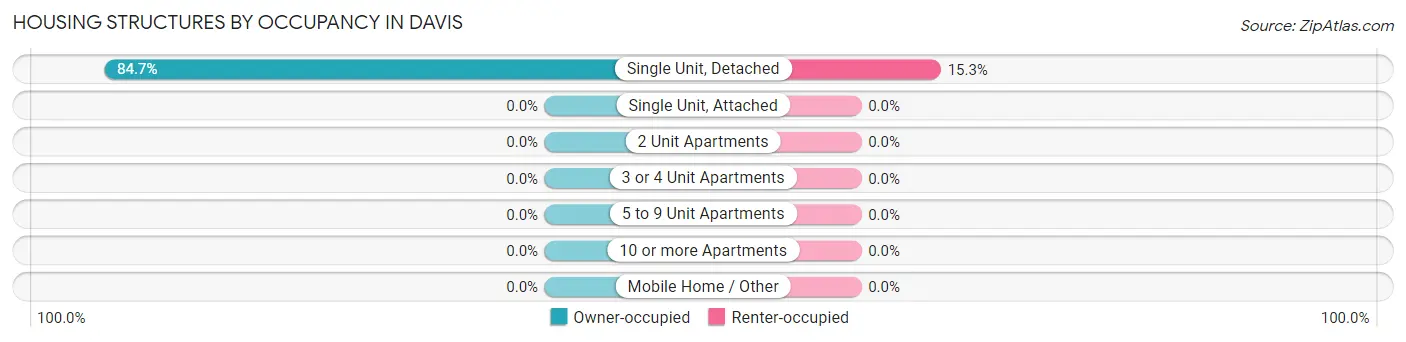
Housing Structures by Occupancy in Davis
| Structure Type | Owner-occupied | Renter-occupied |
| Single Unit, Detached | 83 (84.7%) | 15 (15.3%) |
| Single Unit, Attached | 0 (0.0%) | 0 (0.0%) |
| 2 Unit Apartments | 0 (0.0%) | 0 (0.0%) |
| 3 or 4 Unit Apartments | 0 (0.0%) | 0 (0.0%) |
| 5 to 9 Unit Apartments | 0 (0.0%) | 0 (0.0%) |
| 10 or more Apartments | 0 (0.0%) | 0 (0.0%) |
| Mobile Home / Other | 0 (0.0%) | 0 (0.0%) |
| Total | 83 (84.7%) | 15 (15.3%) |
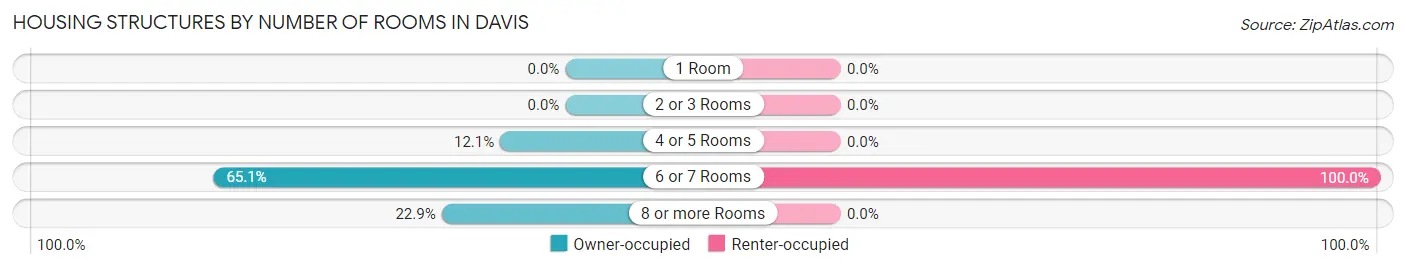
Housing Structures by Number of Rooms in Davis
| Number of Rooms | Owner-occupied | Renter-occupied |
| 1 Room | 0 (0.0%) | 0 (0.0%) |
| 2 or 3 Rooms | 0 (0.0%) | 0 (0.0%) |
| 4 or 5 Rooms | 10 (12.0%) | 0 (0.0%) |
| 6 or 7 Rooms | 54 (65.1%) | 15 (100.0%) |
| 8 or more Rooms | 19 (22.9%) | 0 (0.0%) |
| Total | 83 (100.0%) | 15 (100.0%) |
Housing Structure by Heating Type in Davis
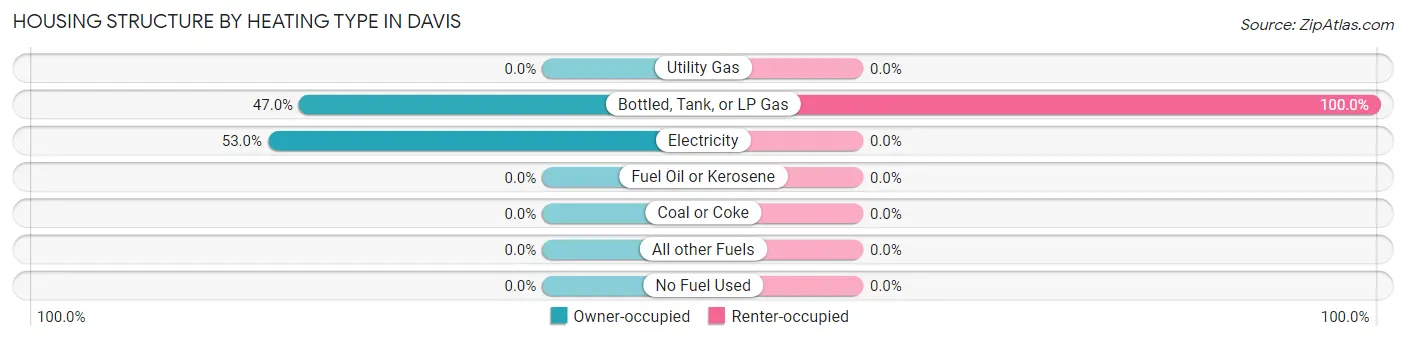
| Heating Type | Owner-occupied | Renter-occupied |
| Utility Gas | 0 (0.0%) | 0 (0.0%) |
| Bottled, Tank, or LP Gas | 39 (47.0%) | 15 (100.0%) |
| Electricity | 44 (53.0%) | 0 (0.0%) |
| Fuel Oil or Kerosene | 0 (0.0%) | 0 (0.0%) |
| Coal or Coke | 0 (0.0%) | 0 (0.0%) |
| All other Fuels | 0 (0.0%) | 0 (0.0%) |
| No Fuel Used | 0 (0.0%) | 0 (0.0%) |
| Total | 83 (100.0%) | 15 (100.0%) |
Household Vehicle Usage in Davis
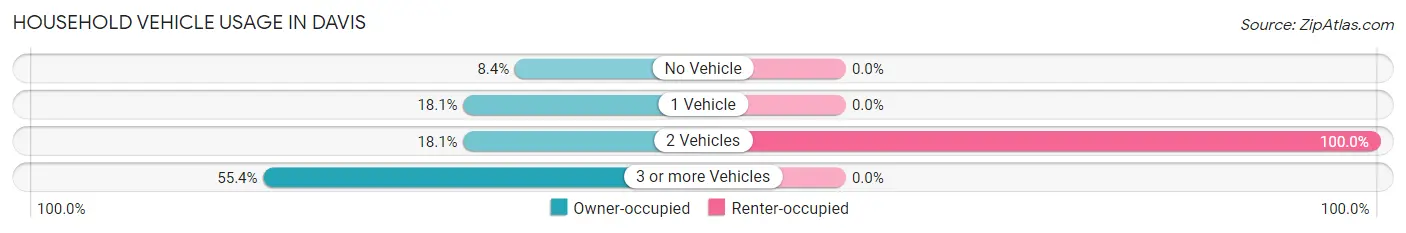
| Vehicles per Household | Owner-occupied | Renter-occupied |
| No Vehicle | 7 (8.4%) | 0 (0.0%) |
| 1 Vehicle | 15 (18.1%) | 0 (0.0%) |
| 2 Vehicles | 15 (18.1%) | 15 (100.0%) |
| 3 or more Vehicles | 46 (55.4%) | 0 (0.0%) |
| Total | 83 (100.0%) | 15 (100.0%) |
Real Estate & Mortgages in Davis
Real Estate and Mortgage Overview in Davis
| Characteristic | Without Mortgage | With Mortgage |
| Housing Units | 25 | 58 |
| Median Property Value | - | - |
| Median Household Income | - | - |
| Monthly Housing Costs | $450 | $0 |
| Real Estate Taxes | - | - |
Property Value by Mortgage Status in Davis
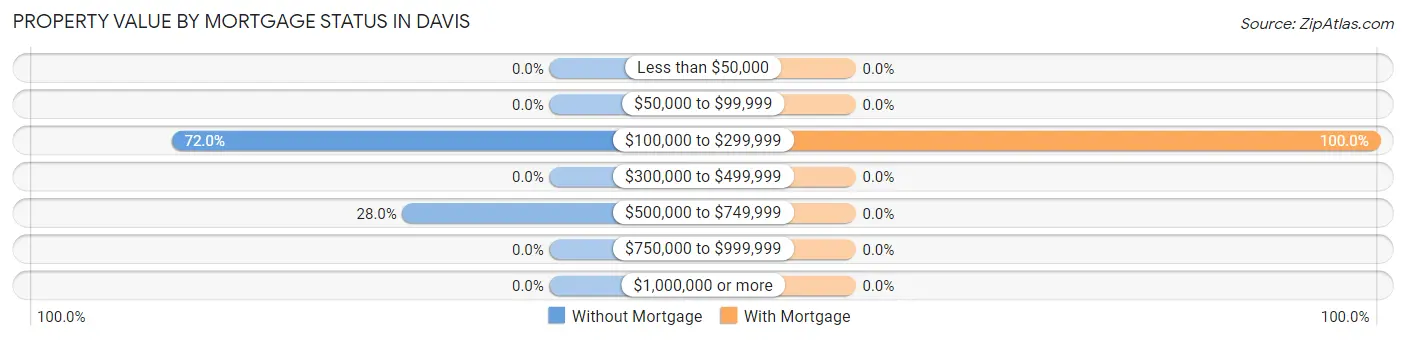
| Property Value | Without Mortgage | With Mortgage |
| Less than $50,000 | 0 (0.0%) | 0 (0.0%) |
| $50,000 to $99,999 | 0 (0.0%) | 0 (0.0%) |
| $100,000 to $299,999 | 18 (72.0%) | 58 (100.0%) |
| $300,000 to $499,999 | 0 (0.0%) | 0 (0.0%) |
| $500,000 to $749,999 | 7 (28.0%) | 0 (0.0%) |
| $750,000 to $999,999 | 0 (0.0%) | 0 (0.0%) |
| $1,000,000 or more | 0 (0.0%) | 0 (0.0%) |
| Total | 25 (100.0%) | 58 (100.0%) |
Household Income by Mortgage Status in Davis
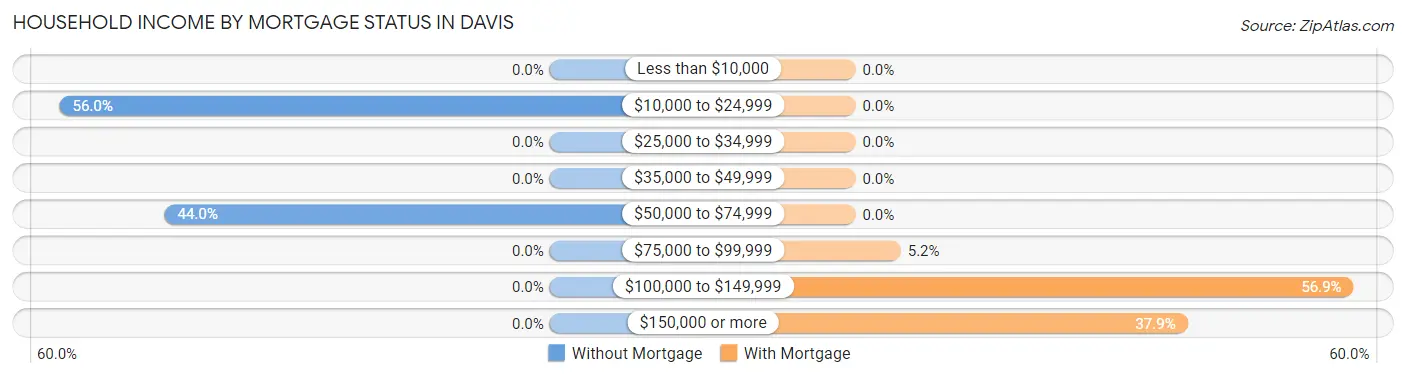
| Household Income | Without Mortgage | With Mortgage |
| Less than $10,000 | 0 (0.0%) | 0 (0.0%) |
| $10,000 to $24,999 | 14 (56.0%) | 0 (0.0%) |
| $25,000 to $34,999 | 0 (0.0%) | 0 (0.0%) |
| $35,000 to $49,999 | 0 (0.0%) | 0 (0.0%) |
| $50,000 to $74,999 | 11 (44.0%) | 0 (0.0%) |
| $75,000 to $99,999 | 0 (0.0%) | 3 (5.2%) |
| $100,000 to $149,999 | 0 (0.0%) | 33 (56.9%) |
| $150,000 or more | 0 (0.0%) | 22 (37.9%) |
| Total | 25 (100.0%) | 58 (100.0%) |
Property Value to Household Income Ratio in Davis
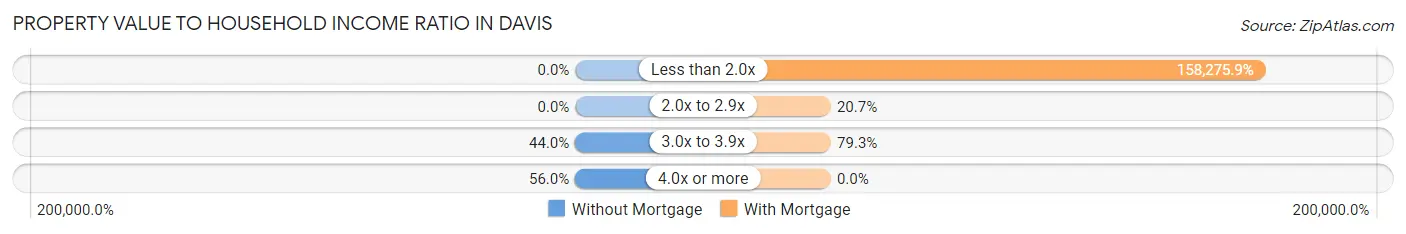
| Value-to-Income Ratio | Without Mortgage | With Mortgage |
| Less than 2.0x | 0 (0.0%) | 91,800 (158,275.9%) |
| 2.0x to 2.9x | 0 (0.0%) | 12 (20.7%) |
| 3.0x to 3.9x | 11 (44.0%) | 46 (79.3%) |
| 4.0x or more | 14 (56.0%) | 0 (0.0%) |
| Total | 25 (100.0%) | 58 (100.0%) |
Real Estate Taxes by Mortgage Status in Davis
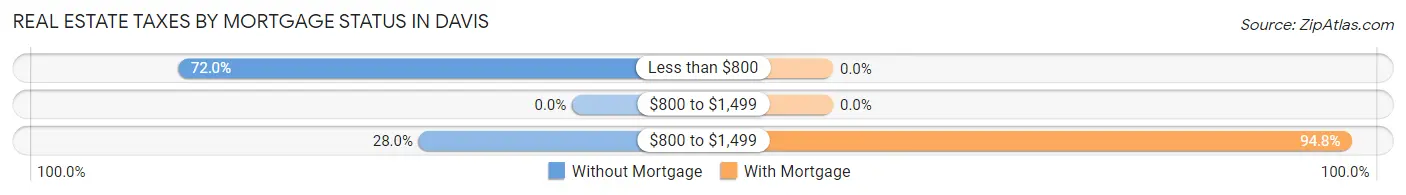
| Property Taxes | Without Mortgage | With Mortgage |
| Less than $800 | 18 (72.0%) | 0 (0.0%) |
| $800 to $1,499 | 0 (0.0%) | 0 (0.0%) |
| $800 to $1,499 | 7 (28.0%) | 55 (94.8%) |
| Total | 25 (100.0%) | 58 (100.0%) |
Health & Disability in Davis
Health Insurance Coverage by Age in Davis
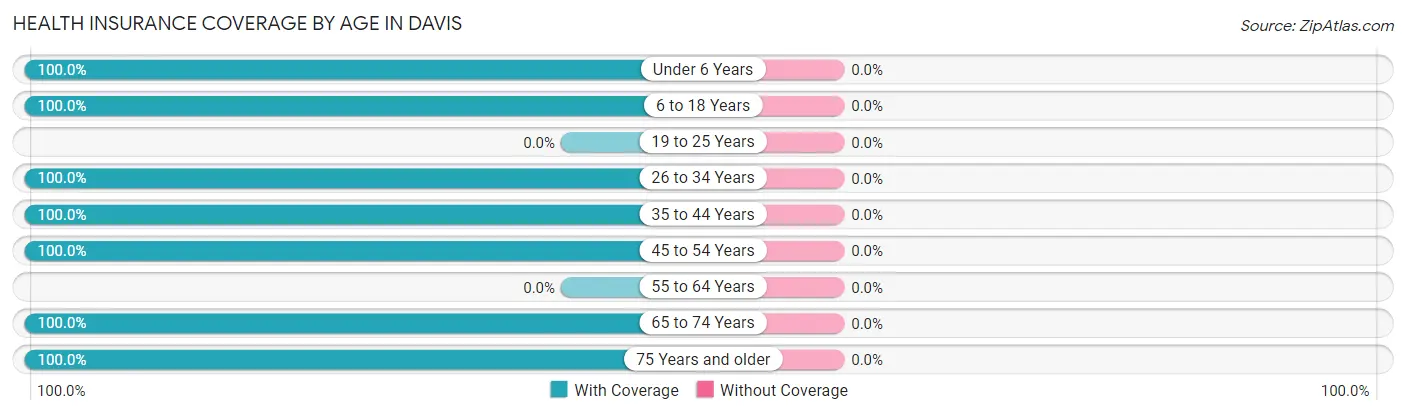
| Age Bracket | With Coverage | Without Coverage |
| Under 6 Years | 39 (100.0%) | 0 (0.0%) |
| 6 to 18 Years | 53 (100.0%) | 0 (0.0%) |
| 19 to 25 Years | 0 (0.0%) | 0 (0.0%) |
| 26 to 34 Years | 10 (100.0%) | 0 (0.0%) |
| 35 to 44 Years | 122 (100.0%) | 0 (0.0%) |
| 45 to 54 Years | 26 (100.0%) | 0 (0.0%) |
| 55 to 64 Years | 0 (0.0%) | 0 (0.0%) |
| 65 to 74 Years | 11 (100.0%) | 0 (0.0%) |
| 75 Years and older | 14 (100.0%) | 0 (0.0%) |
| Total | 275 (100.0%) | 0 (0.0%) |
Health Insurance Coverage by Citizenship Status in Davis
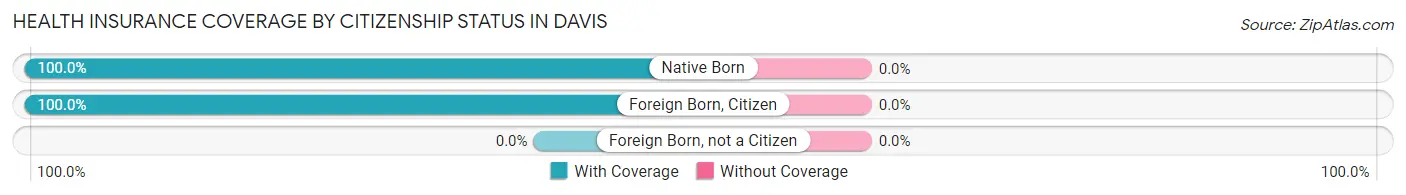
| Citizenship Status | With Coverage | Without Coverage |
| Native Born | 39 (100.0%) | 0 (0.0%) |
| Foreign Born, Citizen | 53 (100.0%) | 0 (0.0%) |
| Foreign Born, not a Citizen | 0 (0.0%) | 0 (0.0%) |
Health Insurance Coverage by Household Income in Davis
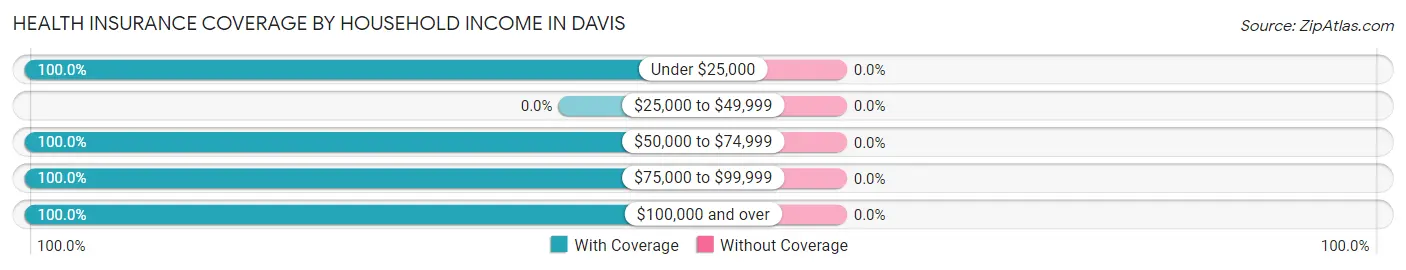
| Household Income | With Coverage | Without Coverage |
| Under $25,000 | 14 (100.0%) | 0 (0.0%) |
| $25,000 to $49,999 | 0 (0.0%) | 0 (0.0%) |
| $50,000 to $74,999 | 36 (100.0%) | 0 (0.0%) |
| $75,000 to $99,999 | 150 (100.0%) | 0 (0.0%) |
| $100,000 and over | 75 (100.0%) | 0 (0.0%) |
Public vs Private Health Insurance Coverage by Age in Davis
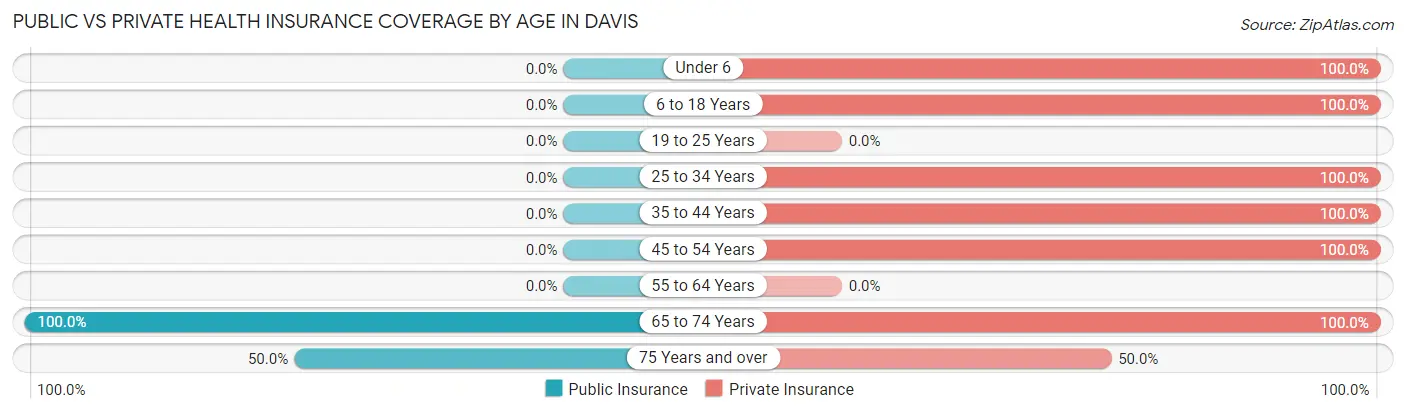
| Age Bracket | Public Insurance | Private Insurance |
| Under 6 | 0 (0.0%) | 39 (100.0%) |
| 6 to 18 Years | 0 (0.0%) | 53 (100.0%) |
| 19 to 25 Years | 0 (0.0%) | 0 (0.0%) |
| 25 to 34 Years | 0 (0.0%) | 10 (100.0%) |
| 35 to 44 Years | 0 (0.0%) | 122 (100.0%) |
| 45 to 54 Years | 0 (0.0%) | 26 (100.0%) |
| 55 to 64 Years | 0 (0.0%) | 0 (0.0%) |
| 65 to 74 Years | 11 (100.0%) | 11 (100.0%) |
| 75 Years and over | 7 (50.0%) | 7 (50.0%) |
| Total | 18 (6.6%) | 268 (97.5%) |
Disability Status by Sex by Age in Davis
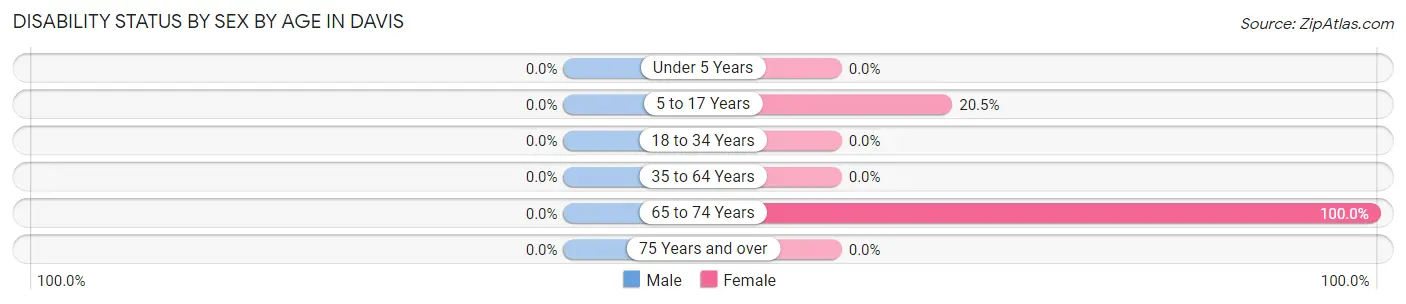
| Age Bracket | Male | Female |
| Under 5 Years | 0 (0.0%) | 0 (0.0%) |
| 5 to 17 Years | 0 (0.0%) | 8 (20.5%) |
| 18 to 34 Years | 0 (0.0%) | 0 (0.0%) |
| 35 to 64 Years | 0 (0.0%) | 0 (0.0%) |
| 65 to 74 Years | 0 (0.0%) | 11 (100.0%) |
| 75 Years and over | 0 (0.0%) | 0 (0.0%) |
Disability Class by Sex by Age in Davis
Disability Class: Hearing Difficulty
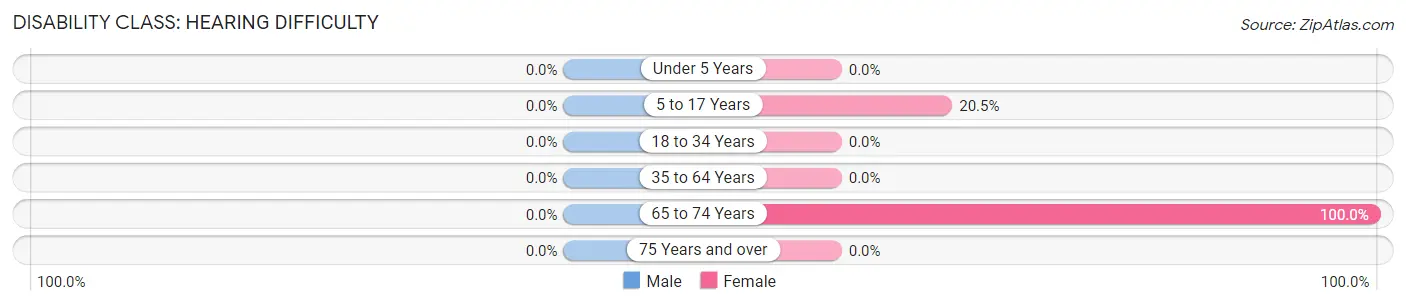
| Age Bracket | Male | Female |
| Under 5 Years | 0 (0.0%) | 0 (0.0%) |
| 5 to 17 Years | 0 (0.0%) | 8 (20.5%) |
| 18 to 34 Years | 0 (0.0%) | 0 (0.0%) |
| 35 to 64 Years | 0 (0.0%) | 0 (0.0%) |
| 65 to 74 Years | 0 (0.0%) | 11 (100.0%) |
| 75 Years and over | 0 (0.0%) | 0 (0.0%) |
Disability Class: Vision Difficulty
| Age Bracket | Male | Female |
| Under 5 Years | 0 (0.0%) | 0 (0.0%) |
| 5 to 17 Years | 0 (0.0%) | 0 (0.0%) |
| 18 to 34 Years | 0 (0.0%) | 0 (0.0%) |
| 35 to 64 Years | 0 (0.0%) | 0 (0.0%) |
| 65 to 74 Years | 0 (0.0%) | 11 (100.0%) |
| 75 Years and over | 0 (0.0%) | 0 (0.0%) |
Disability Class: Cognitive Difficulty
| Age Bracket | Male | Female |
| 5 to 17 Years | 0 (0.0%) | 0 (0.0%) |
| 18 to 34 Years | 0 (0.0%) | 0 (0.0%) |
| 35 to 64 Years | 0 (0.0%) | 0 (0.0%) |
| 65 to 74 Years | 0 (0.0%) | 11 (100.0%) |
| 75 Years and over | 0 (0.0%) | 0 (0.0%) |
Disability Class: Ambulatory Difficulty

| Age Bracket | Male | Female |
| 5 to 17 Years | 0 (0.0%) | 0 (0.0%) |
| 18 to 34 Years | 0 (0.0%) | 0 (0.0%) |
| 35 to 64 Years | 0 (0.0%) | 0 (0.0%) |
| 65 to 74 Years | 0 (0.0%) | 11 (100.0%) |
| 75 Years and over | 0 (0.0%) | 0 (0.0%) |
Disability Class: Self-Care Difficulty
| Age Bracket | Male | Female |
| 5 to 17 Years | 0 (0.0%) | 0 (0.0%) |
| 18 to 34 Years | 0 (0.0%) | 0 (0.0%) |
| 35 to 64 Years | 0 (0.0%) | 0 (0.0%) |
| 65 to 74 Years | 0 (0.0%) | 11 (100.0%) |
| 75 Years and over | 0 (0.0%) | 0 (0.0%) |
Technology Access in Davis
Computing Device Access in Davis
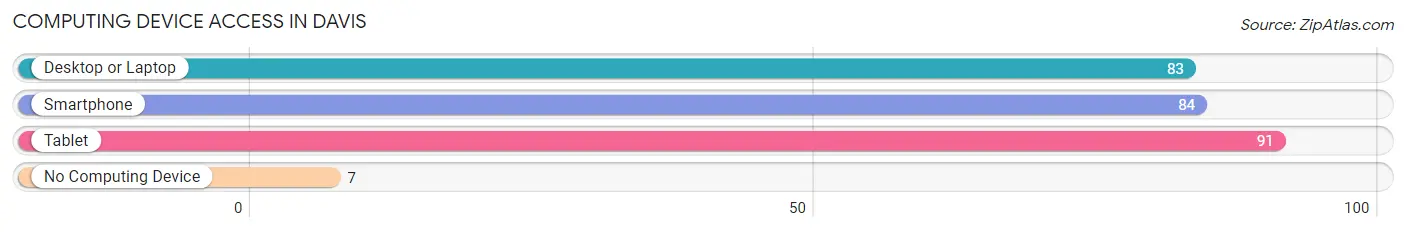
| Device Type | # Households | % Households |
| Desktop or Laptop | 83 | 84.7% |
| Smartphone | 84 | 85.7% |
| Tablet | 91 | 92.9% |
| No Computing Device | 7 | 7.1% |
| Total | 98 | 100.0% |
Internet Access in Davis
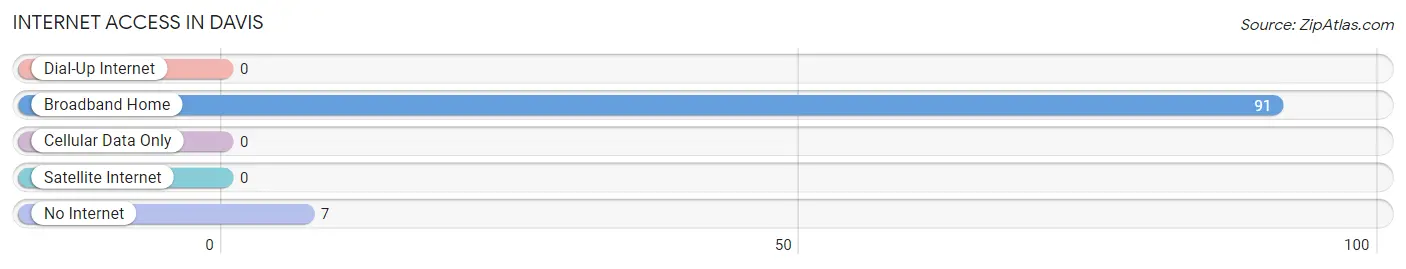
| Internet Type | # Households | % Households |
| Dial-Up Internet | 0 | 0.0% |
| Broadband Home | 91 | 92.9% |
| Cellular Data Only | 0 | 0.0% |
| Satellite Internet | 0 | 0.0% |
| No Internet | 7 | 7.1% |
| Total | 98 | 100.0% |
Davis Summary
Davis, North Carolina is a small town located in the northeastern part of the state, in the county of Pamlico. It is situated on the banks of the Neuse River, and is part of the New Bern Metropolitan Statistical Area. The town has a population of approximately 1,000 people, and is known for its rich history, beautiful scenery, and friendly atmosphere.
History
The area that is now Davis was first settled in the late 1700s by a group of settlers from Virginia. The town was originally known as “Davis’s Crossroads”, named after the first settler, William Davis. The town was officially incorporated in 1891, and was named after the Davis family.
The town was an important stop on the Wilmington and Weldon Railroad, which ran through the area in the late 1800s. This railroad was a major factor in the growth of the town, as it allowed for the transportation of goods and people to and from the area.
Geography
Davis is located in the northeastern part of North Carolina, in the county of Pamlico. It is situated on the banks of the Neuse River, and is part of the New Bern Metropolitan Statistical Area. The town is surrounded by lush forests and rolling hills, and is home to a variety of wildlife.
The climate in Davis is humid subtropical, with hot, humid summers and mild winters. The average temperature in the summer is around 80 degrees Fahrenheit, and the average temperature in the winter is around 50 degrees Fahrenheit.
Economy
The economy of Davis is largely based on agriculture and tourism. The town is home to several farms, which produce a variety of crops, including corn, soybeans, and tobacco. The town is also home to several small businesses, including restaurants, shops, and other services.
Tourism is an important part of the economy of Davis. The town is home to several historic sites, including the Davis House, which was built in the late 1800s, and the Davis Cemetery, which is the final resting place of many of the town’s earliest settlers. The town is also home to several parks and recreational areas, including the Neuse River Trail, which is a popular spot for hiking and biking.
Demographics
As of the 2010 census, the population of Davis was 1,000 people. The racial makeup of the town was 94.2% White, 3.2% African American, 0.7% Native American, 0.3% Asian, and 1.6% from other races. The median household income in Davis was $35,000, and the median age was 44 years.
Conclusion
Davis, North Carolina is a small town with a rich history and a friendly atmosphere. The town is home to several farms, businesses, and historic sites, and is a popular destination for tourists. The town has a population of approximately 1,000 people, and is known for its beautiful scenery and humid subtropical climate. The economy of Davis is largely based on agriculture and tourism, and the town is home to a variety of wildlife.
Common Questions
What is Per Capita Income in Davis?
Per Capita income in Davis is $27,111.
What is the Median Family Income in Davis?
Median Family Income in Davis is $91,500.
What is the Median Household income in Davis?
Median Household Income in Davis is $90,813.
What is Income or Wage Gap in Davis?
Income or Wage Gap in Davis is 22.4%.
Women in Davis earn 77.6 cents for every dollar earned by a man.
What is Inequality or Gini Index in Davis?
Inequality or Gini Index in Davis is 0.18.
What is the Total Population of Davis?
Total Population of Davis is 275.
What is the Total Male Population of Davis?
Total Male Population of Davis is 97.
What is the Total Female Population of Davis?
Total Female Population of Davis is 178.
What is the Ratio of Males per 100 Females in Davis?
There are 54.49 Males per 100 Females in Davis.
What is the Ratio of Females per 100 Males in Davis?
There are 183.51 Females per 100 Males in Davis.
What is the Median Population Age in Davis?
Median Population Age in Davis is 37.4 Years.
What is the Average Family Size in Davis
Average Family Size in Davis is 3.3 People.
What is the Average Household Size in Davis
Average Household Size in Davis is 2.8 People.
How Large is the Labor Force in Davis?
There are 148 People in the Labor Forcein in Davis.
What is the Percentage of People in the Labor Force in Davis?
76.7% of People are in the Labor Force in Davis.