Sunbury, NC Map & Demographics
Sunbury Map
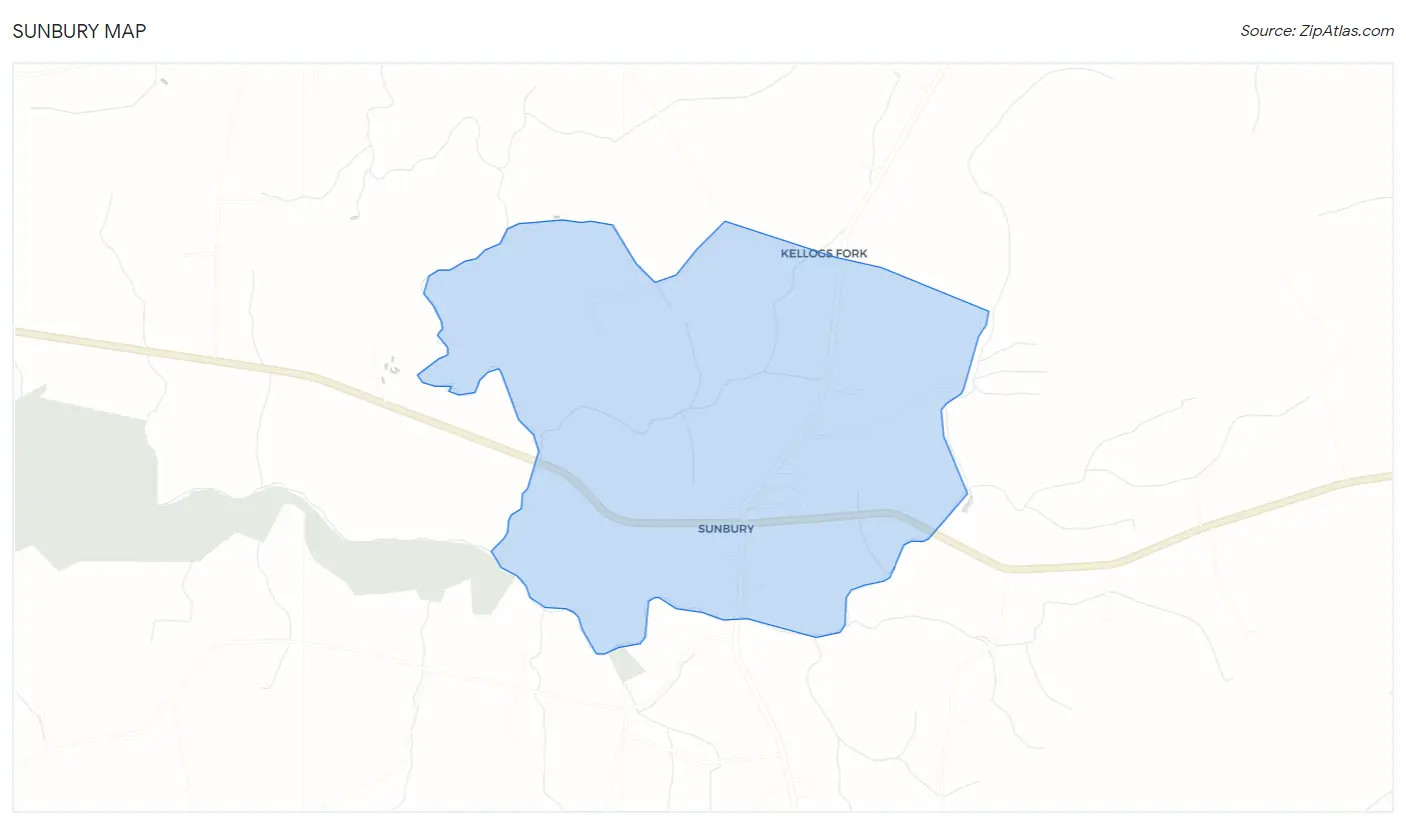
Sunbury Overview
$41,255
PER CAPITA INCOME
$71,736
AVG FAMILY INCOME
$52,083
AVG HOUSEHOLD INCOME
0.19
INEQUALITY / GINI INDEX
121
TOTAL POPULATION
25
MALE POPULATION
96
FEMALE POPULATION
26.04
MALES / 100 FEMALES
384.00
FEMALES / 100 MALES
35.8
MEDIAN AGE
2.7
AVG FAMILY SIZE
1.5
AVG HOUSEHOLD SIZE
93
LABOR FORCE [ PEOPLE ]
92.1%
PERCENT IN LABOR FORCE
Sunbury Zip Codes
Sunbury Area Codes
Income in Sunbury
Income Overview in Sunbury
Per Capita Income in Sunbury is $41,255, while median incomes of families and households are $71,736 and $52,083 respectively.
| Characteristic | Number | Measure |
| Per Capita Income | 121 | $41,255 |
| Median Family Income | 25 | $71,736 |
| Mean Family Income | 25 | $83,568 |
| Median Household Income | 79 | $52,083 |
| Mean Household Income | 79 | $60,900 |
| Income Deficit | 25 | $0 |
| Wage / Income Gap (%) | 121 | 0.00% |
| Wage / Income Gap ($) | 121 | 100.00¢ per $1 |
| Gini / Inequality Index | 121 | 0.19 |
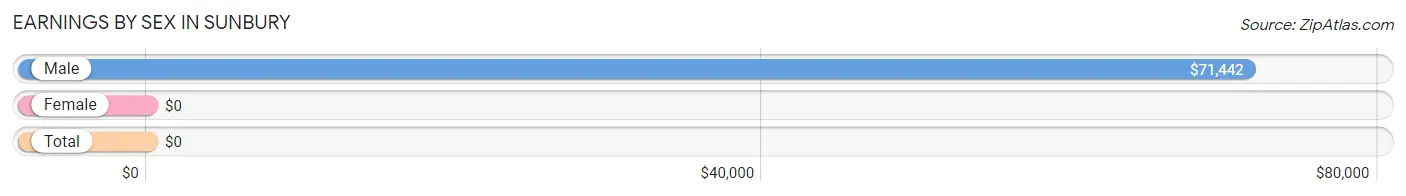
Earnings by Sex in Sunbury
| Sex | Number | Average Earnings |
| Male | 25 (26.9%) | $71,442 |
| Female | 68 (73.1%) | $0 |
| Total | 93 (100.0%) | $0 |
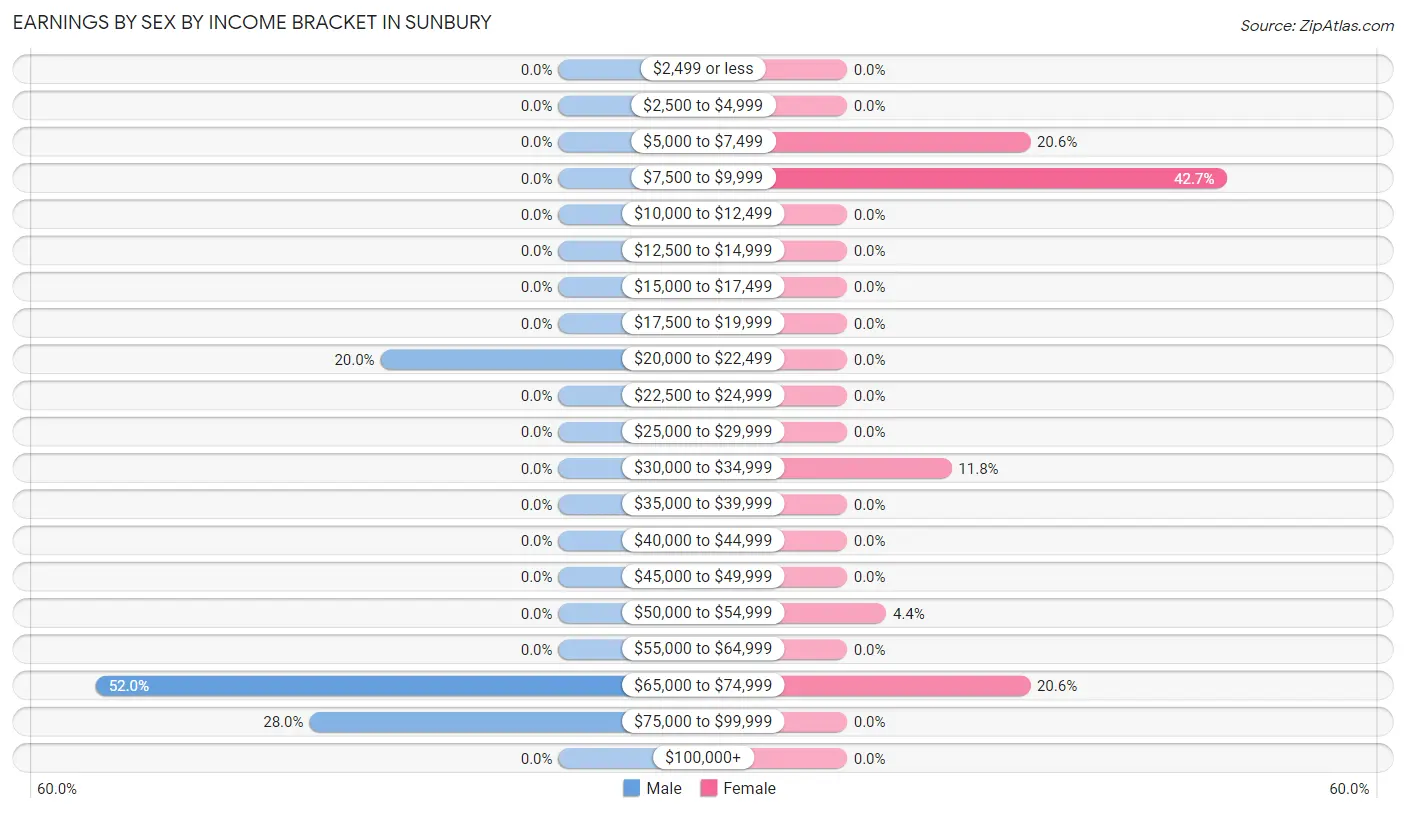
Earnings by Sex by Income Bracket in Sunbury
The most common earnings brackets in Sunbury are $65,000 to $74,999 for men (13 | 52.0%) and $7,500 to $9,999 for women (29 | 42.6%).
| Income | Male | Female |
| $2,499 or less | 0 (0.0%) | 0 (0.0%) |
| $2,500 to $4,999 | 0 (0.0%) | 0 (0.0%) |
| $5,000 to $7,499 | 0 (0.0%) | 14 (20.6%) |
| $7,500 to $9,999 | 0 (0.0%) | 29 (42.6%) |
| $10,000 to $12,499 | 0 (0.0%) | 0 (0.0%) |
| $12,500 to $14,999 | 0 (0.0%) | 0 (0.0%) |
| $15,000 to $17,499 | 0 (0.0%) | 0 (0.0%) |
| $17,500 to $19,999 | 0 (0.0%) | 0 (0.0%) |
| $20,000 to $22,499 | 5 (20.0%) | 0 (0.0%) |
| $22,500 to $24,999 | 0 (0.0%) | 0 (0.0%) |
| $25,000 to $29,999 | 0 (0.0%) | 0 (0.0%) |
| $30,000 to $34,999 | 0 (0.0%) | 8 (11.8%) |
| $35,000 to $39,999 | 0 (0.0%) | 0 (0.0%) |
| $40,000 to $44,999 | 0 (0.0%) | 0 (0.0%) |
| $45,000 to $49,999 | 0 (0.0%) | 0 (0.0%) |
| $50,000 to $54,999 | 0 (0.0%) | 3 (4.4%) |
| $55,000 to $64,999 | 0 (0.0%) | 0 (0.0%) |
| $65,000 to $74,999 | 13 (52.0%) | 14 (20.6%) |
| $75,000 to $99,999 | 7 (28.0%) | 0 (0.0%) |
| $100,000+ | 0 (0.0%) | 0 (0.0%) |
| Total | 25 (100.0%) | 68 (100.0%) |
Earnings by Sex by Educational Attainment in Sunbury
| Educational Attainment | Male Income | Female Income |
| Less than High School | - | - |
| High School Diploma | - | - |
| College or Associate's Degree | - | - |
| Bachelor's Degree | - | - |
| Graduate Degree | - | - |
| Total | $71,442 | $0 |
Family Income in Sunbury
Family Income Brackets in Sunbury
According to the Sunbury family income data, there are 18 families falling into the $50,000 to $74,999 income range, which is the most common income bracket and makes up 72.0% of all families.
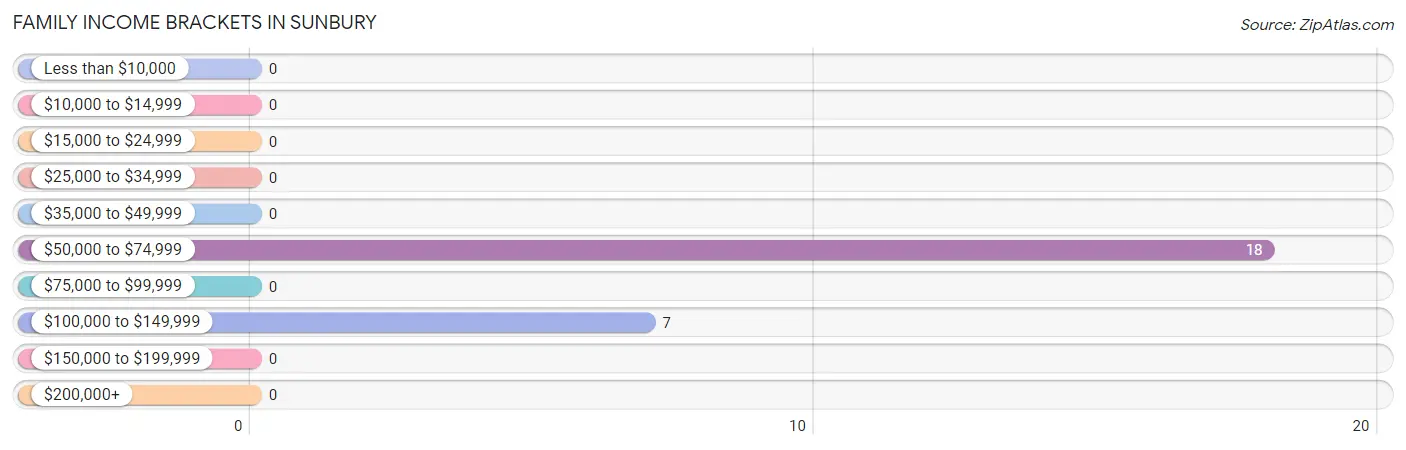
| Income Bracket | # Families | % Families |
| Less than $10,000 | 0 | 0.0% |
| $10,000 to $14,999 | 0 | 0.0% |
| $15,000 to $24,999 | 0 | 0.0% |
| $25,000 to $34,999 | 0 | 0.0% |
| $35,000 to $49,999 | 0 | 0.0% |
| $50,000 to $74,999 | 18 | 72.0% |
| $75,000 to $99,999 | 0 | 0.0% |
| $100,000 to $149,999 | 7 | 28.0% |
| $150,000 to $199,999 | 0 | 0.0% |
| $200,000+ | 0 | 0.0% |
Family Income by Famaliy Size in Sunbury
| Income Bracket | # Families | Median Income |
| 2-Person Families | 18 (72.0%) | $0 |
| 3-Person Families | 7 (28.0%) | $0 |
| 4-Person Families | 0 (0.0%) | $0 |
| 5-Person Families | 0 (0.0%) | $0 |
| 6-Person Families | 0 (0.0%) | $0 |
| 7+ Person Families | 0 (0.0%) | $0 |
| Total | 25 (100.0%) | $71,736 |
Family Income by Number of Earners in Sunbury
| Number of Earners | # Families | Median Income |
| No Earners | 0 (0.0%) | $0 |
| 1 Earner | 13 (52.0%) | $0 |
| 2 Earners | 12 (48.0%) | $0 |
| 3+ Earners | 0 (0.0%) | $0 |
| Total | 25 (100.0%) | $71,736 |
Household Income in Sunbury
Household Income Brackets in Sunbury
With 35 households falling in the category, the $50,000 to $74,999 income range is the most frequent in Sunbury, accounting for 44.3% of all households.
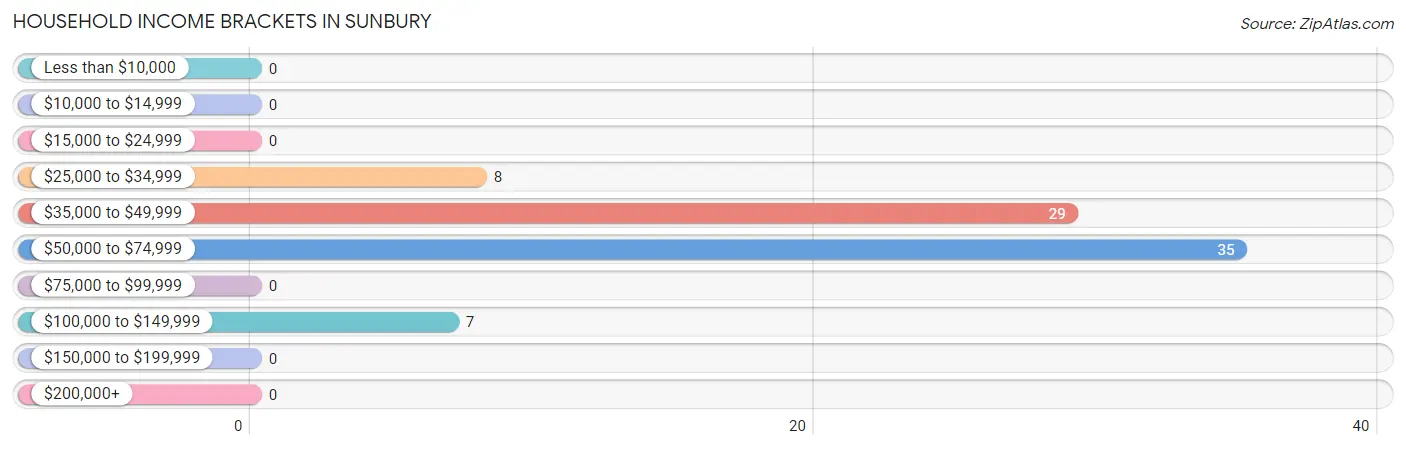
| Income Bracket | # Households | % Households |
| Less than $10,000 | 0 | 0.0% |
| $10,000 to $14,999 | 0 | 0.0% |
| $15,000 to $24,999 | 0 | 0.0% |
| $25,000 to $34,999 | 8 | 10.1% |
| $35,000 to $49,999 | 29 | 36.7% |
| $50,000 to $74,999 | 35 | 44.3% |
| $75,000 to $99,999 | 0 | 0.0% |
| $100,000 to $149,999 | 7 | 8.9% |
| $150,000 to $199,999 | 0 | 0.0% |
| $200,000+ | 0 | 0.0% |
Household Income by Householder Age in Sunbury
The median household income in Sunbury is $52,083, with the highest median household income of $71,435 found in the 25 to 44 years age bracket for the primary householder. A total of 37 households (46.8%) fall into this category.
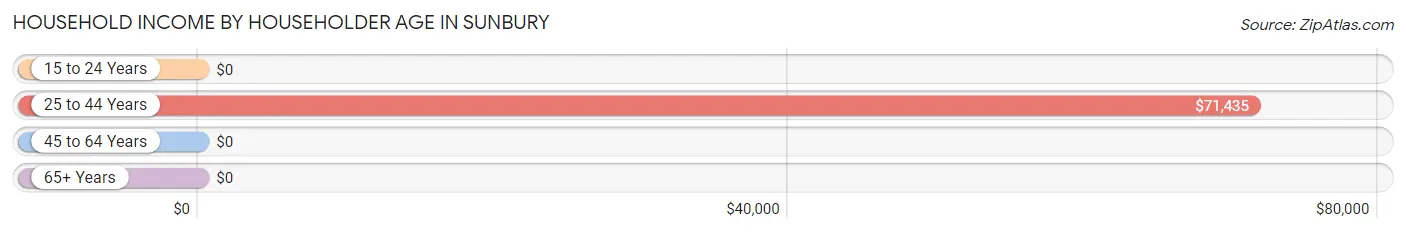
| Income Bracket | # Households | Median Income |
| 15 to 24 Years | 0 (0.0%) | $0 |
| 25 to 44 Years | 37 (46.8%) | $71,435 |
| 45 to 64 Years | 34 (43.0%) | $0 |
| 65+ Years | 8 (10.1%) | $0 |
| Total | 79 (100.0%) | $52,083 |
Poverty in Sunbury
Income Below Poverty by Sex and Age in Sunbury
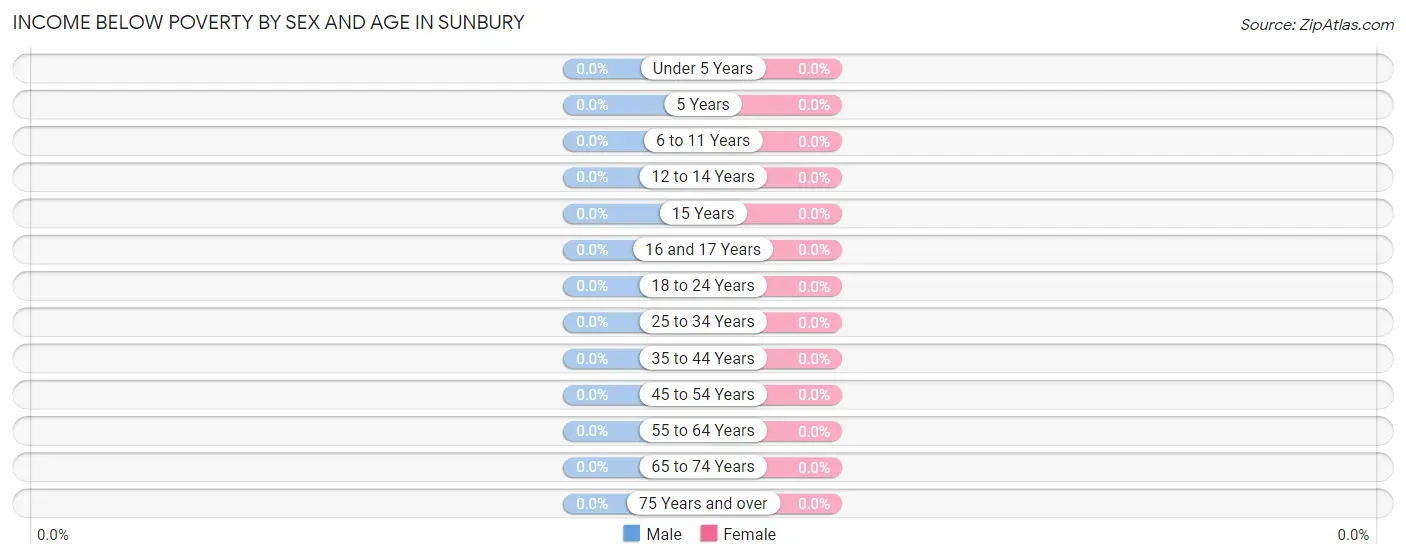
| Age Bracket | Male | Female |
| Under 5 Years | 0 (0.0%) | 0 (0.0%) |
| 5 Years | 0 (0.0%) | 0 (0.0%) |
| 6 to 11 Years | 0 (0.0%) | 0 (0.0%) |
| 12 to 14 Years | 0 (0.0%) | 0 (0.0%) |
| 15 Years | 0 (0.0%) | 0 (0.0%) |
| 16 and 17 Years | 0 (0.0%) | 0 (0.0%) |
| 18 to 24 Years | 0 (0.0%) | 0 (0.0%) |
| 25 to 34 Years | 0 (0.0%) | 0 (0.0%) |
| 35 to 44 Years | 0 (0.0%) | 0 (0.0%) |
| 45 to 54 Years | 0 (0.0%) | 0 (0.0%) |
| 55 to 64 Years | 0 (0.0%) | 0 (0.0%) |
| 65 to 74 Years | 0 (0.0%) | 0 (0.0%) |
| 75 Years and over | 0 (0.0%) | 0 (0.0%) |
| Total | 0 (0.0%) | 0 (0.0%) |
Income Above Poverty by Sex and Age in Sunbury
According to the poverty statistics in Sunbury, males aged 25 to 34 years and females aged under 5 years are the age groups that are most secure financially, with 100.0% of males and 100.0% of females in these age groups living above the poverty line.
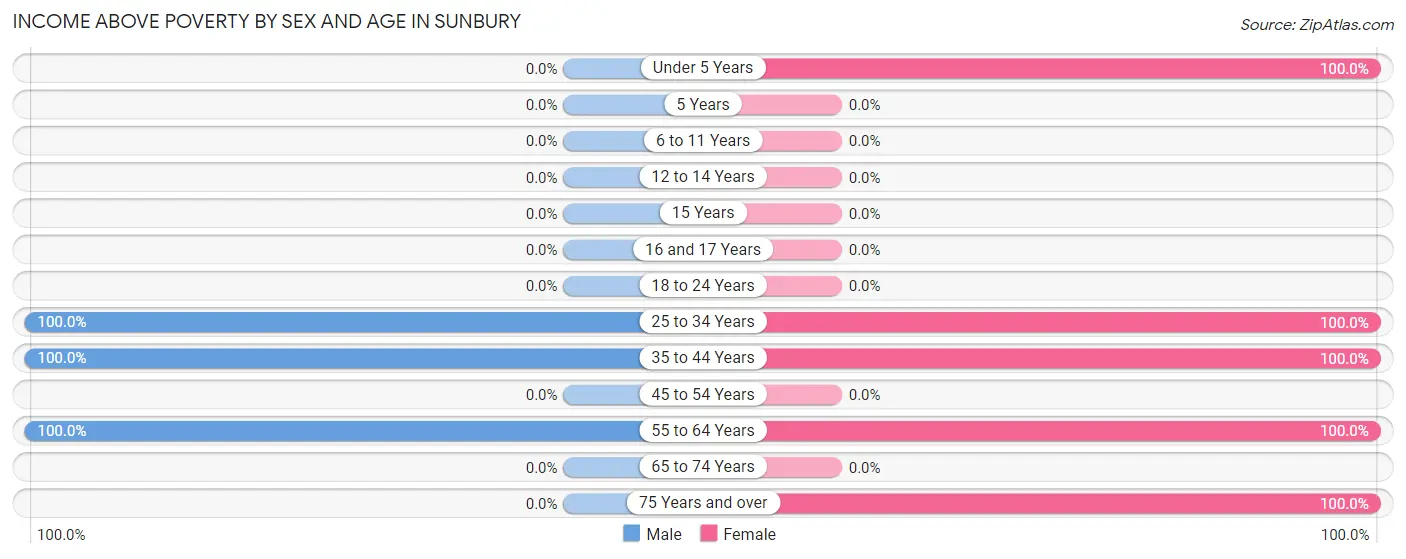
| Age Bracket | Male | Female |
| Under 5 Years | 0 (0.0%) | 20 (100.0%) |
| 5 Years | 0 (0.0%) | 0 (0.0%) |
| 6 to 11 Years | 0 (0.0%) | 0 (0.0%) |
| 12 to 14 Years | 0 (0.0%) | 0 (0.0%) |
| 15 Years | 0 (0.0%) | 0 (0.0%) |
| 16 and 17 Years | 0 (0.0%) | 0 (0.0%) |
| 18 to 24 Years | 0 (0.0%) | 0 (0.0%) |
| 25 to 34 Years | 13 (100.0%) | 22 (100.0%) |
| 35 to 44 Years | 7 (100.0%) | 3 (100.0%) |
| 45 to 54 Years | 0 (0.0%) | 0 (0.0%) |
| 55 to 64 Years | 5 (100.0%) | 43 (100.0%) |
| 65 to 74 Years | 0 (0.0%) | 0 (0.0%) |
| 75 Years and over | 0 (0.0%) | 8 (100.0%) |
| Total | 25 (100.0%) | 96 (100.0%) |
Income Below Poverty Among Married-Couple Families in Sunbury
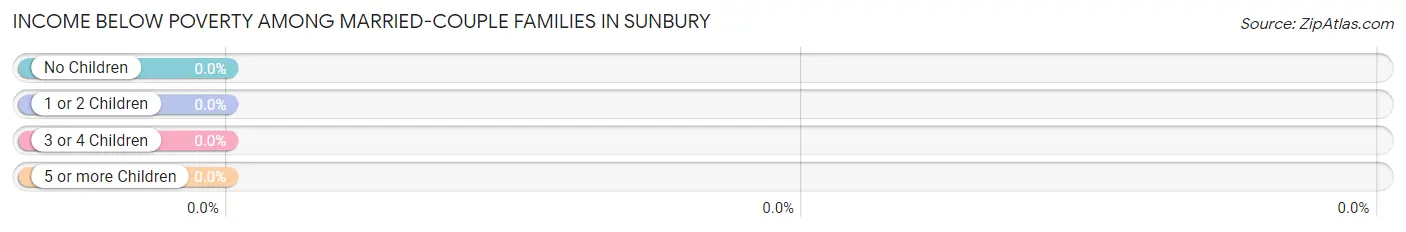
| Children | Above Poverty | Below Poverty |
| No Children | 5 (100.0%) | 0 (0.0%) |
| 1 or 2 Children | 7 (100.0%) | 0 (0.0%) |
| 3 or 4 Children | 0 (0.0%) | 0 (0.0%) |
| 5 or more Children | 0 (0.0%) | 0 (0.0%) |
| Total | 12 (100.0%) | 0 (0.0%) |
Income Below Poverty Among Single-Parent Households in Sunbury
| Children | Single Father | Single Mother |
| No Children | 0 (0.0%) | 0 (0.0%) |
| 1 or 2 Children | 0 (0.0%) | 0 (0.0%) |
| 3 or 4 Children | 0 (0.0%) | 0 (0.0%) |
| 5 or more Children | 0 (0.0%) | 0 (0.0%) |
| Total | 0 (0.0%) | 0 (0.0%) |
Income Below Poverty Among Married-Couple vs Single-Parent Households in Sunbury
| Children | Married-Couple Families | Single-Parent Households |
| No Children | 0 (0.0%) | 0 (0.0%) |
| 1 or 2 Children | 0 (0.0%) | 0 (0.0%) |
| 3 or 4 Children | 0 (0.0%) | 0 (0.0%) |
| 5 or more Children | 0 (0.0%) | 0 (0.0%) |
| Total | 0 (0.0%) | 0 (0.0%) |
Race in Sunbury
The most populous races in Sunbury are , and White / Caucasian (121 | 100.0%).
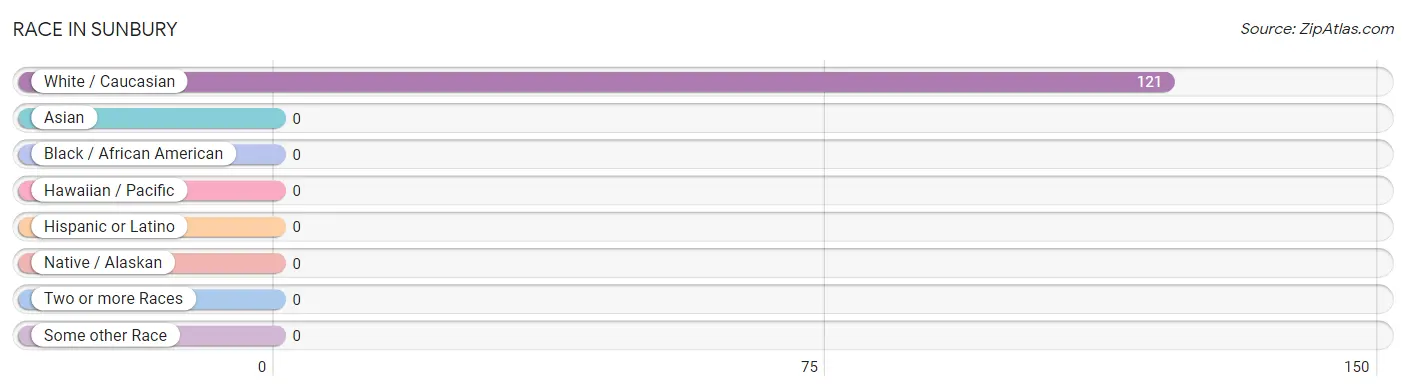
| Race | # Population | % Population |
| Asian | 0 | 0.0% |
| Black / African American | 0 | 0.0% |
| Hawaiian / Pacific | 0 | 0.0% |
| Hispanic or Latino | 0 | 0.0% |
| Native / Alaskan | 0 | 0.0% |
| White / Caucasian | 121 | 100.0% |
| Two or more Races | 0 | 0.0% |
| Some other Race | 0 | 0.0% |
| Total | 121 | 100.0% |
Ancestry in Sunbury
The most populous ancestries reported in Sunbury are American (48 | 39.7%), German (22 | 18.2%), English (17 | 14.1%), and Irish (8 | 6.6%), together accounting for 78.5% of all Sunbury residents.
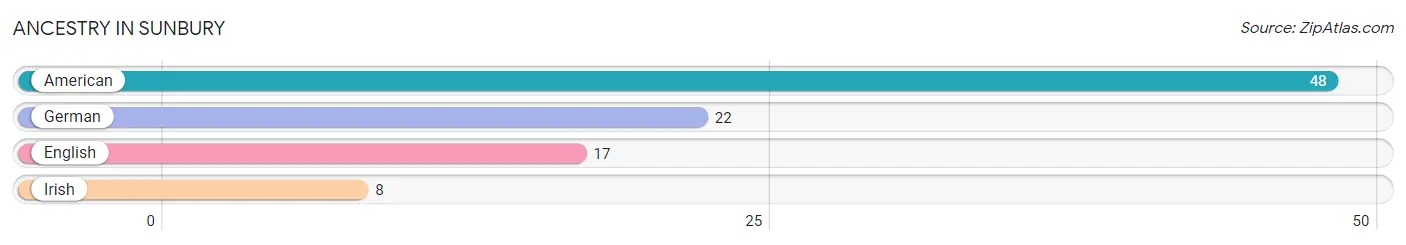
| Ancestry | # Population | % Population |
| American | 48 | 39.7% |
| English | 17 | 14.1% |
| German | 22 | 18.2% |
| Irish | 8 | 6.6% | View All 4 Rows |
Immigrants in Sunbury

| Immigration Origin | # Population | % Population | View All 0 Rows |
Sex and Age in Sunbury
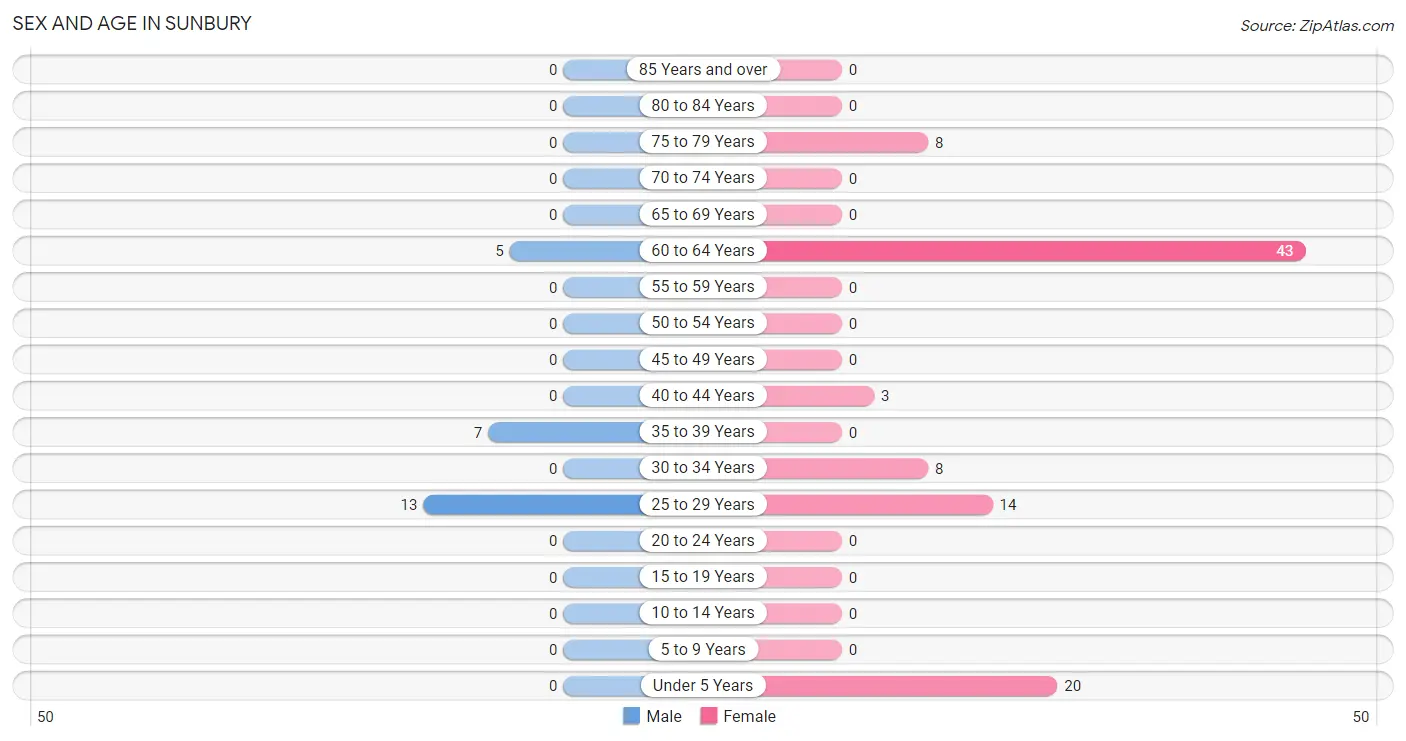
Sex and Age in Sunbury
The most populous age groups in Sunbury are 25 to 29 Years (13 | 52.0%) for men and 60 to 64 Years (43 | 44.8%) for women.
| Age Bracket | Male | Female |
| Under 5 Years | 0 (0.0%) | 20 (20.8%) |
| 5 to 9 Years | 0 (0.0%) | 0 (0.0%) |
| 10 to 14 Years | 0 (0.0%) | 0 (0.0%) |
| 15 to 19 Years | 0 (0.0%) | 0 (0.0%) |
| 20 to 24 Years | 0 (0.0%) | 0 (0.0%) |
| 25 to 29 Years | 13 (52.0%) | 14 (14.6%) |
| 30 to 34 Years | 0 (0.0%) | 8 (8.3%) |
| 35 to 39 Years | 7 (28.0%) | 0 (0.0%) |
| 40 to 44 Years | 0 (0.0%) | 3 (3.1%) |
| 45 to 49 Years | 0 (0.0%) | 0 (0.0%) |
| 50 to 54 Years | 0 (0.0%) | 0 (0.0%) |
| 55 to 59 Years | 0 (0.0%) | 0 (0.0%) |
| 60 to 64 Years | 5 (20.0%) | 43 (44.8%) |
| 65 to 69 Years | 0 (0.0%) | 0 (0.0%) |
| 70 to 74 Years | 0 (0.0%) | 0 (0.0%) |
| 75 to 79 Years | 0 (0.0%) | 8 (8.3%) |
| 80 to 84 Years | 0 (0.0%) | 0 (0.0%) |
| 85 Years and over | 0 (0.0%) | 0 (0.0%) |
| Total | 25 (100.0%) | 96 (100.0%) |
Families and Households in Sunbury
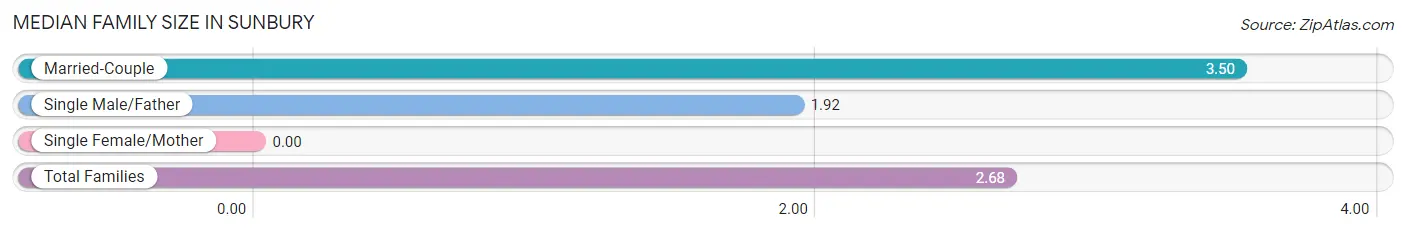
Median Family Size in Sunbury
| Family Type | # Families | Family Size |
| Married-Couple | 12 (48.0%) | 3.50 |
| Single Male/Father | 13 (52.0%) | 1.92 |
| Single Female/Mother | 0 (0.0%) | - |
| Total Families | 25 (100.0%) | 2.68 |
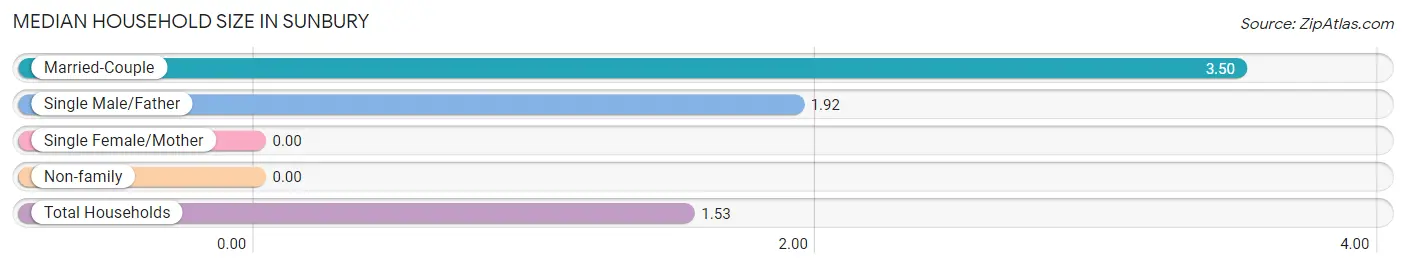
Median Household Size in Sunbury
| Household Type | # Households | Household Size |
| Married-Couple | 12 (15.2%) | 3.50 |
| Single Male/Father | 13 (16.5%) | 1.92 |
| Single Female/Mother | 0 (0.0%) | - |
| Non-family | 54 (68.3%) | - |
| Total Households | 79 (100.0%) | 1.53 |
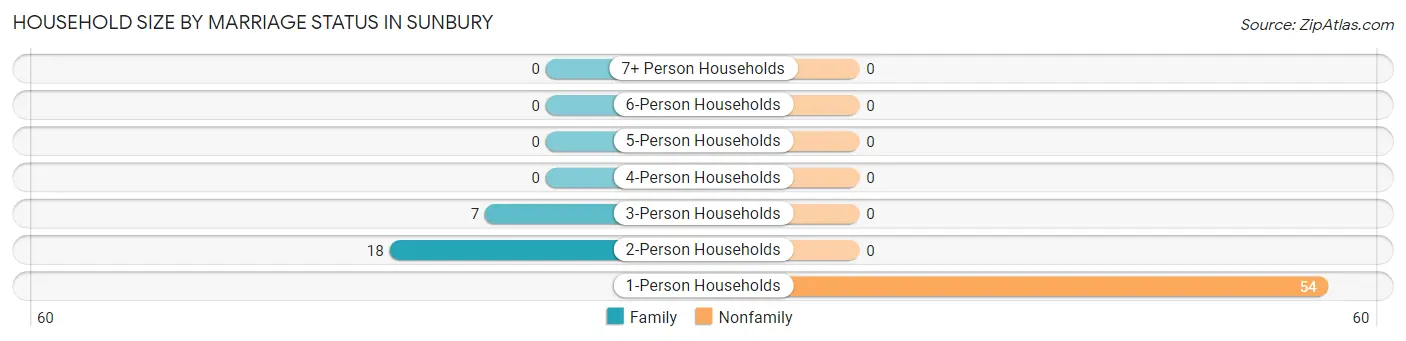
Household Size by Marriage Status in Sunbury
Out of a total of 79 households in Sunbury, 25 (31.7%) are family households, while 54 (68.3%) are nonfamily households. The most numerous type of family households are 2-person households, comprising 18, and the most common type of nonfamily households are 1-person households, comprising 54.
| Household Size | Family Households | Nonfamily Households |
| 1-Person Households | - | 54 (68.3%) |
| 2-Person Households | 18 (22.8%) | 0 (0.0%) |
| 3-Person Households | 7 (8.9%) | 0 (0.0%) |
| 4-Person Households | 0 (0.0%) | 0 (0.0%) |
| 5-Person Households | 0 (0.0%) | 0 (0.0%) |
| 6-Person Households | 0 (0.0%) | 0 (0.0%) |
| 7+ Person Households | 0 (0.0%) | 0 (0.0%) |
| Total | 25 (31.7%) | 54 (68.3%) |
Female Fertility in Sunbury
Fertility by Age in Sunbury
| Age Bracket | Women with Births | Births / 1,000 Women |
| 15 to 19 years | 0 (0.0%) | 0.0 |
| 20 to 34 years | 0 (0.0%) | 0.0 |
| 35 to 50 years | 0 (0.0%) | 0.0 |
| Total | 0 (0.0%) | 0.0 |
Fertility by Age by Marriage Status in Sunbury
| Age Bracket | Married | Unmarried |
| 15 to 19 years | 0 (0.0%) | 0 (0.0%) |
| 20 to 34 years | 0 (0.0%) | 0 (0.0%) |
| 35 to 50 years | 0 (0.0%) | 0 (0.0%) |
| Total | 0 (0.0%) | 0 (0.0%) |
Fertility by Education in Sunbury
| Educational Attainment | Women with Births | Births / 1,000 Women |
| Less than High School | 0 (0.0%) | 0.0 |
| High School Diploma | 0 (0.0%) | 0.0 |
| College or Associate's Degree | 0 (0.0%) | 0.0 |
| Bachelor's Degree | 0 (0.0%) | 0.0 |
| Graduate Degree | 0 (0.0%) | 0.0 |
| Total | 0 (0.0%) | 0.0 |
Fertility by Education by Marriage Status in Sunbury
| Educational Attainment | Married | Unmarried |
| Less than High School | 0 (0.0%) | 0 (0.0%) |
| High School Diploma | 0 (0.0%) | 0 (0.0%) |
| College or Associate's Degree | 0 (0.0%) | 0 (0.0%) |
| Bachelor's Degree | 0 (0.0%) | 0 (0.0%) |
| Graduate Degree | 0 (0.0%) | 0 (0.0%) |
| Total | 0 (0.0%) | 0 (0.0%) |
Employment Characteristics in Sunbury
Employment by Class of Employer in Sunbury
Among the 93 employed individuals in Sunbury, private company employees (90 | 96.8%), and state government employees (3 | 3.2%) make up the most common classes of employment.
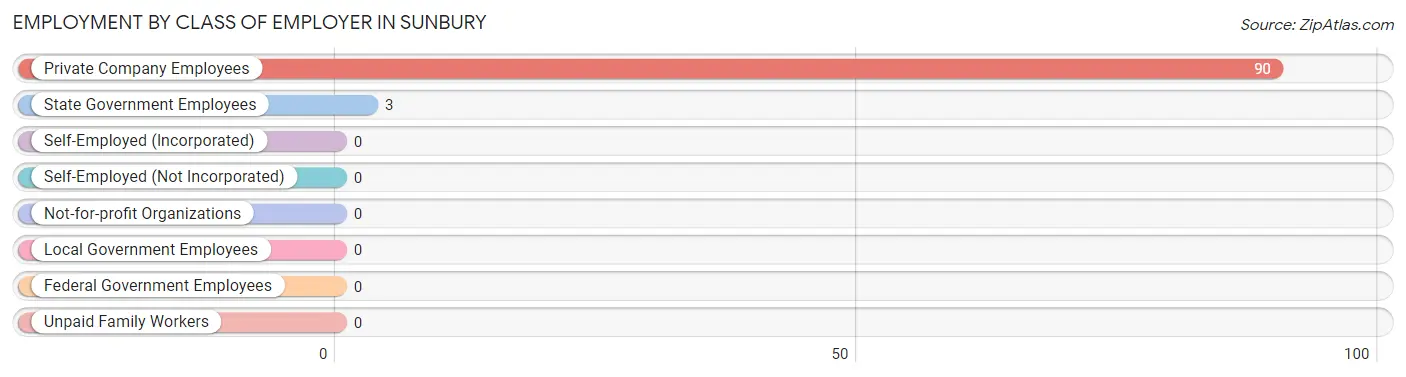
| Employer Class | # Employees | % Employees |
| Private Company Employees | 90 | 96.8% |
| Self-Employed (Incorporated) | 0 | 0.0% |
| Self-Employed (Not Incorporated) | 0 | 0.0% |
| Not-for-profit Organizations | 0 | 0.0% |
| Local Government Employees | 0 | 0.0% |
| State Government Employees | 3 | 3.2% |
| Federal Government Employees | 0 | 0.0% |
| Unpaid Family Workers | 0 | 0.0% |
| Total | 93 | 100.0% |
Employment Status by Age in Sunbury
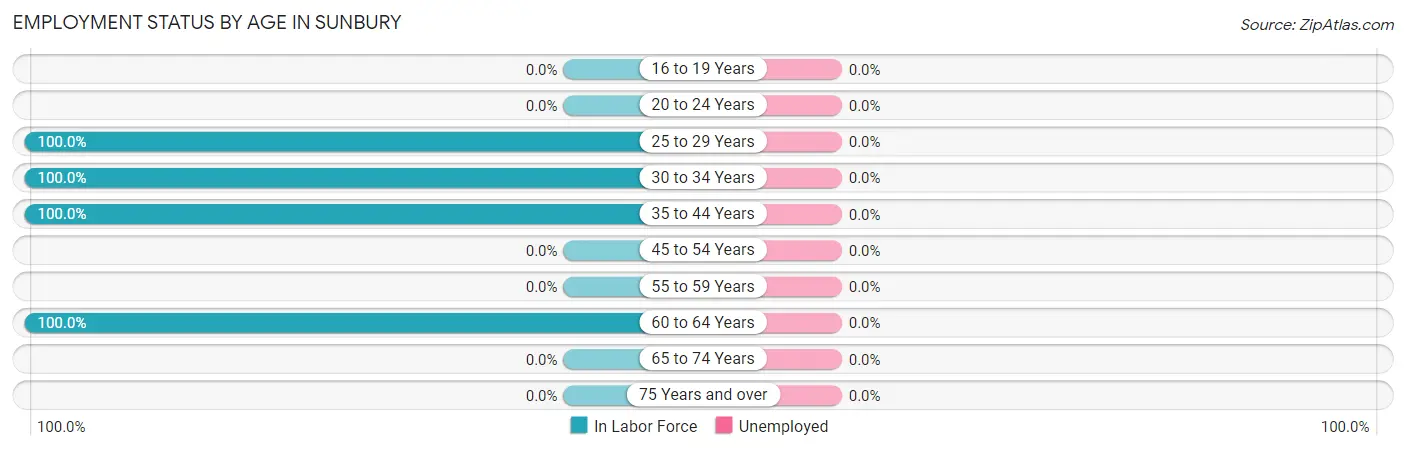
| Age Bracket | In Labor Force | Unemployed |
| 16 to 19 Years | 0 (0.0%) | 0 (0.0%) |
| 20 to 24 Years | 0 (0.0%) | 0 (0.0%) |
| 25 to 29 Years | 27 (100.0%) | 0 (0.0%) |
| 30 to 34 Years | 8 (100.0%) | 0 (0.0%) |
| 35 to 44 Years | 10 (100.0%) | 0 (0.0%) |
| 45 to 54 Years | 0 (0.0%) | 0 (0.0%) |
| 55 to 59 Years | 0 (0.0%) | 0 (0.0%) |
| 60 to 64 Years | 48 (100.0%) | 0 (0.0%) |
| 65 to 74 Years | 0 (0.0%) | 0 (0.0%) |
| 75 Years and over | 0 (0.0%) | 0 (0.0%) |
| Total | 93 (92.1%) | 0 (0.0%) |
Employment Status by Educational Attainment in Sunbury
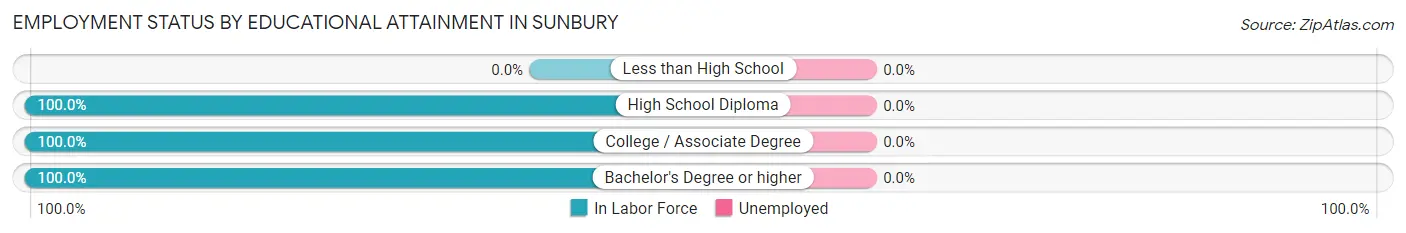
| Educational Attainment | In Labor Force | Unemployed |
| Less than High School | 0 (0.0%) | 0 (0.0%) |
| High School Diploma | 32 (100.0%) | 0 (0.0%) |
| College / Associate Degree | 44 (100.0%) | 0 (0.0%) |
| Bachelor's Degree or higher | 17 (100.0%) | 0 (0.0%) |
| Total | 93 (100.0%) | 0 (0.0%) |
Employment Occupations by Sex in Sunbury
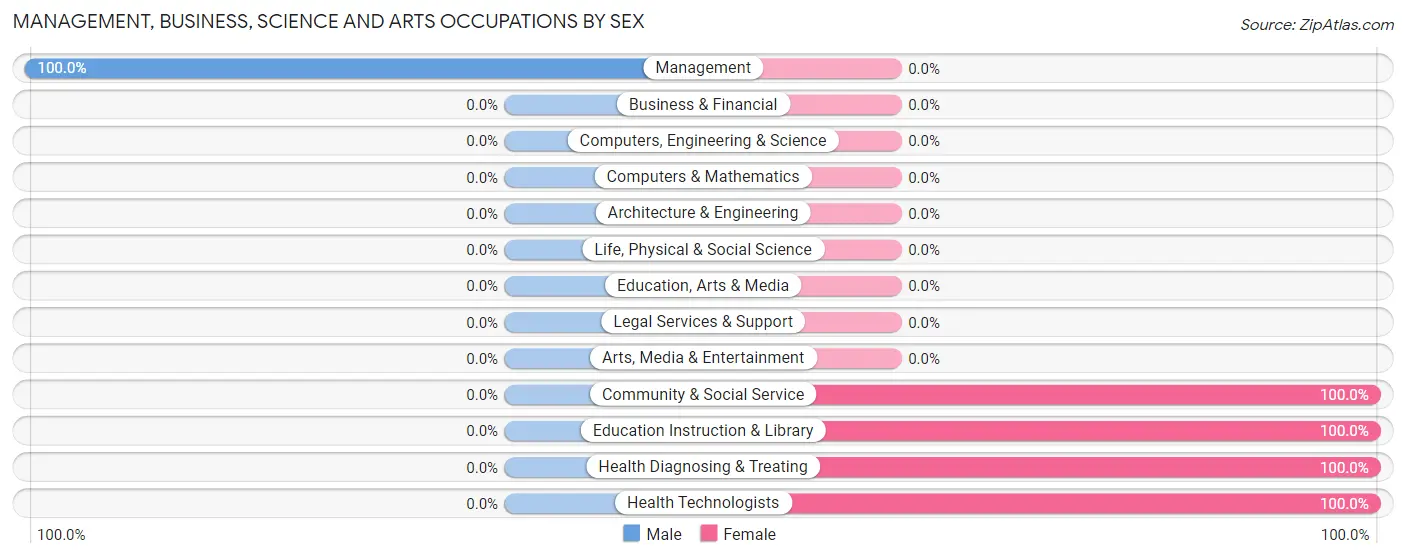
Management, Business, Science and Arts Occupations
The most common Management, Business, Science and Arts occupations in Sunbury are Community & Social Service (29 | 31.2%), Education Instruction & Library (29 | 31.2%), Health Diagnosing & Treating (14 | 15.0%), Health Technologists (14 | 15.0%), and Management (5 | 5.4%).
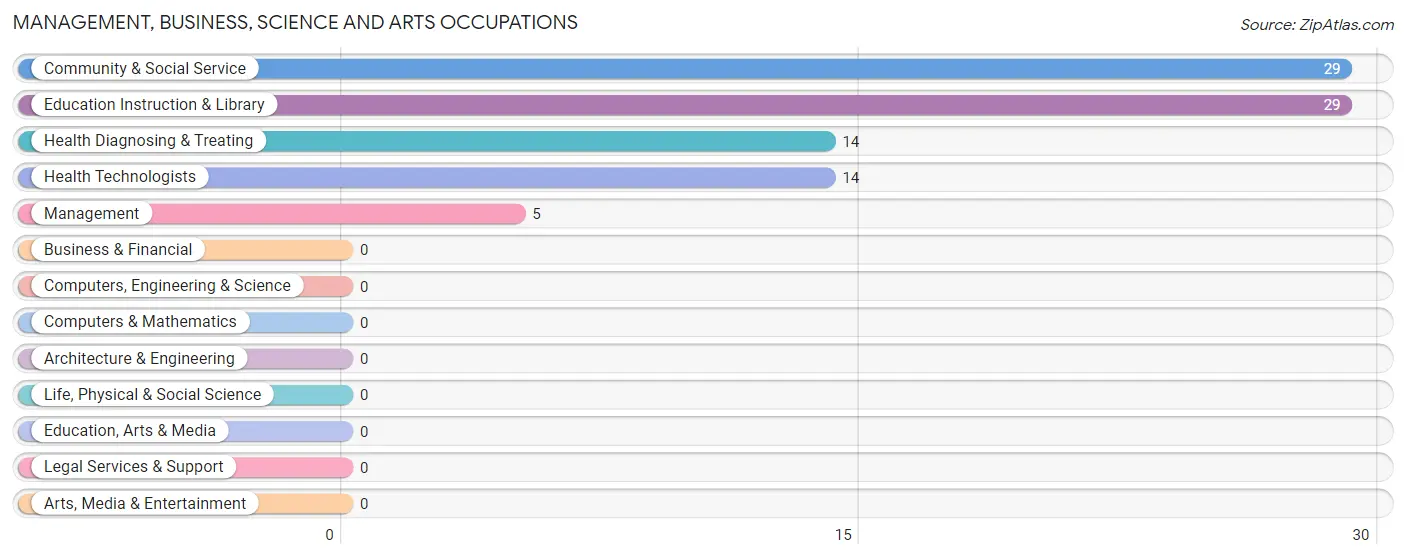
Management, Business, Science and Arts Occupations by Sex
| Occupation | Male | Female |
| Management | 5 (100.0%) | 0 (0.0%) |
| Business & Financial | 0 (0.0%) | 0 (0.0%) |
| Computers, Engineering & Science | 0 (0.0%) | 0 (0.0%) |
| Computers & Mathematics | 0 (0.0%) | 0 (0.0%) |
| Architecture & Engineering | 0 (0.0%) | 0 (0.0%) |
| Life, Physical & Social Science | 0 (0.0%) | 0 (0.0%) |
| Community & Social Service | 0 (0.0%) | 29 (100.0%) |
| Education, Arts & Media | 0 (0.0%) | 0 (0.0%) |
| Legal Services & Support | 0 (0.0%) | 0 (0.0%) |
| Education Instruction & Library | 0 (0.0%) | 29 (100.0%) |
| Arts, Media & Entertainment | 0 (0.0%) | 0 (0.0%) |
| Health Diagnosing & Treating | 0 (0.0%) | 14 (100.0%) |
| Health Technologists | 0 (0.0%) | 14 (100.0%) |
| Total (Category) | 5 (10.4%) | 43 (89.6%) |
| Total (Overall) | 25 (26.9%) | 68 (73.1%) |
Services Occupations
Services Occupations by Sex
| Occupation | Male | Female |
| Healthcare Support | 0 (0.0%) | 0 (0.0%) |
| Security & Protection | 0 (0.0%) | 0 (0.0%) |
| Firefighting & Prevention | 0 (0.0%) | 0 (0.0%) |
| Law Enforcement | 0 (0.0%) | 0 (0.0%) |
| Food Preparation & Serving | 0 (0.0%) | 0 (0.0%) |
| Cleaning & Maintenance | 0 (0.0%) | 0 (0.0%) |
| Personal Care & Service | 0 (0.0%) | 0 (0.0%) |
| Total (Category) | 0 (0.0%) | 0 (0.0%) |
| Total (Overall) | 25 (26.9%) | 68 (73.1%) |
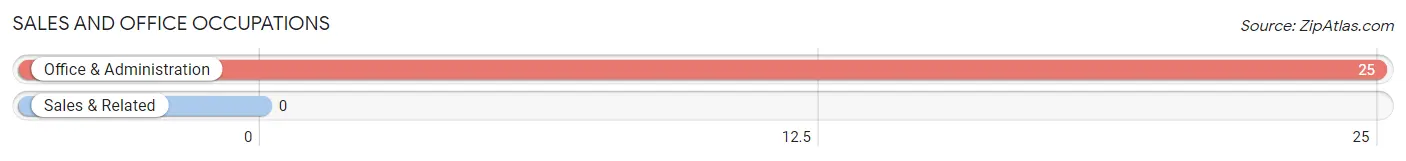
Sales and Office Occupations
The most common Sales and Office occupations in Sunbury are , and Office & Administration (25 | 26.9%).
Sales and Office Occupations by Sex
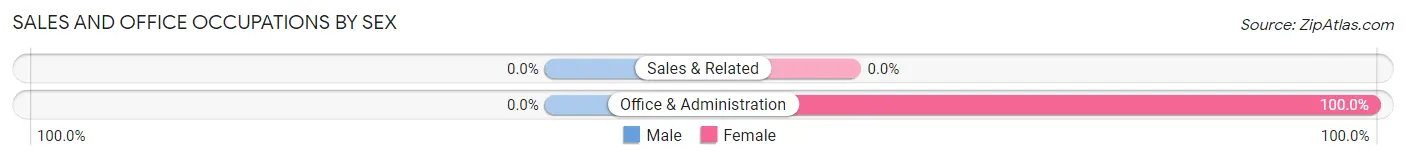
| Occupation | Male | Female |
| Sales & Related | 0 (0.0%) | 0 (0.0%) |
| Office & Administration | 0 (0.0%) | 25 (100.0%) |
| Total (Category) | 0 (0.0%) | 25 (100.0%) |
| Total (Overall) | 25 (26.9%) | 68 (73.1%) |
Natural Resources, Construction and Maintenance Occupations
The most common Natural Resources, Construction and Maintenance occupations in Sunbury are , and Installation, Maintenance & Repair (13 | 14.0%).
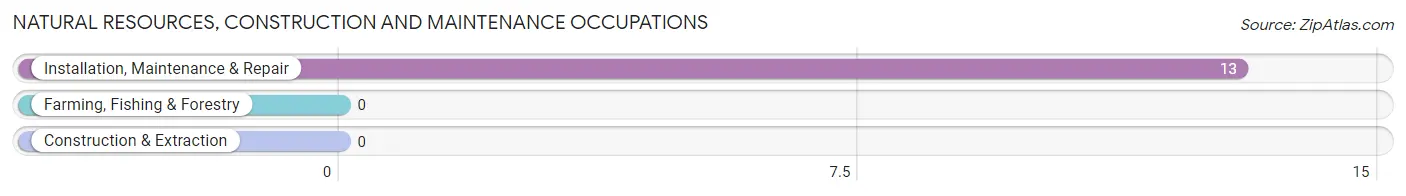
Natural Resources, Construction and Maintenance Occupations by Sex
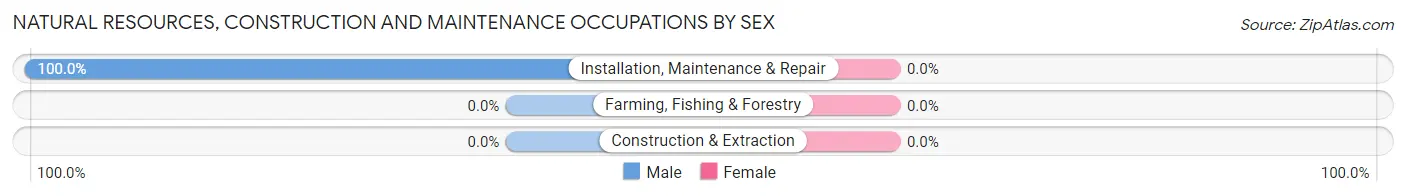
| Occupation | Male | Female |
| Farming, Fishing & Forestry | 0 (0.0%) | 0 (0.0%) |
| Construction & Extraction | 0 (0.0%) | 0 (0.0%) |
| Installation, Maintenance & Repair | 13 (100.0%) | 0 (0.0%) |
| Total (Category) | 13 (100.0%) | 0 (0.0%) |
| Total (Overall) | 25 (26.9%) | 68 (73.1%) |
Production, Transportation and Moving Occupations
The most common Production, Transportation and Moving occupations in Sunbury are , and Transportation (7 | 7.5%).
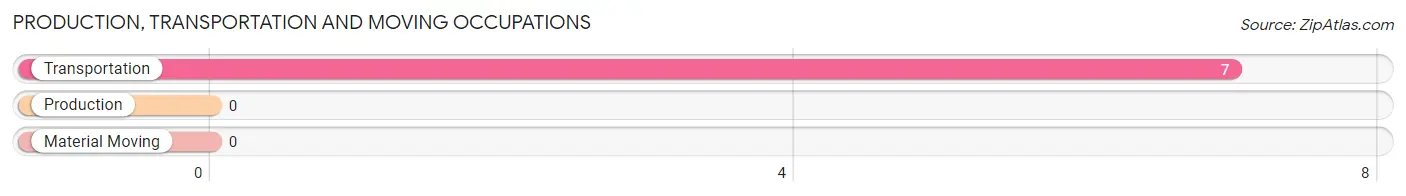
Production, Transportation and Moving Occupations by Sex
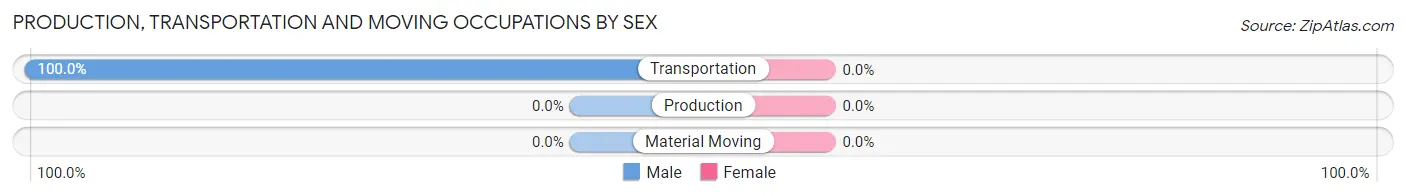
| Occupation | Male | Female |
| Production | 0 (0.0%) | 0 (0.0%) |
| Transportation | 7 (100.0%) | 0 (0.0%) |
| Material Moving | 0 (0.0%) | 0 (0.0%) |
| Total (Category) | 7 (100.0%) | 0 (0.0%) |
| Total (Overall) | 25 (26.9%) | 68 (73.1%) |
Employment Industries by Sex in Sunbury
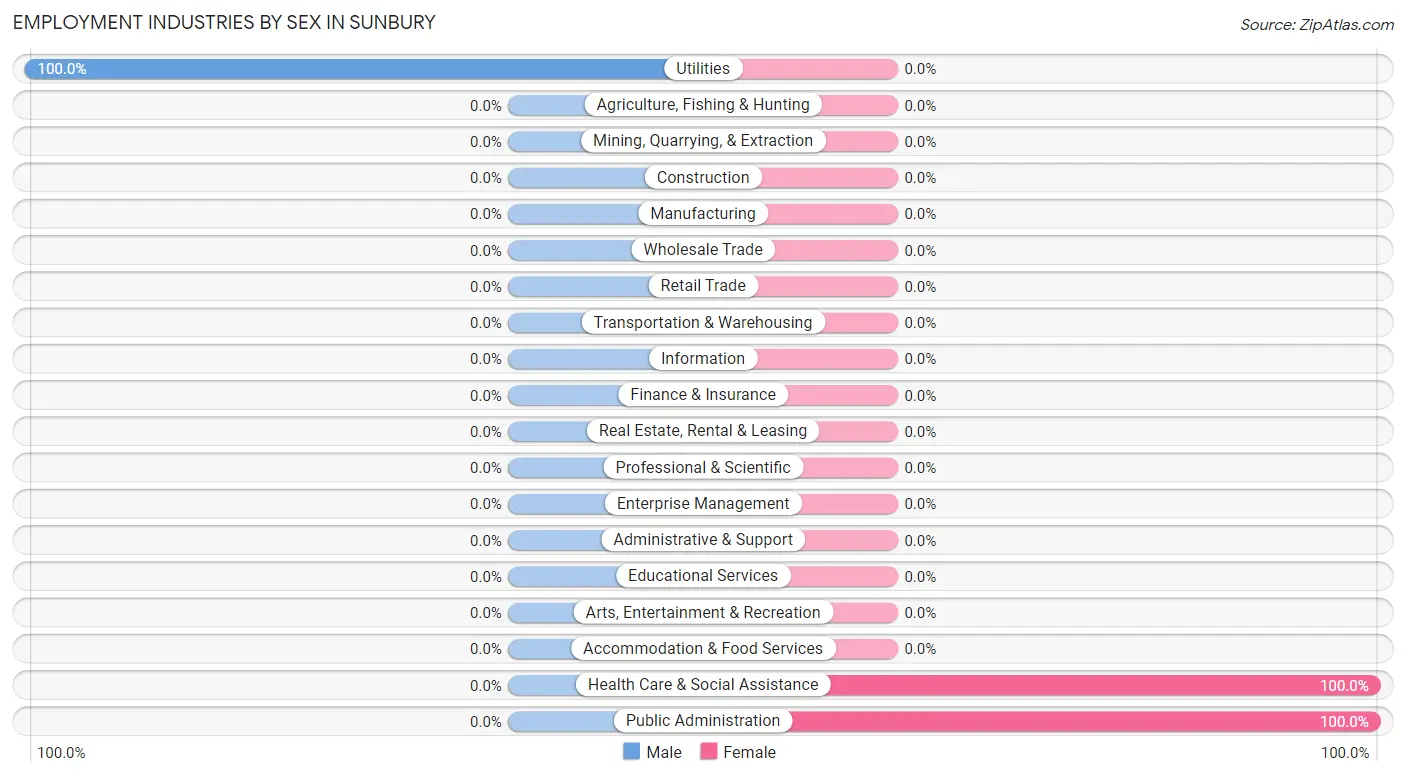
Employment Industries in Sunbury
The major employment industries in Sunbury include Health Care & Social Assistance (51 | 54.8%), Utilities (13 | 14.0%), and Public Administration (3 | 3.2%).
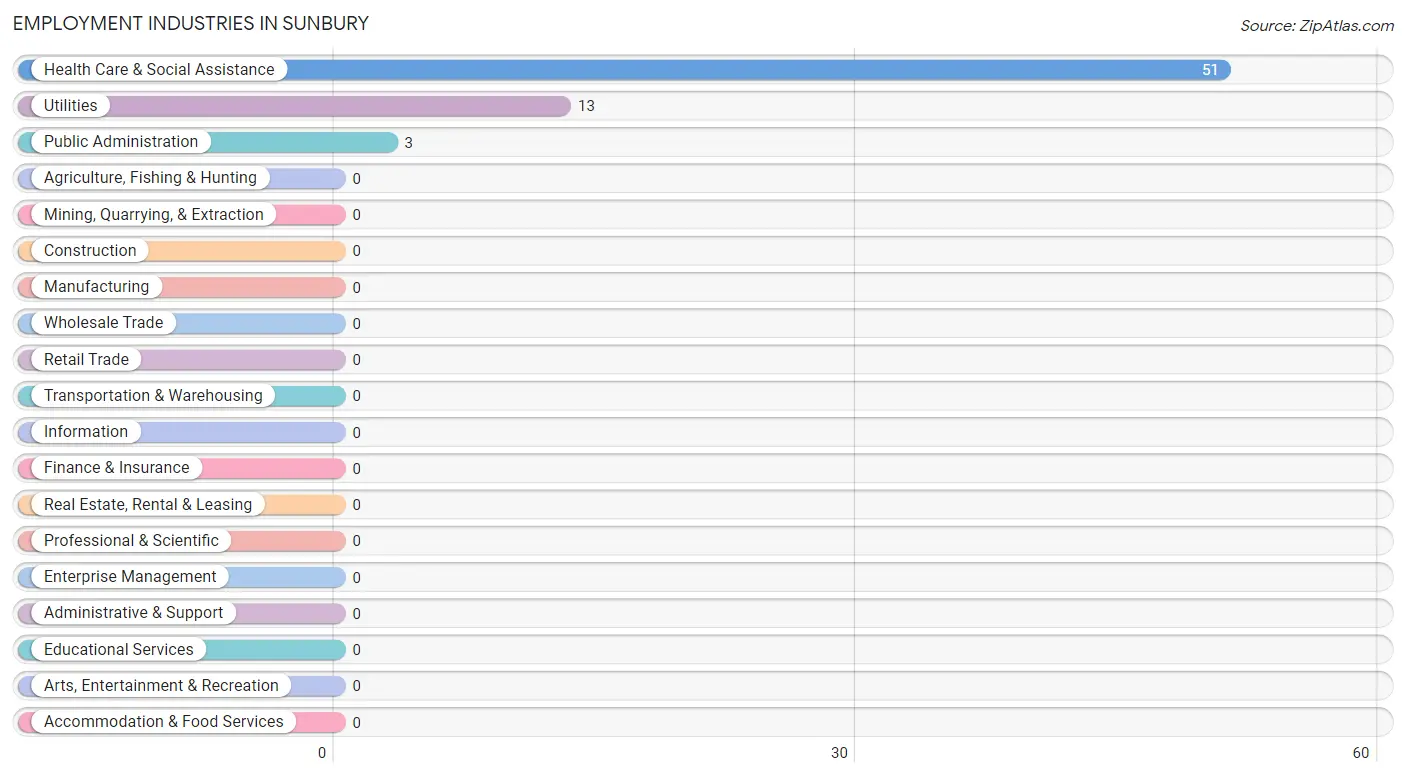
Employment Industries by Sex in Sunbury
| Industry | Male | Female |
| Agriculture, Fishing & Hunting | 0 (0.0%) | 0 (0.0%) |
| Mining, Quarrying, & Extraction | 0 (0.0%) | 0 (0.0%) |
| Construction | 0 (0.0%) | 0 (0.0%) |
| Manufacturing | 0 (0.0%) | 0 (0.0%) |
| Wholesale Trade | 0 (0.0%) | 0 (0.0%) |
| Retail Trade | 0 (0.0%) | 0 (0.0%) |
| Transportation & Warehousing | 0 (0.0%) | 0 (0.0%) |
| Utilities | 13 (100.0%) | 0 (0.0%) |
| Information | 0 (0.0%) | 0 (0.0%) |
| Finance & Insurance | 0 (0.0%) | 0 (0.0%) |
| Real Estate, Rental & Leasing | 0 (0.0%) | 0 (0.0%) |
| Professional & Scientific | 0 (0.0%) | 0 (0.0%) |
| Enterprise Management | 0 (0.0%) | 0 (0.0%) |
| Administrative & Support | 0 (0.0%) | 0 (0.0%) |
| Educational Services | 0 (0.0%) | 0 (0.0%) |
| Health Care & Social Assistance | 0 (0.0%) | 51 (100.0%) |
| Arts, Entertainment & Recreation | 0 (0.0%) | 0 (0.0%) |
| Accommodation & Food Services | 0 (0.0%) | 0 (0.0%) |
| Public Administration | 0 (0.0%) | 3 (100.0%) |
| Total | 25 (26.9%) | 68 (73.1%) |
Education in Sunbury
School Enrollment in Sunbury
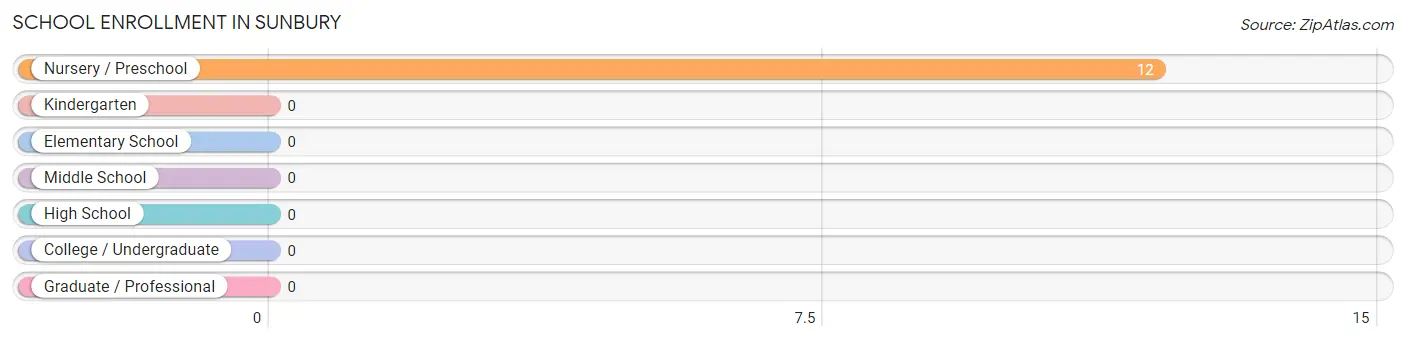
| School Level | # Students | % Students |
| Nursery / Preschool | 12 | 100.0% |
| Kindergarten | 0 | 0.0% |
| Elementary School | 0 | 0.0% |
| Middle School | 0 | 0.0% |
| High School | 0 | 0.0% |
| College / Undergraduate | 0 | 0.0% |
| Graduate / Professional | 0 | 0.0% |
| Total | 12 | 100.0% |
School Enrollment by Age by Funding Source in Sunbury
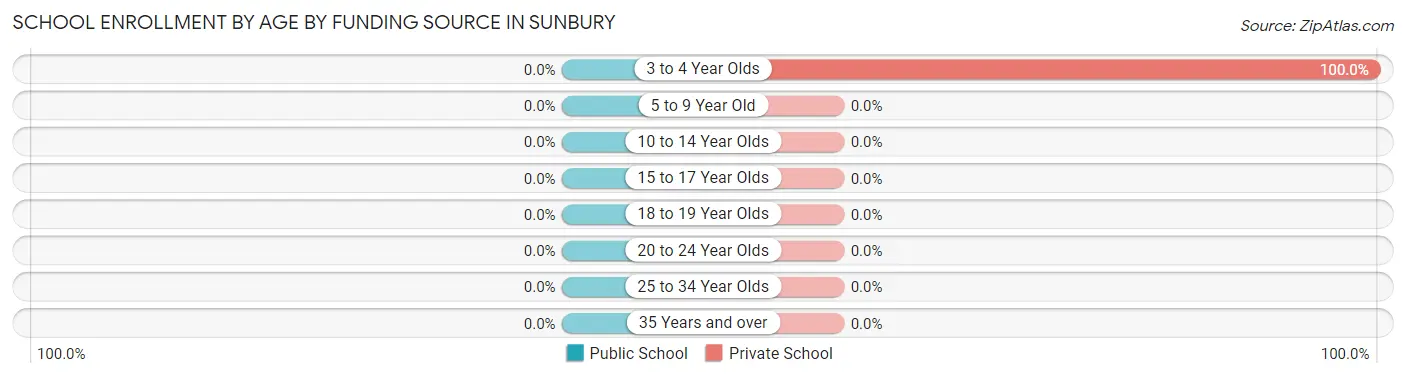
| Age Bracket | Public School | Private School |
| 3 to 4 Year Olds | 0 (0.0%) | 12 (100.0%) |
| 5 to 9 Year Old | 0 (0.0%) | 0 (0.0%) |
| 10 to 14 Year Olds | 0 (0.0%) | 0 (0.0%) |
| 15 to 17 Year Olds | 0 (0.0%) | 0 (0.0%) |
| 18 to 19 Year Olds | 0 (0.0%) | 0 (0.0%) |
| 20 to 24 Year Olds | 0 (0.0%) | 0 (0.0%) |
| 25 to 34 Year Olds | 0 (0.0%) | 0 (0.0%) |
| 35 Years and over | 0 (0.0%) | 0 (0.0%) |
| Total | 0 (0.0%) | 12 (100.0%) |
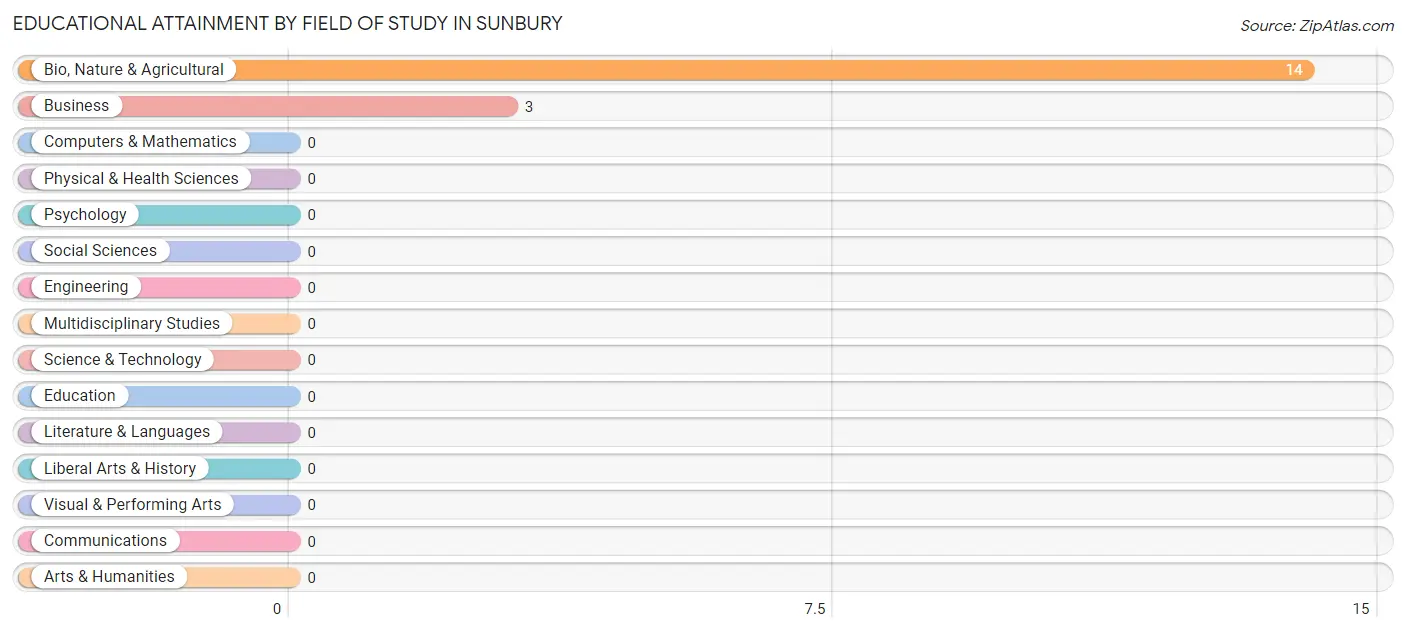
Educational Attainment by Field of Study in Sunbury
Bio, nature & agricultural (14 | 82.4%), and business (3 | 17.6%) are the most common fields of study among 17 individuals in Sunbury who have obtained a bachelor's degree or higher.
| Field of Study | # Graduates | % Graduates |
| Computers & Mathematics | 0 | 0.0% |
| Bio, Nature & Agricultural | 14 | 82.4% |
| Physical & Health Sciences | 0 | 0.0% |
| Psychology | 0 | 0.0% |
| Social Sciences | 0 | 0.0% |
| Engineering | 0 | 0.0% |
| Multidisciplinary Studies | 0 | 0.0% |
| Science & Technology | 0 | 0.0% |
| Business | 3 | 17.6% |
| Education | 0 | 0.0% |
| Literature & Languages | 0 | 0.0% |
| Liberal Arts & History | 0 | 0.0% |
| Visual & Performing Arts | 0 | 0.0% |
| Communications | 0 | 0.0% |
| Arts & Humanities | 0 | 0.0% |
| Total | 17 | 100.0% |
Transportation & Commute in Sunbury
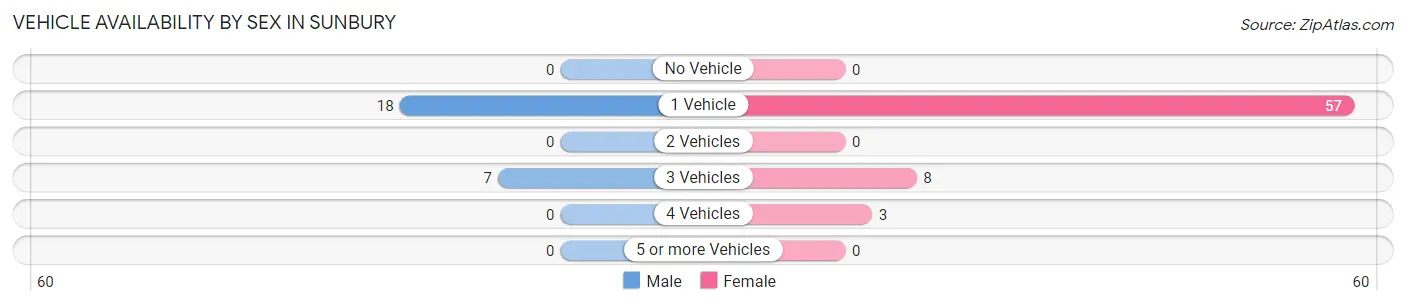
Vehicle Availability by Sex in Sunbury
The most prevalent vehicle ownership categories in Sunbury are males with 1 vehicle (18, accounting for 72.0%) and females with 1 vehicle (57, making up 26.5%).
| Vehicles Available | Male | Female |
| No Vehicle | 0 (0.0%) | 0 (0.0%) |
| 1 Vehicle | 18 (72.0%) | 57 (83.8%) |
| 2 Vehicles | 0 (0.0%) | 0 (0.0%) |
| 3 Vehicles | 7 (28.0%) | 8 (11.8%) |
| 4 Vehicles | 0 (0.0%) | 3 (4.4%) |
| 5 or more Vehicles | 0 (0.0%) | 0 (0.0%) |
| Total | 25 (100.0%) | 68 (100.0%) |
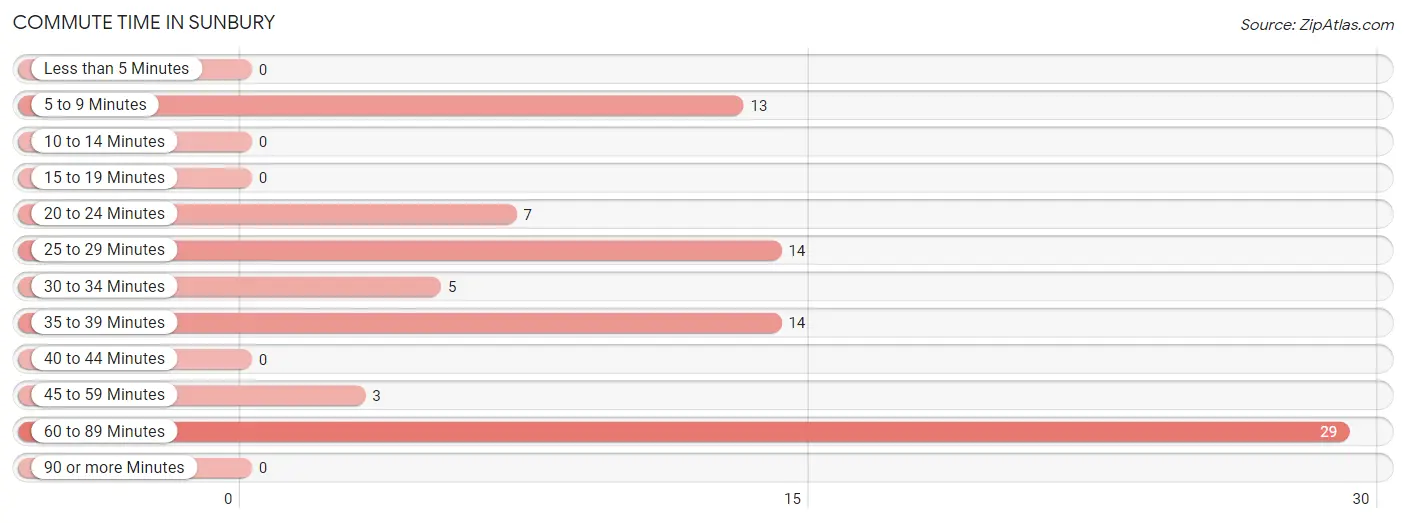
Commute Time in Sunbury
The most frequently occuring commute durations in Sunbury are 60 to 89 minutes (29 commuters, 34.1%), 25 to 29 minutes (14 commuters, 16.5%), and 35 to 39 minutes (14 commuters, 16.5%).
| Commute Time | # Commuters | % Commuters |
| Less than 5 Minutes | 0 | 0.0% |
| 5 to 9 Minutes | 13 | 15.3% |
| 10 to 14 Minutes | 0 | 0.0% |
| 15 to 19 Minutes | 0 | 0.0% |
| 20 to 24 Minutes | 7 | 8.2% |
| 25 to 29 Minutes | 14 | 16.5% |
| 30 to 34 Minutes | 5 | 5.9% |
| 35 to 39 Minutes | 14 | 16.5% |
| 40 to 44 Minutes | 0 | 0.0% |
| 45 to 59 Minutes | 3 | 3.5% |
| 60 to 89 Minutes | 29 | 34.1% |
| 90 or more Minutes | 0 | 0.0% |
Commute Time by Sex in Sunbury
The most common commute times in Sunbury are 5 to 9 minutes (13 commuters, 52.0%) for males and 60 to 89 minutes (29 commuters, 48.3%) for females.
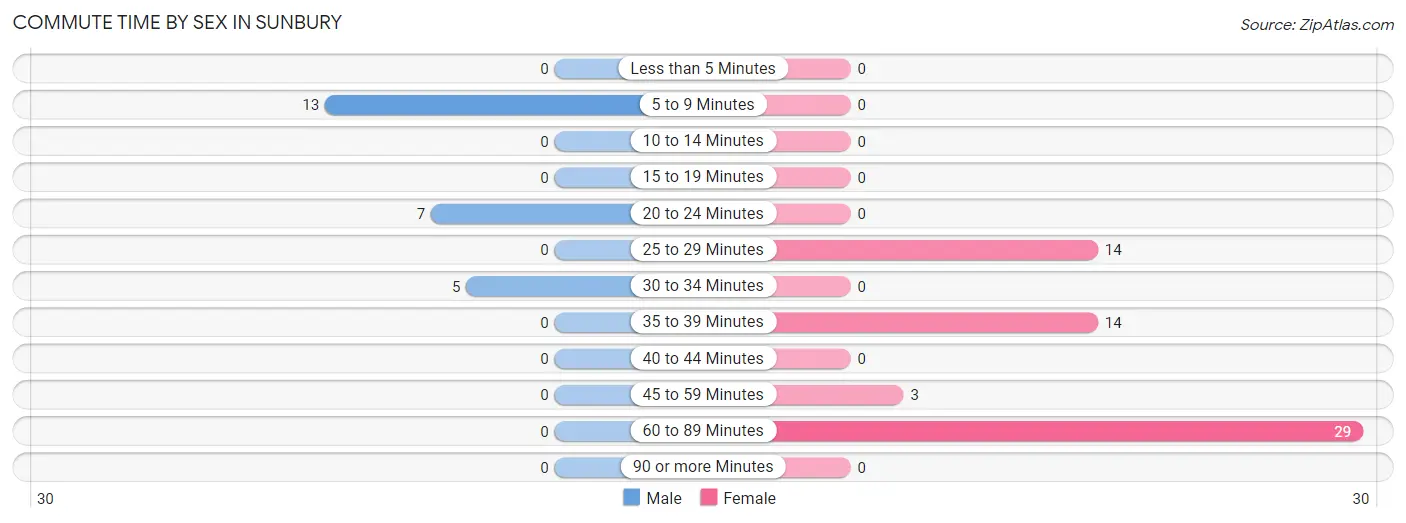
| Commute Time | Male | Female |
| Less than 5 Minutes | 0 (0.0%) | 0 (0.0%) |
| 5 to 9 Minutes | 13 (52.0%) | 0 (0.0%) |
| 10 to 14 Minutes | 0 (0.0%) | 0 (0.0%) |
| 15 to 19 Minutes | 0 (0.0%) | 0 (0.0%) |
| 20 to 24 Minutes | 7 (28.0%) | 0 (0.0%) |
| 25 to 29 Minutes | 0 (0.0%) | 14 (23.3%) |
| 30 to 34 Minutes | 5 (20.0%) | 0 (0.0%) |
| 35 to 39 Minutes | 0 (0.0%) | 14 (23.3%) |
| 40 to 44 Minutes | 0 (0.0%) | 0 (0.0%) |
| 45 to 59 Minutes | 0 (0.0%) | 3 (5.0%) |
| 60 to 89 Minutes | 0 (0.0%) | 29 (48.3%) |
| 90 or more Minutes | 0 (0.0%) | 0 (0.0%) |
Time of Departure to Work by Sex in Sunbury
The most frequent times of departure to work in Sunbury are 6:00 AM to 6:29 AM (18, 72.0%) for males and 7:00 AM to 7:29 AM (32, 53.3%) for females.
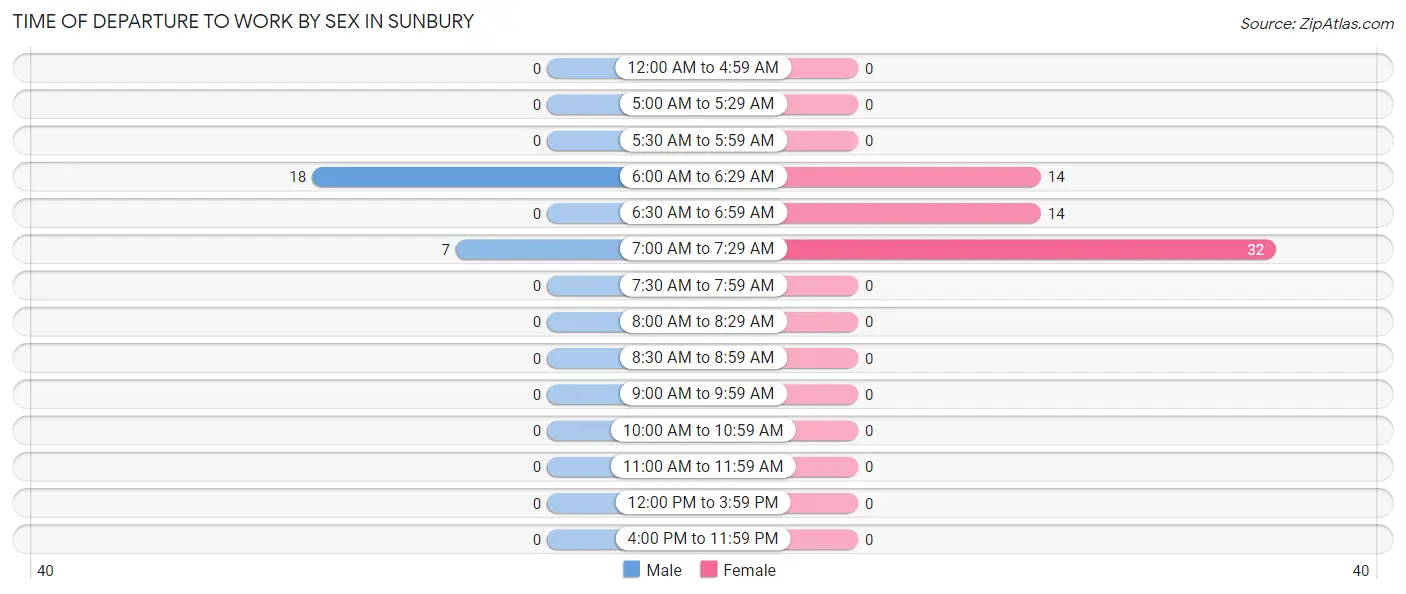
| Time of Departure | Male | Female |
| 12:00 AM to 4:59 AM | 0 (0.0%) | 0 (0.0%) |
| 5:00 AM to 5:29 AM | 0 (0.0%) | 0 (0.0%) |
| 5:30 AM to 5:59 AM | 0 (0.0%) | 0 (0.0%) |
| 6:00 AM to 6:29 AM | 18 (72.0%) | 14 (23.3%) |
| 6:30 AM to 6:59 AM | 0 (0.0%) | 14 (23.3%) |
| 7:00 AM to 7:29 AM | 7 (28.0%) | 32 (53.3%) |
| 7:30 AM to 7:59 AM | 0 (0.0%) | 0 (0.0%) |
| 8:00 AM to 8:29 AM | 0 (0.0%) | 0 (0.0%) |
| 8:30 AM to 8:59 AM | 0 (0.0%) | 0 (0.0%) |
| 9:00 AM to 9:59 AM | 0 (0.0%) | 0 (0.0%) |
| 10:00 AM to 10:59 AM | 0 (0.0%) | 0 (0.0%) |
| 11:00 AM to 11:59 AM | 0 (0.0%) | 0 (0.0%) |
| 12:00 PM to 3:59 PM | 0 (0.0%) | 0 (0.0%) |
| 4:00 PM to 11:59 PM | 0 (0.0%) | 0 (0.0%) |
| Total | 25 (100.0%) | 60 (100.0%) |
Housing Occupancy in Sunbury
Occupancy by Ownership in Sunbury
Of the total 79 dwellings in Sunbury, owner-occupied units account for 31 (39.2%), while renter-occupied units make up 48 (60.8%).
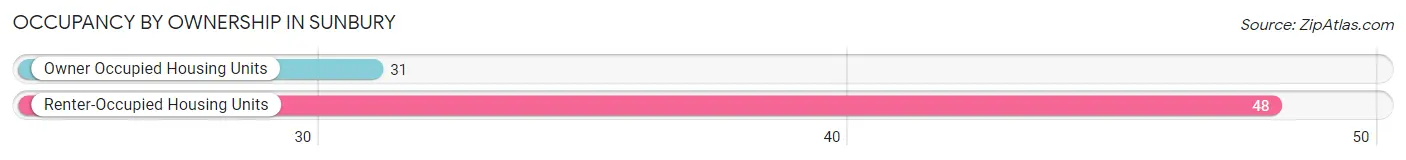
| Occupancy | # Housing Units | % Housing Units |
| Owner Occupied Housing Units | 31 | 39.2% |
| Renter-Occupied Housing Units | 48 | 60.8% |
| Total Occupied Housing Units | 79 | 100.0% |
Occupancy by Household Size in Sunbury
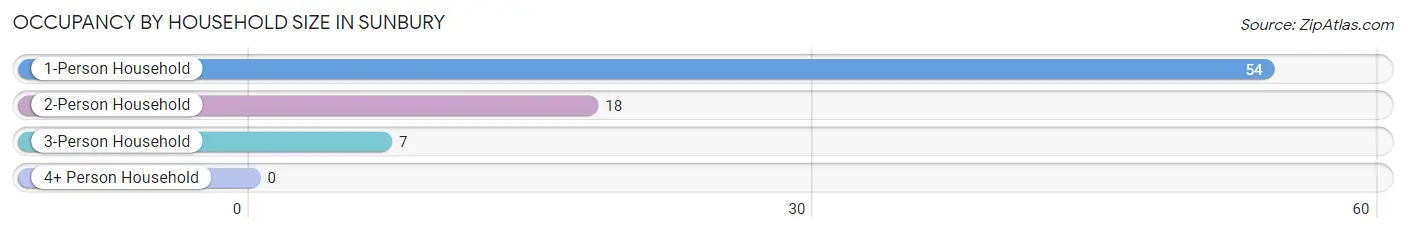
| Household Size | # Housing Units | % Housing Units |
| 1-Person Household | 54 | 68.3% |
| 2-Person Household | 18 | 22.8% |
| 3-Person Household | 7 | 8.9% |
| 4+ Person Household | 0 | 0.0% |
| Total Housing Units | 79 | 100.0% |
Occupancy by Ownership by Household Size in Sunbury
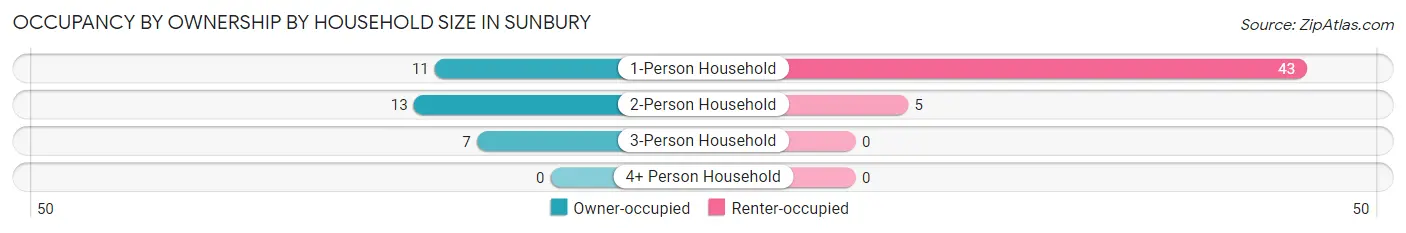
| Household Size | Owner-occupied | Renter-occupied |
| 1-Person Household | 11 (20.4%) | 43 (79.6%) |
| 2-Person Household | 13 (72.2%) | 5 (27.8%) |
| 3-Person Household | 7 (100.0%) | 0 (0.0%) |
| 4+ Person Household | 0 (0.0%) | 0 (0.0%) |
| Total Housing Units | 31 (39.2%) | 48 (60.8%) |
Occupancy by Educational Attainment in Sunbury
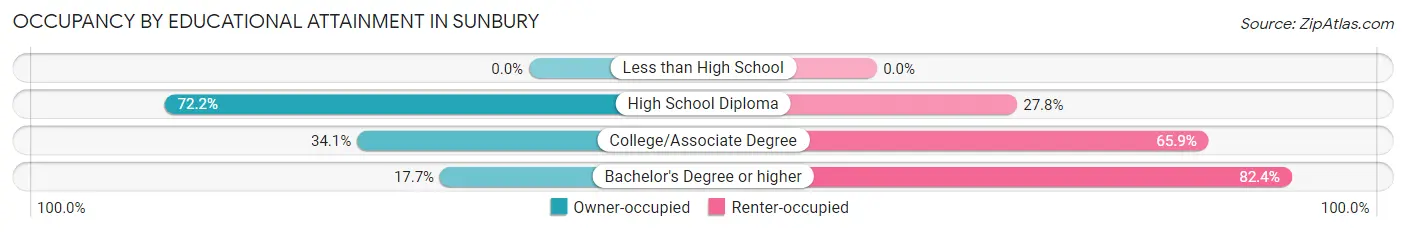
| Household Size | Owner-occupied | Renter-occupied |
| Less than High School | 0 (0.0%) | 0 (0.0%) |
| High School Diploma | 13 (72.2%) | 5 (27.8%) |
| College/Associate Degree | 15 (34.1%) | 29 (65.9%) |
| Bachelor's Degree or higher | 3 (17.6%) | 14 (82.4%) |
Occupancy by Age of Householder in Sunbury
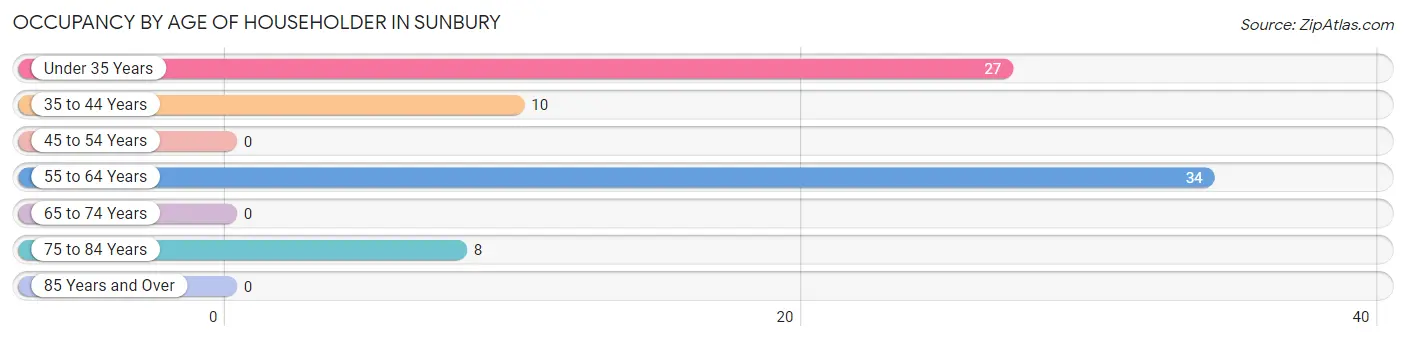
| Age Bracket | # Households | % Households |
| Under 35 Years | 27 | 34.2% |
| 35 to 44 Years | 10 | 12.7% |
| 45 to 54 Years | 0 | 0.0% |
| 55 to 64 Years | 34 | 43.0% |
| 65 to 74 Years | 0 | 0.0% |
| 75 to 84 Years | 8 | 10.1% |
| 85 Years and Over | 0 | 0.0% |
| Total | 79 | 100.0% |
Housing Finances in Sunbury
Median Income by Occupancy in Sunbury
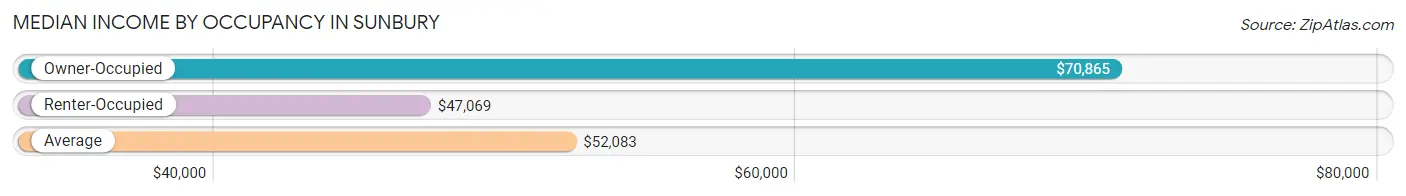
| Occupancy Type | # Households | Median Income |
| Owner-Occupied | 31 (39.2%) | $70,865 |
| Renter-Occupied | 48 (60.8%) | $47,069 |
| Average | 79 (100.0%) | $52,083 |
Occupancy by Householder Income Bracket in Sunbury
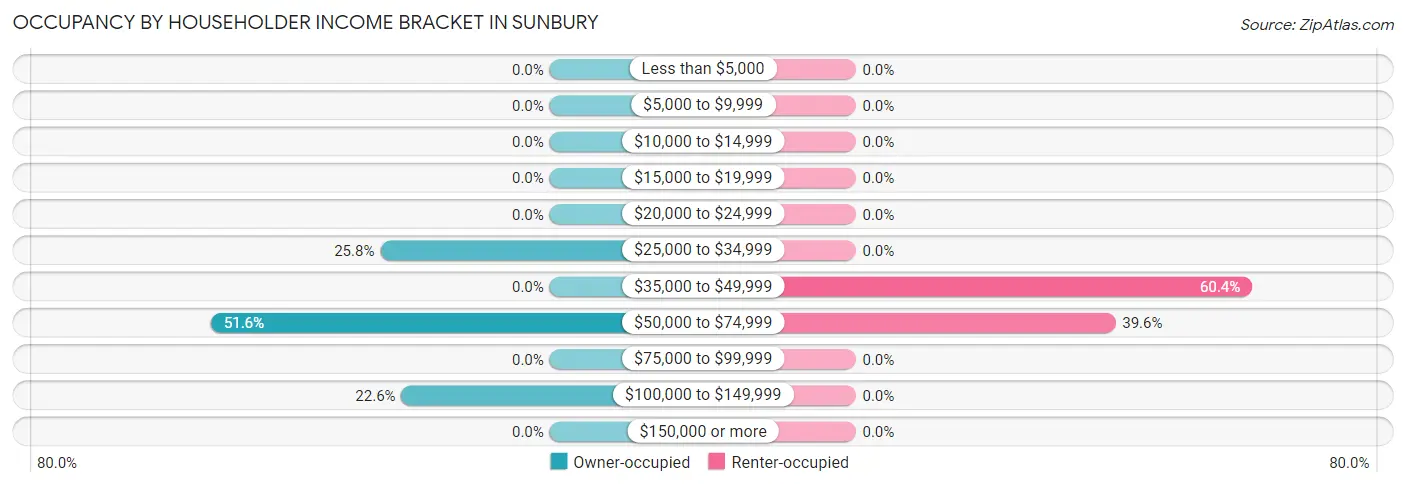
| Income Bracket | Owner-occupied | Renter-occupied |
| Less than $5,000 | 0 (0.0%) | 0 (0.0%) |
| $5,000 to $9,999 | 0 (0.0%) | 0 (0.0%) |
| $10,000 to $14,999 | 0 (0.0%) | 0 (0.0%) |
| $15,000 to $19,999 | 0 (0.0%) | 0 (0.0%) |
| $20,000 to $24,999 | 0 (0.0%) | 0 (0.0%) |
| $25,000 to $34,999 | 8 (25.8%) | 0 (0.0%) |
| $35,000 to $49,999 | 0 (0.0%) | 29 (60.4%) |
| $50,000 to $74,999 | 16 (51.6%) | 19 (39.6%) |
| $75,000 to $99,999 | 0 (0.0%) | 0 (0.0%) |
| $100,000 to $149,999 | 7 (22.6%) | 0 (0.0%) |
| $150,000 or more | 0 (0.0%) | 0 (0.0%) |
| Total | 31 (100.0%) | 48 (100.0%) |
Monthly Housing Cost Tiers in Sunbury
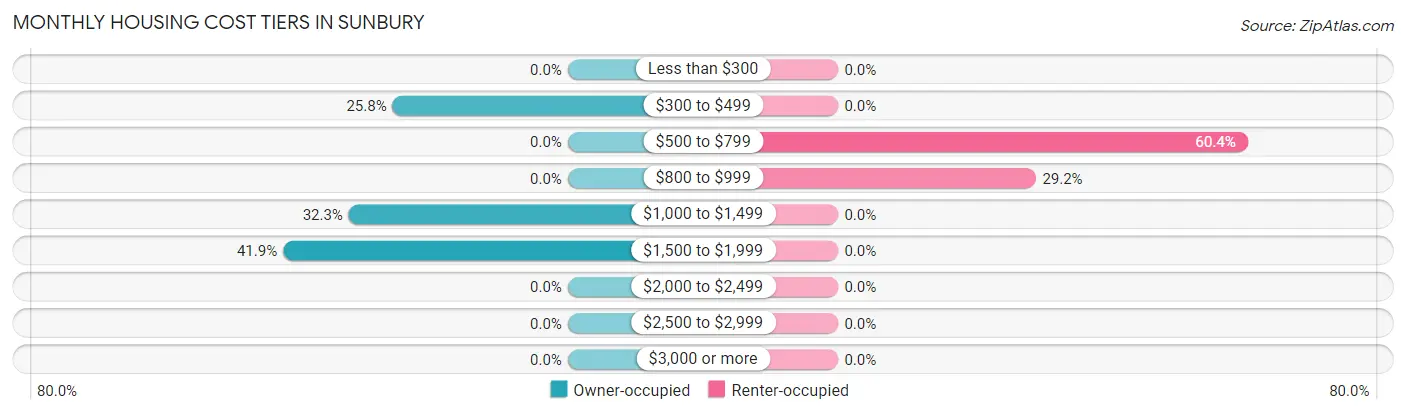
| Monthly Cost | Owner-occupied | Renter-occupied |
| Less than $300 | 0 (0.0%) | 0 (0.0%) |
| $300 to $499 | 8 (25.8%) | 0 (0.0%) |
| $500 to $799 | 0 (0.0%) | 29 (60.4%) |
| $800 to $999 | 0 (0.0%) | 14 (29.2%) |
| $1,000 to $1,499 | 10 (32.3%) | 0 (0.0%) |
| $1,500 to $1,999 | 13 (41.9%) | 0 (0.0%) |
| $2,000 to $2,499 | 0 (0.0%) | 0 (0.0%) |
| $2,500 to $2,999 | 0 (0.0%) | 0 (0.0%) |
| $3,000 or more | 0 (0.0%) | 0 (0.0%) |
| Total | 31 (100.0%) | 48 (100.0%) |
Physical Housing Characteristics in Sunbury
Housing Structures in Sunbury
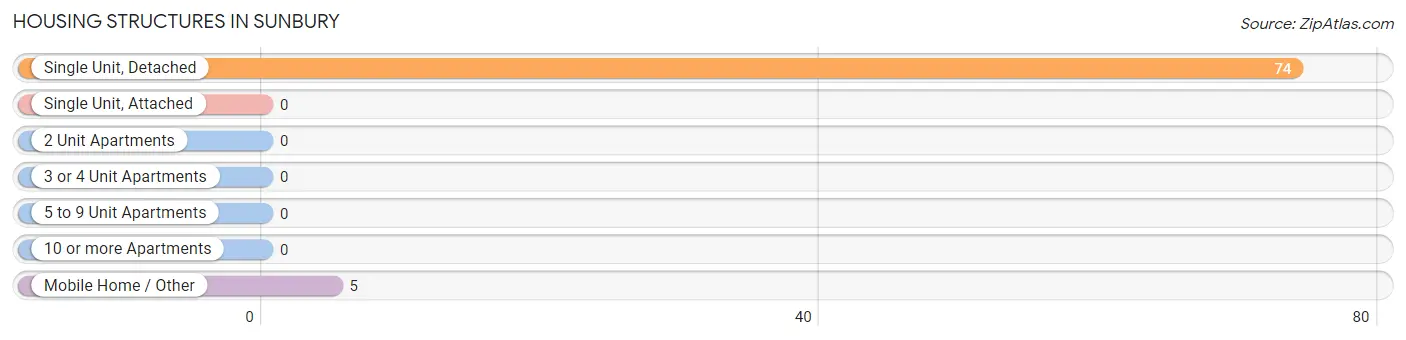
| Structure Type | # Housing Units | % Housing Units |
| Single Unit, Detached | 74 | 93.7% |
| Single Unit, Attached | 0 | 0.0% |
| 2 Unit Apartments | 0 | 0.0% |
| 3 or 4 Unit Apartments | 0 | 0.0% |
| 5 to 9 Unit Apartments | 0 | 0.0% |
| 10 or more Apartments | 0 | 0.0% |
| Mobile Home / Other | 5 | 6.3% |
| Total | 79 | 100.0% |
Housing Structures by Occupancy in Sunbury
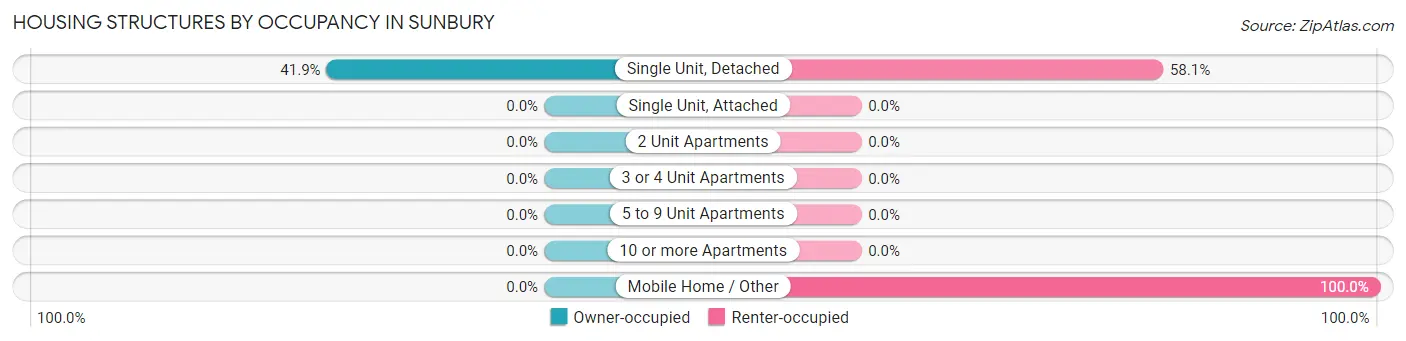
| Structure Type | Owner-occupied | Renter-occupied |
| Single Unit, Detached | 31 (41.9%) | 43 (58.1%) |
| Single Unit, Attached | 0 (0.0%) | 0 (0.0%) |
| 2 Unit Apartments | 0 (0.0%) | 0 (0.0%) |
| 3 or 4 Unit Apartments | 0 (0.0%) | 0 (0.0%) |
| 5 to 9 Unit Apartments | 0 (0.0%) | 0 (0.0%) |
| 10 or more Apartments | 0 (0.0%) | 0 (0.0%) |
| Mobile Home / Other | 0 (0.0%) | 5 (100.0%) |
| Total | 31 (39.2%) | 48 (60.8%) |
Housing Structures by Number of Rooms in Sunbury
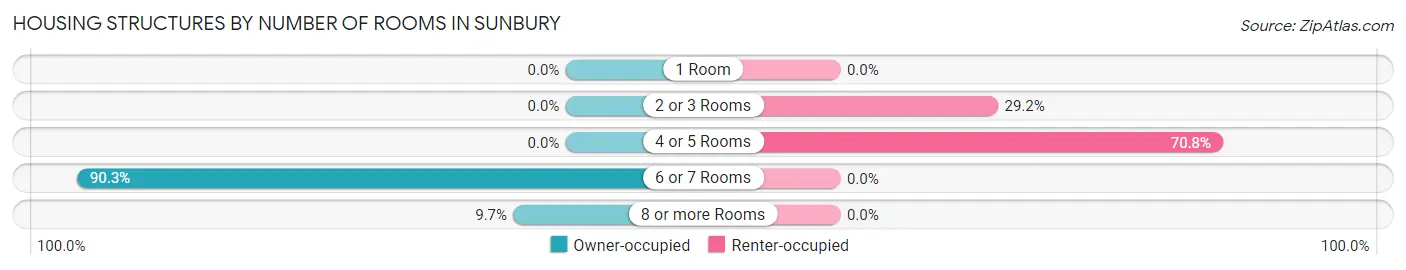
| Number of Rooms | Owner-occupied | Renter-occupied |
| 1 Room | 0 (0.0%) | 0 (0.0%) |
| 2 or 3 Rooms | 0 (0.0%) | 14 (29.2%) |
| 4 or 5 Rooms | 0 (0.0%) | 34 (70.8%) |
| 6 or 7 Rooms | 28 (90.3%) | 0 (0.0%) |
| 8 or more Rooms | 3 (9.7%) | 0 (0.0%) |
| Total | 31 (100.0%) | 48 (100.0%) |
Housing Structure by Heating Type in Sunbury
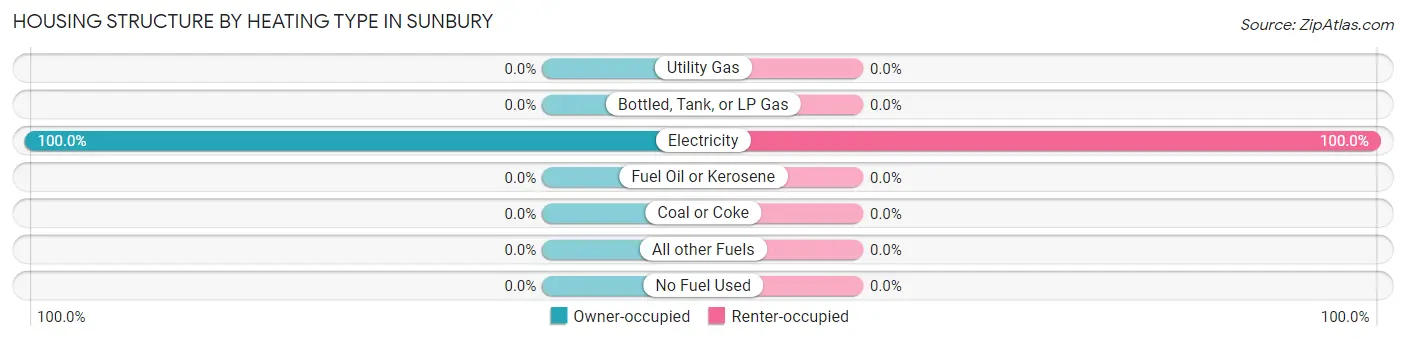
| Heating Type | Owner-occupied | Renter-occupied |
| Utility Gas | 0 (0.0%) | 0 (0.0%) |
| Bottled, Tank, or LP Gas | 0 (0.0%) | 0 (0.0%) |
| Electricity | 31 (100.0%) | 48 (100.0%) |
| Fuel Oil or Kerosene | 0 (0.0%) | 0 (0.0%) |
| Coal or Coke | 0 (0.0%) | 0 (0.0%) |
| All other Fuels | 0 (0.0%) | 0 (0.0%) |
| No Fuel Used | 0 (0.0%) | 0 (0.0%) |
| Total | 31 (100.0%) | 48 (100.0%) |
Household Vehicle Usage in Sunbury
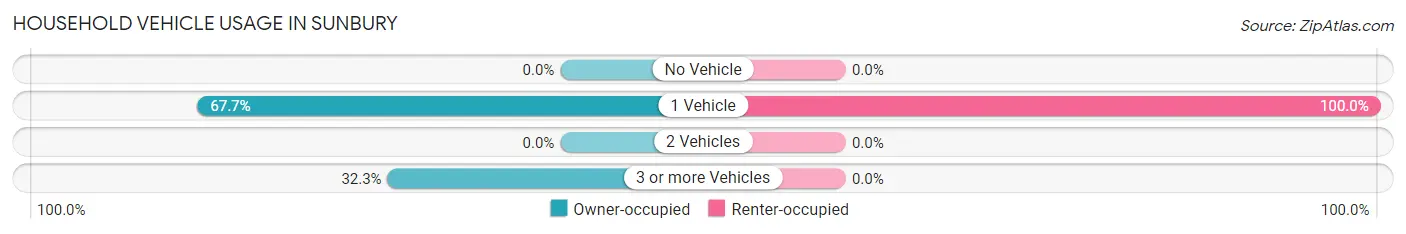
| Vehicles per Household | Owner-occupied | Renter-occupied |
| No Vehicle | 0 (0.0%) | 0 (0.0%) |
| 1 Vehicle | 21 (67.7%) | 48 (100.0%) |
| 2 Vehicles | 0 (0.0%) | 0 (0.0%) |
| 3 or more Vehicles | 10 (32.3%) | 0 (0.0%) |
| Total | 31 (100.0%) | 48 (100.0%) |
Real Estate & Mortgages in Sunbury
Real Estate and Mortgage Overview in Sunbury
| Characteristic | Without Mortgage | With Mortgage |
| Housing Units | 8 | 23 |
| Median Property Value | - | - |
| Median Household Income | - | - |
| Monthly Housing Costs | - | - |
| Real Estate Taxes | - | - |
Property Value by Mortgage Status in Sunbury
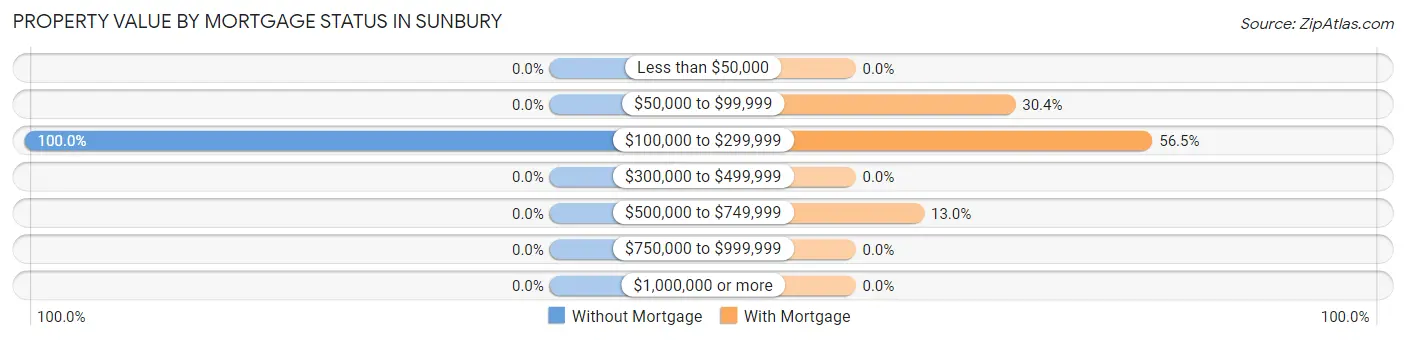
| Property Value | Without Mortgage | With Mortgage |
| Less than $50,000 | 0 (0.0%) | 0 (0.0%) |
| $50,000 to $99,999 | 0 (0.0%) | 7 (30.4%) |
| $100,000 to $299,999 | 8 (100.0%) | 13 (56.5%) |
| $300,000 to $499,999 | 0 (0.0%) | 0 (0.0%) |
| $500,000 to $749,999 | 0 (0.0%) | 3 (13.0%) |
| $750,000 to $999,999 | 0 (0.0%) | 0 (0.0%) |
| $1,000,000 or more | 0 (0.0%) | 0 (0.0%) |
| Total | 8 (100.0%) | 23 (100.0%) |
Household Income by Mortgage Status in Sunbury
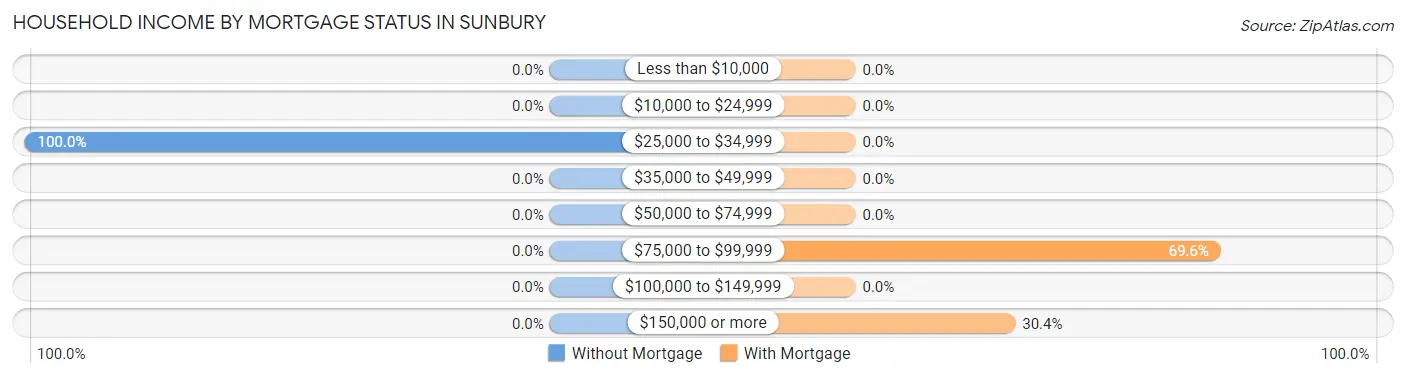
| Household Income | Without Mortgage | With Mortgage |
| Less than $10,000 | 0 (0.0%) | 0 (0.0%) |
| $10,000 to $24,999 | 0 (0.0%) | 0 (0.0%) |
| $25,000 to $34,999 | 8 (100.0%) | 0 (0.0%) |
| $35,000 to $49,999 | 0 (0.0%) | 0 (0.0%) |
| $50,000 to $74,999 | 0 (0.0%) | 0 (0.0%) |
| $75,000 to $99,999 | 0 (0.0%) | 16 (69.6%) |
| $100,000 to $149,999 | 0 (0.0%) | 0 (0.0%) |
| $150,000 or more | 0 (0.0%) | 7 (30.4%) |
| Total | 8 (100.0%) | 23 (100.0%) |
Property Value to Household Income Ratio in Sunbury
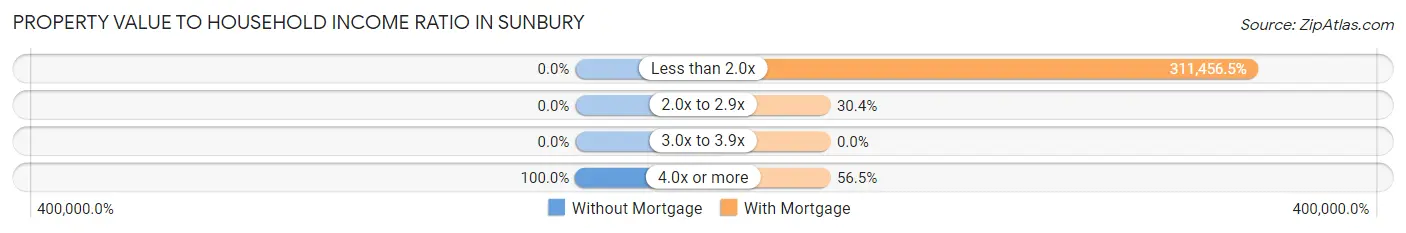
| Value-to-Income Ratio | Without Mortgage | With Mortgage |
| Less than 2.0x | 0 (0.0%) | 71,635 (311,456.5%) |
| 2.0x to 2.9x | 0 (0.0%) | 7 (30.4%) |
| 3.0x to 3.9x | 0 (0.0%) | 0 (0.0%) |
| 4.0x or more | 8 (100.0%) | 13 (56.5%) |
| Total | 8 (100.0%) | 23 (100.0%) |
Real Estate Taxes by Mortgage Status in Sunbury
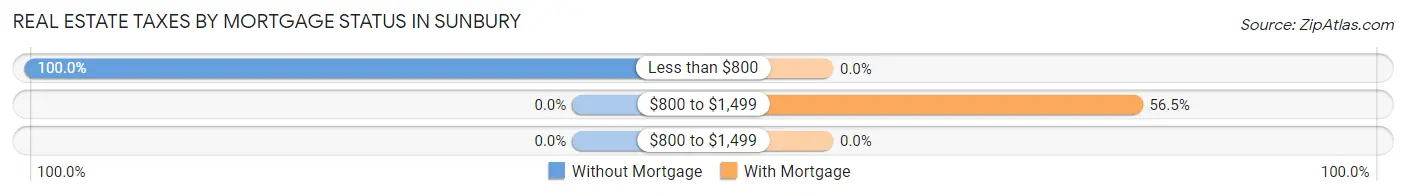
| Property Taxes | Without Mortgage | With Mortgage |
| Less than $800 | 8 (100.0%) | 0 (0.0%) |
| $800 to $1,499 | 0 (0.0%) | 13 (56.5%) |
| $800 to $1,499 | 0 (0.0%) | 0 (0.0%) |
| Total | 8 (100.0%) | 23 (100.0%) |
Health & Disability in Sunbury
Health Insurance Coverage by Age in Sunbury
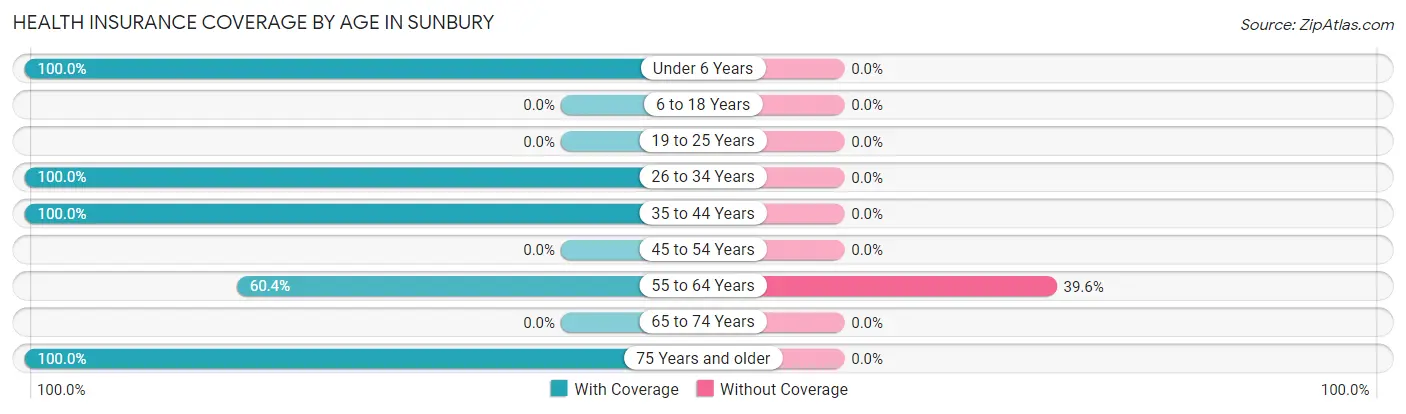
| Age Bracket | With Coverage | Without Coverage |
| Under 6 Years | 20 (100.0%) | 0 (0.0%) |
| 6 to 18 Years | 0 (0.0%) | 0 (0.0%) |
| 19 to 25 Years | 0 (0.0%) | 0 (0.0%) |
| 26 to 34 Years | 35 (100.0%) | 0 (0.0%) |
| 35 to 44 Years | 10 (100.0%) | 0 (0.0%) |
| 45 to 54 Years | 0 (0.0%) | 0 (0.0%) |
| 55 to 64 Years | 29 (60.4%) | 19 (39.6%) |
| 65 to 74 Years | 0 (0.0%) | 0 (0.0%) |
| 75 Years and older | 8 (100.0%) | 0 (0.0%) |
| Total | 102 (84.3%) | 19 (15.7%) |
Health Insurance Coverage by Citizenship Status in Sunbury
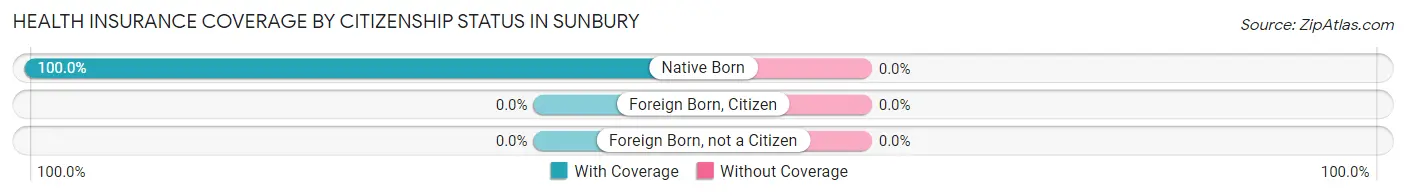
| Citizenship Status | With Coverage | Without Coverage |
| Native Born | 20 (100.0%) | 0 (0.0%) |
| Foreign Born, Citizen | 0 (0.0%) | 0 (0.0%) |
| Foreign Born, not a Citizen | 0 (0.0%) | 0 (0.0%) |
Health Insurance Coverage by Household Income in Sunbury
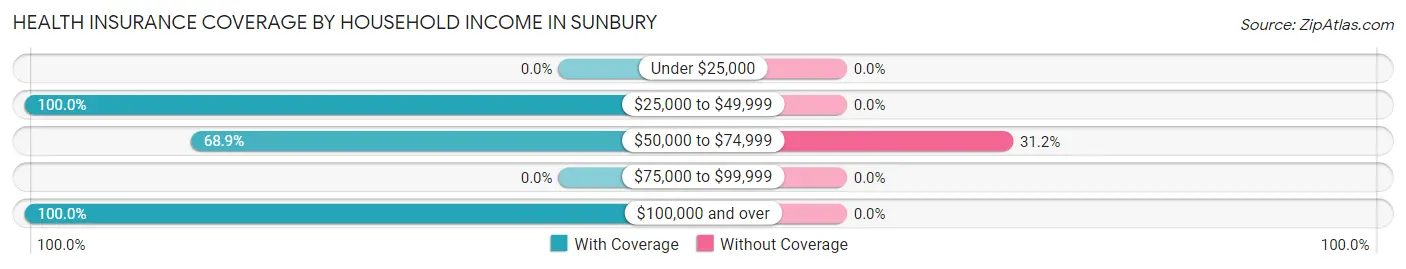
| Household Income | With Coverage | Without Coverage |
| Under $25,000 | 0 (0.0%) | 0 (0.0%) |
| $25,000 to $49,999 | 37 (100.0%) | 0 (0.0%) |
| $50,000 to $74,999 | 42 (68.9%) | 19 (31.1%) |
| $75,000 to $99,999 | 0 (0.0%) | 0 (0.0%) |
| $100,000 and over | 23 (100.0%) | 0 (0.0%) |
Public vs Private Health Insurance Coverage by Age in Sunbury
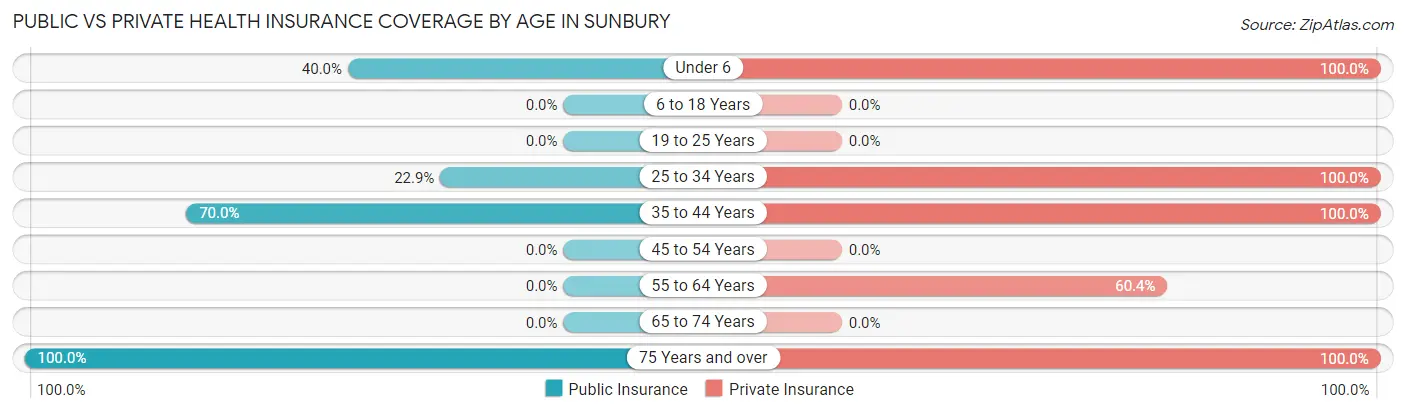
| Age Bracket | Public Insurance | Private Insurance |
| Under 6 | 8 (40.0%) | 20 (100.0%) |
| 6 to 18 Years | 0 (0.0%) | 0 (0.0%) |
| 19 to 25 Years | 0 (0.0%) | 0 (0.0%) |
| 25 to 34 Years | 8 (22.9%) | 35 (100.0%) |
| 35 to 44 Years | 7 (70.0%) | 10 (100.0%) |
| 45 to 54 Years | 0 (0.0%) | 0 (0.0%) |
| 55 to 64 Years | 0 (0.0%) | 29 (60.4%) |
| 65 to 74 Years | 0 (0.0%) | 0 (0.0%) |
| 75 Years and over | 8 (100.0%) | 8 (100.0%) |
| Total | 31 (25.6%) | 102 (84.3%) |
Disability Status by Sex by Age in Sunbury
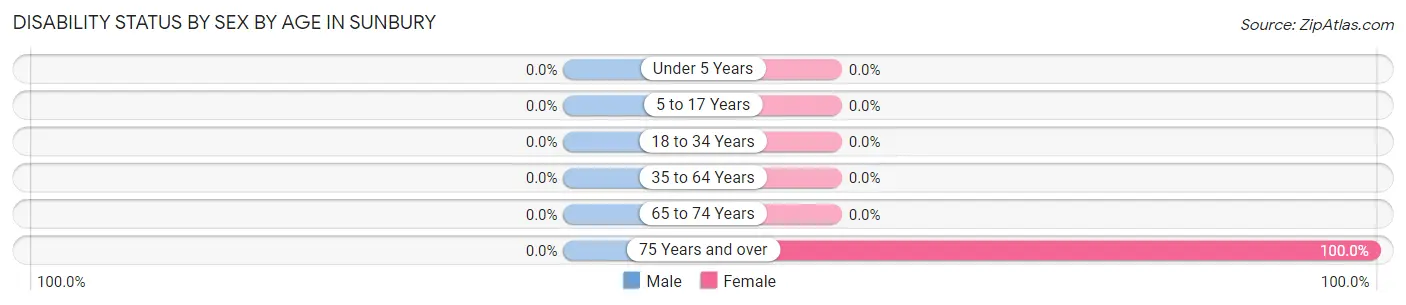
| Age Bracket | Male | Female |
| Under 5 Years | 0 (0.0%) | 0 (0.0%) |
| 5 to 17 Years | 0 (0.0%) | 0 (0.0%) |
| 18 to 34 Years | 0 (0.0%) | 0 (0.0%) |
| 35 to 64 Years | 0 (0.0%) | 0 (0.0%) |
| 65 to 74 Years | 0 (0.0%) | 0 (0.0%) |
| 75 Years and over | 0 (0.0%) | 8 (100.0%) |
Disability Class by Sex by Age in Sunbury
Disability Class: Hearing Difficulty
| Age Bracket | Male | Female |
| Under 5 Years | 0 (0.0%) | 0 (0.0%) |
| 5 to 17 Years | 0 (0.0%) | 0 (0.0%) |
| 18 to 34 Years | 0 (0.0%) | 0 (0.0%) |
| 35 to 64 Years | 0 (0.0%) | 0 (0.0%) |
| 65 to 74 Years | 0 (0.0%) | 0 (0.0%) |
| 75 Years and over | 0 (0.0%) | 0 (0.0%) |
Disability Class: Vision Difficulty
| Age Bracket | Male | Female |
| Under 5 Years | 0 (0.0%) | 0 (0.0%) |
| 5 to 17 Years | 0 (0.0%) | 0 (0.0%) |
| 18 to 34 Years | 0 (0.0%) | 0 (0.0%) |
| 35 to 64 Years | 0 (0.0%) | 0 (0.0%) |
| 65 to 74 Years | 0 (0.0%) | 0 (0.0%) |
| 75 Years and over | 0 (0.0%) | 0 (0.0%) |
Disability Class: Cognitive Difficulty

| Age Bracket | Male | Female |
| 5 to 17 Years | 0 (0.0%) | 0 (0.0%) |
| 18 to 34 Years | 0 (0.0%) | 0 (0.0%) |
| 35 to 64 Years | 0 (0.0%) | 0 (0.0%) |
| 65 to 74 Years | 0 (0.0%) | 0 (0.0%) |
| 75 Years and over | 0 (0.0%) | 0 (0.0%) |
Disability Class: Ambulatory Difficulty
| Age Bracket | Male | Female |
| 5 to 17 Years | 0 (0.0%) | 0 (0.0%) |
| 18 to 34 Years | 0 (0.0%) | 0 (0.0%) |
| 35 to 64 Years | 0 (0.0%) | 0 (0.0%) |
| 65 to 74 Years | 0 (0.0%) | 0 (0.0%) |
| 75 Years and over | 0 (0.0%) | 8 (100.0%) |
Disability Class: Self-Care Difficulty
| Age Bracket | Male | Female |
| 5 to 17 Years | 0 (0.0%) | 0 (0.0%) |
| 18 to 34 Years | 0 (0.0%) | 0 (0.0%) |
| 35 to 64 Years | 0 (0.0%) | 0 (0.0%) |
| 65 to 74 Years | 0 (0.0%) | 0 (0.0%) |
| 75 Years and over | 0 (0.0%) | 0 (0.0%) |
Technology Access in Sunbury
Computing Device Access in Sunbury
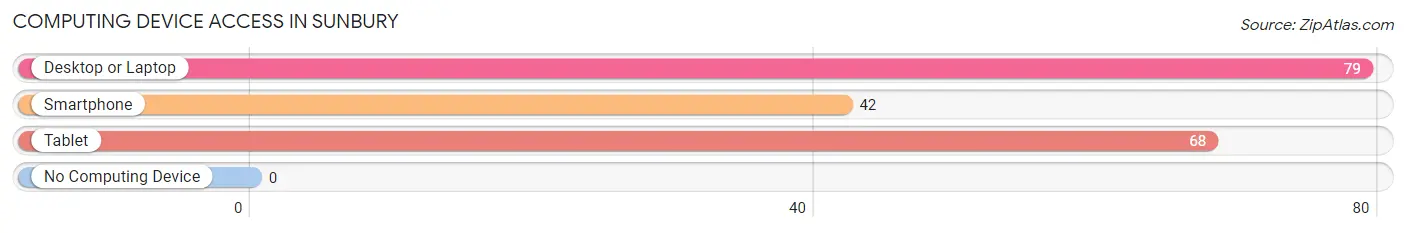
| Device Type | # Households | % Households |
| Desktop or Laptop | 79 | 100.0% |
| Smartphone | 42 | 53.2% |
| Tablet | 68 | 86.1% |
| No Computing Device | 0 | 0.0% |
| Total | 79 | 100.0% |
Internet Access in Sunbury
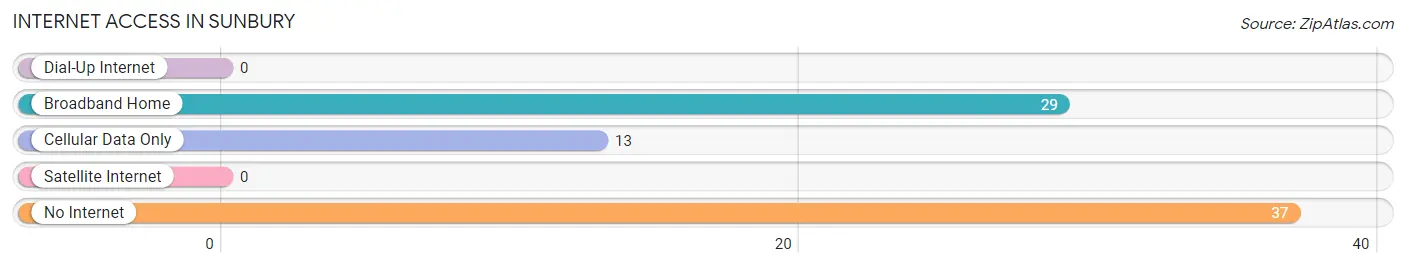
| Internet Type | # Households | % Households |
| Dial-Up Internet | 0 | 0.0% |
| Broadband Home | 29 | 36.7% |
| Cellular Data Only | 13 | 16.5% |
| Satellite Internet | 0 | 0.0% |
| No Internet | 37 | 46.8% |
| Total | 79 | 100.0% |
Sunbury Summary
History
Sunbury, North Carolina is a small town located in the northeastern part of the state. It is situated in the county of Northampton, and is part of the Roanoke-Chowan region. The town was first settled in 1720 by a group of Quakers from Pennsylvania. The town was originally known as Sunbury Crossroads, and was named after Sunbury, Pennsylvania. The town was officially incorporated in 1887.
Sunbury has a rich history of agriculture and industry. The town was home to several cotton mills, which provided employment for many of the town’s residents. The town also had a thriving lumber industry, which provided timber for the construction of homes and other buildings. The town was also home to several tobacco warehouses, which were used to store and process tobacco.
The town was also home to several churches, including the Sunbury Methodist Church, which was founded in 1820. The church is still active today and is a popular tourist attraction.
Geography
Sunbury is located in the northeastern part of North Carolina, in the county of Northampton. The town is situated on the Roanoke River, which is a major tributary of the Chowan River. The town is located approximately 30 miles from the city of Roanoke Rapids, and is about 60 miles from the city of Norfolk, Virginia.
The town is located in a rural area, and is surrounded by farmland and forests. The town is located in a humid subtropical climate zone, and experiences hot, humid summers and mild winters. The average annual temperature is around 70 degrees Fahrenheit.
Economy
Sunbury’s economy is largely based on agriculture and industry. The town is home to several cotton mills, which provide employment for many of the town’s residents. The town also has a thriving lumber industry, which provides timber for the construction of homes and other buildings. The town is also home to several tobacco warehouses, which are used to store and process tobacco.
The town is also home to several small businesses, including restaurants, retail stores, and other services. The town is also home to several churches, which provide employment for many of the town’s residents.
Demographics
As of the 2010 census, the population of Sunbury was 1,845. The town has a population density of 545 people per square mile. The median age of the town’s residents is 39.7 years. The median household income is $31,250, and the median family income is $41,250.
The town is predominantly white, with 87.3% of the population identifying as white. The town also has a small African American population, with 8.3% of the population identifying as African American. The town also has a small Hispanic population, with 2.2% of the population identifying as Hispanic or Latino.
Sunbury is a small town with a rich history and a vibrant economy. The town is home to several cotton mills, lumber mills, and tobacco warehouses, which provide employment for many of the town’s residents. The town is also home to several churches, which provide employment for many of the town’s residents. The town is predominantly white, with a small African American and Hispanic population.
Common Questions
What is Per Capita Income in Sunbury?
Per Capita income in Sunbury is $41,255.
What is the Median Family Income in Sunbury?
Median Family Income in Sunbury is $71,736.
What is the Median Household income in Sunbury?
Median Household Income in Sunbury is $52,083.
What is Inequality or Gini Index in Sunbury?
Inequality or Gini Index in Sunbury is 0.19.
What is the Total Population of Sunbury?
Total Population of Sunbury is 121.
What is the Total Male Population of Sunbury?
Total Male Population of Sunbury is 25.
What is the Total Female Population of Sunbury?
Total Female Population of Sunbury is 96.
What is the Ratio of Males per 100 Females in Sunbury?
There are 26.04 Males per 100 Females in Sunbury.
What is the Ratio of Females per 100 Males in Sunbury?
There are 384.00 Females per 100 Males in Sunbury.
What is the Median Population Age in Sunbury?
Median Population Age in Sunbury is 35.8 Years.
What is the Average Family Size in Sunbury
Average Family Size in Sunbury is 2.7 People.
What is the Average Household Size in Sunbury
Average Household Size in Sunbury is 1.5 People.
How Large is the Labor Force in Sunbury?
There are 93 People in the Labor Forcein in Sunbury.
What is the Percentage of People in the Labor Force in Sunbury?
92.1% of People are in the Labor Force in Sunbury.