East Bend, NC Map & Demographics
East Bend Map
East Bend Overview
$27,981
PER CAPITA INCOME
$94,844
AVG FAMILY INCOME
$79,375
AVG HOUSEHOLD INCOME
49.4%
WAGE / INCOME GAP [ % ]
50.6¢/ $1
WAGE / INCOME GAP [ $ ]
0.32
INEQUALITY / GINI INDEX
741
TOTAL POPULATION
356
MALE POPULATION
385
FEMALE POPULATION
92.47
MALES / 100 FEMALES
108.15
FEMALES / 100 MALES
32.3
MEDIAN AGE
3.8
AVG FAMILY SIZE
3.4
AVG HOUSEHOLD SIZE
381
LABOR FORCE [ PEOPLE ]
65.5%
PERCENT IN LABOR FORCE
4.2%
UNEMPLOYMENT RATE
East Bend Zip Codes
East Bend Area Codes
Income in East Bend
Income Overview in East Bend
Per Capita Income in East Bend is $27,981, while median incomes of families and households are $94,844 and $79,375 respectively.
| Characteristic | Number | Measure |
| Per Capita Income | 741 | $27,981 |
| Median Family Income | 167 | $94,844 |
| Mean Family Income | 167 | $94,831 |
| Median Household Income | 221 | $79,375 |
| Mean Household Income | 221 | $86,374 |
| Income Deficit | 167 | $0 |
| Wage / Income Gap (%) | 741 | 49.40% |
| Wage / Income Gap ($) | 741 | 50.60¢ per $1 |
| Gini / Inequality Index | 741 | 0.32 |
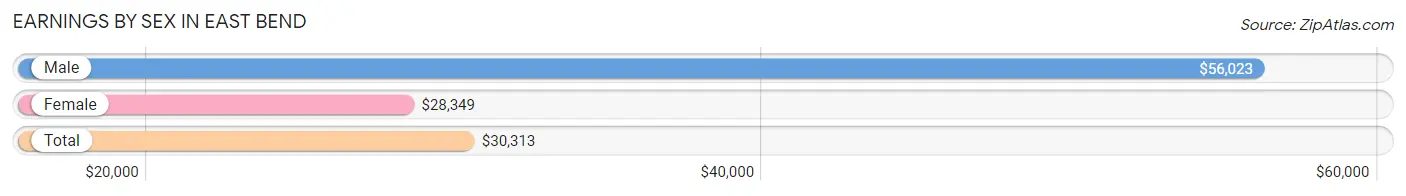
Earnings by Sex in East Bend
Average Earnings in East Bend are $30,313, $56,023 for men and $28,349 for women, a difference of 49.4%.
| Sex | Number | Average Earnings |
| Male | 202 (47.2%) | $56,023 |
| Female | 226 (52.8%) | $28,349 |
| Total | 428 (100.0%) | $30,313 |
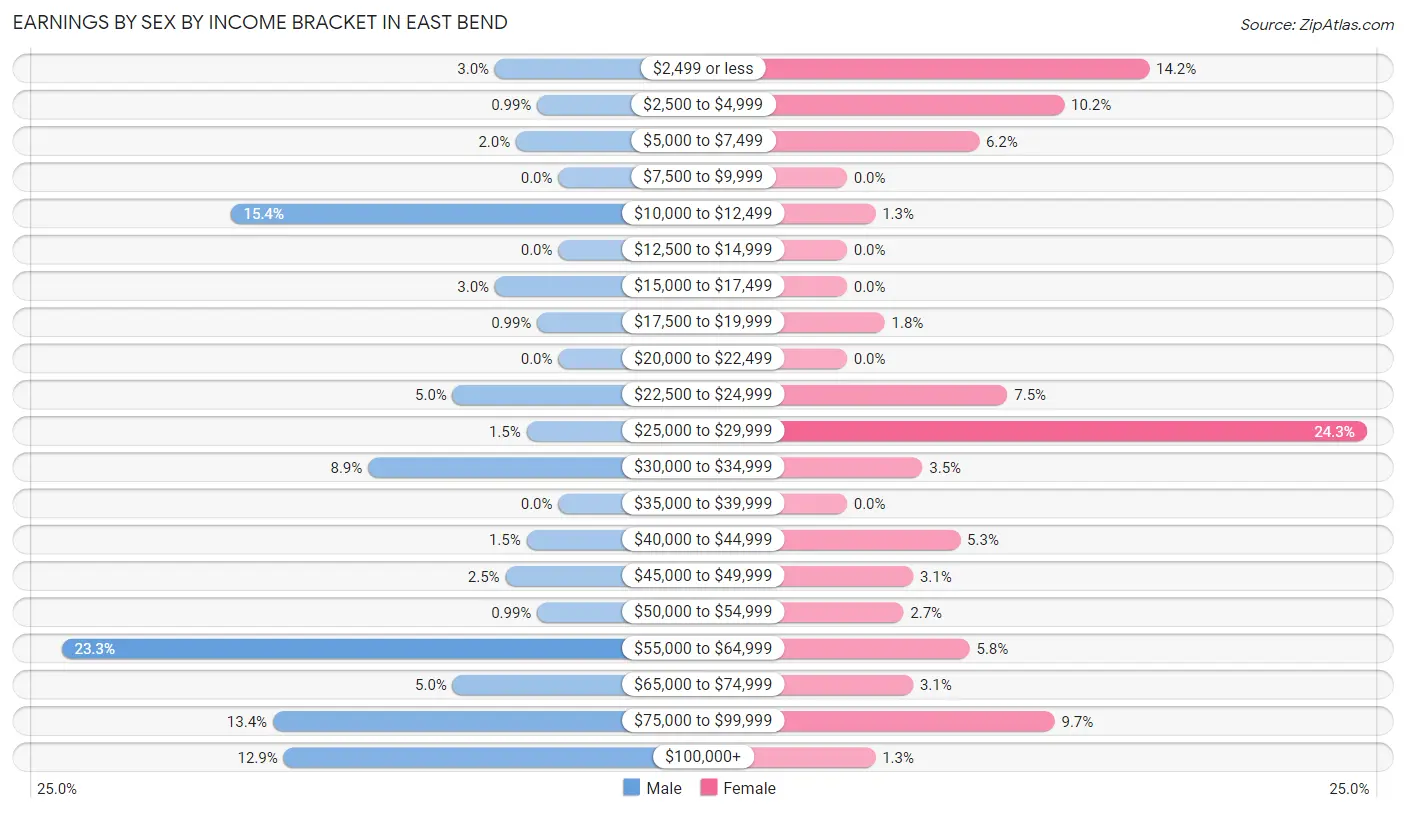
Earnings by Sex by Income Bracket in East Bend
The most common earnings brackets in East Bend are $55,000 to $64,999 for men (47 | 23.3%) and $25,000 to $29,999 for women (55 | 24.3%).
| Income | Male | Female |
| $2,499 or less | 6 (3.0%) | 32 (14.2%) |
| $2,500 to $4,999 | 2 (1.0%) | 23 (10.2%) |
| $5,000 to $7,499 | 4 (2.0%) | 14 (6.2%) |
| $7,500 to $9,999 | 0 (0.0%) | 0 (0.0%) |
| $10,000 to $12,499 | 31 (15.3%) | 3 (1.3%) |
| $12,500 to $14,999 | 0 (0.0%) | 0 (0.0%) |
| $15,000 to $17,499 | 6 (3.0%) | 0 (0.0%) |
| $17,500 to $19,999 | 2 (1.0%) | 4 (1.8%) |
| $20,000 to $22,499 | 0 (0.0%) | 0 (0.0%) |
| $22,500 to $24,999 | 10 (5.0%) | 17 (7.5%) |
| $25,000 to $29,999 | 3 (1.5%) | 55 (24.3%) |
| $30,000 to $34,999 | 18 (8.9%) | 8 (3.5%) |
| $35,000 to $39,999 | 0 (0.0%) | 0 (0.0%) |
| $40,000 to $44,999 | 3 (1.5%) | 12 (5.3%) |
| $45,000 to $49,999 | 5 (2.5%) | 7 (3.1%) |
| $50,000 to $54,999 | 2 (1.0%) | 6 (2.6%) |
| $55,000 to $64,999 | 47 (23.3%) | 13 (5.8%) |
| $65,000 to $74,999 | 10 (5.0%) | 7 (3.1%) |
| $75,000 to $99,999 | 27 (13.4%) | 22 (9.7%) |
| $100,000+ | 26 (12.9%) | 3 (1.3%) |
| Total | 202 (100.0%) | 226 (100.0%) |
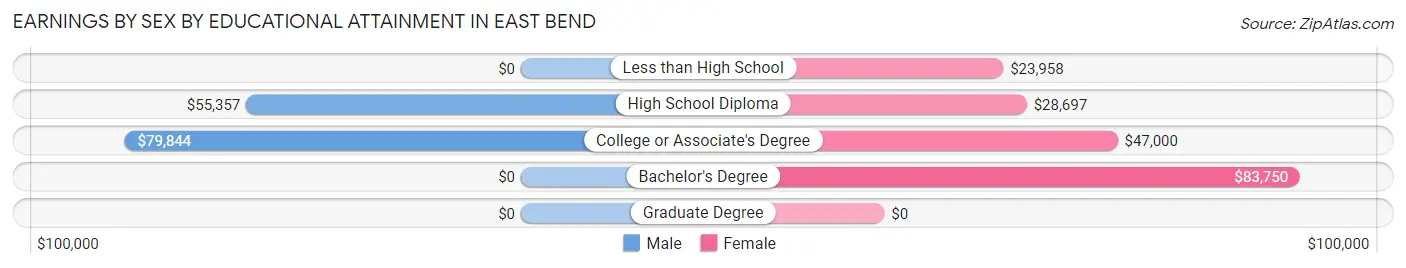
Earnings by Sex by Educational Attainment in East Bend
Average earnings in East Bend are $59,485 for men and $29,947 for women, a difference of 49.7%. Men with an educational attainment of college or associate's degree enjoy the highest average annual earnings of $79,844, while those with high school diploma education earn the least with $55,357. Women with an educational attainment of bachelor's degree earn the most with the average annual earnings of $83,750, while those with less than high school education have the smallest earnings of $23,958.
| Educational Attainment | Male Income | Female Income |
| Less than High School | - | - |
| High School Diploma | $55,357 | $28,697 |
| College or Associate's Degree | $79,844 | $47,000 |
| Bachelor's Degree | - | - |
| Graduate Degree | - | - |
| Total | $59,485 | $29,947 |
Family Income in East Bend
Family Income Brackets in East Bend
According to the East Bend family income data, there are 63 families falling into the $100,000 to $149,999 income range, which is the most common income bracket and makes up 37.7% of all families.
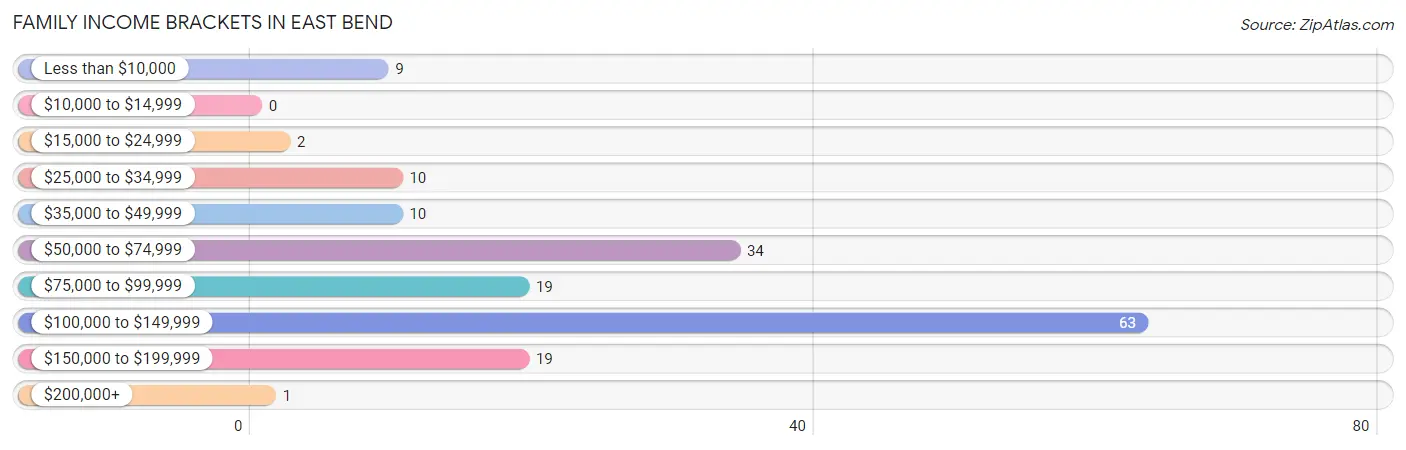
| Income Bracket | # Families | % Families |
| Less than $10,000 | 9 | 5.4% |
| $10,000 to $14,999 | 0 | 0.0% |
| $15,000 to $24,999 | 2 | 1.2% |
| $25,000 to $34,999 | 10 | 6.0% |
| $35,000 to $49,999 | 10 | 6.0% |
| $50,000 to $74,999 | 34 | 20.4% |
| $75,000 to $99,999 | 19 | 11.4% |
| $100,000 to $149,999 | 63 | 37.7% |
| $150,000 to $199,999 | 19 | 11.4% |
| $200,000+ | 1 | 0.6% |
Family Income by Famaliy Size in East Bend
4-person families (20 | 12.0%) account for the highest median family income in East Bend with $149,167 per family, while 3-person families (56 | 33.5%) have the highest median income of $38,229 per family member.
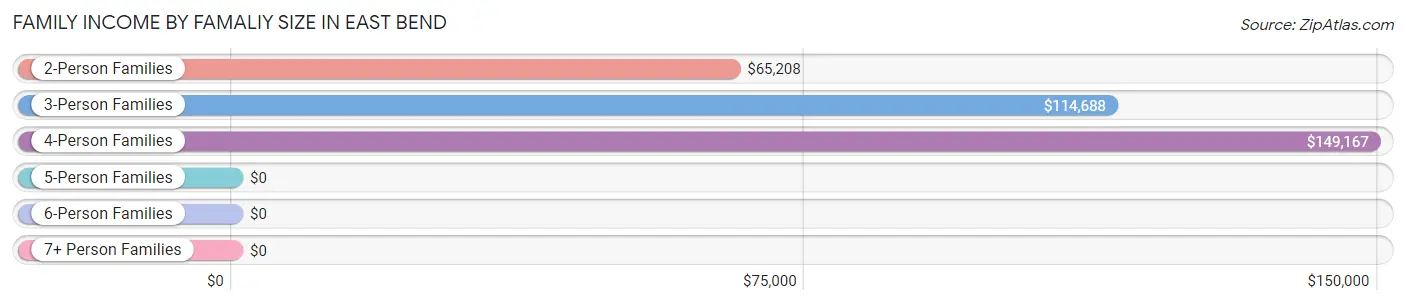
| Income Bracket | # Families | Median Income |
| 2-Person Families | 73 (43.7%) | $65,208 |
| 3-Person Families | 56 (33.5%) | $114,688 |
| 4-Person Families | 20 (12.0%) | $149,167 |
| 5-Person Families | 10 (6.0%) | $0 |
| 6-Person Families | 6 (3.6%) | $0 |
| 7+ Person Families | 2 (1.2%) | $0 |
| Total | 167 (100.0%) | $94,844 |
Family Income by Number of Earners in East Bend
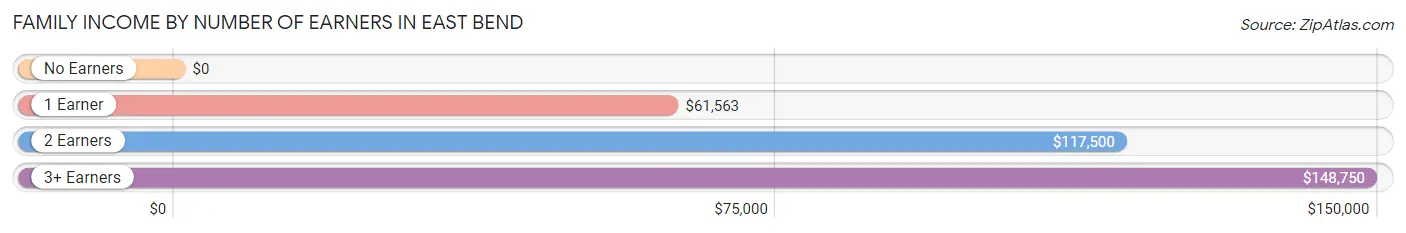
| Number of Earners | # Families | Median Income |
| No Earners | 26 (15.6%) | $0 |
| 1 Earner | 34 (20.4%) | $61,563 |
| 2 Earners | 88 (52.7%) | $117,500 |
| 3+ Earners | 19 (11.4%) | $148,750 |
| Total | 167 (100.0%) | $94,844 |
Household Income in East Bend
Household Income Brackets in East Bend
With 67 households falling in the category, the $100,000 to $149,999 income range is the most frequent in East Bend, accounting for 30.3% of all households. In contrast, only 1 households (0.4%) fall into the $200,000+ income bracket, making it the least populous group.
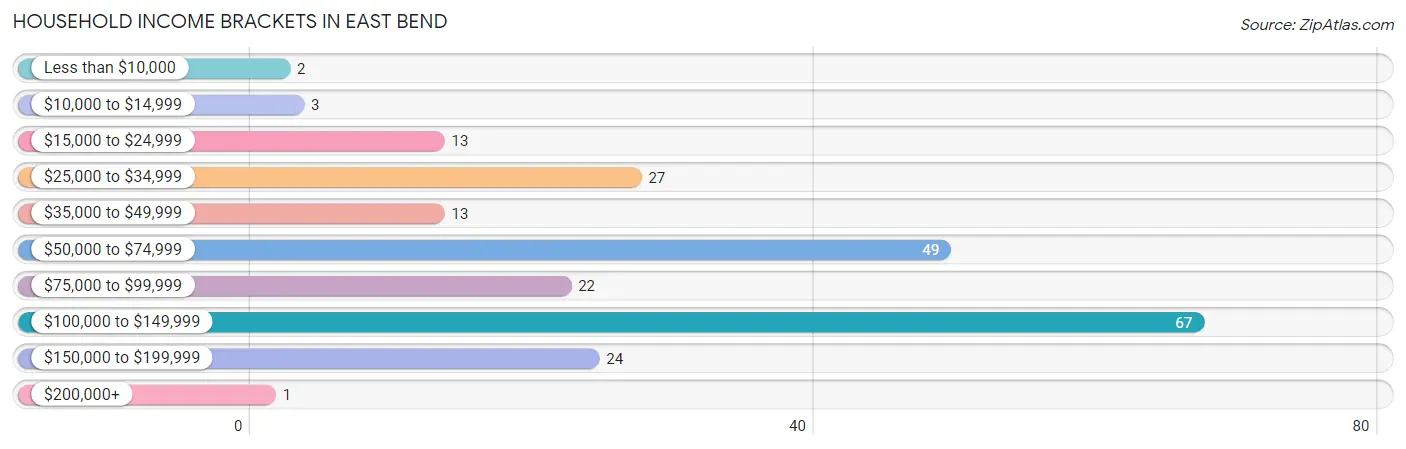
| Income Bracket | # Households | % Households |
| Less than $10,000 | 2 | 0.9% |
| $10,000 to $14,999 | 3 | 1.4% |
| $15,000 to $24,999 | 13 | 5.9% |
| $25,000 to $34,999 | 27 | 12.2% |
| $35,000 to $49,999 | 13 | 5.9% |
| $50,000 to $74,999 | 49 | 22.2% |
| $75,000 to $99,999 | 22 | 10.0% |
| $100,000 to $149,999 | 67 | 30.3% |
| $150,000 to $199,999 | 24 | 10.9% |
| $200,000+ | 1 | 0.5% |
Household Income by Householder Age in East Bend
The median household income in East Bend is $79,375, with the highest median household income of $114,375 found in the 25 to 44 years age bracket for the primary householder. A total of 66 households (29.9%) fall into this category. Meanwhile, the 15 to 24 years age bracket for the primary householder has the lowest median household income of $0, with 9 households (4.1%) in this group.
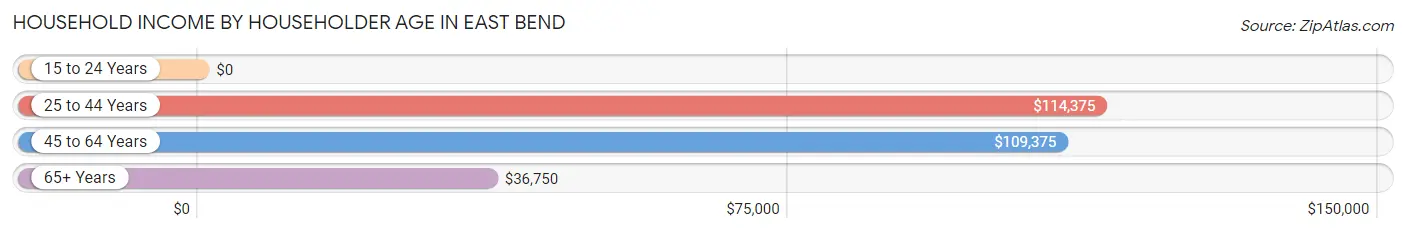
| Income Bracket | # Households | Median Income |
| 15 to 24 Years | 9 (4.1%) | $0 |
| 25 to 44 Years | 66 (29.9%) | $114,375 |
| 45 to 64 Years | 77 (34.8%) | $109,375 |
| 65+ Years | 69 (31.2%) | $36,750 |
| Total | 221 (100.0%) | $79,375 |
Poverty in East Bend
Income Below Poverty by Sex and Age in East Bend
With 12.1% poverty level for males and 10.8% for females among the residents of East Bend, 12 to 14 year old males and 12 to 14 year old females are the most vulnerable to poverty, with 14 males (45.2%) and 13 females (52.0%) in their respective age groups living below the poverty level.
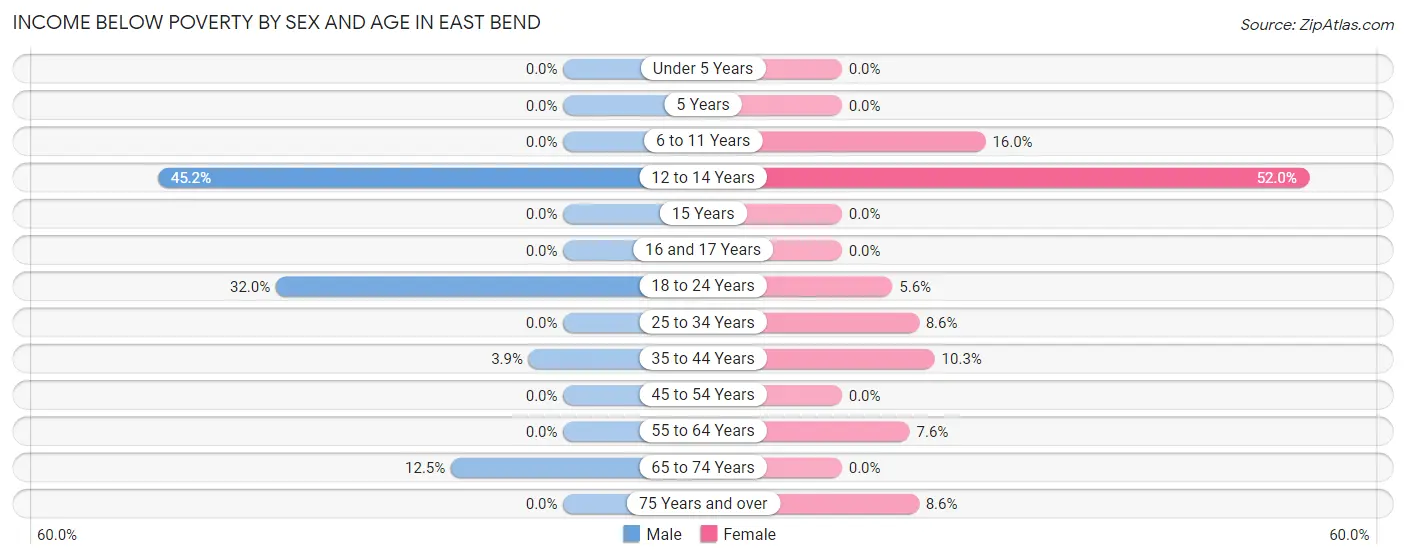
| Age Bracket | Male | Female |
| Under 5 Years | 0 (0.0%) | 0 (0.0%) |
| 5 Years | 0 (0.0%) | 0 (0.0%) |
| 6 to 11 Years | 0 (0.0%) | 4 (16.0%) |
| 12 to 14 Years | 14 (45.2%) | 13 (52.0%) |
| 15 Years | 0 (0.0%) | 0 (0.0%) |
| 16 and 17 Years | 0 (0.0%) | 0 (0.0%) |
| 18 to 24 Years | 24 (32.0%) | 4 (5.6%) |
| 25 to 34 Years | 0 (0.0%) | 3 (8.6%) |
| 35 to 44 Years | 2 (3.8%) | 9 (10.3%) |
| 45 to 54 Years | 0 (0.0%) | 0 (0.0%) |
| 55 to 64 Years | 0 (0.0%) | 4 (7.5%) |
| 65 to 74 Years | 2 (12.5%) | 0 (0.0%) |
| 75 Years and over | 0 (0.0%) | 3 (8.6%) |
| Total | 42 (12.1%) | 40 (10.8%) |
Income Above Poverty by Sex and Age in East Bend
According to the poverty statistics in East Bend, males aged under 5 years and females aged under 5 years are the age groups that are most secure financially, with 100.0% of males and 100.0% of females in these age groups living above the poverty line.
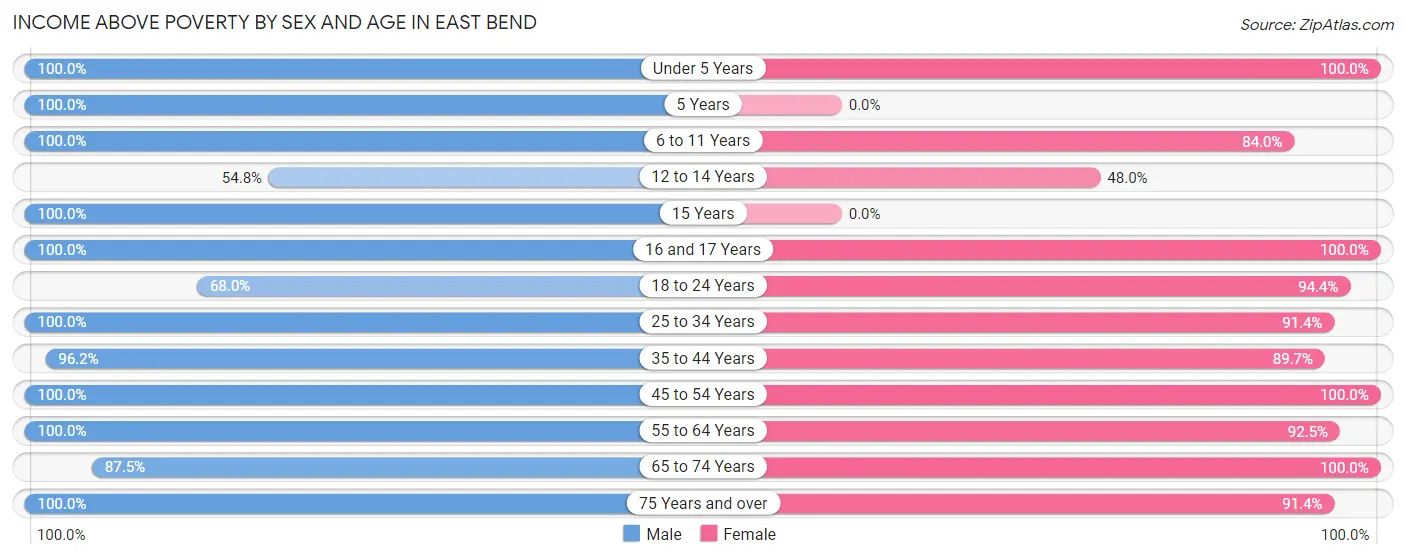
| Age Bracket | Male | Female |
| Under 5 Years | 11 (100.0%) | 6 (100.0%) |
| 5 Years | 2 (100.0%) | 0 (0.0%) |
| 6 to 11 Years | 28 (100.0%) | 21 (84.0%) |
| 12 to 14 Years | 17 (54.8%) | 12 (48.0%) |
| 15 Years | 8 (100.0%) | 0 (0.0%) |
| 16 and 17 Years | 5 (100.0%) | 1 (100.0%) |
| 18 to 24 Years | 51 (68.0%) | 67 (94.4%) |
| 25 to 34 Years | 37 (100.0%) | 32 (91.4%) |
| 35 to 44 Years | 50 (96.2%) | 78 (89.7%) |
| 45 to 54 Years | 38 (100.0%) | 17 (100.0%) |
| 55 to 64 Years | 29 (100.0%) | 49 (92.4%) |
| 65 to 74 Years | 14 (87.5%) | 16 (100.0%) |
| 75 Years and over | 15 (100.0%) | 32 (91.4%) |
| Total | 305 (87.9%) | 331 (89.2%) |
Income Below Poverty Among Married-Couple Families in East Bend
The poverty statistics for married-couple families in East Bend show that 3.0% or 4 of the total 131 families live below the poverty line. Families with 1 or 2 children have the highest poverty rate of 7.1%, comprising of 2 families. On the other hand, families with 3 or 4 children have the lowest poverty rate of 0.0%, which includes 0 families.
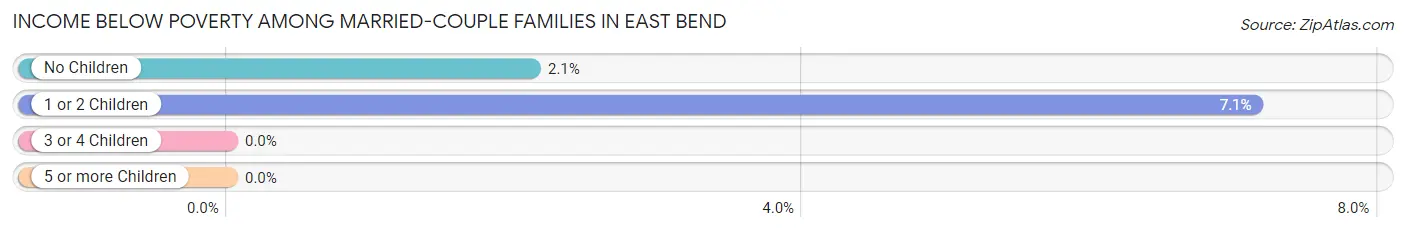
| Children | Above Poverty | Below Poverty |
| No Children | 93 (97.9%) | 2 (2.1%) |
| 1 or 2 Children | 26 (92.9%) | 2 (7.1%) |
| 3 or 4 Children | 6 (100.0%) | 0 (0.0%) |
| 5 or more Children | 2 (100.0%) | 0 (0.0%) |
| Total | 127 (97.0%) | 4 (3.0%) |
Income Below Poverty Among Single-Parent Households in East Bend
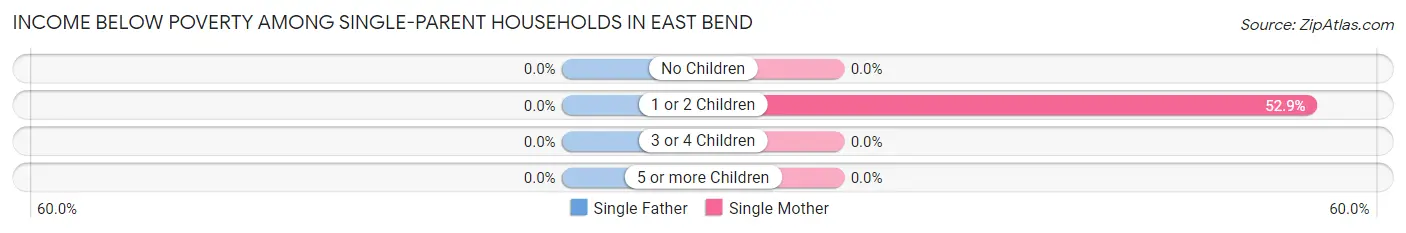
| Children | Single Father | Single Mother |
| No Children | 0 (0.0%) | 0 (0.0%) |
| 1 or 2 Children | 0 (0.0%) | 9 (52.9%) |
| 3 or 4 Children | 0 (0.0%) | 0 (0.0%) |
| 5 or more Children | 0 (0.0%) | 0 (0.0%) |
| Total | 0 (0.0%) | 9 (36.0%) |
Income Below Poverty Among Married-Couple vs Single-Parent Households in East Bend
The poverty data for East Bend shows that 4 of the married-couple family households (3.0%) and 9 of the single-parent households (25.0%) are living below the poverty level. Within the married-couple family households, those with 1 or 2 children have the highest poverty rate, with 2 households (7.1%) falling below the poverty line. Among the single-parent households, those with 1 or 2 children have the highest poverty rate, with 9 household (36.0%) living below poverty.
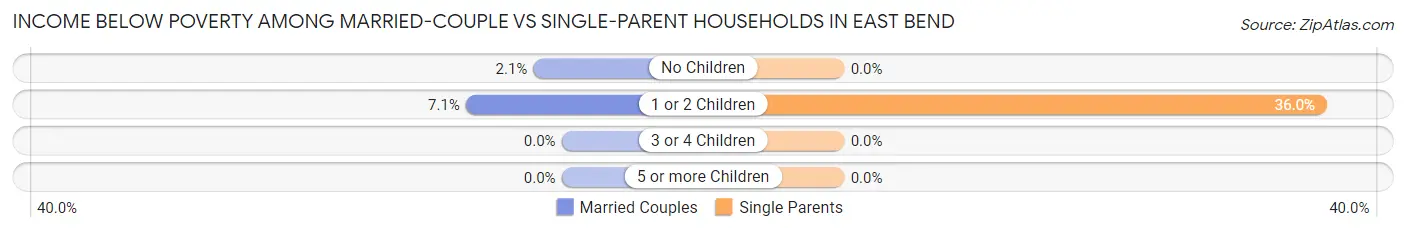
| Children | Married-Couple Families | Single-Parent Households |
| No Children | 2 (2.1%) | 0 (0.0%) |
| 1 or 2 Children | 2 (7.1%) | 9 (36.0%) |
| 3 or 4 Children | 0 (0.0%) | 0 (0.0%) |
| 5 or more Children | 0 (0.0%) | 0 (0.0%) |
| Total | 4 (3.0%) | 9 (25.0%) |
Race in East Bend
The most populous races in East Bend are White / Caucasian (644 | 86.9%), Hispanic or Latino (118 | 15.9%), and Some other Race (74 | 10.0%).
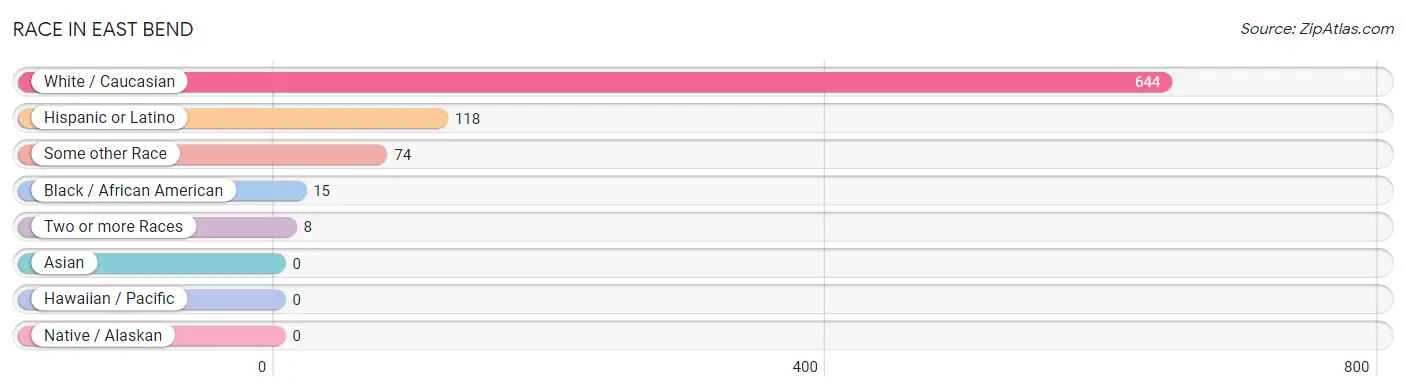
| Race | # Population | % Population |
| Asian | 0 | 0.0% |
| Black / African American | 15 | 2.0% |
| Hawaiian / Pacific | 0 | 0.0% |
| Hispanic or Latino | 118 | 15.9% |
| Native / Alaskan | 0 | 0.0% |
| White / Caucasian | 644 | 86.9% |
| Two or more Races | 8 | 1.1% |
| Some other Race | 74 | 10.0% |
| Total | 741 | 100.0% |
Ancestry in East Bend
The most populous ancestries reported in East Bend are American (160 | 21.6%), German (132 | 17.8%), Mexican (81 | 10.9%), Irish (63 | 8.5%), and Dutch (59 | 8.0%), together accounting for 66.8% of all East Bend residents.
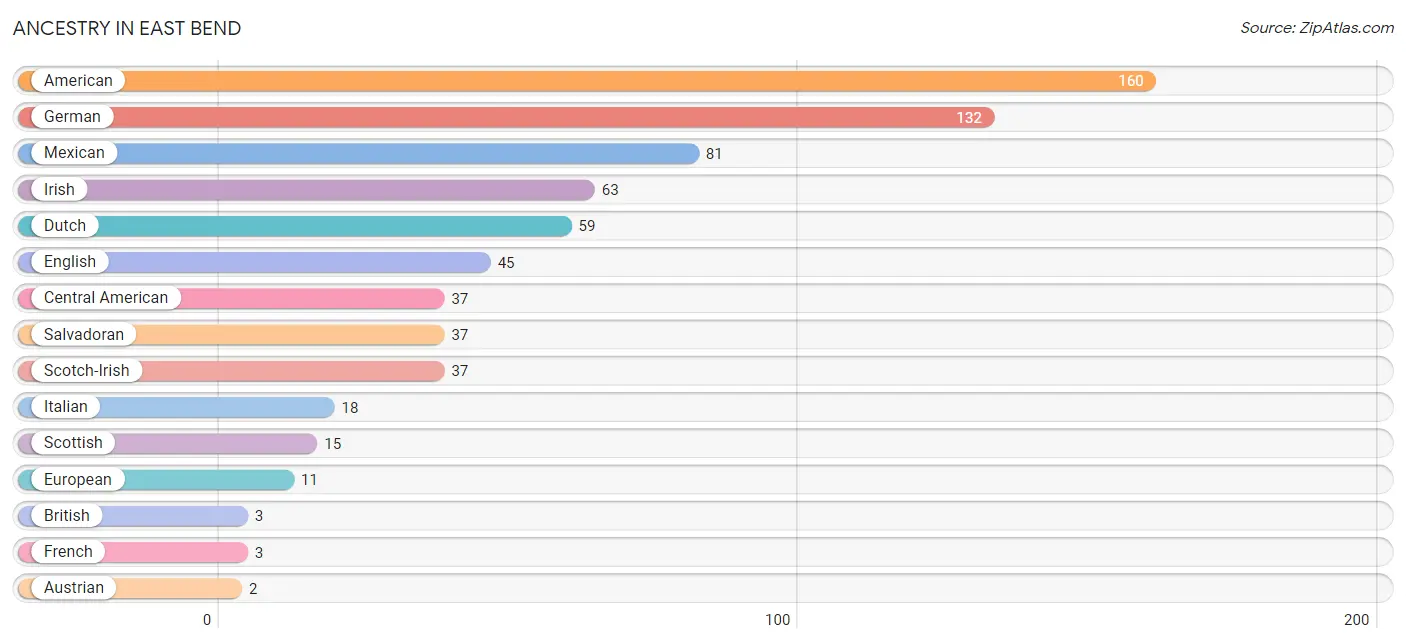
| Ancestry | # Population | % Population |
| American | 160 | 21.6% |
| Austrian | 2 | 0.3% |
| British | 3 | 0.4% |
| Central American | 37 | 5.0% |
| Dutch | 59 | 8.0% |
| English | 45 | 6.1% |
| European | 11 | 1.5% |
| French | 3 | 0.4% |
| German | 132 | 17.8% |
| Irish | 63 | 8.5% |
| Italian | 18 | 2.4% |
| Mexican | 81 | 10.9% |
| Norwegian | 2 | 0.3% |
| Salvadoran | 37 | 5.0% |
| Scotch-Irish | 37 | 5.0% |
| Scottish | 15 | 2.0% |
| Yugoslavian | 1 | 0.1% | View All 17 Rows |
Immigrants in East Bend
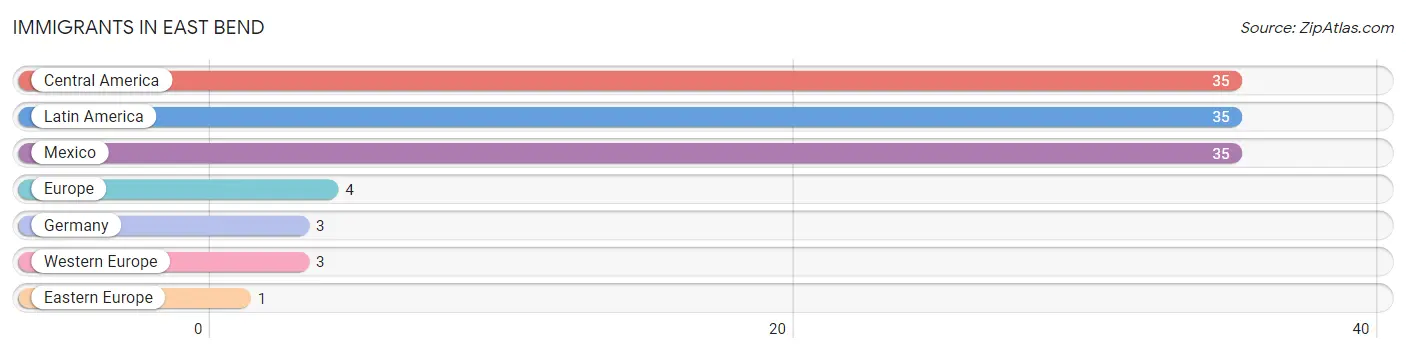
The most numerous immigrant groups reported in East Bend came from Central America (35 | 4.7%), Latin America (35 | 4.7%), Mexico (35 | 4.7%), Europe (4 | 0.5%), and Germany (3 | 0.4%), together accounting for 15.1% of all East Bend residents.
| Immigration Origin | # Population | % Population |
| Central America | 35 | 4.7% |
| Eastern Europe | 1 | 0.1% |
| Europe | 4 | 0.5% |
| Germany | 3 | 0.4% |
| Latin America | 35 | 4.7% |
| Mexico | 35 | 4.7% |
| Western Europe | 3 | 0.4% | View All 7 Rows |
Sex and Age in East Bend
Sex and Age in East Bend
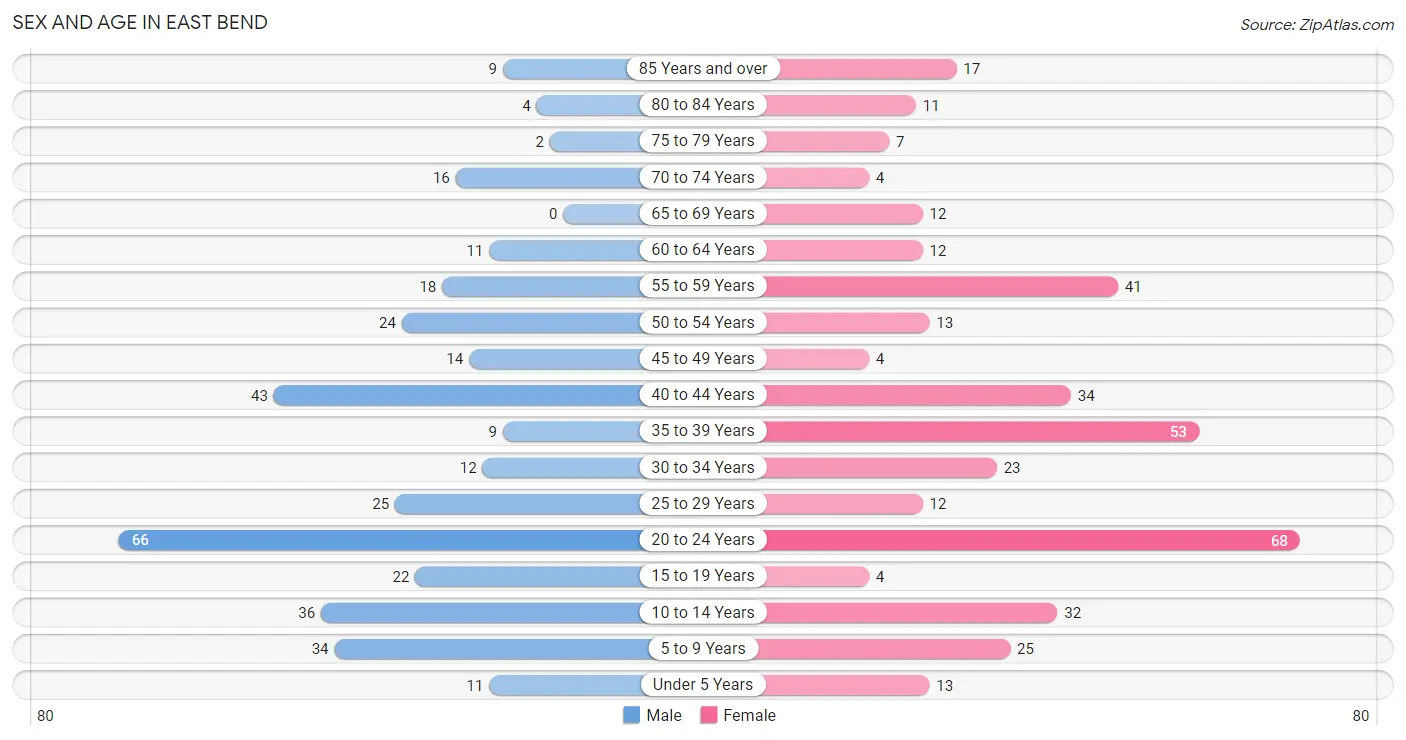
The most populous age groups in East Bend are 20 to 24 Years (66 | 18.5%) for men and 20 to 24 Years (68 | 17.7%) for women.
| Age Bracket | Male | Female |
| Under 5 Years | 11 (3.1%) | 13 (3.4%) |
| 5 to 9 Years | 34 (9.6%) | 25 (6.5%) |
| 10 to 14 Years | 36 (10.1%) | 32 (8.3%) |
| 15 to 19 Years | 22 (6.2%) | 4 (1.0%) |
| 20 to 24 Years | 66 (18.5%) | 68 (17.7%) |
| 25 to 29 Years | 25 (7.0%) | 12 (3.1%) |
| 30 to 34 Years | 12 (3.4%) | 23 (6.0%) |
| 35 to 39 Years | 9 (2.5%) | 53 (13.8%) |
| 40 to 44 Years | 43 (12.1%) | 34 (8.8%) |
| 45 to 49 Years | 14 (3.9%) | 4 (1.0%) |
| 50 to 54 Years | 24 (6.7%) | 13 (3.4%) |
| 55 to 59 Years | 18 (5.1%) | 41 (10.6%) |
| 60 to 64 Years | 11 (3.1%) | 12 (3.1%) |
| 65 to 69 Years | 0 (0.0%) | 12 (3.1%) |
| 70 to 74 Years | 16 (4.5%) | 4 (1.0%) |
| 75 to 79 Years | 2 (0.6%) | 7 (1.8%) |
| 80 to 84 Years | 4 (1.1%) | 11 (2.9%) |
| 85 Years and over | 9 (2.5%) | 17 (4.4%) |
| Total | 356 (100.0%) | 385 (100.0%) |
Families and Households in East Bend
Median Family Size in East Bend
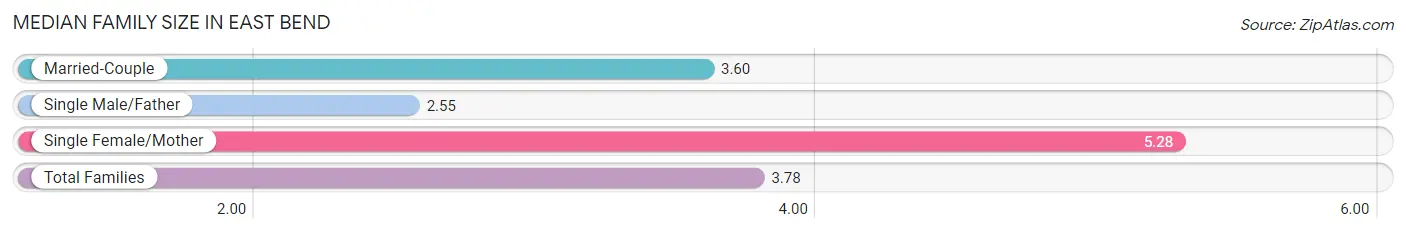
The median family size in East Bend is 3.78 persons per family, with single female/mother families (25 | 15.0%) accounting for the largest median family size of 5.28 persons per family. On the other hand, single male/father families (11 | 6.6%) represent the smallest median family size with 2.55 persons per family.
| Family Type | # Families | Family Size |
| Married-Couple | 131 (78.4%) | 3.60 |
| Single Male/Father | 11 (6.6%) | 2.55 |
| Single Female/Mother | 25 (15.0%) | 5.28 |
| Total Families | 167 (100.0%) | 3.78 |
Median Household Size in East Bend
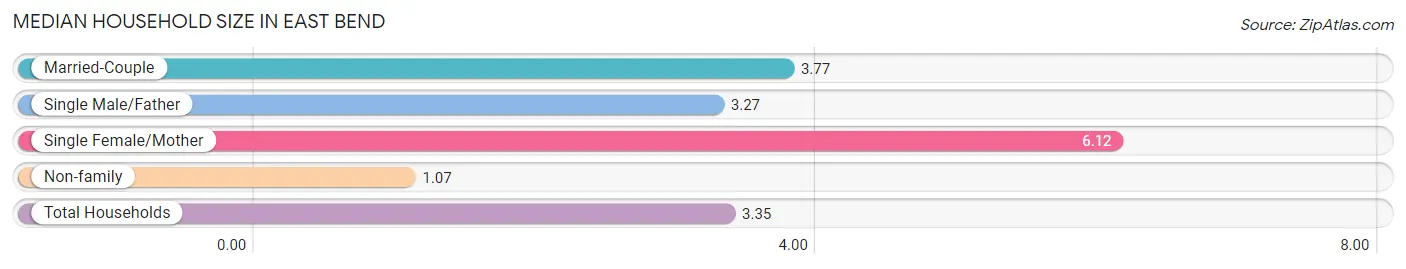
The median household size in East Bend is 3.35 persons per household, with single female/mother households (25 | 11.3%) accounting for the largest median household size of 6.12 persons per household. non-family households (54 | 24.4%) represent the smallest median household size with 1.07 persons per household.
| Household Type | # Households | Household Size |
| Married-Couple | 131 (59.3%) | 3.77 |
| Single Male/Father | 11 (5.0%) | 3.27 |
| Single Female/Mother | 25 (11.3%) | 6.12 |
| Non-family | 54 (24.4%) | 1.07 |
| Total Households | 221 (100.0%) | 3.35 |
Household Size by Marriage Status in East Bend
Out of a total of 221 households in East Bend, 167 (75.6%) are family households, while 54 (24.4%) are nonfamily households. The most numerous type of family households are 2-person households, comprising 71, and the most common type of nonfamily households are 1-person households, comprising 47.
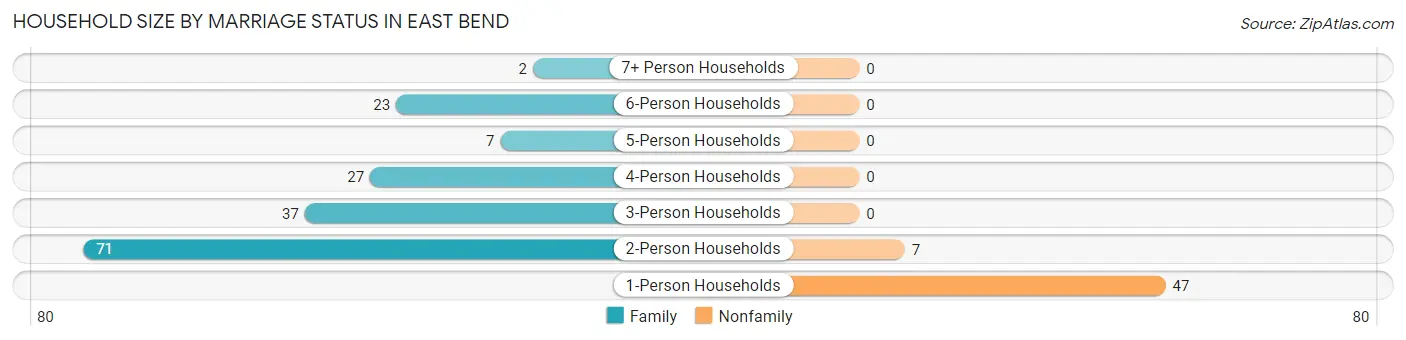
| Household Size | Family Households | Nonfamily Households |
| 1-Person Households | - | 47 (21.3%) |
| 2-Person Households | 71 (32.1%) | 7 (3.2%) |
| 3-Person Households | 37 (16.7%) | 0 (0.0%) |
| 4-Person Households | 27 (12.2%) | 0 (0.0%) |
| 5-Person Households | 7 (3.2%) | 0 (0.0%) |
| 6-Person Households | 23 (10.4%) | 0 (0.0%) |
| 7+ Person Households | 2 (0.9%) | 0 (0.0%) |
| Total | 167 (75.6%) | 54 (24.4%) |
Female Fertility in East Bend
Fertility by Age in East Bend
Average fertility rate in East Bend is 39.0 births per 1,000 women. Women in the age bracket of 35 to 50 years have the highest fertility rate with 52.0 births per 1,000 women. Women in the age bracket of 35 to 50 years acount for 62.5% of all women with births.
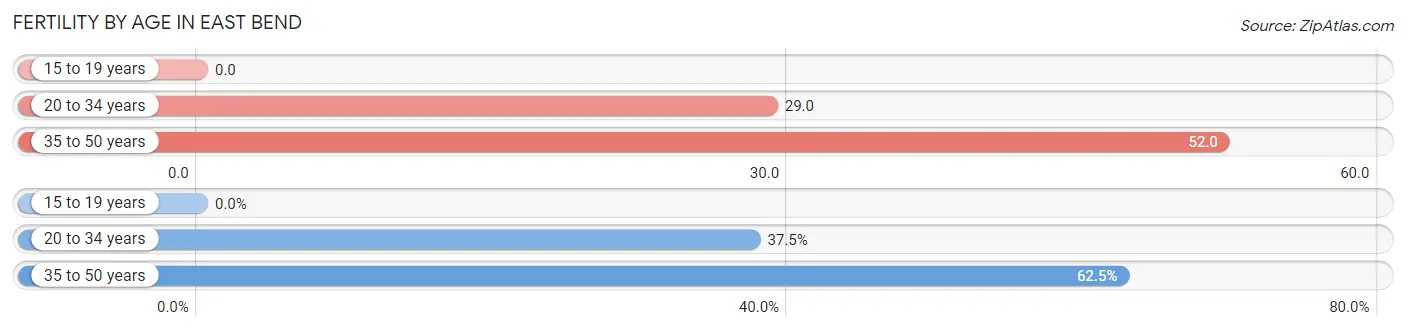
| Age Bracket | Women with Births | Births / 1,000 Women |
| 15 to 19 years | 0 (0.0%) | 0.0 |
| 20 to 34 years | 3 (37.5%) | 29.0 |
| 35 to 50 years | 5 (62.5%) | 52.0 |
| Total | 8 (100.0%) | 39.0 |
Fertility by Age by Marriage Status in East Bend
37.5% of women with births (8) in East Bend are married. The highest percentage of unmarried women with births falls into 35 to 50 years age bracket with 100.0% of them unmarried at the time of birth, while the lowest percentage of unmarried women with births belong to 20 to 34 years age bracket with 0.0% of them unmarried.
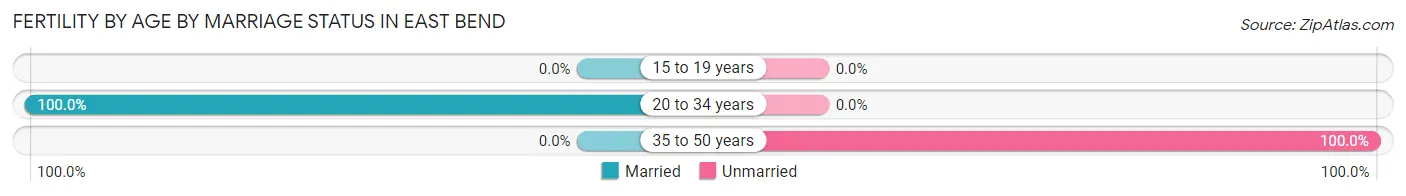
| Age Bracket | Married | Unmarried |
| 15 to 19 years | 0 (0.0%) | 0 (0.0%) |
| 20 to 34 years | 3 (100.0%) | 0 (0.0%) |
| 35 to 50 years | 0 (0.0%) | 5 (100.0%) |
| Total | 3 (37.5%) | 5 (62.5%) |
Fertility by Education in East Bend
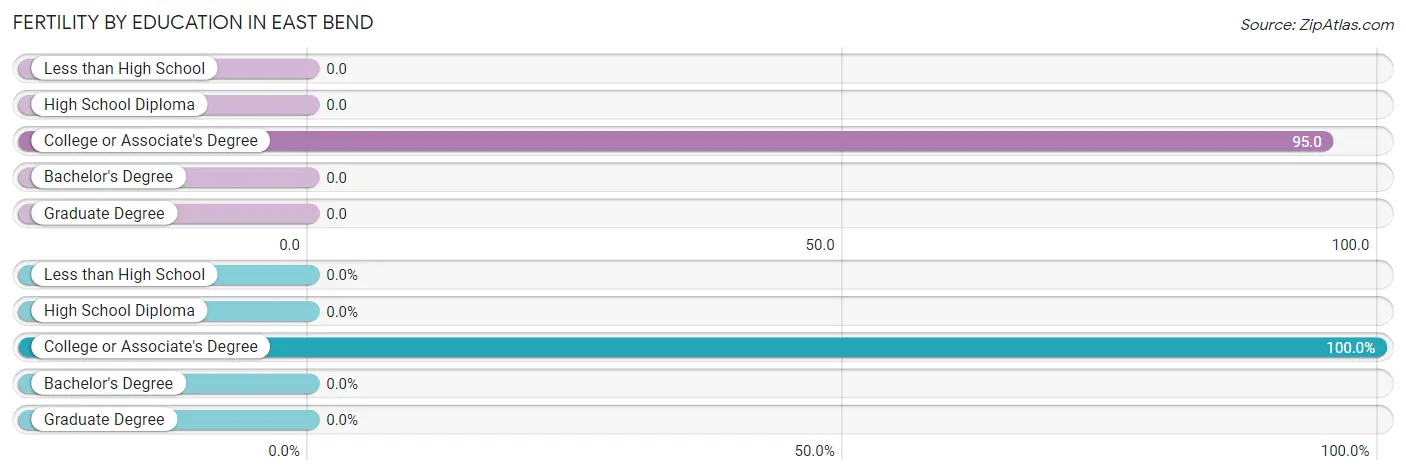
| Educational Attainment | Women with Births | Births / 1,000 Women |
| Less than High School | 0 (0.0%) | 0.0 |
| High School Diploma | 0 (0.0%) | 0.0 |
| College or Associate's Degree | 8 (100.0%) | 95.0 |
| Bachelor's Degree | 0 (0.0%) | 0.0 |
| Graduate Degree | 0 (0.0%) | 0.0 |
| Total | 8 (100.0%) | 39.0 |
Fertility by Education by Marriage Status in East Bend
62.5% of women with births in East Bend are unmarried. Women with the educational attainment of college or associate's degree are most likely to be married with 37.5% of them married at childbirth, while women with the educational attainment of college or associate's degree are least likely to be married with 62.5% of them unmarried at childbirth.
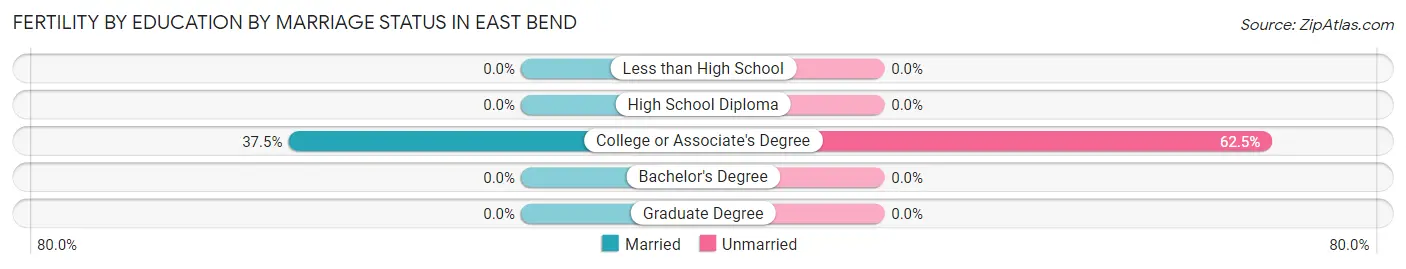
| Educational Attainment | Married | Unmarried |
| Less than High School | 0 (0.0%) | 0 (0.0%) |
| High School Diploma | 0 (0.0%) | 0 (0.0%) |
| College or Associate's Degree | 3 (37.5%) | 5 (62.5%) |
| Bachelor's Degree | 0 (0.0%) | 0 (0.0%) |
| Graduate Degree | 0 (0.0%) | 0 (0.0%) |
| Total | 3 (37.5%) | 5 (62.5%) |
Employment Characteristics in East Bend
Employment by Class of Employer in East Bend
Among the 362 employed individuals in East Bend, private company employees (306 | 84.5%), not-for-profit organizations (30 | 8.3%), and self-employed (not incorporated) (13 | 3.6%) make up the most common classes of employment.
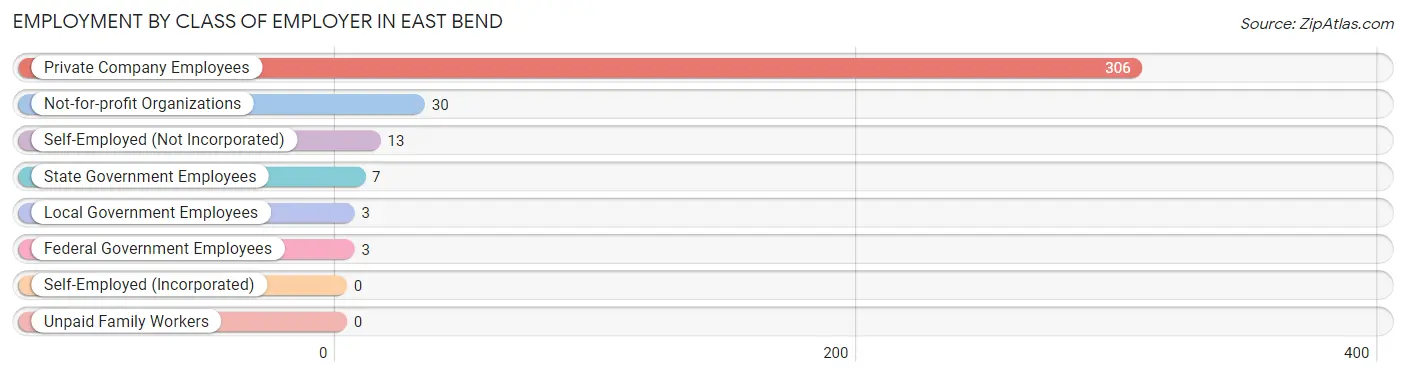
| Employer Class | # Employees | % Employees |
| Private Company Employees | 306 | 84.5% |
| Self-Employed (Incorporated) | 0 | 0.0% |
| Self-Employed (Not Incorporated) | 13 | 3.6% |
| Not-for-profit Organizations | 30 | 8.3% |
| Local Government Employees | 3 | 0.8% |
| State Government Employees | 7 | 1.9% |
| Federal Government Employees | 3 | 0.8% |
| Unpaid Family Workers | 0 | 0.0% |
| Total | 362 | 100.0% |
Employment Status by Age in East Bend
According to the labor force statistics for East Bend, out of the total population over 16 years of age (582), 65.5% or 381 individuals are in the labor force, with 4.2% or 16 of them unemployed. The age group with the highest labor force participation rate is 25 to 29 years, with 100.0% or 37 individuals in the labor force. Within the labor force, the 16 to 19 years age range has the highest percentage of unemployed individuals, with 18.2% or 2 of them being unemployed.
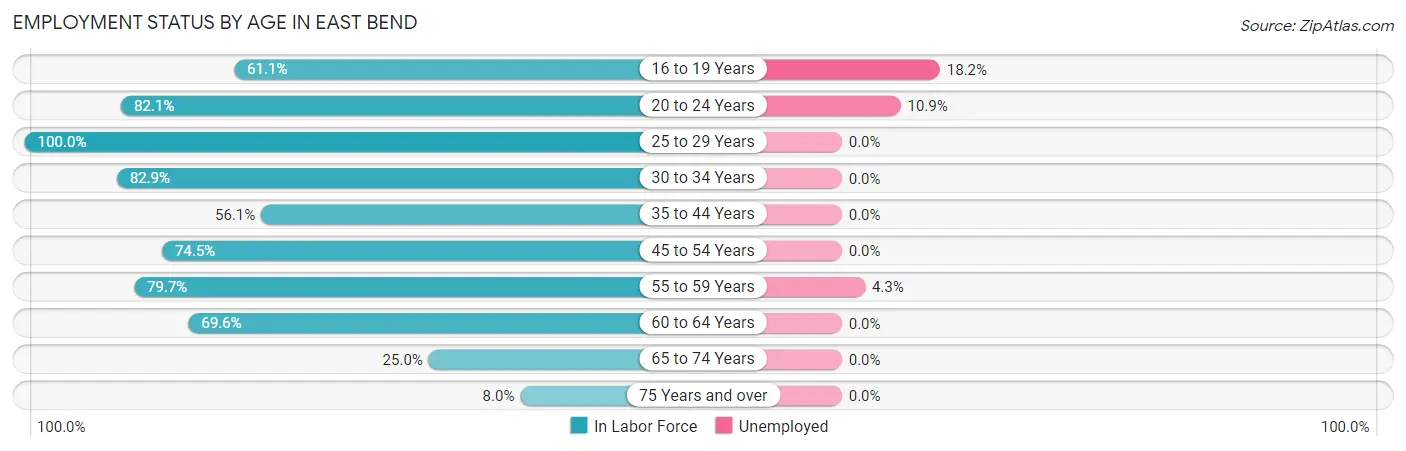
| Age Bracket | In Labor Force | Unemployed |
| 16 to 19 Years | 11 (61.1%) | 2 (18.2%) |
| 20 to 24 Years | 110 (82.1%) | 12 (10.9%) |
| 25 to 29 Years | 37 (100.0%) | 0 (0.0%) |
| 30 to 34 Years | 29 (82.9%) | 0 (0.0%) |
| 35 to 44 Years | 78 (56.1%) | 0 (0.0%) |
| 45 to 54 Years | 41 (74.5%) | 0 (0.0%) |
| 55 to 59 Years | 47 (79.7%) | 2 (4.3%) |
| 60 to 64 Years | 16 (69.6%) | 0 (0.0%) |
| 65 to 74 Years | 8 (25.0%) | 0 (0.0%) |
| 75 Years and over | 4 (8.0%) | 0 (0.0%) |
| Total | 381 (65.5%) | 16 (4.2%) |
Employment Status by Educational Attainment in East Bend
According to labor force statistics for East Bend, 71.3% of individuals (248) out of the total population between 25 and 64 years of age (348) are in the labor force, with 0.8% or 2 of them being unemployed. The group with the highest labor force participation rate are those with the educational attainment of less than high school, with 88.2% or 15 individuals in the labor force. Within the labor force, individuals with less than high school education have the highest percentage of unemployment, with 13.3% or 2 of them being unemployed.
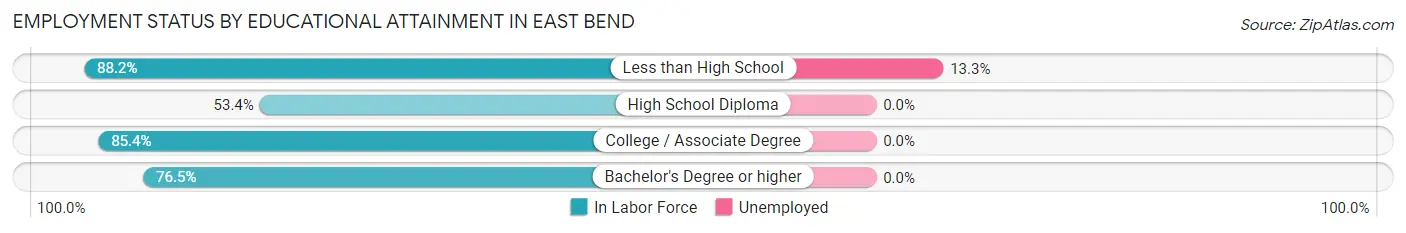
| Educational Attainment | In Labor Force | Unemployed |
| Less than High School | 15 (88.2%) | 2 (13.3%) |
| High School Diploma | 78 (53.4%) | 0 (0.0%) |
| College / Associate Degree | 129 (85.4%) | 0 (0.0%) |
| Bachelor's Degree or higher | 26 (76.5%) | 0 (0.0%) |
| Total | 248 (71.3%) | 3 (0.8%) |
Employment Occupations by Sex in East Bend
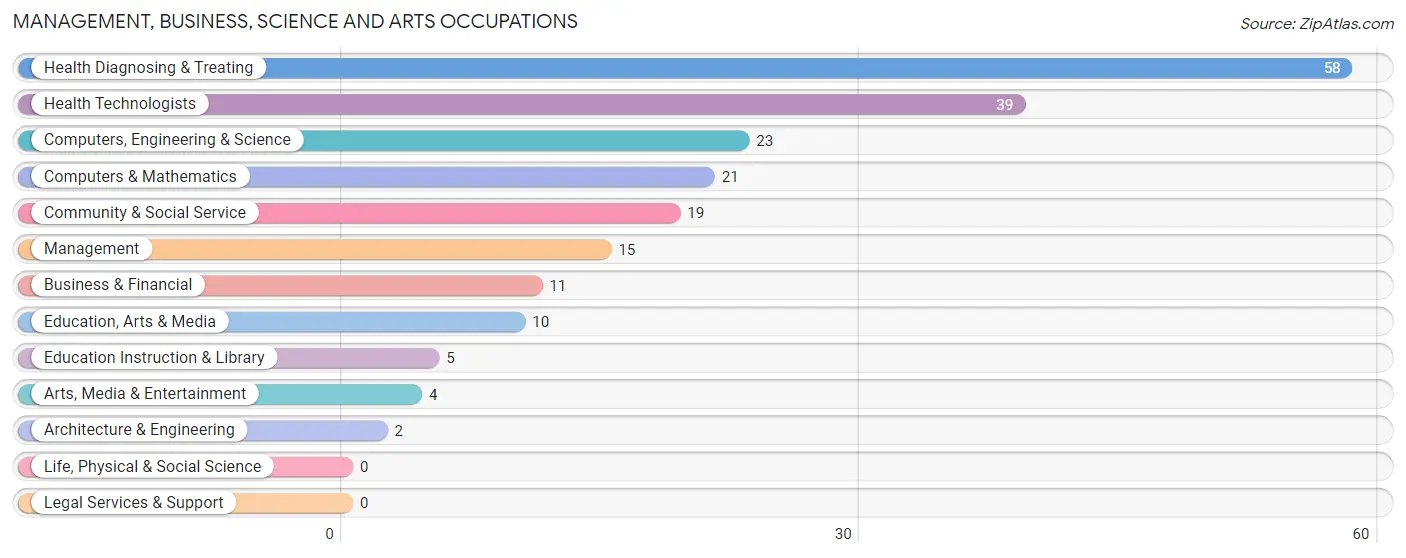
Management, Business, Science and Arts Occupations
The most common Management, Business, Science and Arts occupations in East Bend are Health Diagnosing & Treating (58 | 15.9%), Health Technologists (39 | 10.7%), Computers, Engineering & Science (23 | 6.3%), Computers & Mathematics (21 | 5.8%), and Community & Social Service (19 | 5.2%).
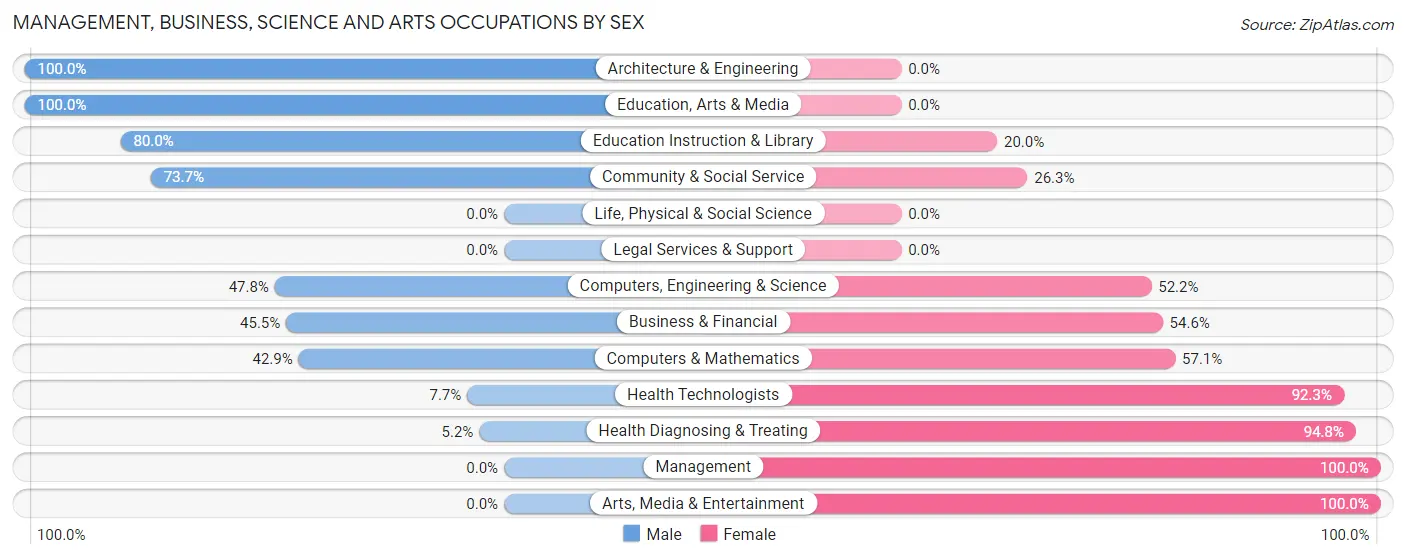
Management, Business, Science and Arts Occupations by Sex
Within the Management, Business, Science and Arts occupations in East Bend, the most male-oriented occupations are Architecture & Engineering (100.0%), Education, Arts & Media (100.0%), and Education Instruction & Library (80.0%), while the most female-oriented occupations are Management (100.0%), Arts, Media & Entertainment (100.0%), and Health Diagnosing & Treating (94.8%).
| Occupation | Male | Female |
| Management | 0 (0.0%) | 15 (100.0%) |
| Business & Financial | 5 (45.5%) | 6 (54.5%) |
| Computers, Engineering & Science | 11 (47.8%) | 12 (52.2%) |
| Computers & Mathematics | 9 (42.9%) | 12 (57.1%) |
| Architecture & Engineering | 2 (100.0%) | 0 (0.0%) |
| Life, Physical & Social Science | 0 (0.0%) | 0 (0.0%) |
| Community & Social Service | 14 (73.7%) | 5 (26.3%) |
| Education, Arts & Media | 10 (100.0%) | 0 (0.0%) |
| Legal Services & Support | 0 (0.0%) | 0 (0.0%) |
| Education Instruction & Library | 4 (80.0%) | 1 (20.0%) |
| Arts, Media & Entertainment | 0 (0.0%) | 4 (100.0%) |
| Health Diagnosing & Treating | 3 (5.2%) | 55 (94.8%) |
| Health Technologists | 3 (7.7%) | 36 (92.3%) |
| Total (Category) | 33 (26.2%) | 93 (73.8%) |
| Total (Overall) | 196 (53.7%) | 169 (46.3%) |
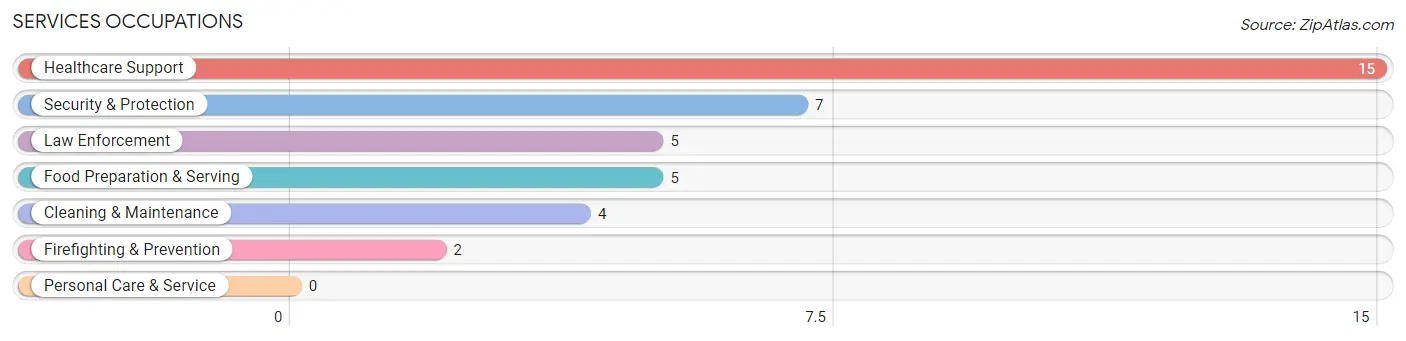
Services Occupations
The most common Services occupations in East Bend are Healthcare Support (15 | 4.1%), Security & Protection (7 | 1.9%), Law Enforcement (5 | 1.4%), Food Preparation & Serving (5 | 1.4%), and Cleaning & Maintenance (4 | 1.1%).
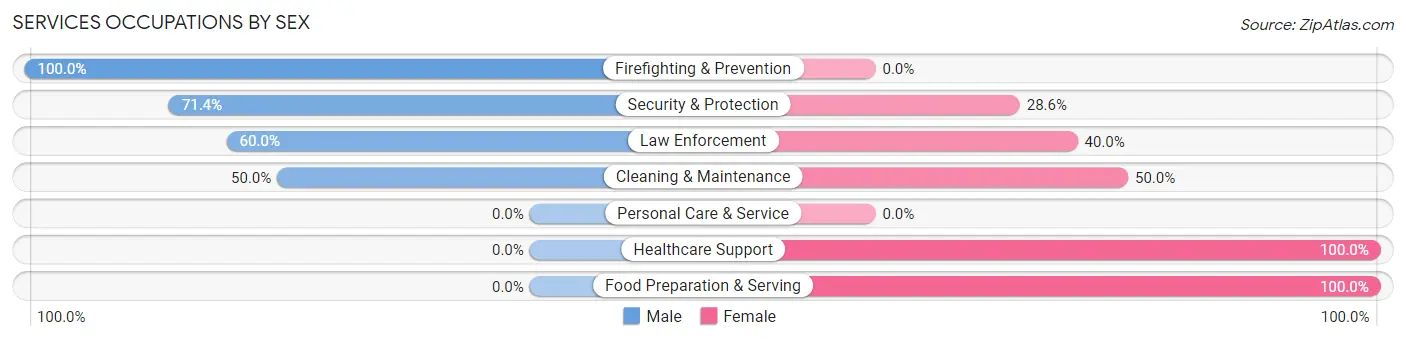
Services Occupations by Sex
Within the Services occupations in East Bend, the most male-oriented occupations are Firefighting & Prevention (100.0%), Security & Protection (71.4%), and Law Enforcement (60.0%), while the most female-oriented occupations are Healthcare Support (100.0%), Food Preparation & Serving (100.0%), and Cleaning & Maintenance (50.0%).
| Occupation | Male | Female |
| Healthcare Support | 0 (0.0%) | 15 (100.0%) |
| Security & Protection | 5 (71.4%) | 2 (28.6%) |
| Firefighting & Prevention | 2 (100.0%) | 0 (0.0%) |
| Law Enforcement | 3 (60.0%) | 2 (40.0%) |
| Food Preparation & Serving | 0 (0.0%) | 5 (100.0%) |
| Cleaning & Maintenance | 2 (50.0%) | 2 (50.0%) |
| Personal Care & Service | 0 (0.0%) | 0 (0.0%) |
| Total (Category) | 7 (22.6%) | 24 (77.4%) |
| Total (Overall) | 196 (53.7%) | 169 (46.3%) |
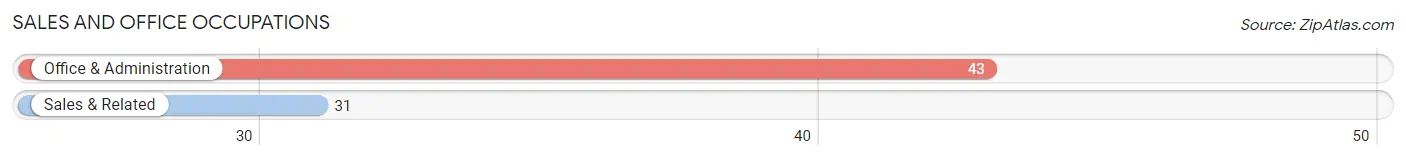
Sales and Office Occupations
The most common Sales and Office occupations in East Bend are Office & Administration (43 | 11.8%), and Sales & Related (31 | 8.5%).
Sales and Office Occupations by Sex
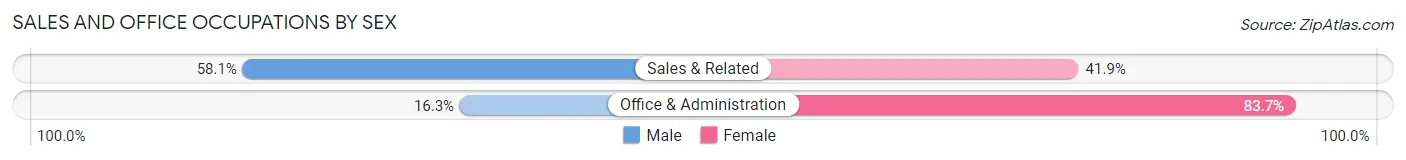
| Occupation | Male | Female |
| Sales & Related | 18 (58.1%) | 13 (41.9%) |
| Office & Administration | 7 (16.3%) | 36 (83.7%) |
| Total (Category) | 25 (33.8%) | 49 (66.2%) |
| Total (Overall) | 196 (53.7%) | 169 (46.3%) |
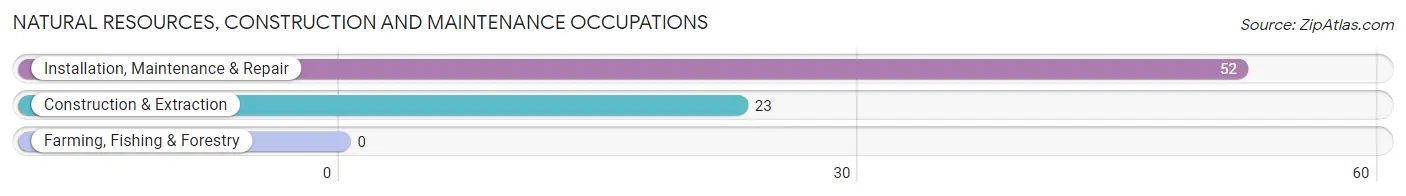
Natural Resources, Construction and Maintenance Occupations
The most common Natural Resources, Construction and Maintenance occupations in East Bend are Installation, Maintenance & Repair (52 | 14.2%), and Construction & Extraction (23 | 6.3%).
Natural Resources, Construction and Maintenance Occupations by Sex
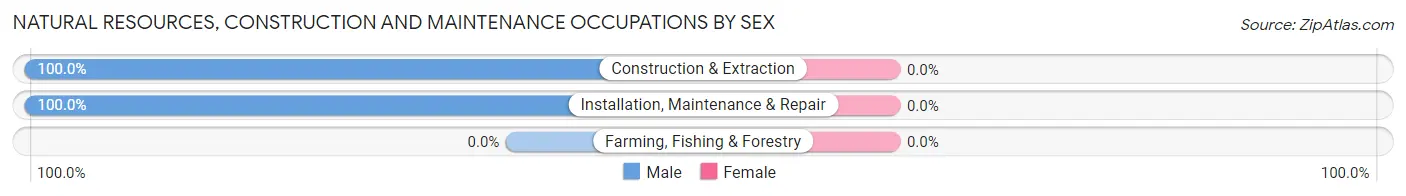
| Occupation | Male | Female |
| Farming, Fishing & Forestry | 0 (0.0%) | 0 (0.0%) |
| Construction & Extraction | 23 (100.0%) | 0 (0.0%) |
| Installation, Maintenance & Repair | 52 (100.0%) | 0 (0.0%) |
| Total (Category) | 75 (100.0%) | 0 (0.0%) |
| Total (Overall) | 196 (53.7%) | 169 (46.3%) |
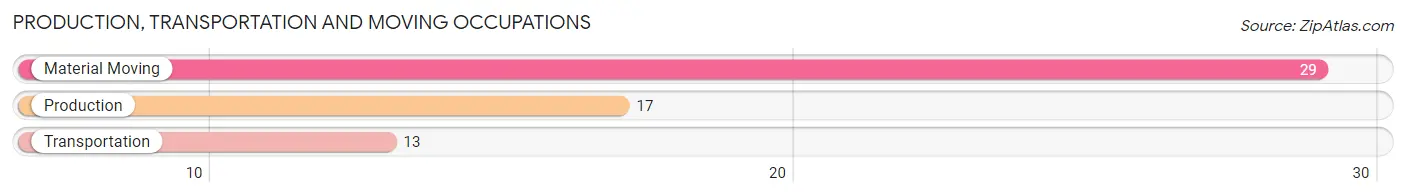
Production, Transportation and Moving Occupations
The most common Production, Transportation and Moving occupations in East Bend are Material Moving (29 | 8.0%), Production (17 | 4.7%), and Transportation (13 | 3.6%).
Production, Transportation and Moving Occupations by Sex
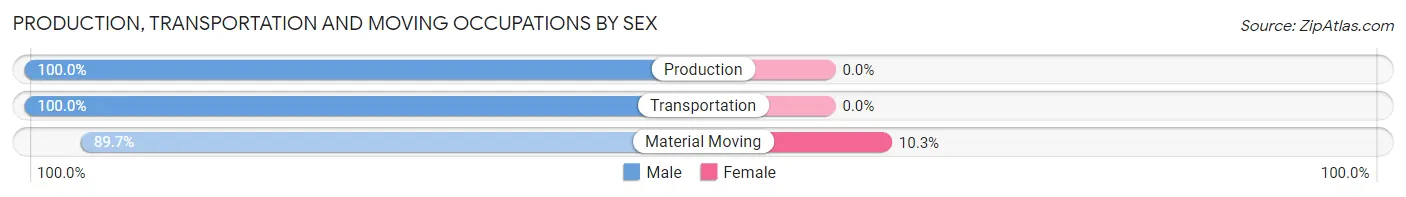
| Occupation | Male | Female |
| Production | 17 (100.0%) | 0 (0.0%) |
| Transportation | 13 (100.0%) | 0 (0.0%) |
| Material Moving | 26 (89.7%) | 3 (10.3%) |
| Total (Category) | 56 (94.9%) | 3 (5.1%) |
| Total (Overall) | 196 (53.7%) | 169 (46.3%) |
Employment Industries by Sex in East Bend
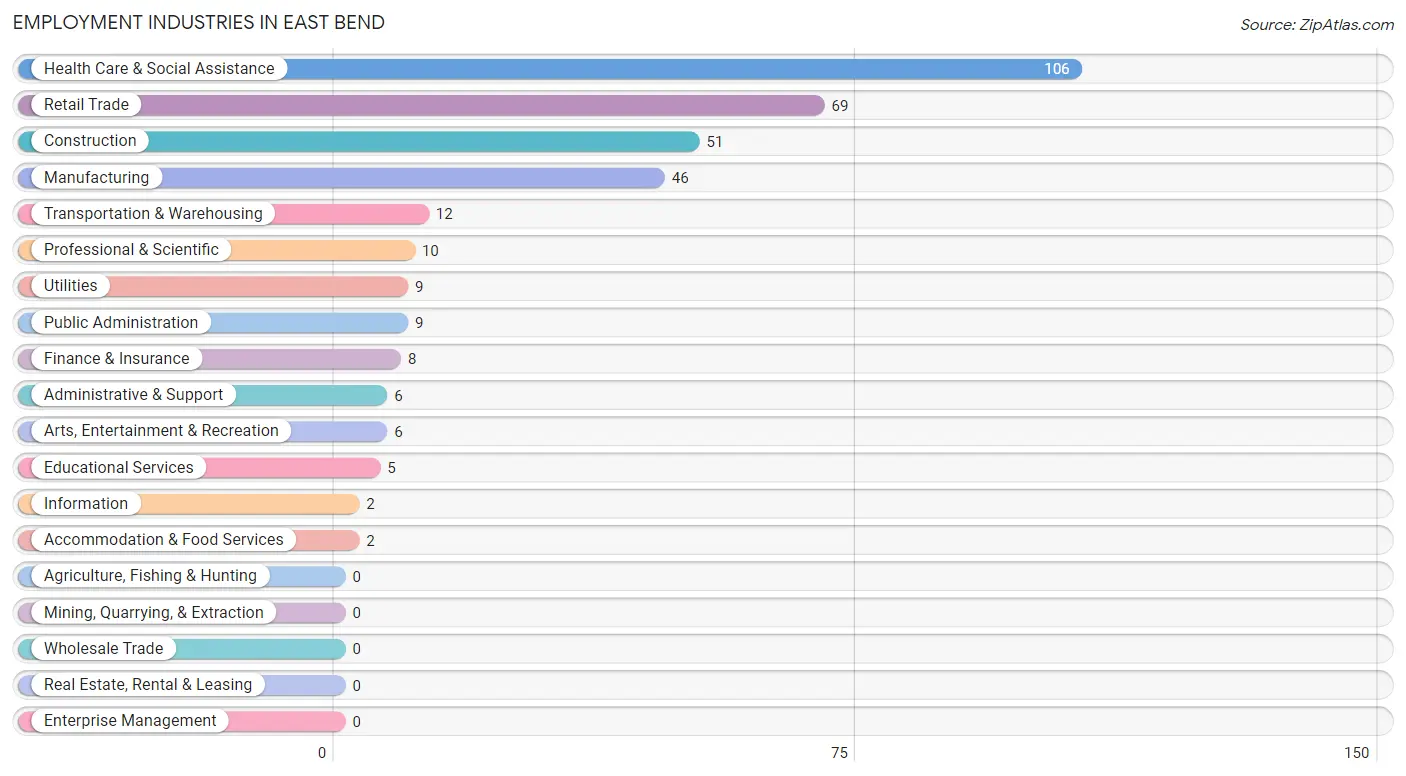
Employment Industries in East Bend
The major employment industries in East Bend include Health Care & Social Assistance (106 | 29.0%), Retail Trade (69 | 18.9%), Construction (51 | 14.0%), Manufacturing (46 | 12.6%), and Transportation & Warehousing (12 | 3.3%).
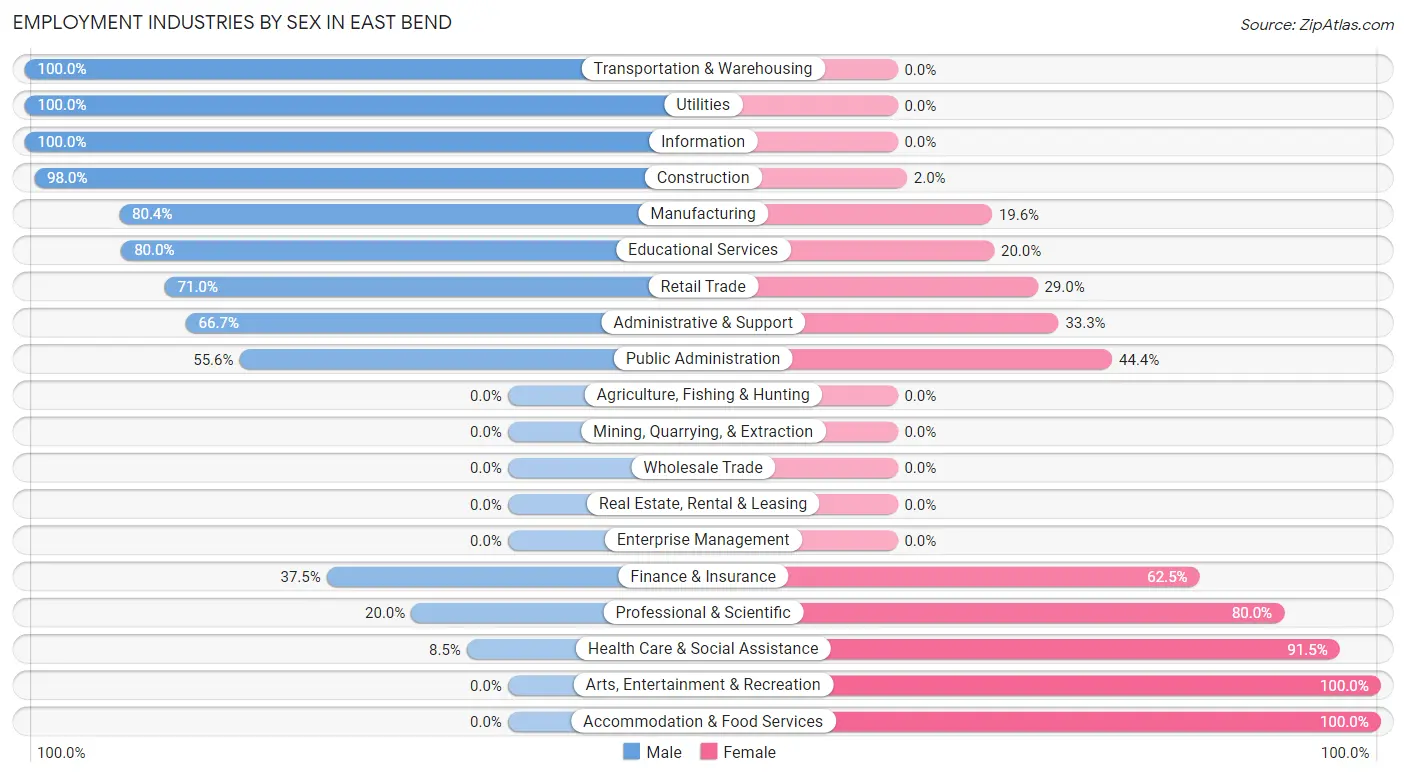
Employment Industries by Sex in East Bend
The East Bend industries that see more men than women are Transportation & Warehousing (100.0%), Utilities (100.0%), and Information (100.0%), whereas the industries that tend to have a higher number of women are Arts, Entertainment & Recreation (100.0%), Accommodation & Food Services (100.0%), and Health Care & Social Assistance (91.5%).
| Industry | Male | Female |
| Agriculture, Fishing & Hunting | 0 (0.0%) | 0 (0.0%) |
| Mining, Quarrying, & Extraction | 0 (0.0%) | 0 (0.0%) |
| Construction | 50 (98.0%) | 1 (2.0%) |
| Manufacturing | 37 (80.4%) | 9 (19.6%) |
| Wholesale Trade | 0 (0.0%) | 0 (0.0%) |
| Retail Trade | 49 (71.0%) | 20 (29.0%) |
| Transportation & Warehousing | 12 (100.0%) | 0 (0.0%) |
| Utilities | 9 (100.0%) | 0 (0.0%) |
| Information | 2 (100.0%) | 0 (0.0%) |
| Finance & Insurance | 3 (37.5%) | 5 (62.5%) |
| Real Estate, Rental & Leasing | 0 (0.0%) | 0 (0.0%) |
| Professional & Scientific | 2 (20.0%) | 8 (80.0%) |
| Enterprise Management | 0 (0.0%) | 0 (0.0%) |
| Administrative & Support | 4 (66.7%) | 2 (33.3%) |
| Educational Services | 4 (80.0%) | 1 (20.0%) |
| Health Care & Social Assistance | 9 (8.5%) | 97 (91.5%) |
| Arts, Entertainment & Recreation | 0 (0.0%) | 6 (100.0%) |
| Accommodation & Food Services | 0 (0.0%) | 2 (100.0%) |
| Public Administration | 5 (55.6%) | 4 (44.4%) |
| Total | 196 (53.7%) | 169 (46.3%) |
Education in East Bend
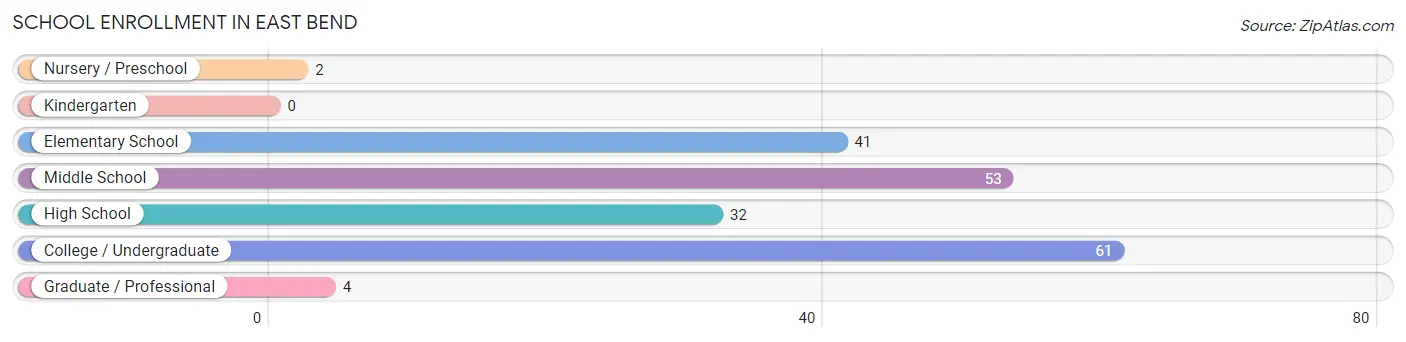
School Enrollment in East Bend
The most common levels of schooling among the 193 students in East Bend are college / undergraduate (61 | 31.6%), middle school (53 | 27.5%), and elementary school (41 | 21.2%).
| School Level | # Students | % Students |
| Nursery / Preschool | 2 | 1.0% |
| Kindergarten | 0 | 0.0% |
| Elementary School | 41 | 21.2% |
| Middle School | 53 | 27.5% |
| High School | 32 | 16.6% |
| College / Undergraduate | 61 | 31.6% |
| Graduate / Professional | 4 | 2.1% |
| Total | 193 | 100.0% |
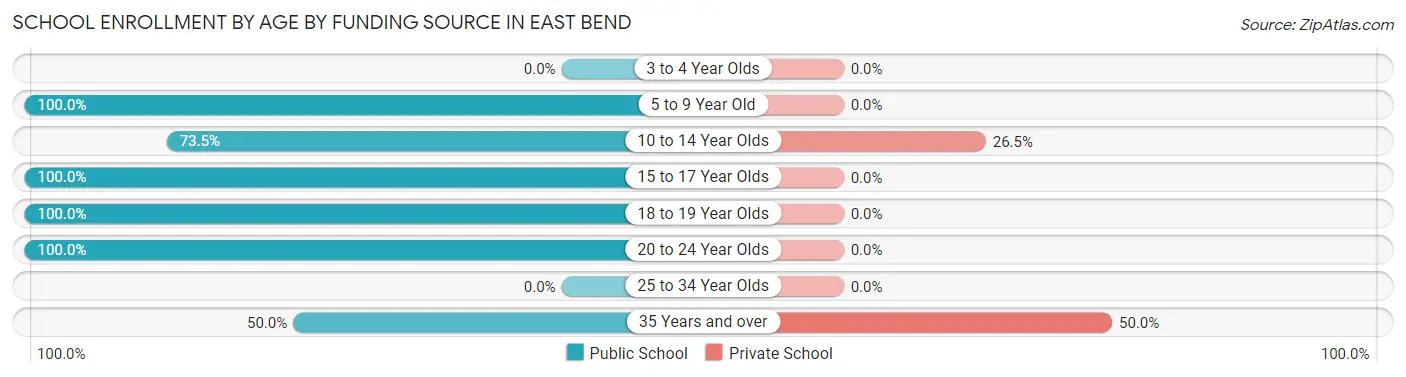
School Enrollment by Age by Funding Source in East Bend
Out of a total of 193 students who are enrolled in schools in East Bend, 22 (11.4%) attend a private institution, while the remaining 171 (88.6%) are enrolled in public schools. The age group of 35 years and over has the highest likelihood of being enrolled in private schools, with 4 (50.0% in the age bracket) enrolled. Conversely, the age group of 5 to 9 year old has the lowest likelihood of being enrolled in a private school, with 43 (100.0% in the age bracket) attending a public institution.
| Age Bracket | Public School | Private School |
| 3 to 4 Year Olds | 0 (0.0%) | 0 (0.0%) |
| 5 to 9 Year Old | 43 (100.0%) | 0 (0.0%) |
| 10 to 14 Year Olds | 50 (73.5%) | 18 (26.5%) |
| 15 to 17 Year Olds | 14 (100.0%) | 0 (0.0%) |
| 18 to 19 Year Olds | 3 (100.0%) | 0 (0.0%) |
| 20 to 24 Year Olds | 57 (100.0%) | 0 (0.0%) |
| 25 to 34 Year Olds | 0 (0.0%) | 0 (0.0%) |
| 35 Years and over | 4 (50.0%) | 4 (50.0%) |
| Total | 171 (88.6%) | 22 (11.4%) |
Educational Attainment by Field of Study in East Bend
Science & technology (10 | 23.3%), education (8 | 18.6%), arts & humanities (7 | 16.3%), liberal arts & history (5 | 11.6%), and psychology (4 | 9.3%) are the most common fields of study among 43 individuals in East Bend who have obtained a bachelor's degree or higher.
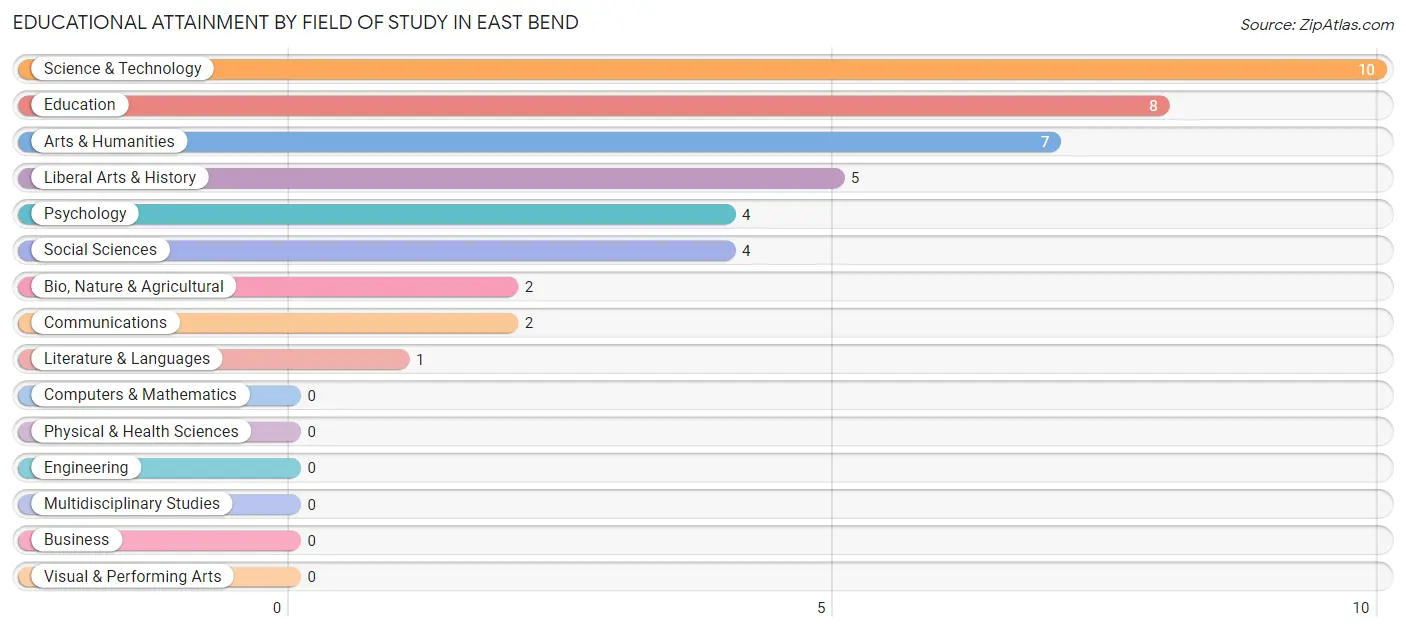
| Field of Study | # Graduates | % Graduates |
| Computers & Mathematics | 0 | 0.0% |
| Bio, Nature & Agricultural | 2 | 4.6% |
| Physical & Health Sciences | 0 | 0.0% |
| Psychology | 4 | 9.3% |
| Social Sciences | 4 | 9.3% |
| Engineering | 0 | 0.0% |
| Multidisciplinary Studies | 0 | 0.0% |
| Science & Technology | 10 | 23.3% |
| Business | 0 | 0.0% |
| Education | 8 | 18.6% |
| Literature & Languages | 1 | 2.3% |
| Liberal Arts & History | 5 | 11.6% |
| Visual & Performing Arts | 0 | 0.0% |
| Communications | 2 | 4.6% |
| Arts & Humanities | 7 | 16.3% |
| Total | 43 | 100.0% |
Transportation & Commute in East Bend
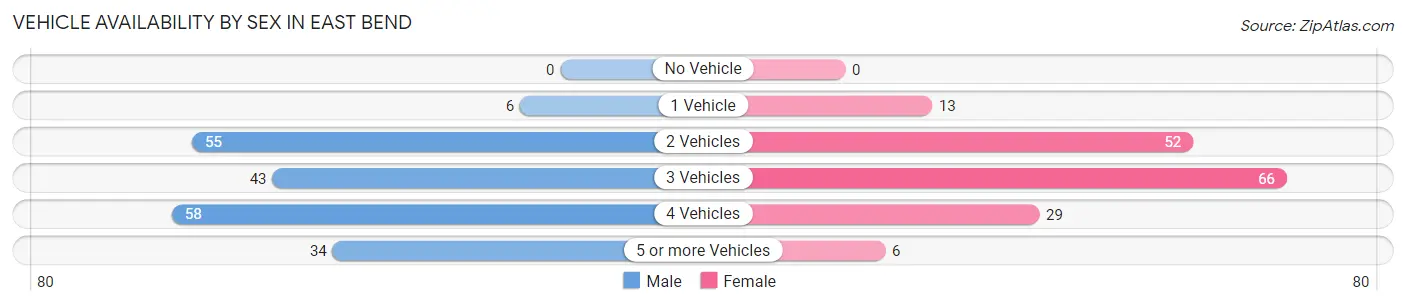
Vehicle Availability by Sex in East Bend
The most prevalent vehicle ownership categories in East Bend are males with 4 vehicles (58, accounting for 29.6%) and females with 4 vehicles (29, making up 34.9%).
| Vehicles Available | Male | Female |
| No Vehicle | 0 (0.0%) | 0 (0.0%) |
| 1 Vehicle | 6 (3.1%) | 13 (7.8%) |
| 2 Vehicles | 55 (28.1%) | 52 (31.3%) |
| 3 Vehicles | 43 (21.9%) | 66 (39.8%) |
| 4 Vehicles | 58 (29.6%) | 29 (17.5%) |
| 5 or more Vehicles | 34 (17.3%) | 6 (3.6%) |
| Total | 196 (100.0%) | 166 (100.0%) |
Commute Time in East Bend
The most frequently occuring commute durations in East Bend are 30 to 34 minutes (60 commuters, 18.2%), 45 to 59 minutes (52 commuters, 15.8%), and 20 to 24 minutes (39 commuters, 11.8%).
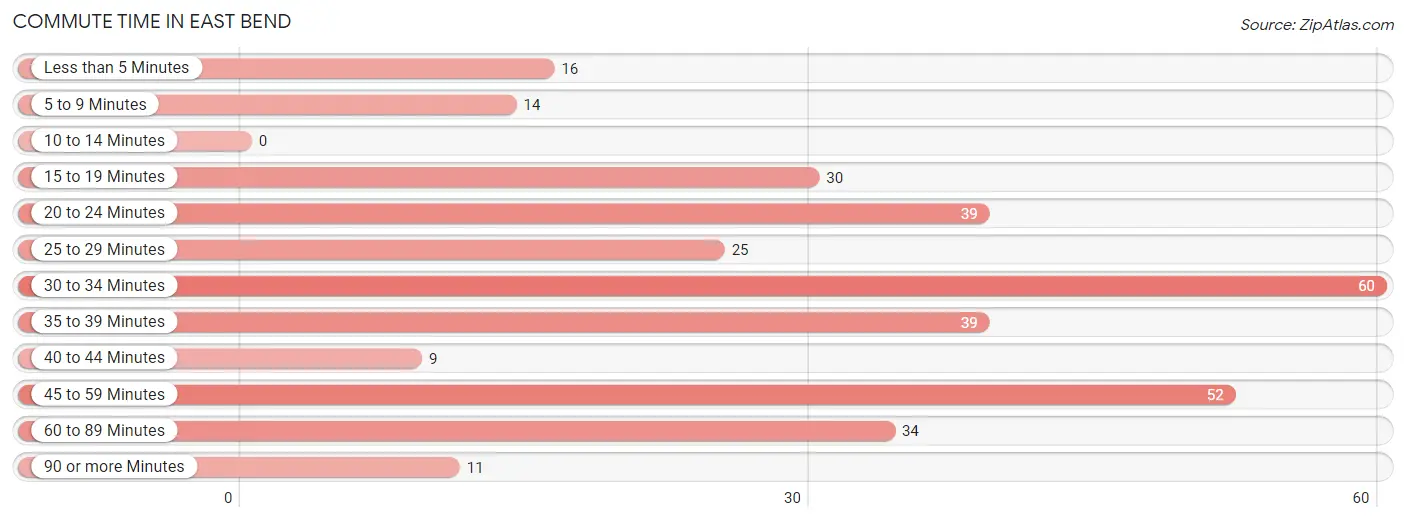
| Commute Time | # Commuters | % Commuters |
| Less than 5 Minutes | 16 | 4.9% |
| 5 to 9 Minutes | 14 | 4.3% |
| 10 to 14 Minutes | 0 | 0.0% |
| 15 to 19 Minutes | 30 | 9.1% |
| 20 to 24 Minutes | 39 | 11.8% |
| 25 to 29 Minutes | 25 | 7.6% |
| 30 to 34 Minutes | 60 | 18.2% |
| 35 to 39 Minutes | 39 | 11.8% |
| 40 to 44 Minutes | 9 | 2.7% |
| 45 to 59 Minutes | 52 | 15.8% |
| 60 to 89 Minutes | 34 | 10.3% |
| 90 or more Minutes | 11 | 3.3% |
Commute Time by Sex in East Bend
The most common commute times in East Bend are 45 to 59 minutes (42 commuters, 22.5%) for males and 30 to 34 minutes (40 commuters, 28.2%) for females.
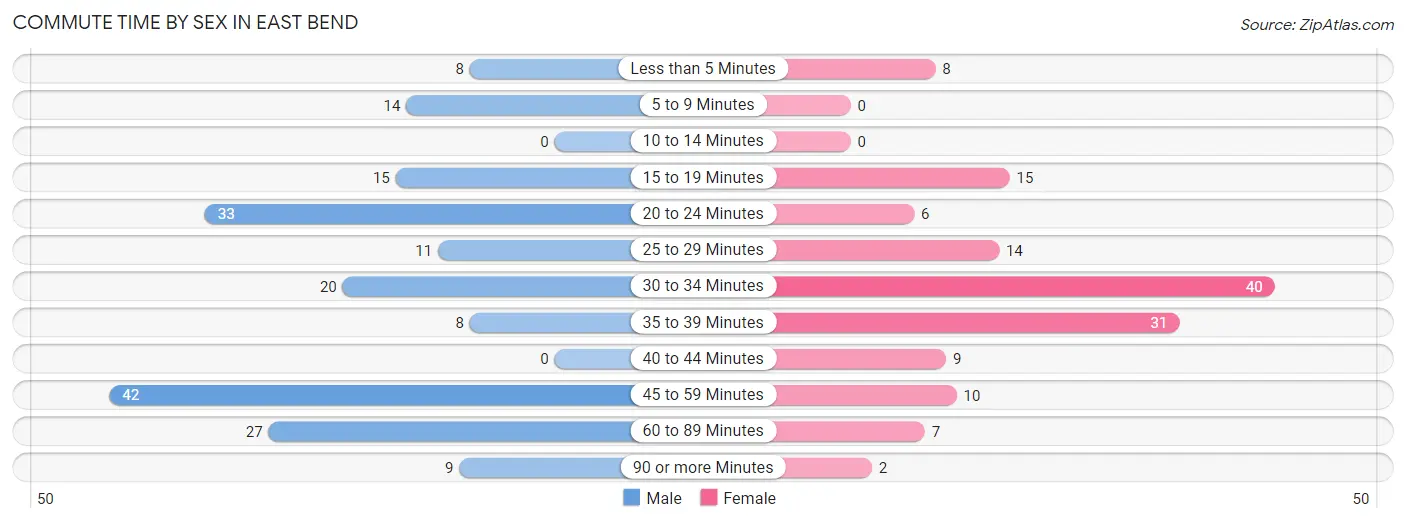
| Commute Time | Male | Female |
| Less than 5 Minutes | 8 (4.3%) | 8 (5.6%) |
| 5 to 9 Minutes | 14 (7.5%) | 0 (0.0%) |
| 10 to 14 Minutes | 0 (0.0%) | 0 (0.0%) |
| 15 to 19 Minutes | 15 (8.0%) | 15 (10.6%) |
| 20 to 24 Minutes | 33 (17.6%) | 6 (4.2%) |
| 25 to 29 Minutes | 11 (5.9%) | 14 (9.9%) |
| 30 to 34 Minutes | 20 (10.7%) | 40 (28.2%) |
| 35 to 39 Minutes | 8 (4.3%) | 31 (21.8%) |
| 40 to 44 Minutes | 0 (0.0%) | 9 (6.3%) |
| 45 to 59 Minutes | 42 (22.5%) | 10 (7.0%) |
| 60 to 89 Minutes | 27 (14.4%) | 7 (4.9%) |
| 90 or more Minutes | 9 (4.8%) | 2 (1.4%) |
Time of Departure to Work by Sex in East Bend
The most frequent times of departure to work in East Bend are 6:00 AM to 6:29 AM (34, 18.2%) for males and 7:00 AM to 7:29 AM (43, 30.3%) for females.
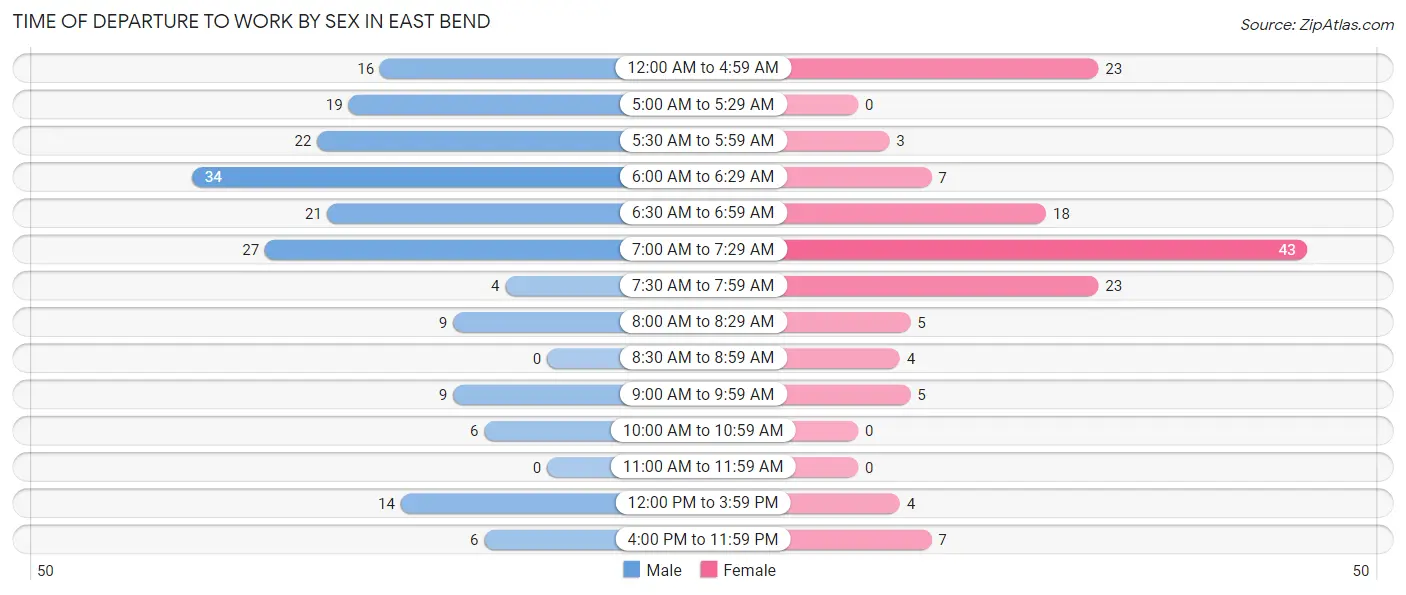
| Time of Departure | Male | Female |
| 12:00 AM to 4:59 AM | 16 (8.6%) | 23 (16.2%) |
| 5:00 AM to 5:29 AM | 19 (10.2%) | 0 (0.0%) |
| 5:30 AM to 5:59 AM | 22 (11.8%) | 3 (2.1%) |
| 6:00 AM to 6:29 AM | 34 (18.2%) | 7 (4.9%) |
| 6:30 AM to 6:59 AM | 21 (11.2%) | 18 (12.7%) |
| 7:00 AM to 7:29 AM | 27 (14.4%) | 43 (30.3%) |
| 7:30 AM to 7:59 AM | 4 (2.1%) | 23 (16.2%) |
| 8:00 AM to 8:29 AM | 9 (4.8%) | 5 (3.5%) |
| 8:30 AM to 8:59 AM | 0 (0.0%) | 4 (2.8%) |
| 9:00 AM to 9:59 AM | 9 (4.8%) | 5 (3.5%) |
| 10:00 AM to 10:59 AM | 6 (3.2%) | 0 (0.0%) |
| 11:00 AM to 11:59 AM | 0 (0.0%) | 0 (0.0%) |
| 12:00 PM to 3:59 PM | 14 (7.5%) | 4 (2.8%) |
| 4:00 PM to 11:59 PM | 6 (3.2%) | 7 (4.9%) |
| Total | 187 (100.0%) | 142 (100.0%) |
Housing Occupancy in East Bend
Occupancy by Ownership in East Bend
Of the total 221 dwellings in East Bend, owner-occupied units account for 170 (76.9%), while renter-occupied units make up 51 (23.1%).
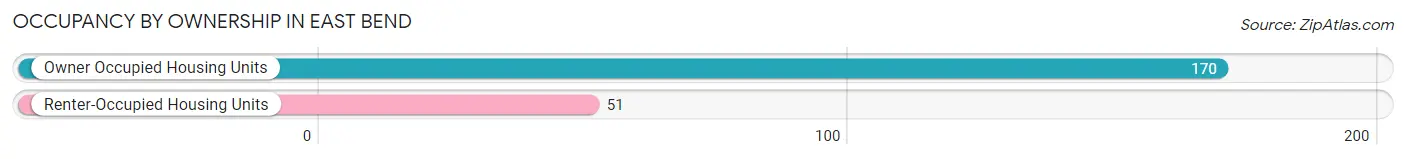
| Occupancy | # Housing Units | % Housing Units |
| Owner Occupied Housing Units | 170 | 76.9% |
| Renter-Occupied Housing Units | 51 | 23.1% |
| Total Occupied Housing Units | 221 | 100.0% |
Occupancy by Household Size in East Bend
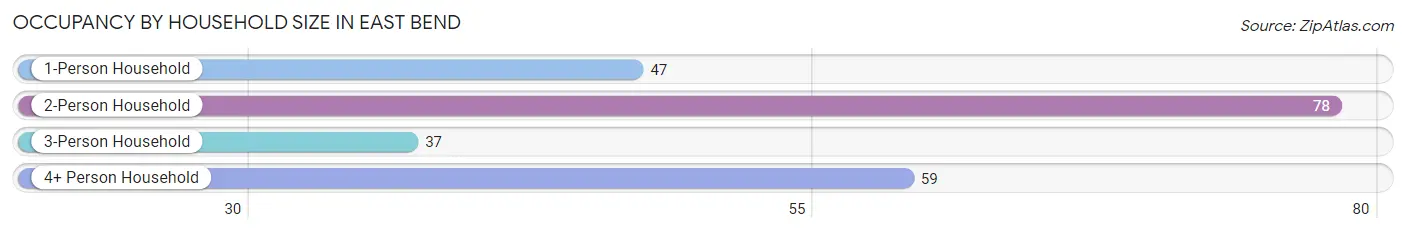
| Household Size | # Housing Units | % Housing Units |
| 1-Person Household | 47 | 21.3% |
| 2-Person Household | 78 | 35.3% |
| 3-Person Household | 37 | 16.7% |
| 4+ Person Household | 59 | 26.7% |
| Total Housing Units | 221 | 100.0% |
Occupancy by Ownership by Household Size in East Bend
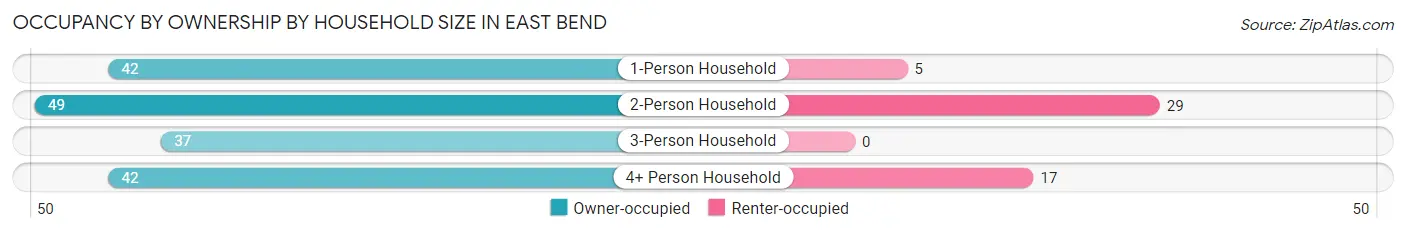
| Household Size | Owner-occupied | Renter-occupied |
| 1-Person Household | 42 (89.4%) | 5 (10.6%) |
| 2-Person Household | 49 (62.8%) | 29 (37.2%) |
| 3-Person Household | 37 (100.0%) | 0 (0.0%) |
| 4+ Person Household | 42 (71.2%) | 17 (28.8%) |
| Total Housing Units | 170 (76.9%) | 51 (23.1%) |
Occupancy by Educational Attainment in East Bend
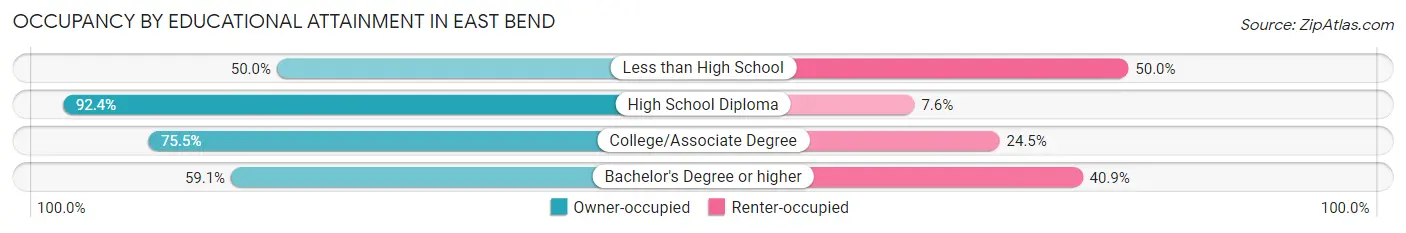
| Household Size | Owner-occupied | Renter-occupied |
| Less than High School | 13 (50.0%) | 13 (50.0%) |
| High School Diploma | 73 (92.4%) | 6 (7.6%) |
| College/Associate Degree | 71 (75.5%) | 23 (24.5%) |
| Bachelor's Degree or higher | 13 (59.1%) | 9 (40.9%) |
Occupancy by Age of Householder in East Bend
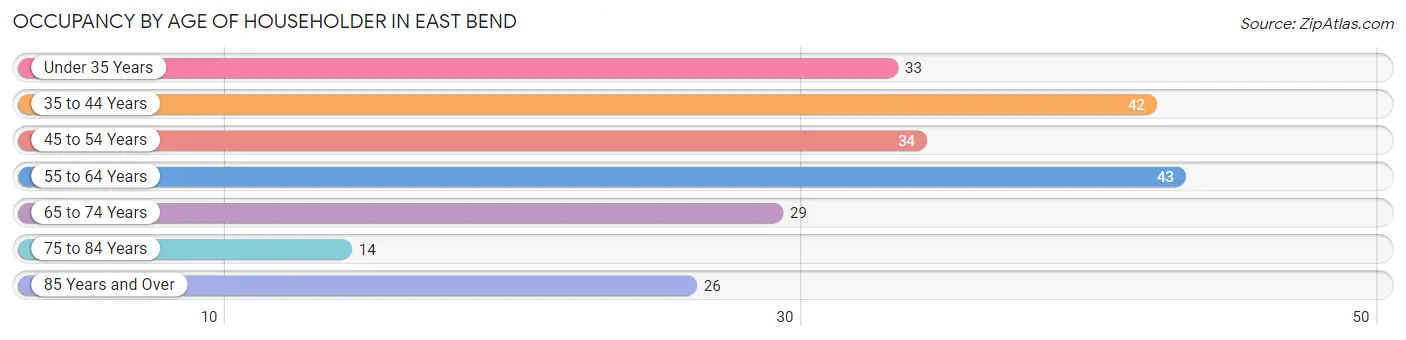
| Age Bracket | # Households | % Households |
| Under 35 Years | 33 | 14.9% |
| 35 to 44 Years | 42 | 19.0% |
| 45 to 54 Years | 34 | 15.4% |
| 55 to 64 Years | 43 | 19.5% |
| 65 to 74 Years | 29 | 13.1% |
| 75 to 84 Years | 14 | 6.3% |
| 85 Years and Over | 26 | 11.8% |
| Total | 221 | 100.0% |
Housing Finances in East Bend
Median Income by Occupancy in East Bend
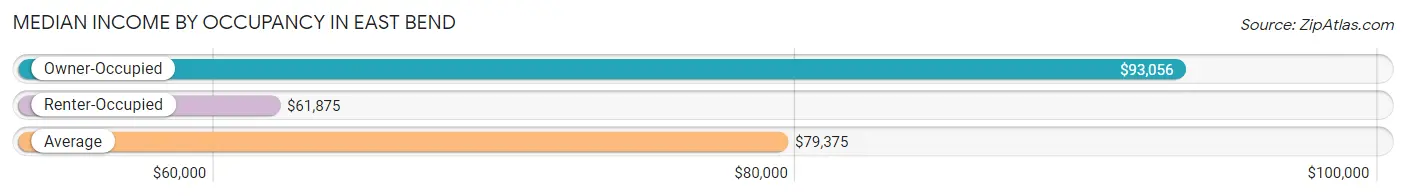
| Occupancy Type | # Households | Median Income |
| Owner-Occupied | 170 (76.9%) | $93,056 |
| Renter-Occupied | 51 (23.1%) | $61,875 |
| Average | 221 (100.0%) | $79,375 |
Occupancy by Householder Income Bracket in East Bend
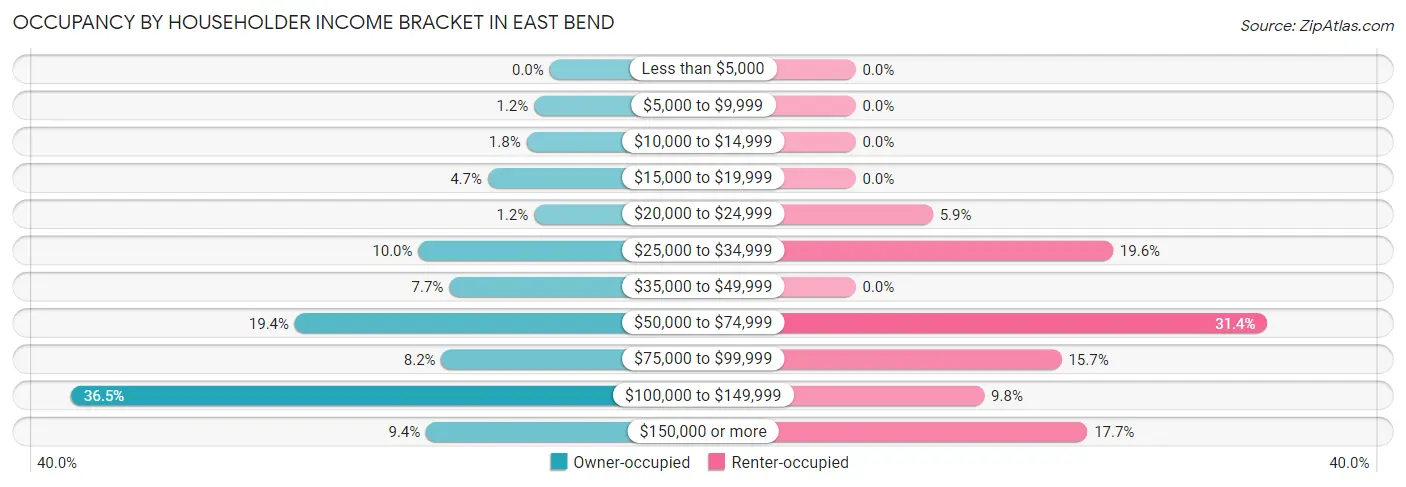
| Income Bracket | Owner-occupied | Renter-occupied |
| Less than $5,000 | 0 (0.0%) | 0 (0.0%) |
| $5,000 to $9,999 | 2 (1.2%) | 0 (0.0%) |
| $10,000 to $14,999 | 3 (1.8%) | 0 (0.0%) |
| $15,000 to $19,999 | 8 (4.7%) | 0 (0.0%) |
| $20,000 to $24,999 | 2 (1.2%) | 3 (5.9%) |
| $25,000 to $34,999 | 17 (10.0%) | 10 (19.6%) |
| $35,000 to $49,999 | 13 (7.6%) | 0 (0.0%) |
| $50,000 to $74,999 | 33 (19.4%) | 16 (31.4%) |
| $75,000 to $99,999 | 14 (8.2%) | 8 (15.7%) |
| $100,000 to $149,999 | 62 (36.5%) | 5 (9.8%) |
| $150,000 or more | 16 (9.4%) | 9 (17.6%) |
| Total | 170 (100.0%) | 51 (100.0%) |
Monthly Housing Cost Tiers in East Bend
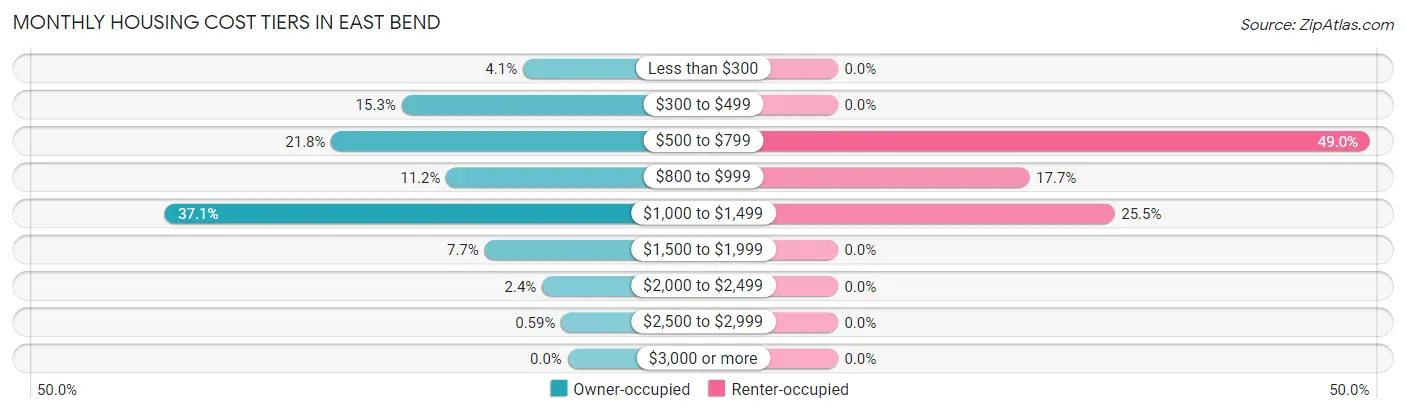
| Monthly Cost | Owner-occupied | Renter-occupied |
| Less than $300 | 7 (4.1%) | 0 (0.0%) |
| $300 to $499 | 26 (15.3%) | 0 (0.0%) |
| $500 to $799 | 37 (21.8%) | 25 (49.0%) |
| $800 to $999 | 19 (11.2%) | 9 (17.6%) |
| $1,000 to $1,499 | 63 (37.1%) | 13 (25.5%) |
| $1,500 to $1,999 | 13 (7.6%) | 0 (0.0%) |
| $2,000 to $2,499 | 4 (2.4%) | 0 (0.0%) |
| $2,500 to $2,999 | 1 (0.6%) | 0 (0.0%) |
| $3,000 or more | 0 (0.0%) | 0 (0.0%) |
| Total | 170 (100.0%) | 51 (100.0%) |
Physical Housing Characteristics in East Bend
Housing Structures in East Bend
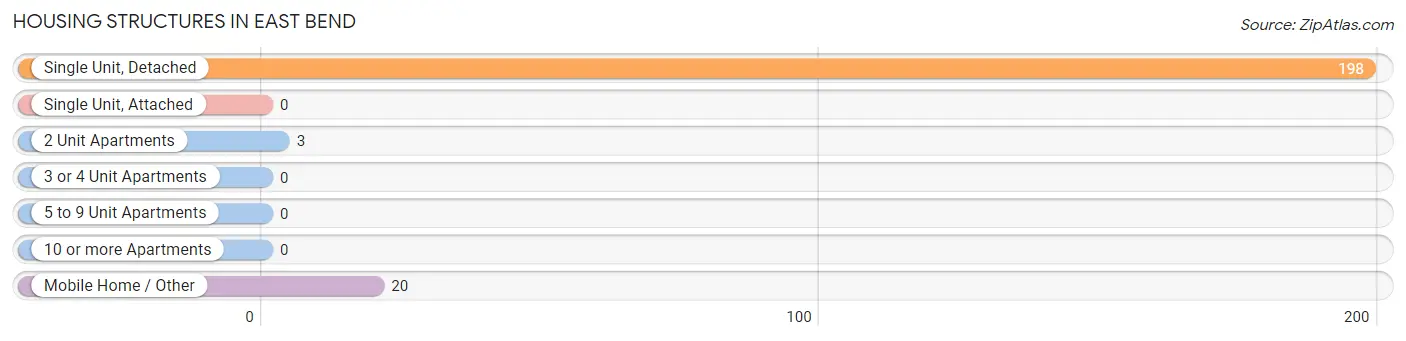
| Structure Type | # Housing Units | % Housing Units |
| Single Unit, Detached | 198 | 89.6% |
| Single Unit, Attached | 0 | 0.0% |
| 2 Unit Apartments | 3 | 1.4% |
| 3 or 4 Unit Apartments | 0 | 0.0% |
| 5 to 9 Unit Apartments | 0 | 0.0% |
| 10 or more Apartments | 0 | 0.0% |
| Mobile Home / Other | 20 | 9.0% |
| Total | 221 | 100.0% |
Housing Structures by Occupancy in East Bend
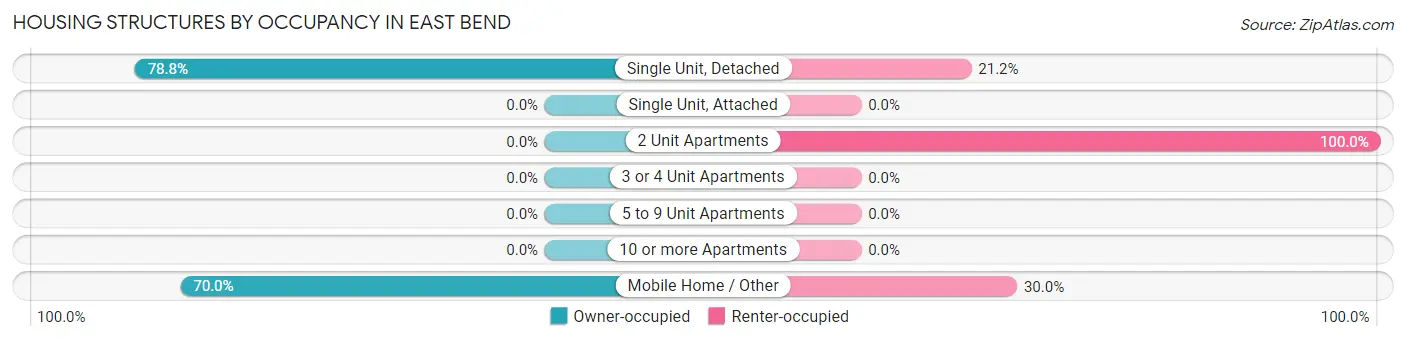
| Structure Type | Owner-occupied | Renter-occupied |
| Single Unit, Detached | 156 (78.8%) | 42 (21.2%) |
| Single Unit, Attached | 0 (0.0%) | 0 (0.0%) |
| 2 Unit Apartments | 0 (0.0%) | 3 (100.0%) |
| 3 or 4 Unit Apartments | 0 (0.0%) | 0 (0.0%) |
| 5 to 9 Unit Apartments | 0 (0.0%) | 0 (0.0%) |
| 10 or more Apartments | 0 (0.0%) | 0 (0.0%) |
| Mobile Home / Other | 14 (70.0%) | 6 (30.0%) |
| Total | 170 (76.9%) | 51 (23.1%) |
Housing Structures by Number of Rooms in East Bend
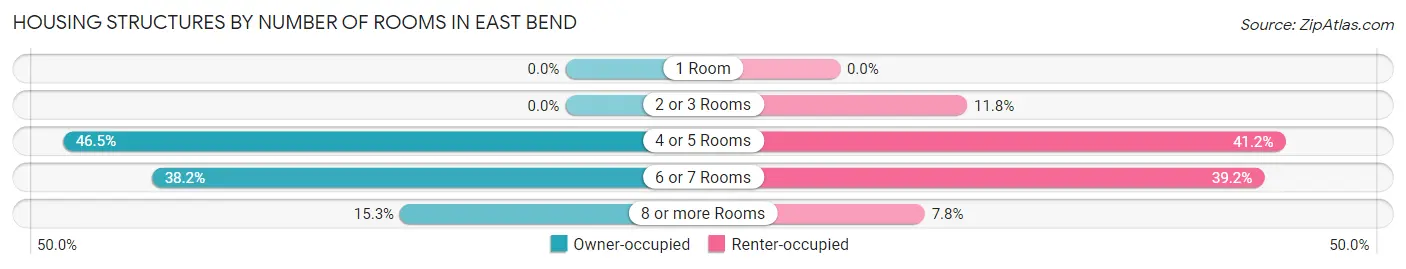
| Number of Rooms | Owner-occupied | Renter-occupied |
| 1 Room | 0 (0.0%) | 0 (0.0%) |
| 2 or 3 Rooms | 0 (0.0%) | 6 (11.8%) |
| 4 or 5 Rooms | 79 (46.5%) | 21 (41.2%) |
| 6 or 7 Rooms | 65 (38.2%) | 20 (39.2%) |
| 8 or more Rooms | 26 (15.3%) | 4 (7.8%) |
| Total | 170 (100.0%) | 51 (100.0%) |
Housing Structure by Heating Type in East Bend
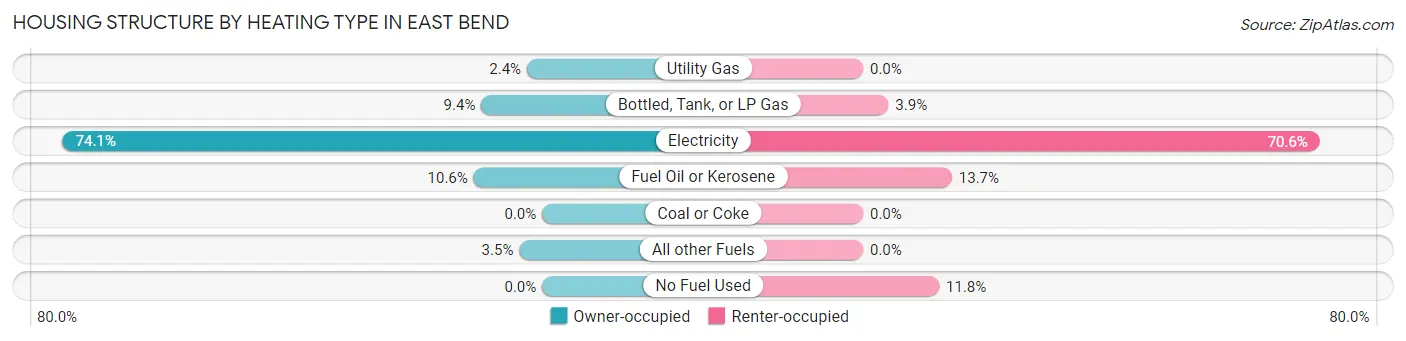
| Heating Type | Owner-occupied | Renter-occupied |
| Utility Gas | 4 (2.4%) | 0 (0.0%) |
| Bottled, Tank, or LP Gas | 16 (9.4%) | 2 (3.9%) |
| Electricity | 126 (74.1%) | 36 (70.6%) |
| Fuel Oil or Kerosene | 18 (10.6%) | 7 (13.7%) |
| Coal or Coke | 0 (0.0%) | 0 (0.0%) |
| All other Fuels | 6 (3.5%) | 0 (0.0%) |
| No Fuel Used | 0 (0.0%) | 6 (11.8%) |
| Total | 170 (100.0%) | 51 (100.0%) |
Household Vehicle Usage in East Bend
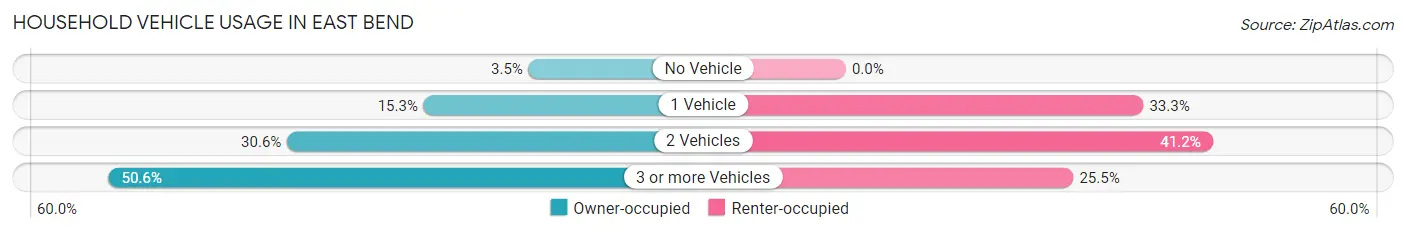
| Vehicles per Household | Owner-occupied | Renter-occupied |
| No Vehicle | 6 (3.5%) | 0 (0.0%) |
| 1 Vehicle | 26 (15.3%) | 17 (33.3%) |
| 2 Vehicles | 52 (30.6%) | 21 (41.2%) |
| 3 or more Vehicles | 86 (50.6%) | 13 (25.5%) |
| Total | 170 (100.0%) | 51 (100.0%) |
Real Estate & Mortgages in East Bend
Real Estate and Mortgage Overview in East Bend
| Characteristic | Without Mortgage | With Mortgage |
| Housing Units | 68 | 102 |
| Median Property Value | $125,000 | $170,300 |
| Median Household Income | $46,250 | $16 |
| Monthly Housing Costs | $505 | $0 |
| Real Estate Taxes | $1,375 | $0 |
Property Value by Mortgage Status in East Bend
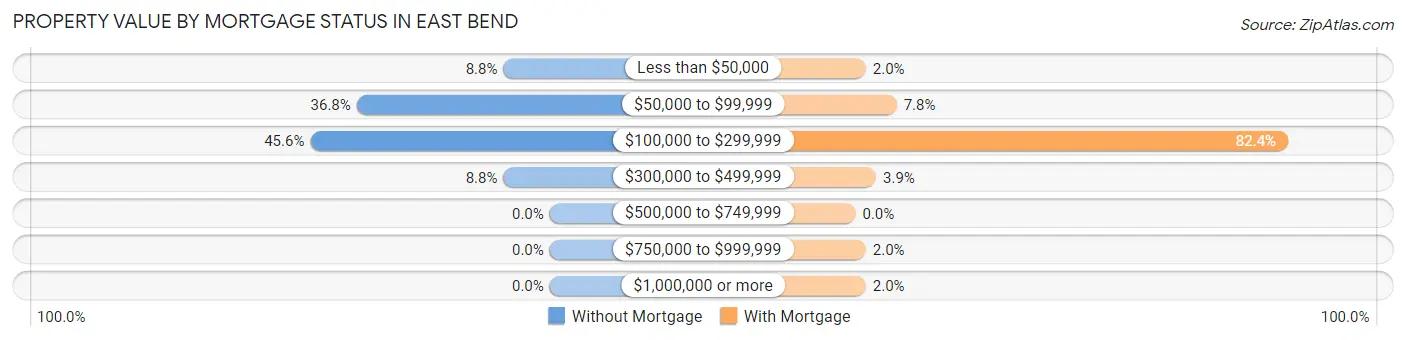
| Property Value | Without Mortgage | With Mortgage |
| Less than $50,000 | 6 (8.8%) | 2 (2.0%) |
| $50,000 to $99,999 | 25 (36.8%) | 8 (7.8%) |
| $100,000 to $299,999 | 31 (45.6%) | 84 (82.4%) |
| $300,000 to $499,999 | 6 (8.8%) | 4 (3.9%) |
| $500,000 to $749,999 | 0 (0.0%) | 0 (0.0%) |
| $750,000 to $999,999 | 0 (0.0%) | 2 (2.0%) |
| $1,000,000 or more | 0 (0.0%) | 2 (2.0%) |
| Total | 68 (100.0%) | 102 (100.0%) |
Household Income by Mortgage Status in East Bend
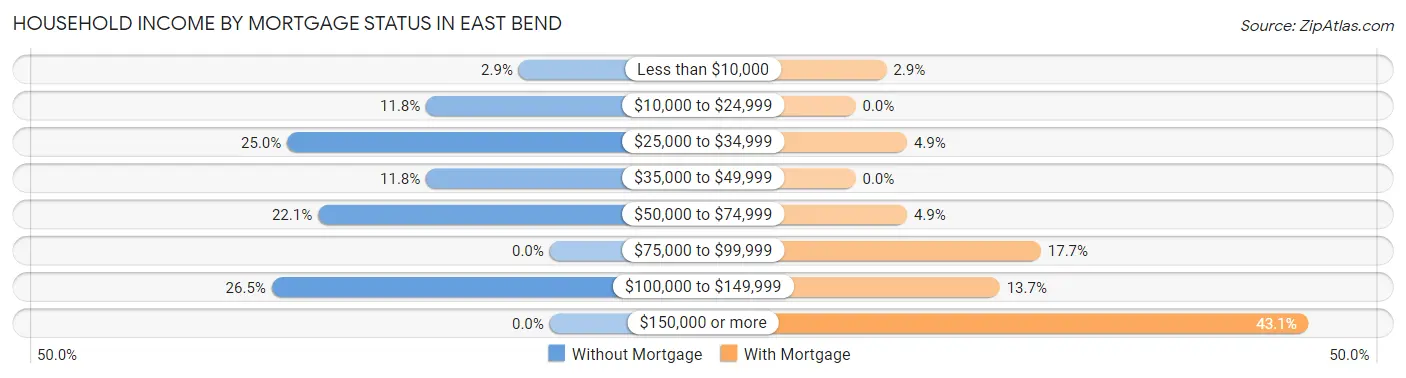
| Household Income | Without Mortgage | With Mortgage |
| Less than $10,000 | 2 (2.9%) | 3 (2.9%) |
| $10,000 to $24,999 | 8 (11.8%) | 0 (0.0%) |
| $25,000 to $34,999 | 17 (25.0%) | 5 (4.9%) |
| $35,000 to $49,999 | 8 (11.8%) | 0 (0.0%) |
| $50,000 to $74,999 | 15 (22.1%) | 5 (4.9%) |
| $75,000 to $99,999 | 0 (0.0%) | 18 (17.6%) |
| $100,000 to $149,999 | 18 (26.5%) | 14 (13.7%) |
| $150,000 or more | 0 (0.0%) | 44 (43.1%) |
| Total | 68 (100.0%) | 102 (100.0%) |
Property Value to Household Income Ratio in East Bend
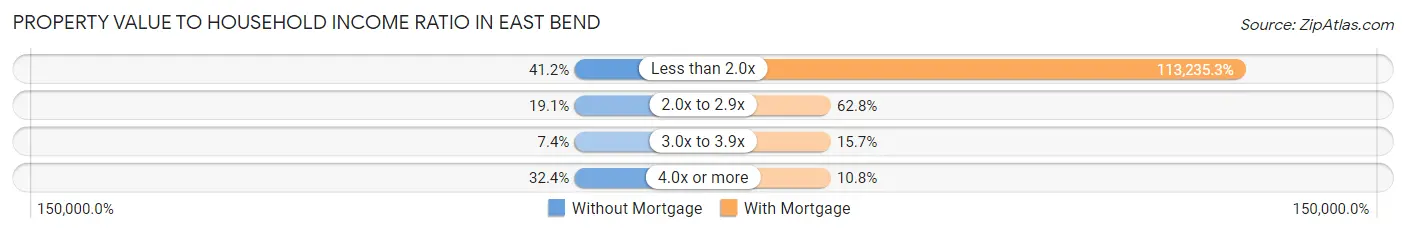
| Value-to-Income Ratio | Without Mortgage | With Mortgage |
| Less than 2.0x | 28 (41.2%) | 115,500 (113,235.3%) |
| 2.0x to 2.9x | 13 (19.1%) | 64 (62.7%) |
| 3.0x to 3.9x | 5 (7.3%) | 16 (15.7%) |
| 4.0x or more | 22 (32.4%) | 11 (10.8%) |
| Total | 68 (100.0%) | 102 (100.0%) |
Real Estate Taxes by Mortgage Status in East Bend
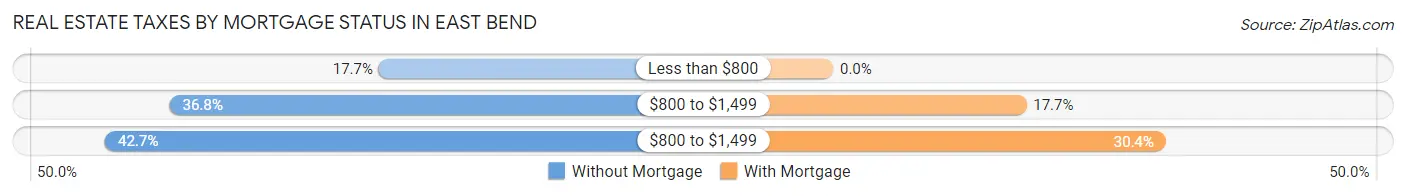
| Property Taxes | Without Mortgage | With Mortgage |
| Less than $800 | 12 (17.6%) | 0 (0.0%) |
| $800 to $1,499 | 25 (36.8%) | 18 (17.6%) |
| $800 to $1,499 | 29 (42.6%) | 31 (30.4%) |
| Total | 68 (100.0%) | 102 (100.0%) |
Health & Disability in East Bend
Health Insurance Coverage by Age in East Bend
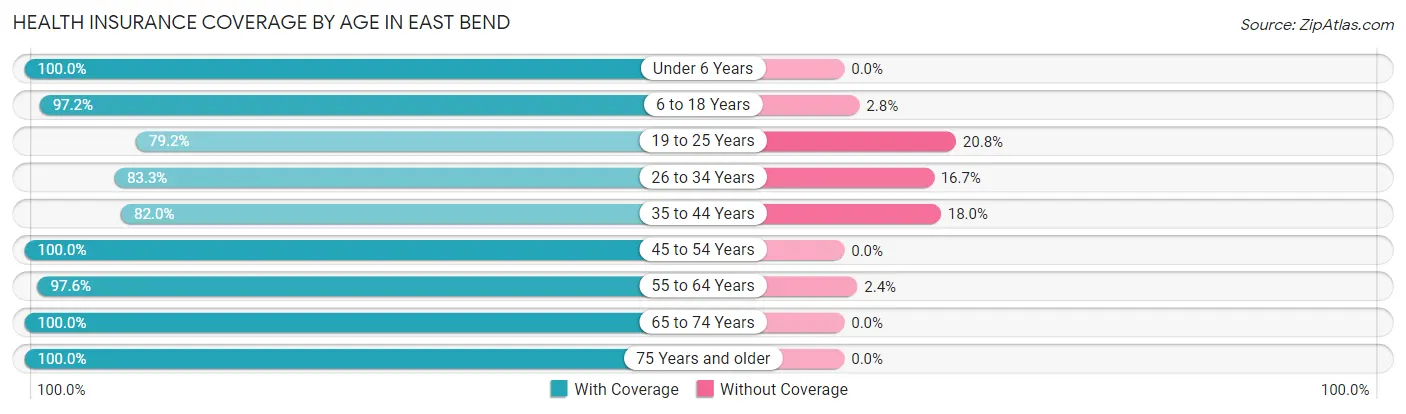
| Age Bracket | With Coverage | Without Coverage |
| Under 6 Years | 26 (100.0%) | 0 (0.0%) |
| 6 to 18 Years | 138 (97.2%) | 4 (2.8%) |
| 19 to 25 Years | 118 (79.2%) | 31 (20.8%) |
| 26 to 34 Years | 55 (83.3%) | 11 (16.7%) |
| 35 to 44 Years | 114 (82.0%) | 25 (18.0%) |
| 45 to 54 Years | 55 (100.0%) | 0 (0.0%) |
| 55 to 64 Years | 80 (97.6%) | 2 (2.4%) |
| 65 to 74 Years | 32 (100.0%) | 0 (0.0%) |
| 75 Years and older | 50 (100.0%) | 0 (0.0%) |
| Total | 668 (90.1%) | 73 (9.9%) |
Health Insurance Coverage by Citizenship Status in East Bend
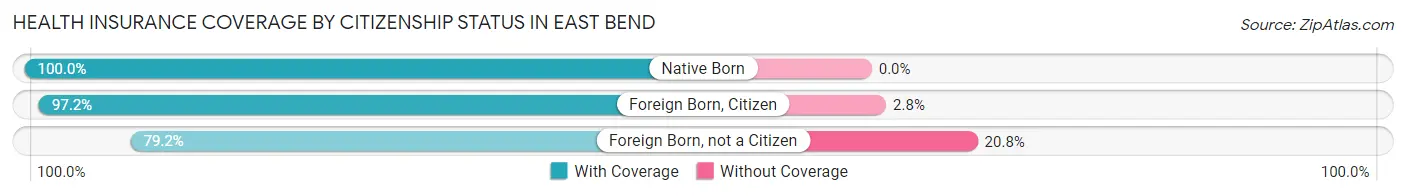
| Citizenship Status | With Coverage | Without Coverage |
| Native Born | 26 (100.0%) | 0 (0.0%) |
| Foreign Born, Citizen | 138 (97.2%) | 4 (2.8%) |
| Foreign Born, not a Citizen | 118 (79.2%) | 31 (20.8%) |
Health Insurance Coverage by Household Income in East Bend
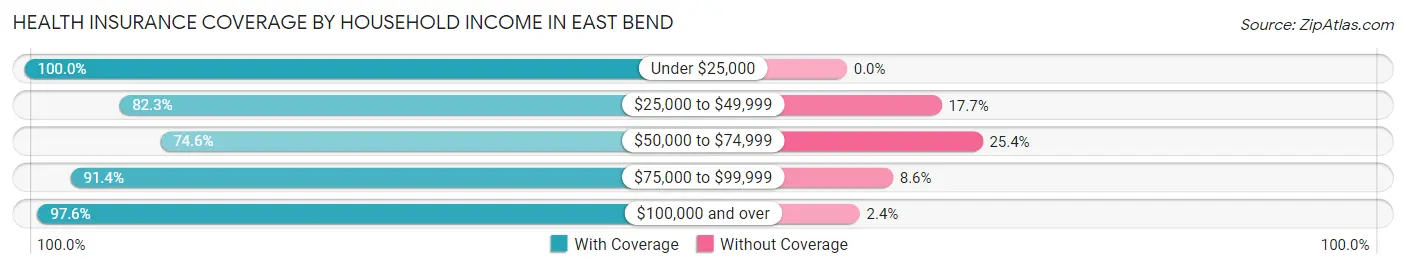
| Household Income | With Coverage | Without Coverage |
| Under $25,000 | 20 (100.0%) | 0 (0.0%) |
| $25,000 to $49,999 | 51 (82.3%) | 11 (17.7%) |
| $50,000 to $74,999 | 138 (74.6%) | 47 (25.4%) |
| $75,000 to $99,999 | 53 (91.4%) | 5 (8.6%) |
| $100,000 and over | 406 (97.6%) | 10 (2.4%) |
Public vs Private Health Insurance Coverage by Age in East Bend
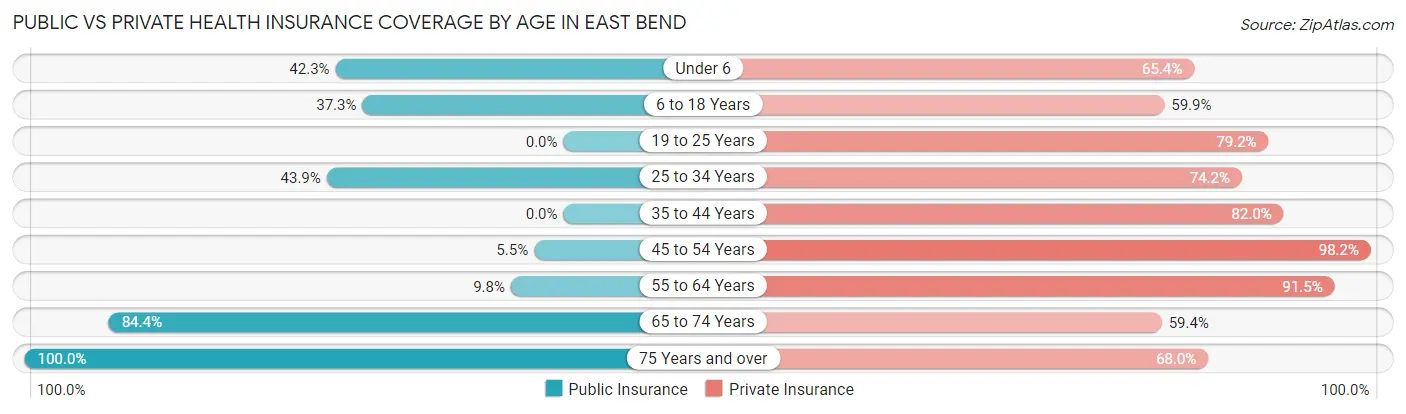
| Age Bracket | Public Insurance | Private Insurance |
| Under 6 | 11 (42.3%) | 17 (65.4%) |
| 6 to 18 Years | 53 (37.3%) | 85 (59.9%) |
| 19 to 25 Years | 0 (0.0%) | 118 (79.2%) |
| 25 to 34 Years | 29 (43.9%) | 49 (74.2%) |
| 35 to 44 Years | 0 (0.0%) | 114 (82.0%) |
| 45 to 54 Years | 3 (5.4%) | 54 (98.2%) |
| 55 to 64 Years | 8 (9.8%) | 75 (91.5%) |
| 65 to 74 Years | 27 (84.4%) | 19 (59.4%) |
| 75 Years and over | 50 (100.0%) | 34 (68.0%) |
| Total | 181 (24.4%) | 565 (76.2%) |
Disability Status by Sex by Age in East Bend
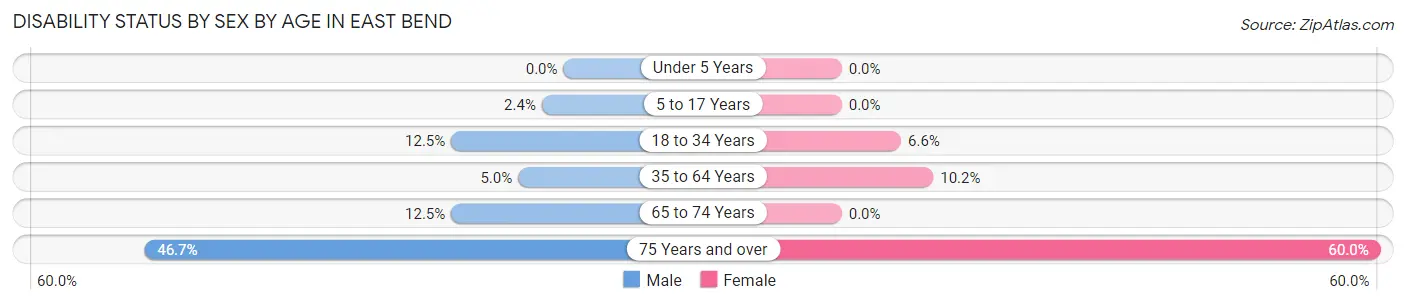
| Age Bracket | Male | Female |
| Under 5 Years | 0 (0.0%) | 0 (0.0%) |
| 5 to 17 Years | 2 (2.4%) | 0 (0.0%) |
| 18 to 34 Years | 14 (12.5%) | 7 (6.6%) |
| 35 to 64 Years | 6 (5.0%) | 16 (10.2%) |
| 65 to 74 Years | 2 (12.5%) | 0 (0.0%) |
| 75 Years and over | 7 (46.7%) | 21 (60.0%) |
Disability Class by Sex by Age in East Bend
Disability Class: Hearing Difficulty
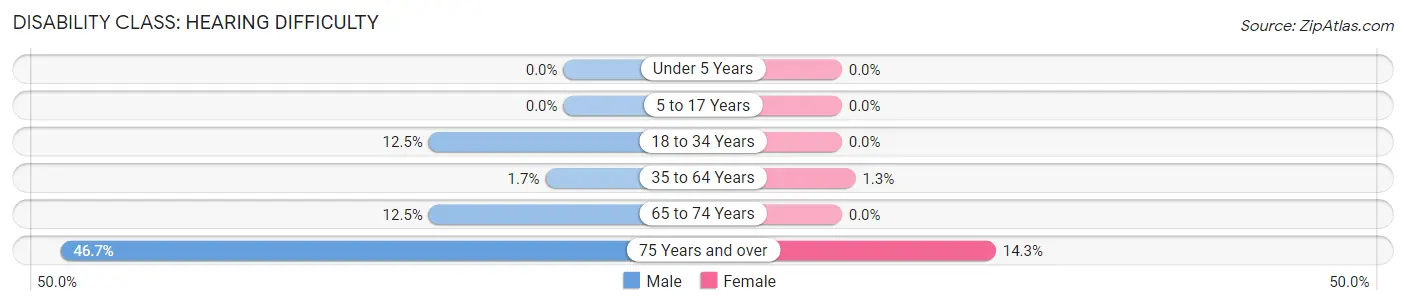
| Age Bracket | Male | Female |
| Under 5 Years | 0 (0.0%) | 0 (0.0%) |
| 5 to 17 Years | 0 (0.0%) | 0 (0.0%) |
| 18 to 34 Years | 14 (12.5%) | 0 (0.0%) |
| 35 to 64 Years | 2 (1.7%) | 2 (1.3%) |
| 65 to 74 Years | 2 (12.5%) | 0 (0.0%) |
| 75 Years and over | 7 (46.7%) | 5 (14.3%) |
Disability Class: Vision Difficulty
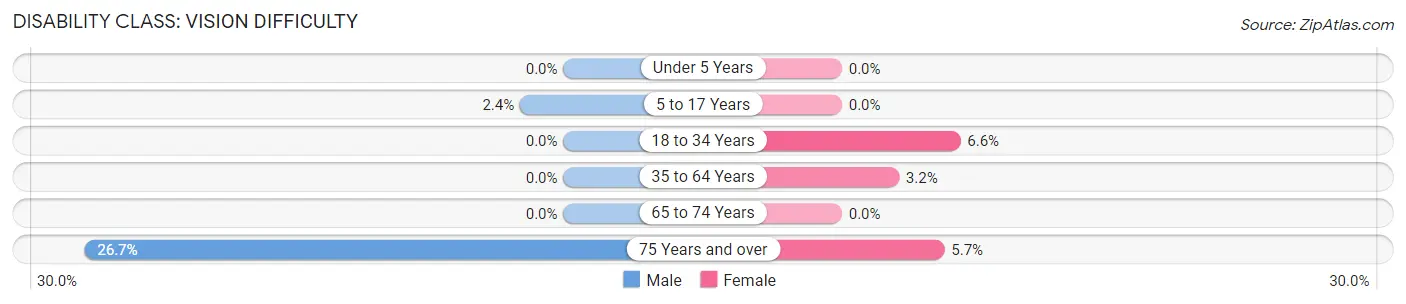
| Age Bracket | Male | Female |
| Under 5 Years | 0 (0.0%) | 0 (0.0%) |
| 5 to 17 Years | 2 (2.4%) | 0 (0.0%) |
| 18 to 34 Years | 0 (0.0%) | 7 (6.6%) |
| 35 to 64 Years | 0 (0.0%) | 5 (3.2%) |
| 65 to 74 Years | 0 (0.0%) | 0 (0.0%) |
| 75 Years and over | 4 (26.7%) | 2 (5.7%) |
Disability Class: Cognitive Difficulty
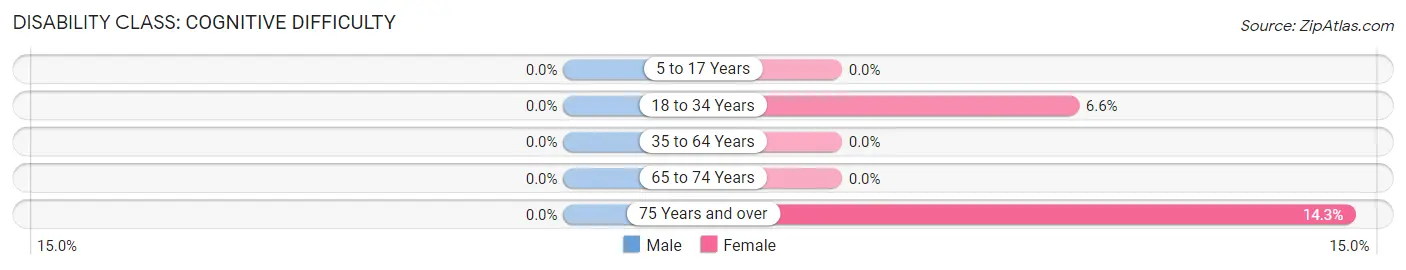
| Age Bracket | Male | Female |
| 5 to 17 Years | 0 (0.0%) | 0 (0.0%) |
| 18 to 34 Years | 0 (0.0%) | 7 (6.6%) |
| 35 to 64 Years | 0 (0.0%) | 0 (0.0%) |
| 65 to 74 Years | 0 (0.0%) | 0 (0.0%) |
| 75 Years and over | 0 (0.0%) | 5 (14.3%) |
Disability Class: Ambulatory Difficulty
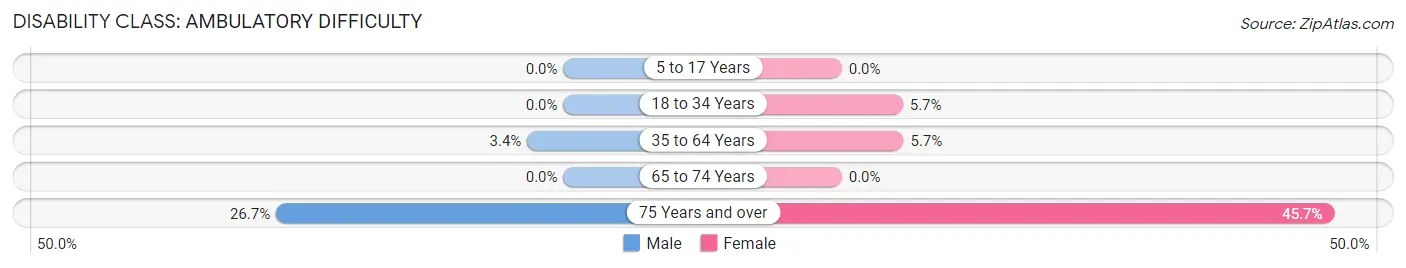
| Age Bracket | Male | Female |
| 5 to 17 Years | 0 (0.0%) | 0 (0.0%) |
| 18 to 34 Years | 0 (0.0%) | 6 (5.7%) |
| 35 to 64 Years | 4 (3.4%) | 9 (5.7%) |
| 65 to 74 Years | 0 (0.0%) | 0 (0.0%) |
| 75 Years and over | 4 (26.7%) | 16 (45.7%) |
Disability Class: Self-Care Difficulty
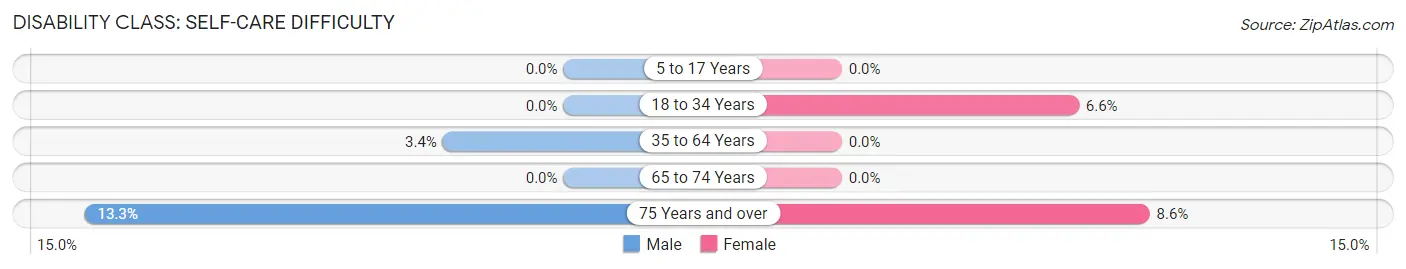
| Age Bracket | Male | Female |
| 5 to 17 Years | 0 (0.0%) | 0 (0.0%) |
| 18 to 34 Years | 0 (0.0%) | 7 (6.6%) |
| 35 to 64 Years | 4 (3.4%) | 0 (0.0%) |
| 65 to 74 Years | 0 (0.0%) | 0 (0.0%) |
| 75 Years and over | 2 (13.3%) | 3 (8.6%) |
Technology Access in East Bend
Computing Device Access in East Bend
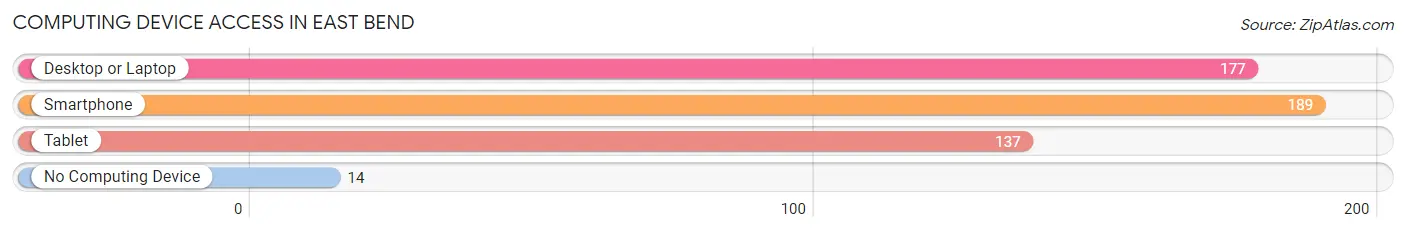
| Device Type | # Households | % Households |
| Desktop or Laptop | 177 | 80.1% |
| Smartphone | 189 | 85.5% |
| Tablet | 137 | 62.0% |
| No Computing Device | 14 | 6.3% |
| Total | 221 | 100.0% |
Internet Access in East Bend
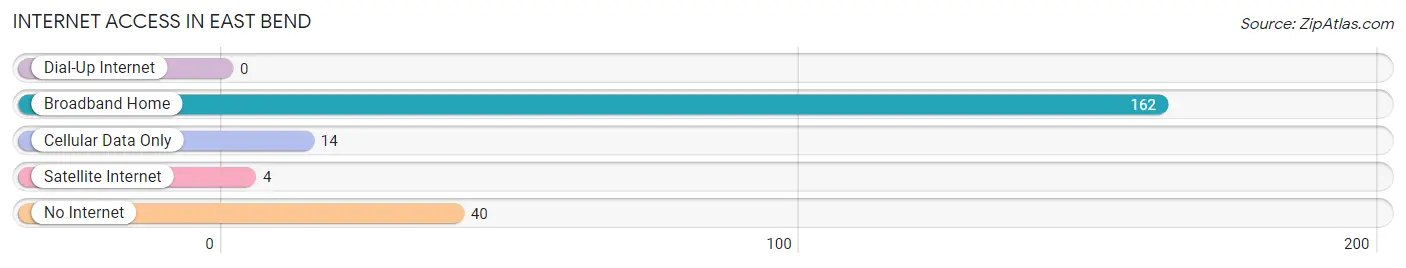
| Internet Type | # Households | % Households |
| Dial-Up Internet | 0 | 0.0% |
| Broadband Home | 162 | 73.3% |
| Cellular Data Only | 14 | 6.3% |
| Satellite Internet | 4 | 1.8% |
| No Internet | 40 | 18.1% |
| Total | 221 | 100.0% |
East Bend Summary
East Bend is a small town located in Yadkin County, North Carolina. It is situated in the foothills of the Blue Ridge Mountains, about 25 miles northwest of Winston-Salem. The town has a population of approximately 1,400 people and is part of the Winston-Salem Metropolitan Statistical Area.
History
East Bend was first settled in the late 1700s by German and Scotch-Irish immigrants. The town was originally known as “Bend of the Yadkin” and was later renamed East Bend. The town was officially incorporated in 1891.
East Bend was a thriving agricultural community in the early 1900s. The town was home to several cotton mills, a furniture factory, and a canning factory. The town also had a railroad station, which connected it to the larger cities of Winston-Salem and High Point.
In the 1950s, East Bend began to experience a decline in its economy. The cotton mills and other factories closed, and the railroad station was abandoned. The town’s population began to decline as well, as people moved away in search of better job opportunities.
Geography
East Bend is located in the foothills of the Blue Ridge Mountains. The town is situated along the Yadkin River, which flows through the center of town. The town is surrounded by rolling hills and farmland.
The climate in East Bend is mild and humid. Summers are hot and humid, with temperatures reaching into the 90s. Winters are cold and wet, with temperatures dropping into the 20s.
Economy
East Bend’s economy is largely based on agriculture. The town is home to several farms, which produce a variety of crops, including corn, soybeans, and tobacco. The town also has a few small businesses, including a grocery store, a hardware store, and a few restaurants.
Demographics
As of the 2010 census, East Bend had a population of 1,400 people. The racial makeup of the town was 95.6% White, 1.9% African American, 0.4% Native American, 0.4% Asian, and 1.7% from other races.
The median household income in East Bend was $35,000, and the median family income was $41,000. The per capita income was $17,000. About 15.5% of the population was below the poverty line.
East Bend is a small town with a rich history and a strong sense of community. The town is home to a diverse population and offers a variety of recreational activities. The town is also conveniently located near larger cities, making it an ideal place to live and work.
Common Questions
What is Per Capita Income in East Bend?
Per Capita income in East Bend is $27,981.
What is the Median Family Income in East Bend?
Median Family Income in East Bend is $94,844.
What is the Median Household income in East Bend?
Median Household Income in East Bend is $79,375.
What is Income or Wage Gap in East Bend?
Income or Wage Gap in East Bend is 49.4%.
Women in East Bend earn 50.6 cents for every dollar earned by a man.
What is Inequality or Gini Index in East Bend?
Inequality or Gini Index in East Bend is 0.32.
What is the Total Population of East Bend?
Total Population of East Bend is 741.
What is the Total Male Population of East Bend?
Total Male Population of East Bend is 356.
What is the Total Female Population of East Bend?
Total Female Population of East Bend is 385.
What is the Ratio of Males per 100 Females in East Bend?
There are 92.47 Males per 100 Females in East Bend.
What is the Ratio of Females per 100 Males in East Bend?
There are 108.15 Females per 100 Males in East Bend.
What is the Median Population Age in East Bend?
Median Population Age in East Bend is 32.3 Years.
What is the Average Family Size in East Bend
Average Family Size in East Bend is 3.8 People.
What is the Average Household Size in East Bend
Average Household Size in East Bend is 3.4 People.
How Large is the Labor Force in East Bend?
There are 381 People in the Labor Forcein in East Bend.
What is the Percentage of People in the Labor Force in East Bend?
65.5% of People are in the Labor Force in East Bend.
What is the Unemployment Rate in East Bend?
Unemployment Rate in East Bend is 4.2%.