Cherryville, NC Map & Demographics
Cherryville Map
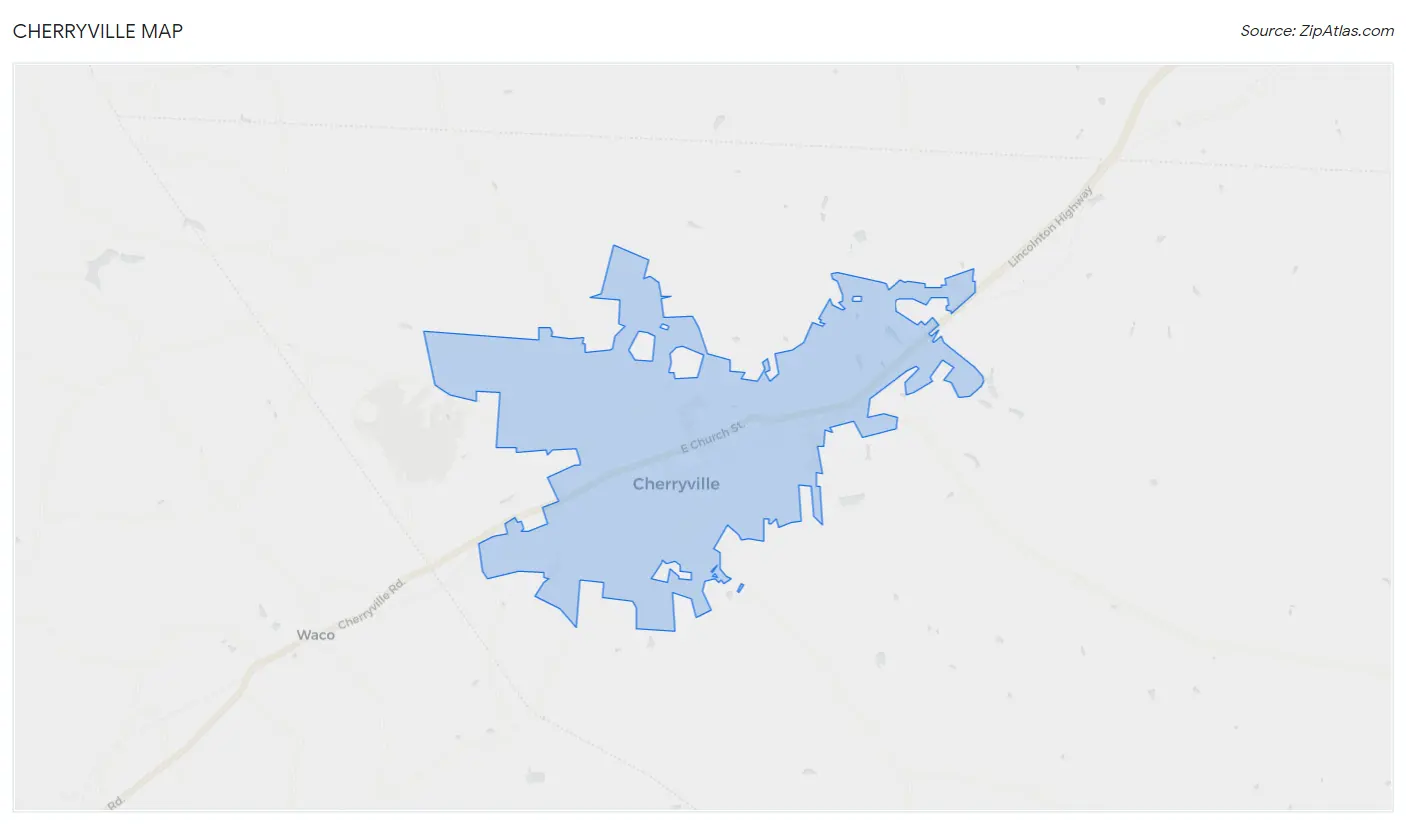
Cherryville Overview
$28,786
PER CAPITA INCOME
$80,938
AVG FAMILY INCOME
$57,137
AVG HOUSEHOLD INCOME
28.9%
WAGE / INCOME GAP [ % ]
71.1¢/ $1
WAGE / INCOME GAP [ $ ]
0.41
INEQUALITY / GINI INDEX
6,113
TOTAL POPULATION
3,079
MALE POPULATION
3,034
FEMALE POPULATION
101.48
MALES / 100 FEMALES
98.54
FEMALES / 100 MALES
37.4
MEDIAN AGE
3.1
AVG FAMILY SIZE
2.4
AVG HOUSEHOLD SIZE
2,737
LABOR FORCE [ PEOPLE ]
55.7%
PERCENT IN LABOR FORCE
3.5%
UNEMPLOYMENT RATE
Cherryville Zip Codes
Cherryville Area Codes
Income in Cherryville
Income Overview in Cherryville
Per Capita Income in Cherryville is $28,786, while median incomes of families and households are $80,938 and $57,137 respectively.
| Characteristic | Number | Measure |
| Per Capita Income | 6,113 | $28,786 |
| Median Family Income | 1,464 | $80,938 |
| Mean Family Income | 1,464 | $83,322 |
| Median Household Income | 2,432 | $57,137 |
| Mean Household Income | 2,432 | $70,144 |
| Income Deficit | 1,464 | $0 |
| Wage / Income Gap (%) | 6,113 | 28.89% |
| Wage / Income Gap ($) | 6,113 | 71.11¢ per $1 |
| Gini / Inequality Index | 6,113 | 0.41 |
Earnings by Sex in Cherryville
Average Earnings in Cherryville are $41,255, $49,219 for men and $35,000 for women, a difference of 28.9%.
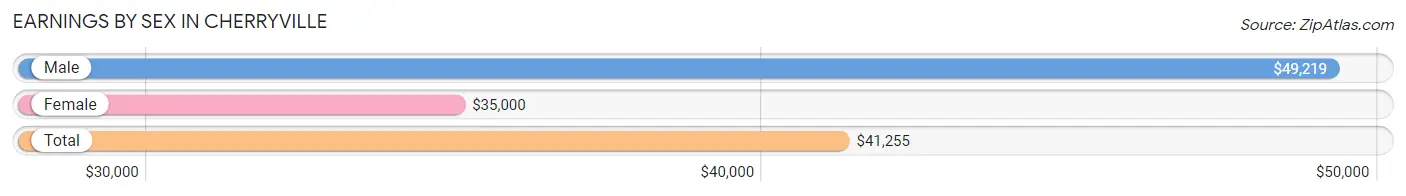
| Sex | Number | Average Earnings |
| Male | 1,510 (55.6%) | $49,219 |
| Female | 1,204 (44.4%) | $35,000 |
| Total | 2,714 (100.0%) | $41,255 |
Earnings by Sex by Income Bracket in Cherryville
The most common earnings brackets in Cherryville are $55,000 to $64,999 for men (203 | 13.4%) and $40,000 to $44,999 for women (165 | 13.7%).
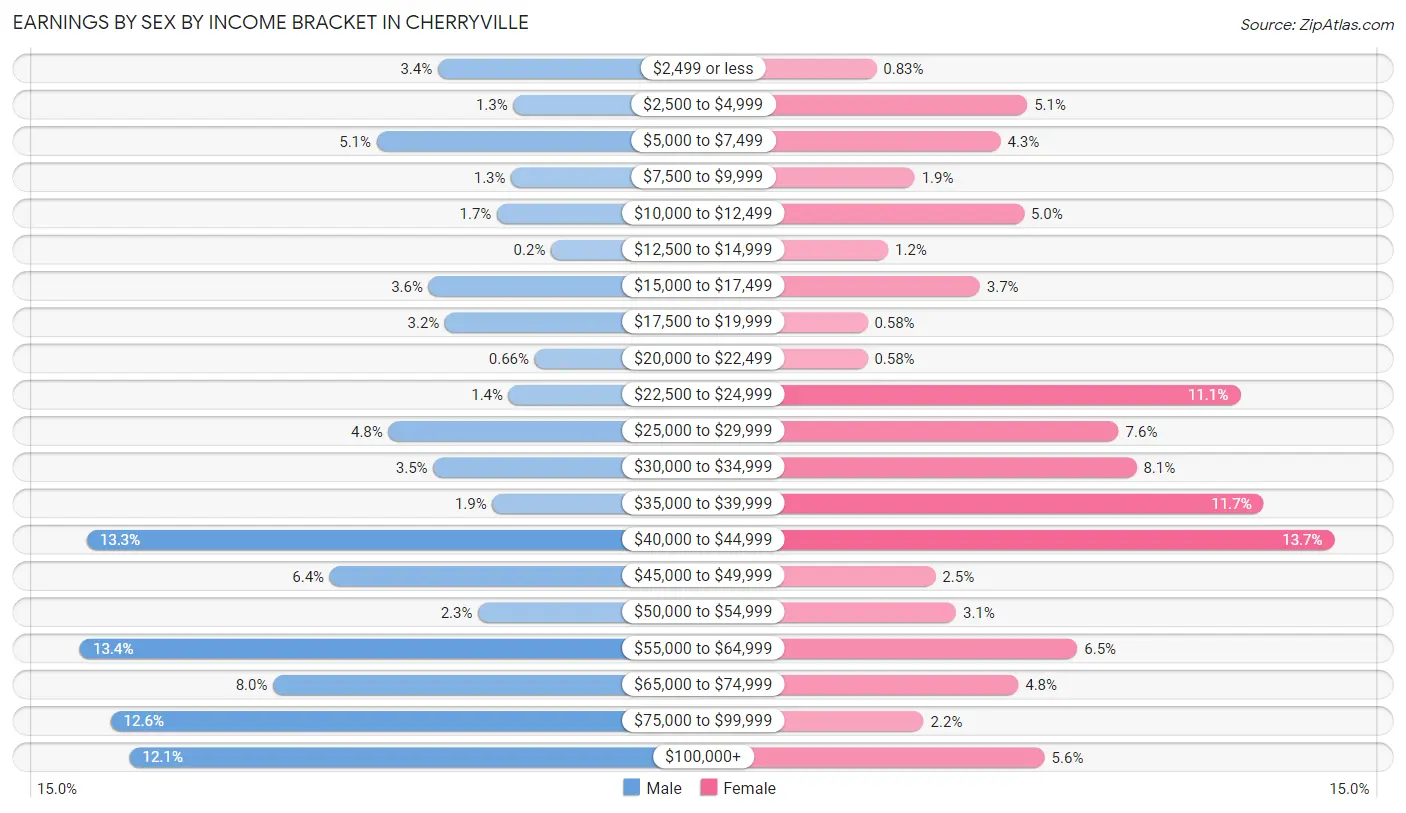
| Income | Male | Female |
| $2,499 or less | 51 (3.4%) | 10 (0.8%) |
| $2,500 to $4,999 | 19 (1.3%) | 61 (5.1%) |
| $5,000 to $7,499 | 77 (5.1%) | 52 (4.3%) |
| $7,500 to $9,999 | 20 (1.3%) | 23 (1.9%) |
| $10,000 to $12,499 | 26 (1.7%) | 60 (5.0%) |
| $12,500 to $14,999 | 3 (0.2%) | 14 (1.2%) |
| $15,000 to $17,499 | 55 (3.6%) | 45 (3.7%) |
| $17,500 to $19,999 | 48 (3.2%) | 7 (0.6%) |
| $20,000 to $22,499 | 10 (0.7%) | 7 (0.6%) |
| $22,500 to $24,999 | 21 (1.4%) | 133 (11.1%) |
| $25,000 to $29,999 | 72 (4.8%) | 92 (7.6%) |
| $30,000 to $34,999 | 53 (3.5%) | 98 (8.1%) |
| $35,000 to $39,999 | 28 (1.8%) | 141 (11.7%) |
| $40,000 to $44,999 | 200 (13.3%) | 165 (13.7%) |
| $45,000 to $49,999 | 97 (6.4%) | 30 (2.5%) |
| $50,000 to $54,999 | 34 (2.2%) | 37 (3.1%) |
| $55,000 to $64,999 | 203 (13.4%) | 78 (6.5%) |
| $65,000 to $74,999 | 121 (8.0%) | 58 (4.8%) |
| $75,000 to $99,999 | 190 (12.6%) | 26 (2.2%) |
| $100,000+ | 182 (12.0%) | 67 (5.6%) |
| Total | 1,510 (100.0%) | 1,204 (100.0%) |
Earnings by Sex by Educational Attainment in Cherryville
Average earnings in Cherryville are $56,721 for men and $36,555 for women, a difference of 35.5%. Men with an educational attainment of bachelor's degree enjoy the highest average annual earnings of $89,375, while those with high school diploma education earn the least with $42,075. Women with an educational attainment of graduate degree earn the most with the average annual earnings of $88,523, while those with bachelor's degree education have the smallest earnings of $32,159.
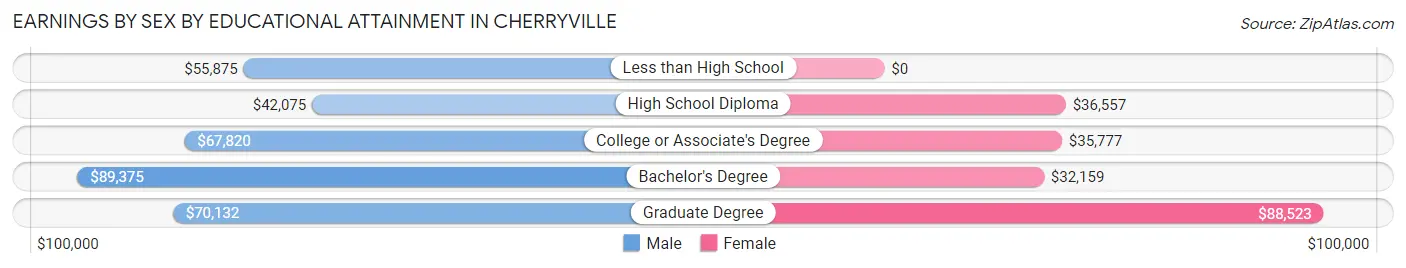
| Educational Attainment | Male Income | Female Income |
| Less than High School | $55,875 | $0 |
| High School Diploma | $42,075 | $36,557 |
| College or Associate's Degree | $67,820 | $35,777 |
| Bachelor's Degree | $89,375 | $32,159 |
| Graduate Degree | $70,132 | $88,523 |
| Total | $56,721 | $36,555 |
Family Income in Cherryville
Family Income Brackets in Cherryville
According to the Cherryville family income data, there are 420 families falling into the $100,000 to $149,999 income range, which is the most common income bracket and makes up 28.7% of all families. Conversely, the $200,000+ income bracket is the least frequent group with only 4 families (0.3%) belonging to this category.
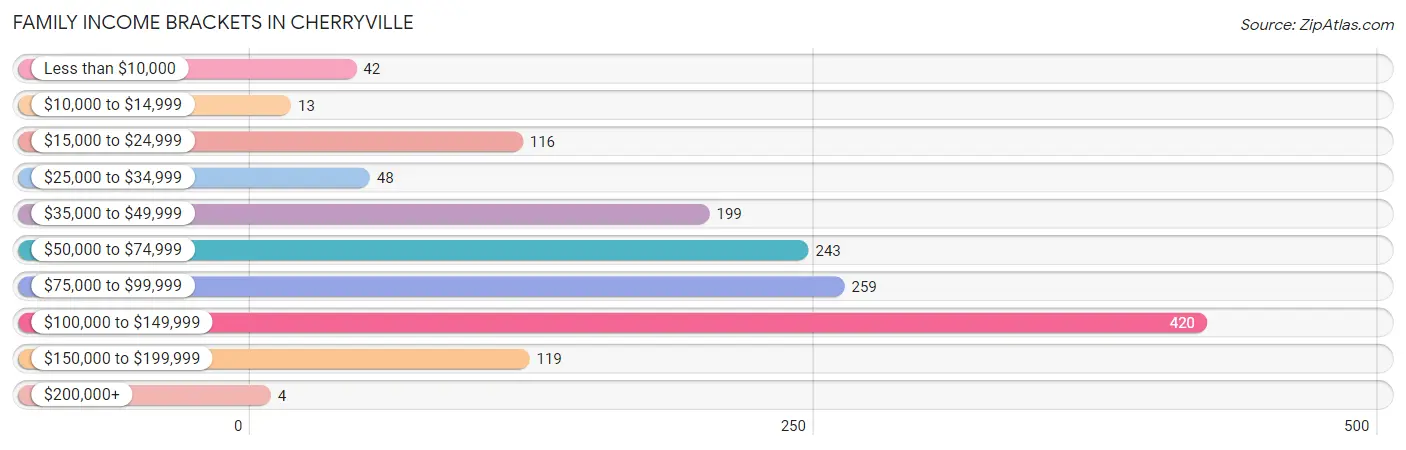
| Income Bracket | # Families | % Families |
| Less than $10,000 | 42 | 2.9% |
| $10,000 to $14,999 | 13 | 0.9% |
| $15,000 to $24,999 | 116 | 7.9% |
| $25,000 to $34,999 | 48 | 3.3% |
| $35,000 to $49,999 | 199 | 13.6% |
| $50,000 to $74,999 | 243 | 16.6% |
| $75,000 to $99,999 | 259 | 17.7% |
| $100,000 to $149,999 | 420 | 28.7% |
| $150,000 to $199,999 | 119 | 8.1% |
| $200,000+ | 4 | 0.3% |
Family Income by Famaliy Size in Cherryville
4-person families (324 | 22.1%) account for the highest median family income in Cherryville with $103,164 per family, while 2-person families (647 | 44.2%) have the highest median income of $28,282 per family member.
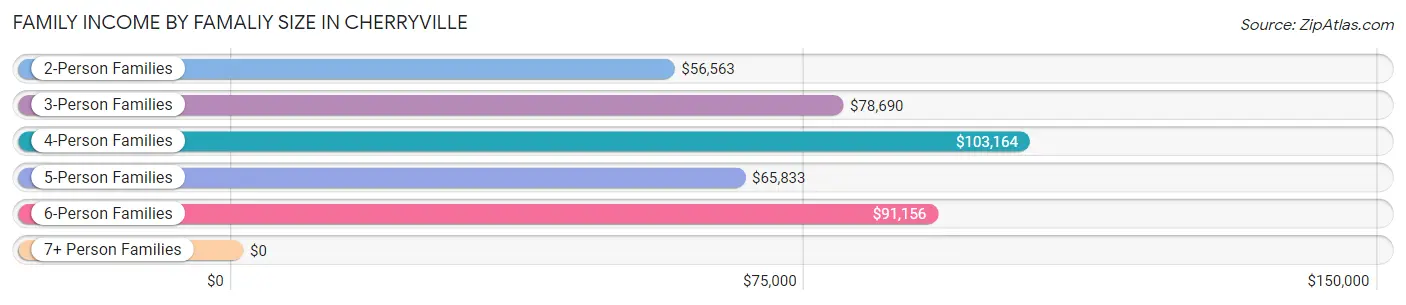
| Income Bracket | # Families | Median Income |
| 2-Person Families | 647 (44.2%) | $56,563 |
| 3-Person Families | 330 (22.5%) | $78,690 |
| 4-Person Families | 324 (22.1%) | $103,164 |
| 5-Person Families | 88 (6.0%) | $65,833 |
| 6-Person Families | 75 (5.1%) | $91,156 |
| 7+ Person Families | 0 (0.0%) | $0 |
| Total | 1,464 (100.0%) | $80,938 |
Family Income by Number of Earners in Cherryville
The median family income in Cherryville is $80,938, with families comprising 2 earners (509) having the highest median family income of $104,375, while families with no earners (251) have the lowest median family income of $42,557, accounting for 34.8% and 17.1% of families, respectively.
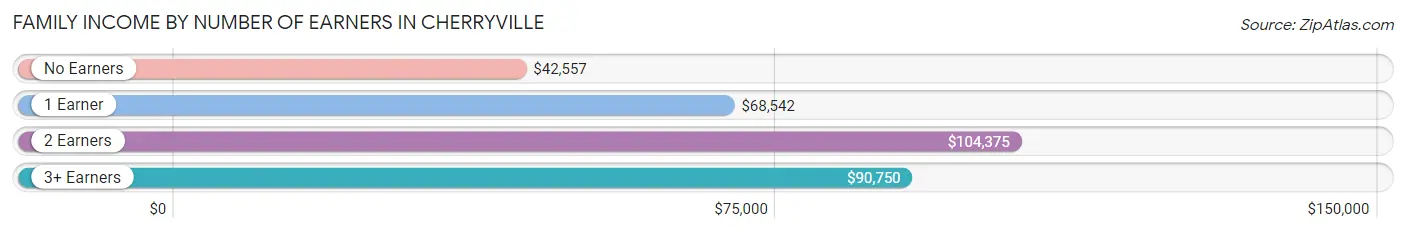
| Number of Earners | # Families | Median Income |
| No Earners | 251 (17.1%) | $42,557 |
| 1 Earner | 590 (40.3%) | $68,542 |
| 2 Earners | 509 (34.8%) | $104,375 |
| 3+ Earners | 114 (7.8%) | $90,750 |
| Total | 1,464 (100.0%) | $80,938 |
Household Income in Cherryville
Household Income Brackets in Cherryville
With 511 households falling in the category, the $100,000 to $149,999 income range is the most frequent in Cherryville, accounting for 21.0% of all households. In contrast, only 24 households (1.0%) fall into the $200,000+ income bracket, making it the least populous group.
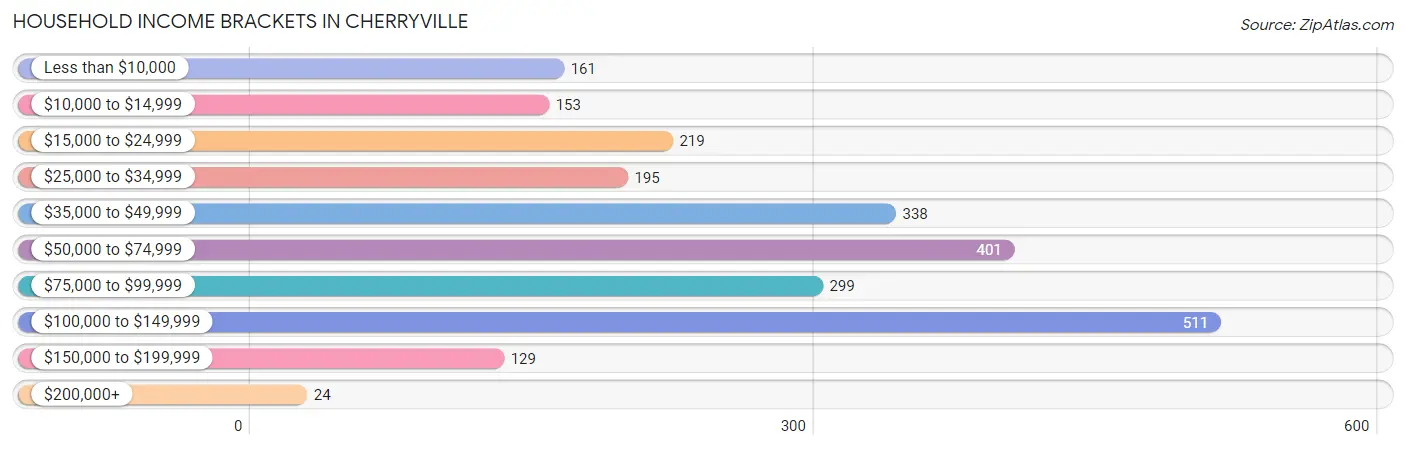
| Income Bracket | # Households | % Households |
| Less than $10,000 | 161 | 6.6% |
| $10,000 to $14,999 | 153 | 6.3% |
| $15,000 to $24,999 | 219 | 9.0% |
| $25,000 to $34,999 | 195 | 8.0% |
| $35,000 to $49,999 | 338 | 13.9% |
| $50,000 to $74,999 | 401 | 16.5% |
| $75,000 to $99,999 | 299 | 12.3% |
| $100,000 to $149,999 | 511 | 21.0% |
| $150,000 to $199,999 | 129 | 5.3% |
| $200,000+ | 24 | 1.0% |
Household Income by Householder Age in Cherryville
The median household income in Cherryville is $57,137, with the highest median household income of $78,631 found in the 25 to 44 years age bracket for the primary householder. A total of 681 households (28.0%) fall into this category. Meanwhile, the 65+ years age bracket for the primary householder has the lowest median household income of $30,625, with 745 households (30.6%) in this group.
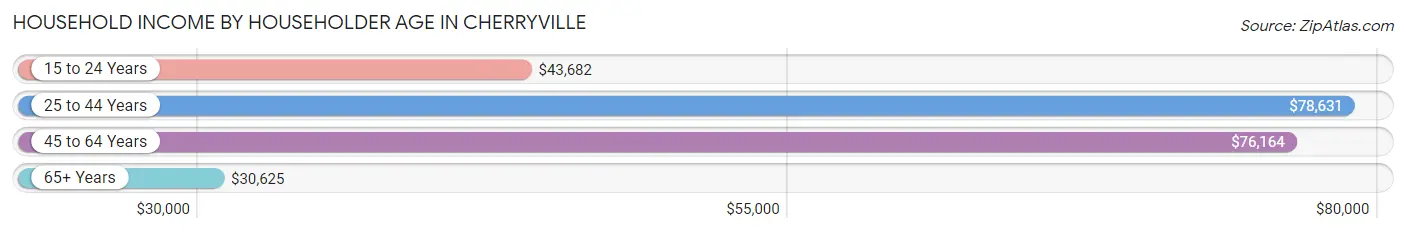
| Income Bracket | # Households | Median Income |
| 15 to 24 Years | 193 (7.9%) | $43,682 |
| 25 to 44 Years | 681 (28.0%) | $78,631 |
| 45 to 64 Years | 813 (33.4%) | $76,164 |
| 65+ Years | 745 (30.6%) | $30,625 |
| Total | 2,432 (100.0%) | $57,137 |
Poverty in Cherryville
Income Below Poverty by Sex and Age in Cherryville
With 11.2% poverty level for males and 16.2% for females among the residents of Cherryville, 6 to 11 year old males and 15 year old females are the most vulnerable to poverty, with 57 males (26.2%) and 12 females (100.0%) in their respective age groups living below the poverty level.
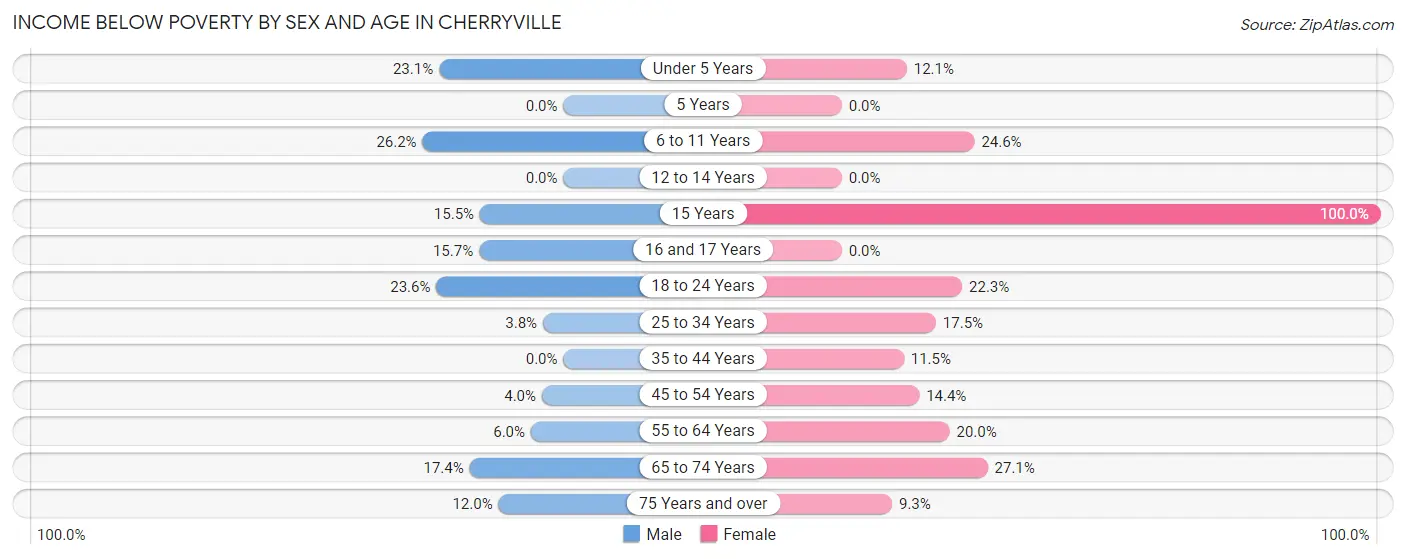
| Age Bracket | Male | Female |
| Under 5 Years | 42 (23.1%) | 17 (12.1%) |
| 5 Years | 0 (0.0%) | 0 (0.0%) |
| 6 to 11 Years | 57 (26.2%) | 32 (24.6%) |
| 12 to 14 Years | 0 (0.0%) | 0 (0.0%) |
| 15 Years | 11 (15.5%) | 12 (100.0%) |
| 16 and 17 Years | 39 (15.7%) | 0 (0.0%) |
| 18 to 24 Years | 79 (23.6%) | 67 (22.3%) |
| 25 to 34 Years | 15 (3.8%) | 65 (17.5%) |
| 35 to 44 Years | 0 (0.0%) | 43 (11.5%) |
| 45 to 54 Years | 14 (4.0%) | 47 (14.4%) |
| 55 to 64 Years | 17 (6.0%) | 66 (20.0%) |
| 65 to 74 Years | 47 (17.4%) | 102 (27.1%) |
| 75 Years and over | 13 (12.0%) | 25 (9.3%) |
| Total | 334 (11.2%) | 476 (16.2%) |
Income Above Poverty by Sex and Age in Cherryville
According to the poverty statistics in Cherryville, males aged 5 years and females aged 12 to 14 years are the age groups that are most secure financially, with 100.0% of males and 100.0% of females in these age groups living above the poverty line.
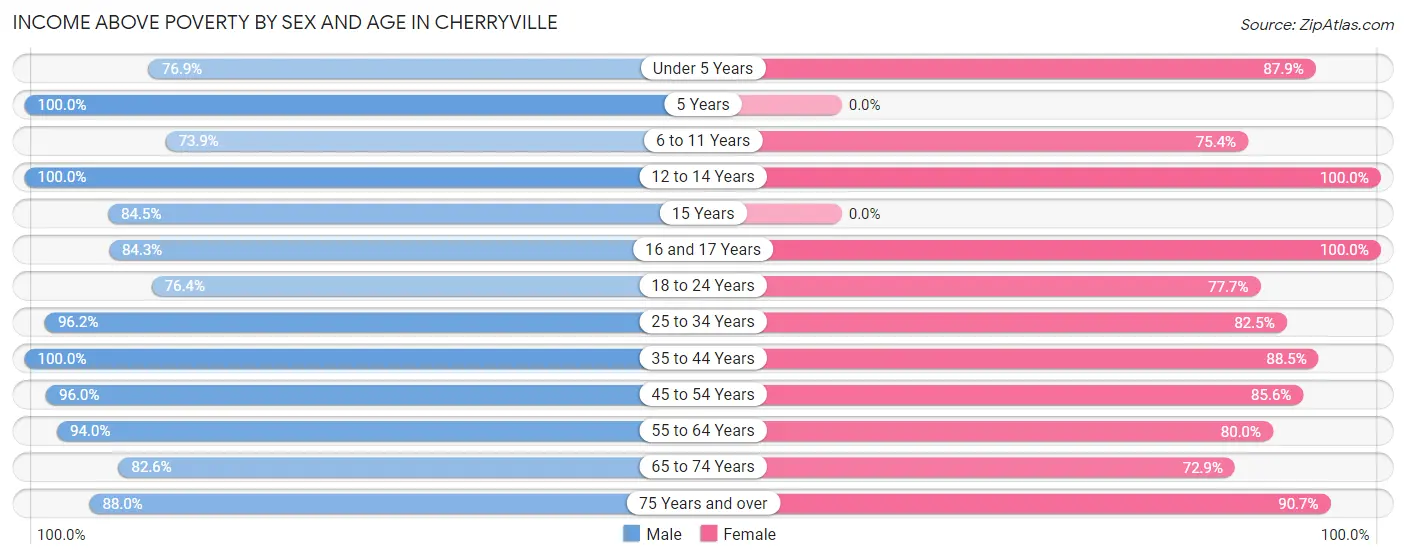
| Age Bracket | Male | Female |
| Under 5 Years | 140 (76.9%) | 124 (87.9%) |
| 5 Years | 15 (100.0%) | 0 (0.0%) |
| 6 to 11 Years | 161 (73.9%) | 98 (75.4%) |
| 12 to 14 Years | 162 (100.0%) | 248 (100.0%) |
| 15 Years | 60 (84.5%) | 0 (0.0%) |
| 16 and 17 Years | 210 (84.3%) | 56 (100.0%) |
| 18 to 24 Years | 256 (76.4%) | 233 (77.7%) |
| 25 to 34 Years | 381 (96.2%) | 307 (82.5%) |
| 35 to 44 Years | 344 (100.0%) | 331 (88.5%) |
| 45 to 54 Years | 337 (96.0%) | 280 (85.6%) |
| 55 to 64 Years | 265 (94.0%) | 264 (80.0%) |
| 65 to 74 Years | 223 (82.6%) | 275 (72.9%) |
| 75 Years and over | 95 (88.0%) | 243 (90.7%) |
| Total | 2,649 (88.8%) | 2,459 (83.8%) |
Income Below Poverty Among Married-Couple Families in Cherryville
The poverty statistics for married-couple families in Cherryville show that 0.5% or 5 of the total 1,022 families live below the poverty line. Families with no children have the highest poverty rate of 1.0%, comprising of 5 families. On the other hand, families with 1 or 2 children have the lowest poverty rate of 0.0%, which includes 0 families.
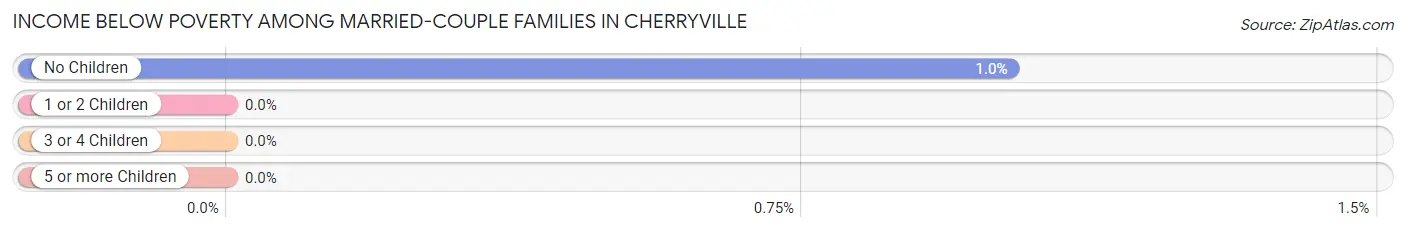
| Children | Above Poverty | Below Poverty |
| No Children | 483 (99.0%) | 5 (1.0%) |
| 1 or 2 Children | 470 (100.0%) | 0 (0.0%) |
| 3 or 4 Children | 64 (100.0%) | 0 (0.0%) |
| 5 or more Children | 0 (0.0%) | 0 (0.0%) |
| Total | 1,017 (99.5%) | 5 (0.5%) |
Income Below Poverty Among Single-Parent Households in Cherryville
According to the poverty data in Cherryville, 6.5% or 7 single-father households and 40.3% or 135 single-mother households are living below the poverty line. Among single-father households, those with 1 or 2 children have the highest poverty rate, with 7 households (8.6%) experiencing poverty. Likewise, among single-mother households, those with 3 or 4 children have the highest poverty rate, with 17 households (100.0%) falling below the poverty line.
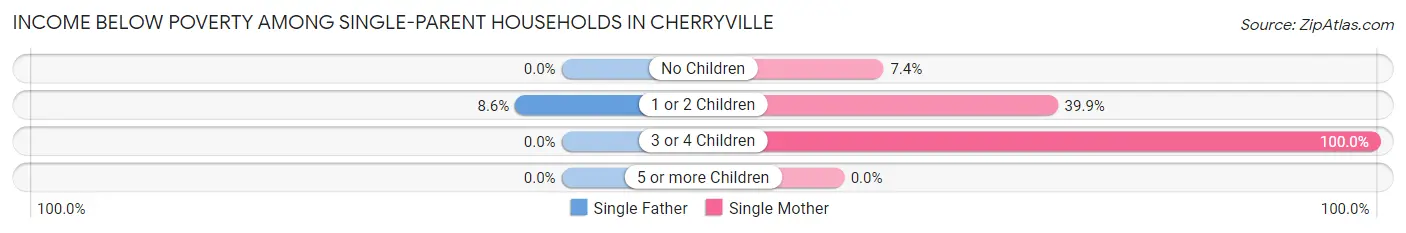
| Children | Single Father | Single Mother |
| No Children | 0 (0.0%) | 2 (7.4%) |
| 1 or 2 Children | 7 (8.6%) | 116 (39.9%) |
| 3 or 4 Children | 0 (0.0%) | 17 (100.0%) |
| 5 or more Children | 0 (0.0%) | 0 (0.0%) |
| Total | 7 (6.5%) | 135 (40.3%) |
Income Below Poverty Among Married-Couple vs Single-Parent Households in Cherryville
The poverty data for Cherryville shows that 5 of the married-couple family households (0.5%) and 142 of the single-parent households (32.1%) are living below the poverty level. Within the married-couple family households, those with no children have the highest poverty rate, with 5 households (1.0%) falling below the poverty line. Among the single-parent households, those with 3 or 4 children have the highest poverty rate, with 17 household (39.5%) living below poverty.
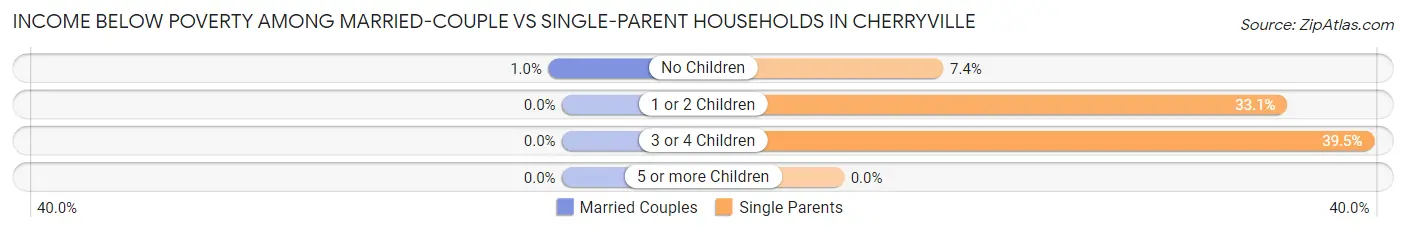
| Children | Married-Couple Families | Single-Parent Households |
| No Children | 5 (1.0%) | 2 (7.4%) |
| 1 or 2 Children | 0 (0.0%) | 123 (33.1%) |
| 3 or 4 Children | 0 (0.0%) | 17 (39.5%) |
| 5 or more Children | 0 (0.0%) | 0 (0.0%) |
| Total | 5 (0.5%) | 142 (32.1%) |
Race in Cherryville
The most populous races in Cherryville are White / Caucasian (5,449 | 89.1%), Black / African American (401 | 6.6%), and Hispanic or Latino (224 | 3.7%).
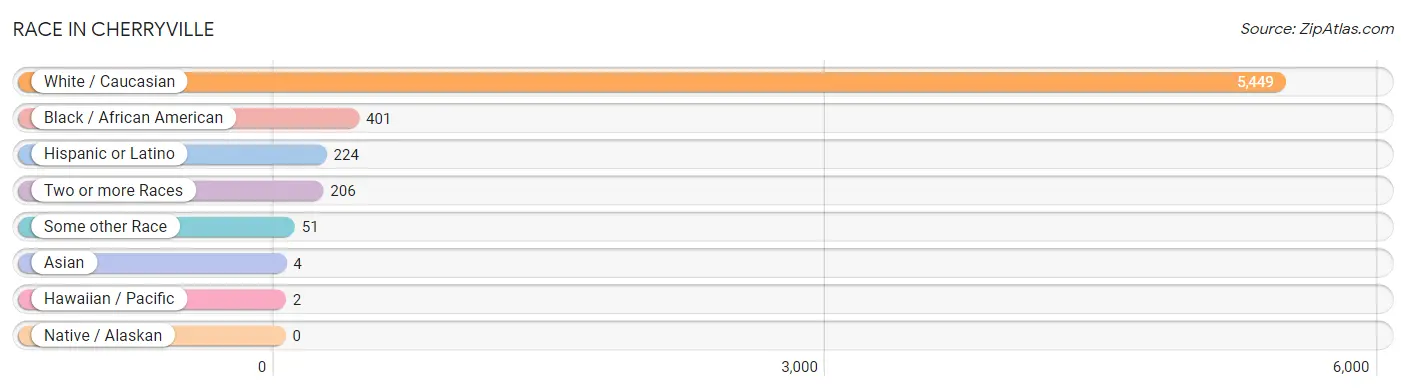
| Race | # Population | % Population |
| Asian | 4 | 0.1% |
| Black / African American | 401 | 6.6% |
| Hawaiian / Pacific | 2 | 0.0% |
| Hispanic or Latino | 224 | 3.7% |
| Native / Alaskan | 0 | 0.0% |
| White / Caucasian | 5,449 | 89.1% |
| Two or more Races | 206 | 3.4% |
| Some other Race | 51 | 0.8% |
| Total | 6,113 | 100.0% |
Ancestry in Cherryville
The most populous ancestries reported in Cherryville are American (1,138 | 18.6%), German (1,090 | 17.8%), Irish (603 | 9.9%), English (527 | 8.6%), and Scotch-Irish (310 | 5.1%), together accounting for 60.0% of all Cherryville residents.
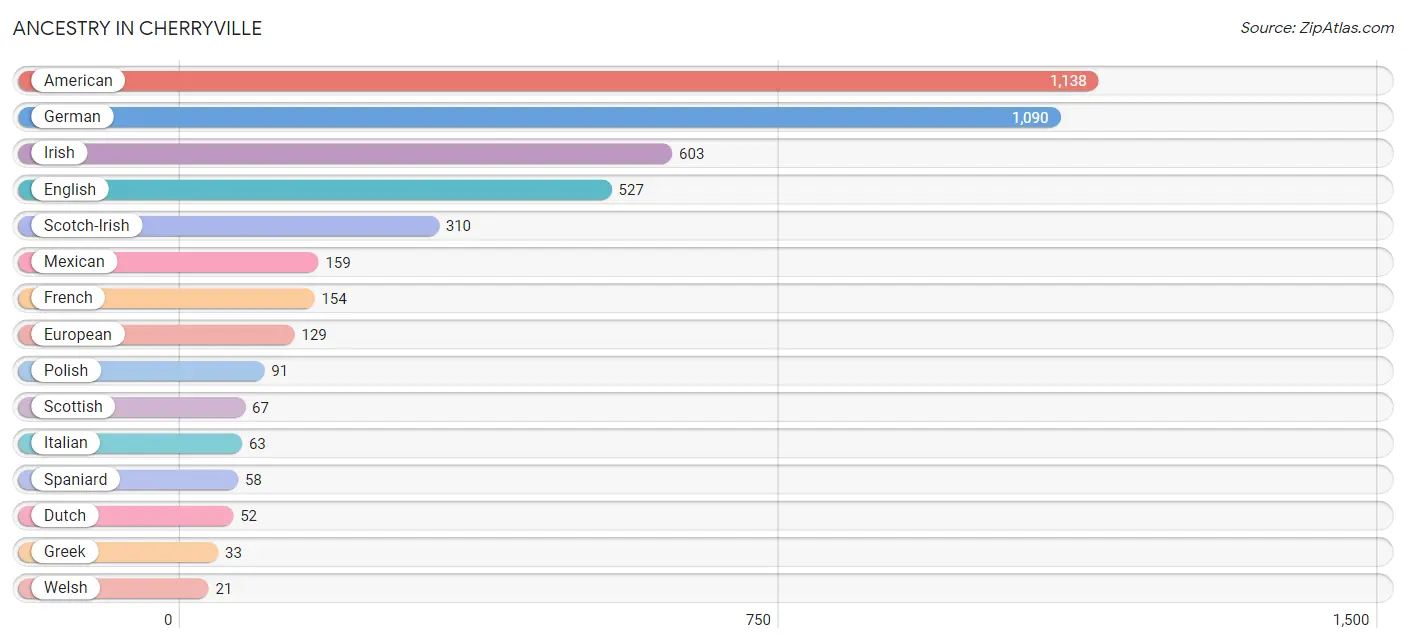
| Ancestry | # Population | % Population |
| African | 12 | 0.2% |
| American | 1,138 | 18.6% |
| British | 18 | 0.3% |
| Cherokee | 3 | 0.1% |
| Dutch | 52 | 0.9% |
| English | 527 | 8.6% |
| European | 129 | 2.1% |
| French | 154 | 2.5% |
| German | 1,090 | 17.8% |
| Greek | 33 | 0.5% |
| Irish | 603 | 9.9% |
| Italian | 63 | 1.0% |
| Mexican | 159 | 2.6% |
| Polish | 91 | 1.5% |
| Puerto Rican | 7 | 0.1% |
| Scotch-Irish | 310 | 5.1% |
| Scottish | 67 | 1.1% |
| Spaniard | 58 | 0.9% |
| Sri Lankan | 4 | 0.1% |
| Subsaharan African | 12 | 0.2% |
| Swedish | 18 | 0.3% |
| Swiss | 6 | 0.1% |
| Welsh | 21 | 0.3% | View All 23 Rows |
Immigrants in Cherryville
The most numerous immigrant groups reported in Cherryville came from Central America (53 | 0.9%), Latin America (53 | 0.9%), Mexico (53 | 0.9%), Europe (11 | 0.2%), and Germany (11 | 0.2%), together accounting for 3.0% of all Cherryville residents.
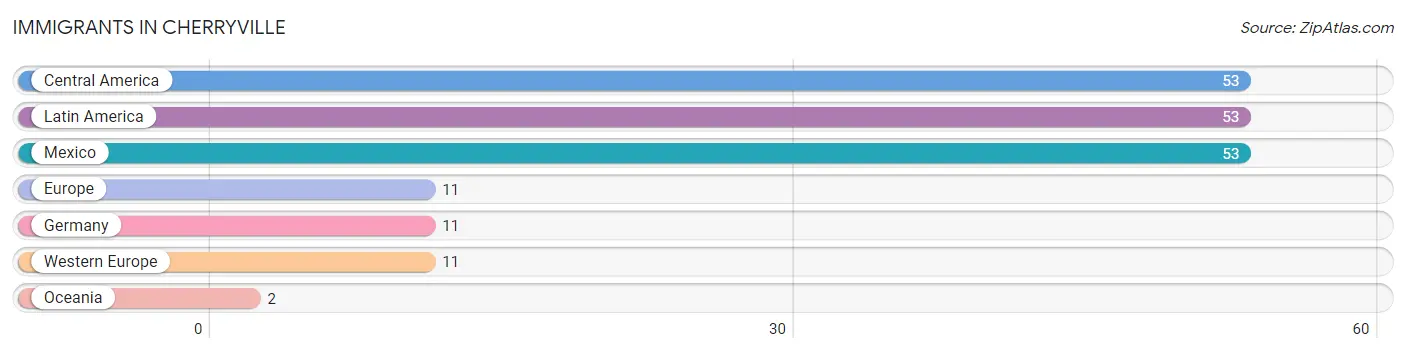
| Immigration Origin | # Population | % Population |
| Central America | 53 | 0.9% |
| Europe | 11 | 0.2% |
| Germany | 11 | 0.2% |
| Latin America | 53 | 0.9% |
| Mexico | 53 | 0.9% |
| Oceania | 2 | 0.0% |
| Western Europe | 11 | 0.2% | View All 7 Rows |
Sex and Age in Cherryville
Sex and Age in Cherryville
The most populous age groups in Cherryville are 15 to 19 Years (474 | 15.4%) for men and 10 to 14 Years (285 | 9.4%) for women.
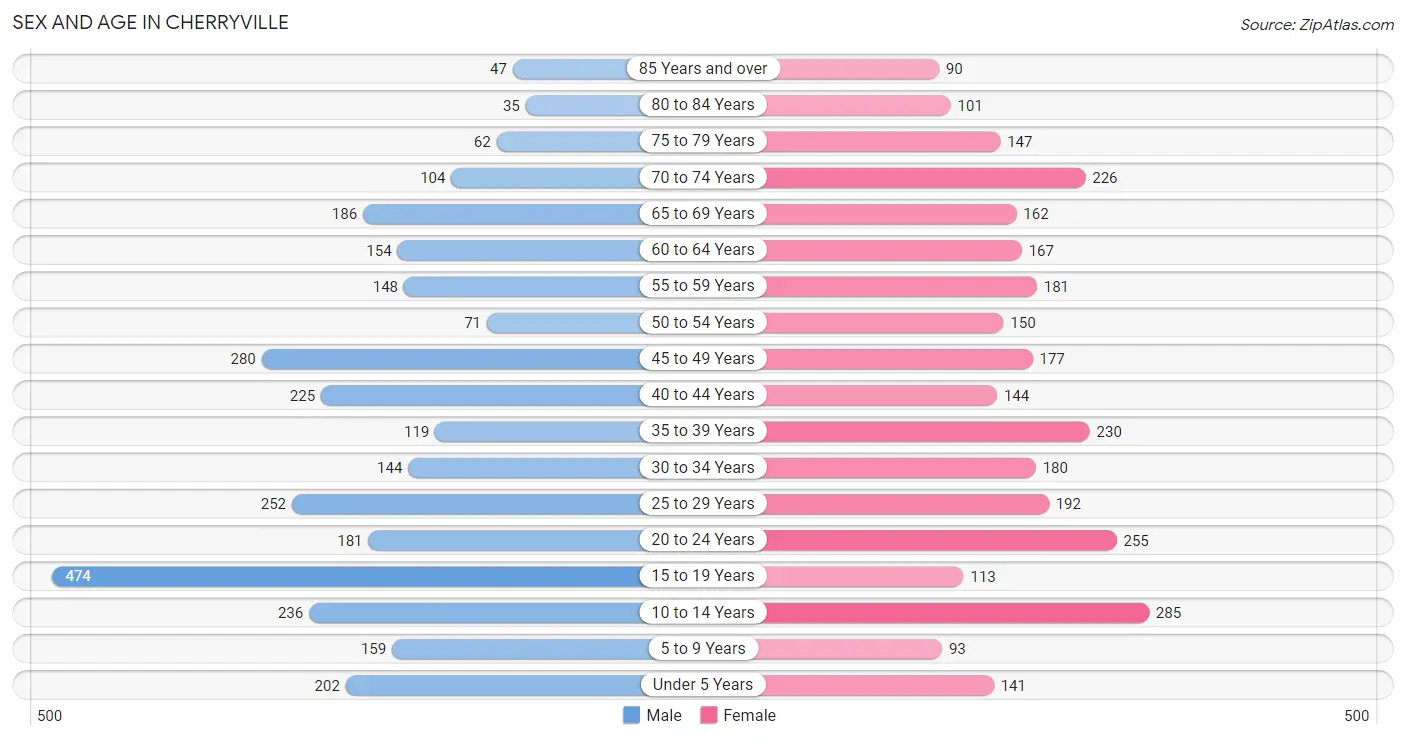
| Age Bracket | Male | Female |
| Under 5 Years | 202 (6.6%) | 141 (4.6%) |
| 5 to 9 Years | 159 (5.2%) | 93 (3.1%) |
| 10 to 14 Years | 236 (7.7%) | 285 (9.4%) |
| 15 to 19 Years | 474 (15.4%) | 113 (3.7%) |
| 20 to 24 Years | 181 (5.9%) | 255 (8.4%) |
| 25 to 29 Years | 252 (8.2%) | 192 (6.3%) |
| 30 to 34 Years | 144 (4.7%) | 180 (5.9%) |
| 35 to 39 Years | 119 (3.9%) | 230 (7.6%) |
| 40 to 44 Years | 225 (7.3%) | 144 (4.8%) |
| 45 to 49 Years | 280 (9.1%) | 177 (5.8%) |
| 50 to 54 Years | 71 (2.3%) | 150 (4.9%) |
| 55 to 59 Years | 148 (4.8%) | 181 (6.0%) |
| 60 to 64 Years | 154 (5.0%) | 167 (5.5%) |
| 65 to 69 Years | 186 (6.0%) | 162 (5.3%) |
| 70 to 74 Years | 104 (3.4%) | 226 (7.4%) |
| 75 to 79 Years | 62 (2.0%) | 147 (4.9%) |
| 80 to 84 Years | 35 (1.1%) | 101 (3.3%) |
| 85 Years and over | 47 (1.5%) | 90 (3.0%) |
| Total | 3,079 (100.0%) | 3,034 (100.0%) |
Families and Households in Cherryville
Median Family Size in Cherryville
The median family size in Cherryville is 3.08 persons per family, with married-couple families (1,022 | 69.8%) accounting for the largest median family size of 3.32 persons per family. On the other hand, single male/father families (107 | 7.3%) represent the smallest median family size with 2.47 persons per family.
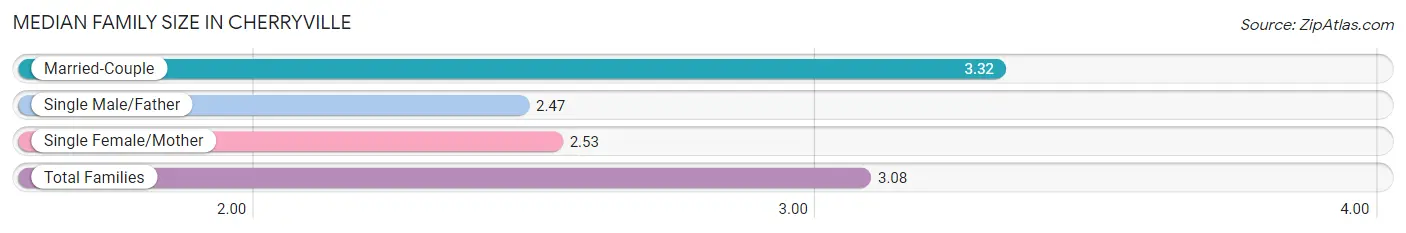
| Family Type | # Families | Family Size |
| Married-Couple | 1,022 (69.8%) | 3.32 |
| Single Male/Father | 107 (7.3%) | 2.47 |
| Single Female/Mother | 335 (22.9%) | 2.53 |
| Total Families | 1,464 (100.0%) | 3.08 |
Median Household Size in Cherryville
The median household size in Cherryville is 2.44 persons per household, with married-couple households (1,022 | 42.0%) accounting for the largest median household size of 3.41 persons per household. non-family households (968 | 39.8%) represent the smallest median household size with 1.18 persons per household.
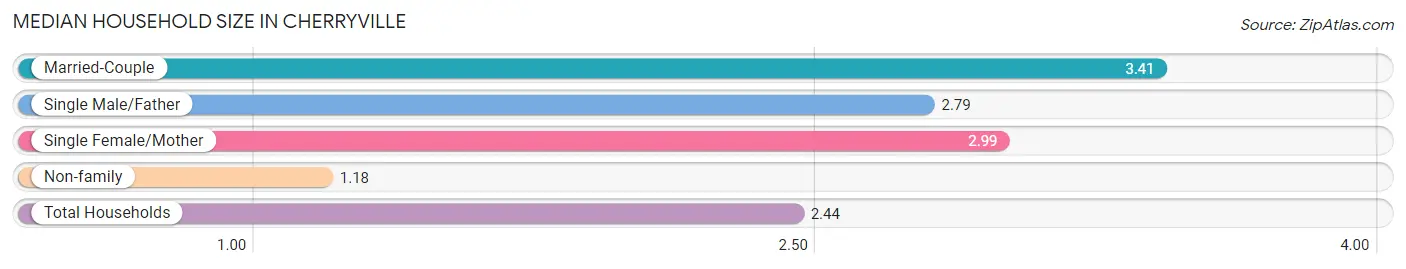
| Household Type | # Households | Household Size |
| Married-Couple | 1,022 (42.0%) | 3.41 |
| Single Male/Father | 107 (4.4%) | 2.79 |
| Single Female/Mother | 335 (13.8%) | 2.99 |
| Non-family | 968 (39.8%) | 1.18 |
| Total Households | 2,432 (100.0%) | 2.44 |
Household Size by Marriage Status in Cherryville
Out of a total of 2,432 households in Cherryville, 1,464 (60.2%) are family households, while 968 (39.8%) are nonfamily households. The most numerous type of family households are 2-person households, comprising 516, and the most common type of nonfamily households are 1-person households, comprising 812.
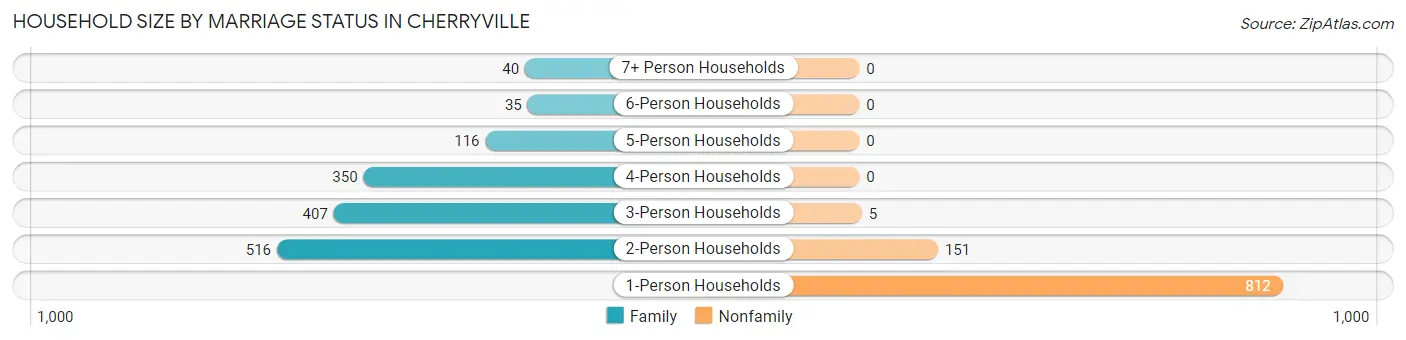
| Household Size | Family Households | Nonfamily Households |
| 1-Person Households | - | 812 (33.4%) |
| 2-Person Households | 516 (21.2%) | 151 (6.2%) |
| 3-Person Households | 407 (16.7%) | 5 (0.2%) |
| 4-Person Households | 350 (14.4%) | 0 (0.0%) |
| 5-Person Households | 116 (4.8%) | 0 (0.0%) |
| 6-Person Households | 35 (1.4%) | 0 (0.0%) |
| 7+ Person Households | 40 (1.6%) | 0 (0.0%) |
| Total | 1,464 (60.2%) | 968 (39.8%) |
Female Fertility in Cherryville
Fertility by Age in Cherryville
Average fertility rate in Cherryville is 64.0 births per 1,000 women. Women in the age bracket of 20 to 34 years have the highest fertility rate with 132.0 births per 1,000 women. Women in the age bracket of 20 to 34 years acount for 100.0% of all women with births.
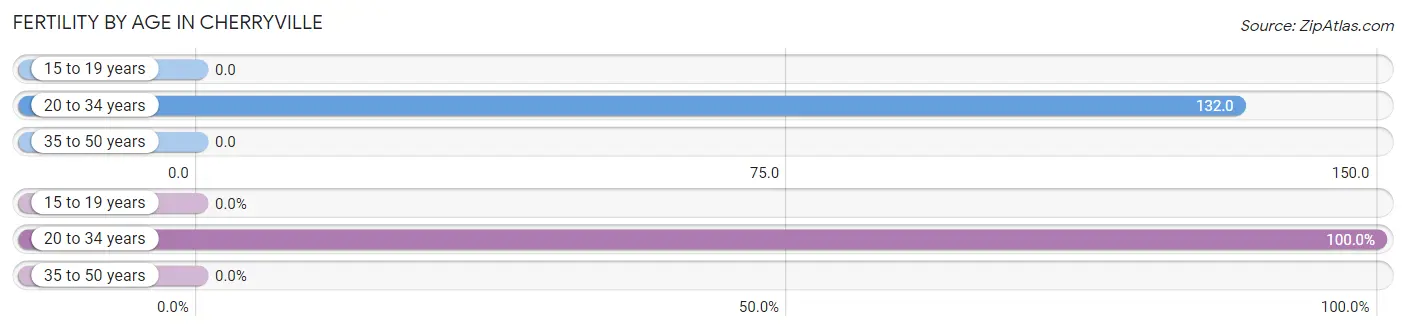
| Age Bracket | Women with Births | Births / 1,000 Women |
| 15 to 19 years | 0 (0.0%) | 0.0 |
| 20 to 34 years | 83 (100.0%) | 132.0 |
| 35 to 50 years | 0 (0.0%) | 0.0 |
| Total | 83 (100.0%) | 64.0 |
Fertility by Age by Marriage Status in Cherryville
26.5% of women with births (83) in Cherryville are married. The highest percentage of unmarried women with births falls into 20 to 34 years age bracket with 73.5% of them unmarried at the time of birth, while the lowest percentage of unmarried women with births belong to 20 to 34 years age bracket with 73.5% of them unmarried.
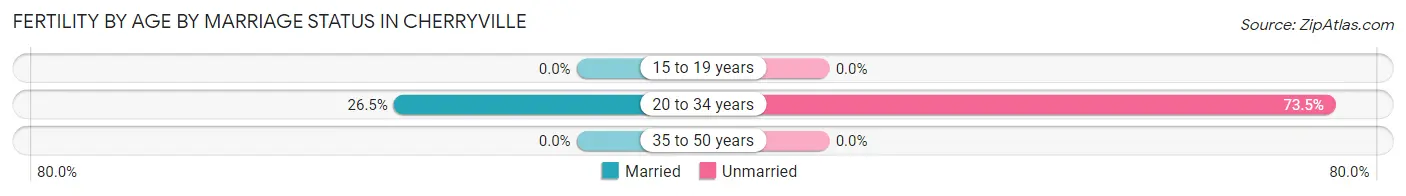
| Age Bracket | Married | Unmarried |
| 15 to 19 years | 0 (0.0%) | 0 (0.0%) |
| 20 to 34 years | 22 (26.5%) | 61 (73.5%) |
| 35 to 50 years | 0 (0.0%) | 0 (0.0%) |
| Total | 22 (26.5%) | 61 (73.5%) |
Fertility by Education in Cherryville
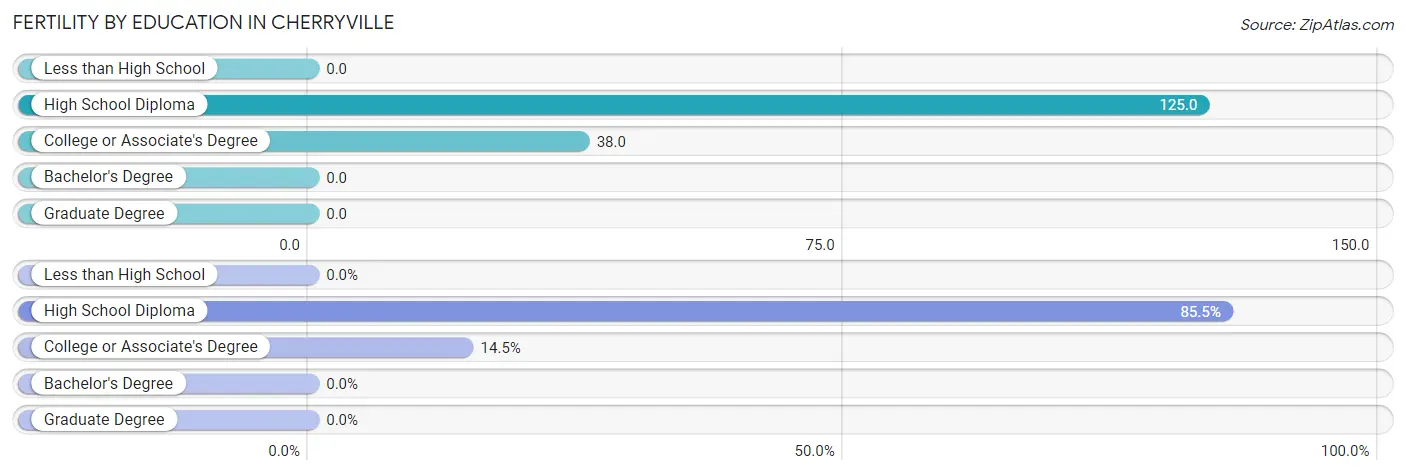
| Educational Attainment | Women with Births | Births / 1,000 Women |
| Less than High School | 0 (0.0%) | 0.0 |
| High School Diploma | 71 (85.5%) | 125.0 |
| College or Associate's Degree | 12 (14.5%) | 38.0 |
| Bachelor's Degree | 0 (0.0%) | 0.0 |
| Graduate Degree | 0 (0.0%) | 0.0 |
| Total | 83 (100.0%) | 64.0 |
Fertility by Education by Marriage Status in Cherryville
73.5% of women with births in Cherryville are unmarried. Women with the educational attainment of college or associate's degree are most likely to be married with 100.0% of them married at childbirth, while women with the educational attainment of high school diploma are least likely to be married with 85.9% of them unmarried at childbirth.
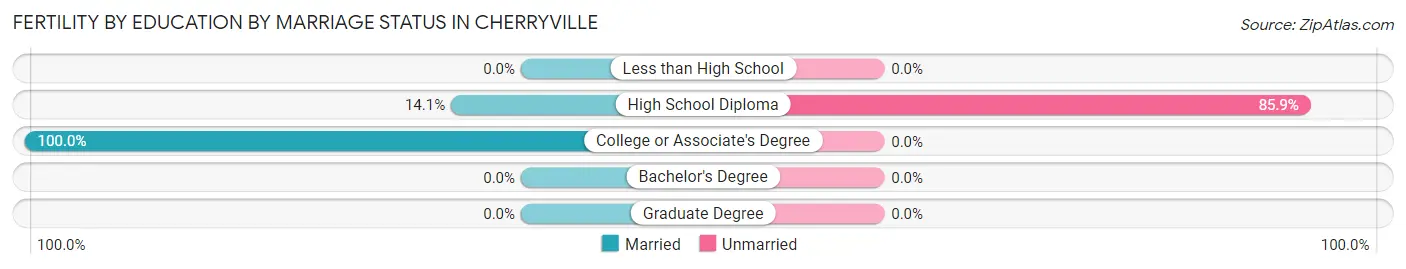
| Educational Attainment | Married | Unmarried |
| Less than High School | 0 (0.0%) | 0 (0.0%) |
| High School Diploma | 10 (14.1%) | 61 (85.9%) |
| College or Associate's Degree | 12 (100.0%) | 0 (0.0%) |
| Bachelor's Degree | 0 (0.0%) | 0 (0.0%) |
| Graduate Degree | 0 (0.0%) | 0 (0.0%) |
| Total | 22 (26.5%) | 61 (73.5%) |
Employment Characteristics in Cherryville
Employment by Class of Employer in Cherryville
Among the 2,576 employed individuals in Cherryville, private company employees (1,838 | 71.4%), local government employees (291 | 11.3%), and not-for-profit organizations (138 | 5.4%) make up the most common classes of employment.
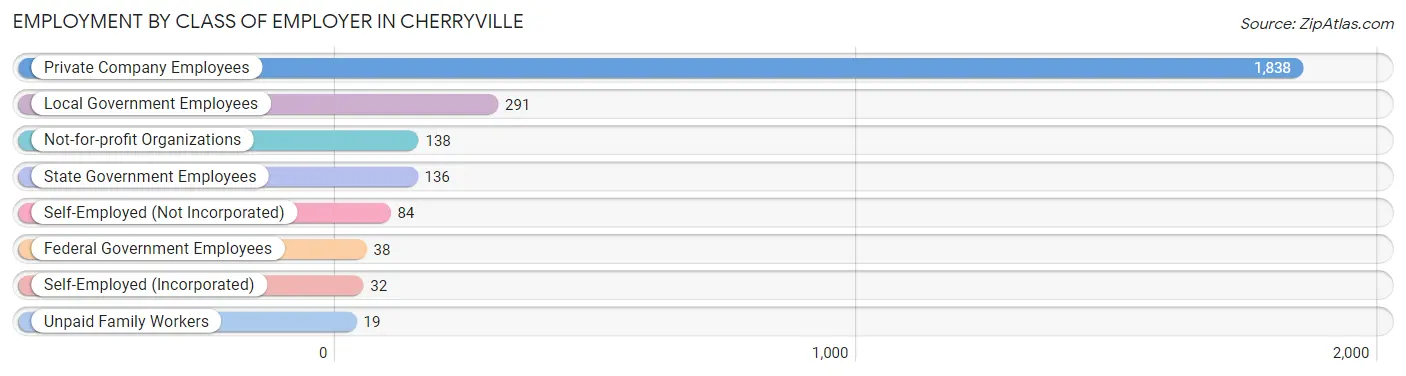
| Employer Class | # Employees | % Employees |
| Private Company Employees | 1,838 | 71.4% |
| Self-Employed (Incorporated) | 32 | 1.2% |
| Self-Employed (Not Incorporated) | 84 | 3.3% |
| Not-for-profit Organizations | 138 | 5.4% |
| Local Government Employees | 291 | 11.3% |
| State Government Employees | 136 | 5.3% |
| Federal Government Employees | 38 | 1.5% |
| Unpaid Family Workers | 19 | 0.7% |
| Total | 2,576 | 100.0% |
Employment Status by Age in Cherryville
According to the labor force statistics for Cherryville, out of the total population over 16 years of age (4,914), 55.7% or 2,737 individuals are in the labor force, with 3.5% or 96 of them unemployed. The age group with the highest labor force participation rate is 25 to 29 years, with 99.3% or 441 individuals in the labor force. Within the labor force, the 20 to 24 years age range has the highest percentage of unemployed individuals, with 6.9% or 21 of them being unemployed.
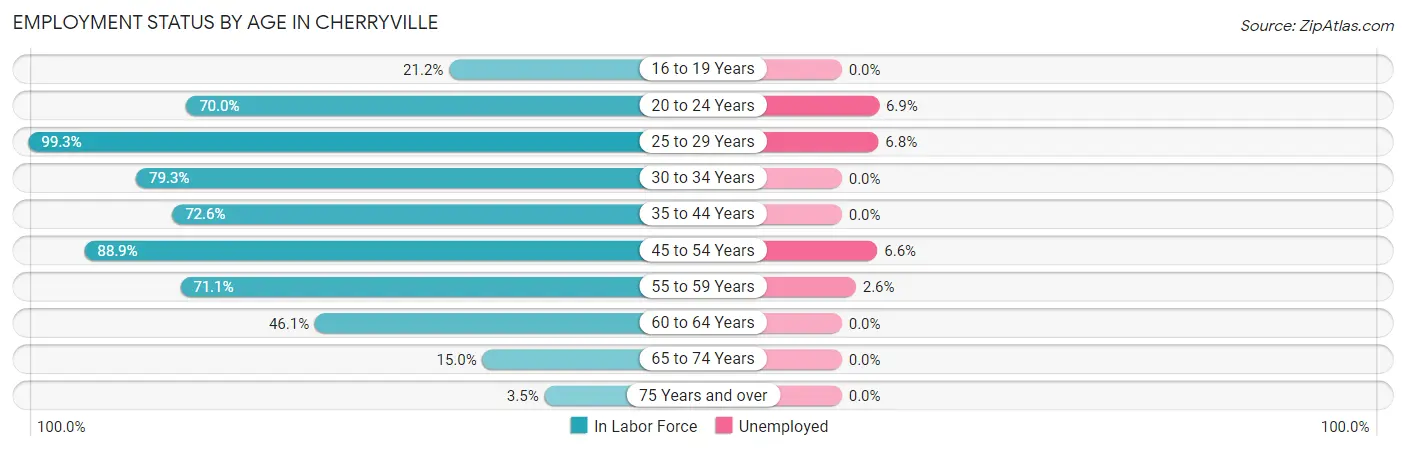
| Age Bracket | In Labor Force | Unemployed |
| 16 to 19 Years | 107 (21.2%) | 0 (0.0%) |
| 20 to 24 Years | 305 (70.0%) | 21 (6.9%) |
| 25 to 29 Years | 441 (99.3%) | 30 (6.8%) |
| 30 to 34 Years | 257 (79.3%) | 0 (0.0%) |
| 35 to 44 Years | 521 (72.6%) | 0 (0.0%) |
| 45 to 54 Years | 603 (88.9%) | 40 (6.6%) |
| 55 to 59 Years | 234 (71.1%) | 6 (2.6%) |
| 60 to 64 Years | 148 (46.1%) | 0 (0.0%) |
| 65 to 74 Years | 102 (15.0%) | 0 (0.0%) |
| 75 Years and over | 17 (3.5%) | 0 (0.0%) |
| Total | 2,737 (55.7%) | 96 (3.5%) |
Employment Status by Educational Attainment in Cherryville
According to labor force statistics for Cherryville, 78.3% of individuals (2,203) out of the total population between 25 and 64 years of age (2,814) are in the labor force, with 3.4% or 75 of them being unemployed. The group with the highest labor force participation rate are those with the educational attainment of bachelor's degree or higher, with 95.9% or 733 individuals in the labor force. Within the labor force, individuals with high school diploma education have the highest percentage of unemployment, with 9.5% or 70 of them being unemployed.
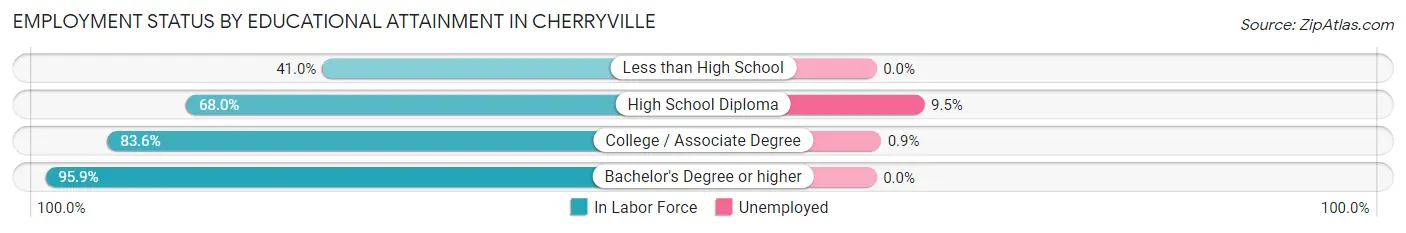
| Educational Attainment | In Labor Force | Unemployed |
| Less than High School | 71 (41.0%) | 0 (0.0%) |
| High School Diploma | 736 (68.0%) | 103 (9.5%) |
| College / Associate Degree | 664 (83.6%) | 7 (0.9%) |
| Bachelor's Degree or higher | 733 (95.9%) | 0 (0.0%) |
| Total | 2,203 (78.3%) | 96 (3.4%) |
Employment Occupations by Sex in Cherryville
Management, Business, Science and Arts Occupations
The most common Management, Business, Science and Arts occupations in Cherryville are Management (356 | 13.5%), Community & Social Service (327 | 12.4%), Education Instruction & Library (258 | 9.8%), Health Diagnosing & Treating (144 | 5.5%), and Education, Arts & Media (56 | 2.1%).
Management, Business, Science and Arts Occupations by Sex
Within the Management, Business, Science and Arts occupations in Cherryville, the most male-oriented occupations are Architecture & Engineering (100.0%), Arts, Media & Entertainment (100.0%), and Computers, Engineering & Science (80.4%), while the most female-oriented occupations are Computers & Mathematics (100.0%), Life, Physical & Social Science (100.0%), and Health Diagnosing & Treating (100.0%).
| Occupation | Male | Female |
| Management | 252 (70.8%) | 104 (29.2%) |
| Business & Financial | 12 (32.4%) | 25 (67.6%) |
| Computers, Engineering & Science | 41 (80.4%) | 10 (19.6%) |
| Computers & Mathematics | 0 (0.0%) | 5 (100.0%) |
| Architecture & Engineering | 41 (100.0%) | 0 (0.0%) |
| Life, Physical & Social Science | 0 (0.0%) | 5 (100.0%) |
| Community & Social Service | 36 (11.0%) | 291 (89.0%) |
| Education, Arts & Media | 3 (5.4%) | 53 (94.6%) |
| Legal Services & Support | 0 (0.0%) | 0 (0.0%) |
| Education Instruction & Library | 20 (7.7%) | 238 (92.2%) |
| Arts, Media & Entertainment | 13 (100.0%) | 0 (0.0%) |
| Health Diagnosing & Treating | 0 (0.0%) | 144 (100.0%) |
| Health Technologists | 0 (0.0%) | 54 (100.0%) |
| Total (Category) | 341 (37.3%) | 574 (62.7%) |
| Total (Overall) | 1,442 (54.7%) | 1,196 (45.3%) |
Services Occupations
The most common Services occupations in Cherryville are Security & Protection (260 | 9.9%), Firefighting & Prevention (138 | 5.2%), Cleaning & Maintenance (128 | 4.9%), Law Enforcement (122 | 4.6%), and Food Preparation & Serving (90 | 3.4%).
Services Occupations by Sex
Within the Services occupations in Cherryville, the most male-oriented occupations are Healthcare Support (100.0%), Law Enforcement (100.0%), and Security & Protection (79.6%), while the most female-oriented occupations are Food Preparation & Serving (75.6%), Personal Care & Service (51.4%), and Firefighting & Prevention (38.4%).
| Occupation | Male | Female |
| Healthcare Support | 6 (100.0%) | 0 (0.0%) |
| Security & Protection | 207 (79.6%) | 53 (20.4%) |
| Firefighting & Prevention | 85 (61.6%) | 53 (38.4%) |
| Law Enforcement | 122 (100.0%) | 0 (0.0%) |
| Food Preparation & Serving | 22 (24.4%) | 68 (75.6%) |
| Cleaning & Maintenance | 91 (71.1%) | 37 (28.9%) |
| Personal Care & Service | 34 (48.6%) | 36 (51.4%) |
| Total (Category) | 360 (65.0%) | 194 (35.0%) |
| Total (Overall) | 1,442 (54.7%) | 1,196 (45.3%) |
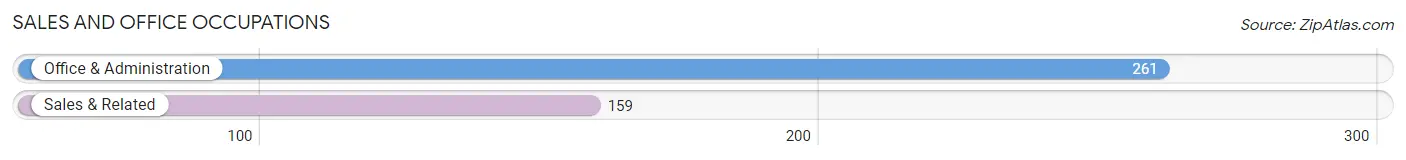
Sales and Office Occupations
The most common Sales and Office occupations in Cherryville are Office & Administration (261 | 9.9%), and Sales & Related (159 | 6.0%).
Sales and Office Occupations by Sex
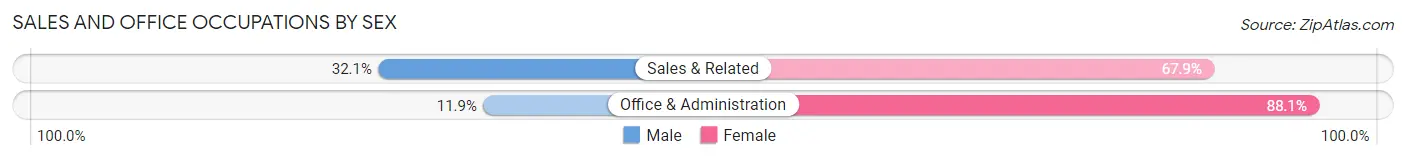
| Occupation | Male | Female |
| Sales & Related | 51 (32.1%) | 108 (67.9%) |
| Office & Administration | 31 (11.9%) | 230 (88.1%) |
| Total (Category) | 82 (19.5%) | 338 (80.5%) |
| Total (Overall) | 1,442 (54.7%) | 1,196 (45.3%) |
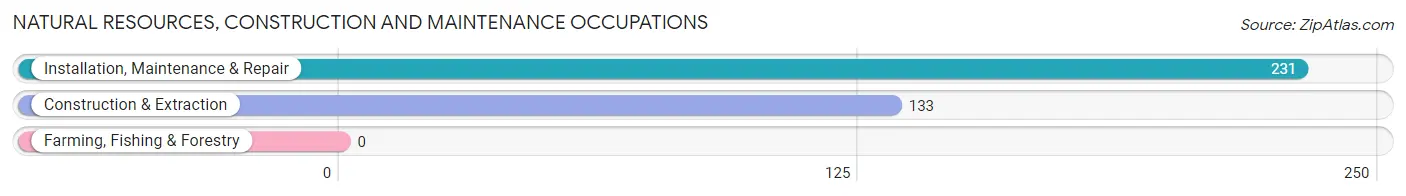
Natural Resources, Construction and Maintenance Occupations
The most common Natural Resources, Construction and Maintenance occupations in Cherryville are Installation, Maintenance & Repair (231 | 8.8%), and Construction & Extraction (133 | 5.0%).
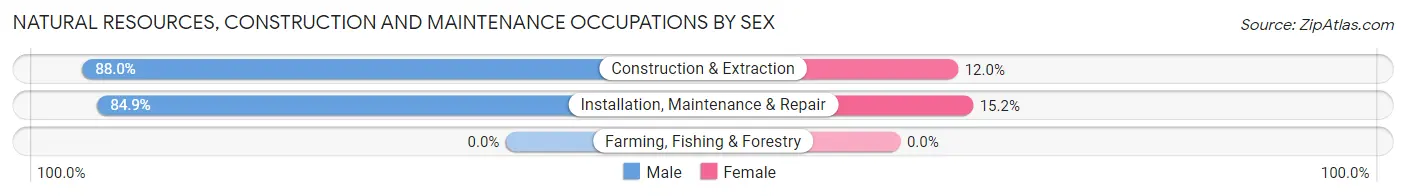
Natural Resources, Construction and Maintenance Occupations by Sex
| Occupation | Male | Female |
| Farming, Fishing & Forestry | 0 (0.0%) | 0 (0.0%) |
| Construction & Extraction | 117 (88.0%) | 16 (12.0%) |
| Installation, Maintenance & Repair | 196 (84.9%) | 35 (15.1%) |
| Total (Category) | 313 (86.0%) | 51 (14.0%) |
| Total (Overall) | 1,442 (54.7%) | 1,196 (45.3%) |
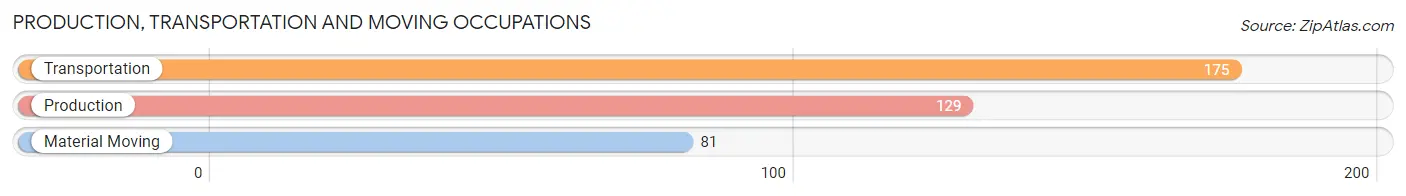
Production, Transportation and Moving Occupations
The most common Production, Transportation and Moving occupations in Cherryville are Transportation (175 | 6.6%), Production (129 | 4.9%), and Material Moving (81 | 3.1%).
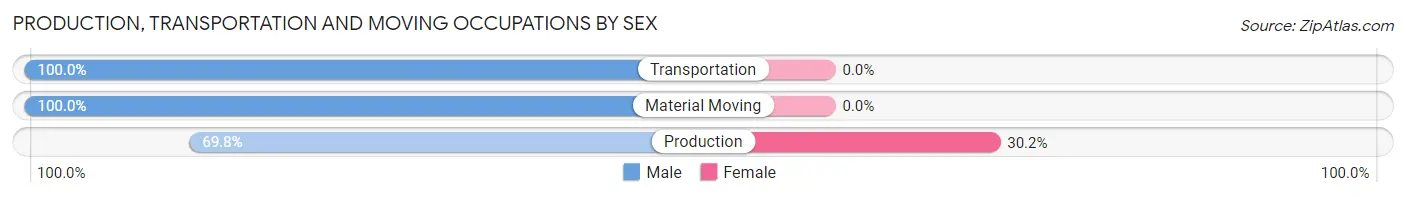
Production, Transportation and Moving Occupations by Sex
| Occupation | Male | Female |
| Production | 90 (69.8%) | 39 (30.2%) |
| Transportation | 175 (100.0%) | 0 (0.0%) |
| Material Moving | 81 (100.0%) | 0 (0.0%) |
| Total (Category) | 346 (89.9%) | 39 (10.1%) |
| Total (Overall) | 1,442 (54.7%) | 1,196 (45.3%) |
Employment Industries by Sex in Cherryville
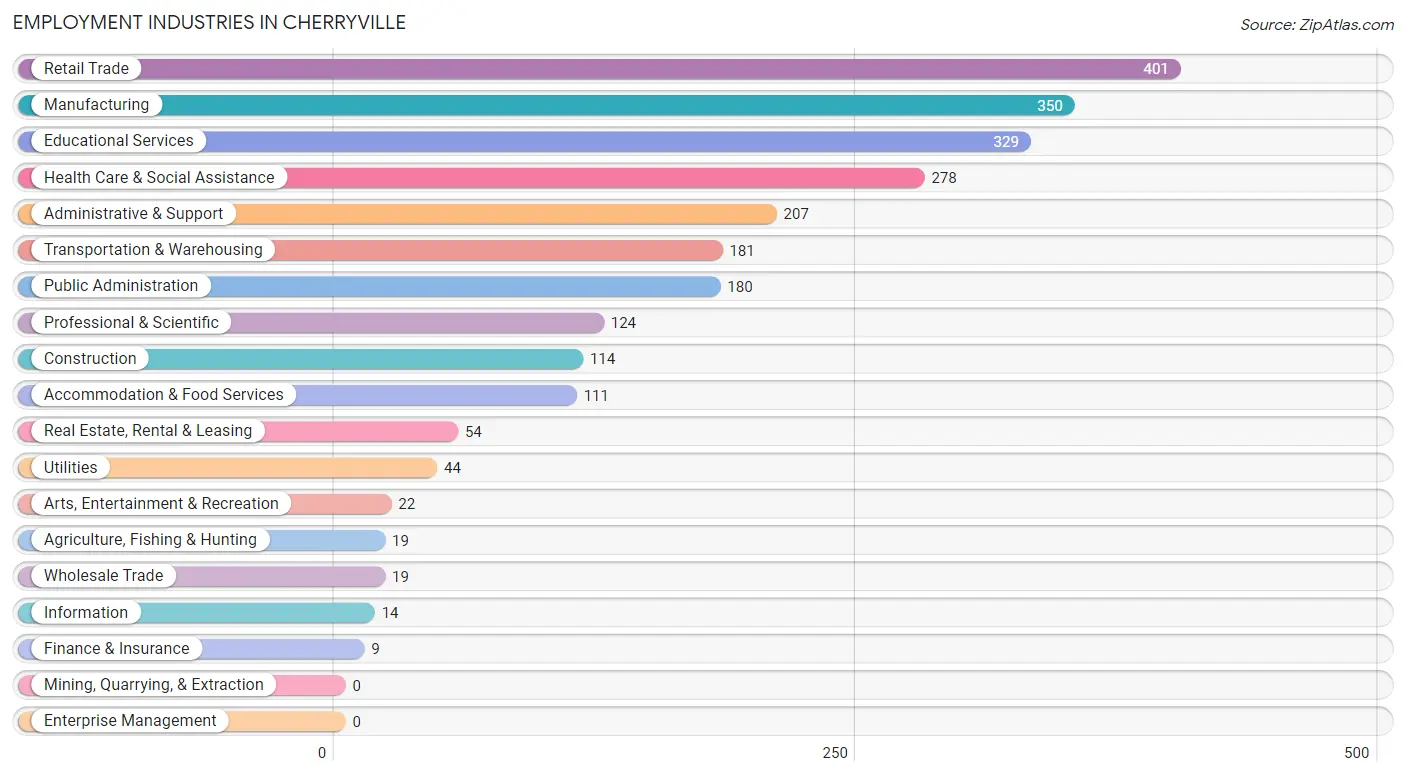
Employment Industries in Cherryville
The major employment industries in Cherryville include Retail Trade (401 | 15.2%), Manufacturing (350 | 13.3%), Educational Services (329 | 12.5%), Health Care & Social Assistance (278 | 10.5%), and Administrative & Support (207 | 7.9%).
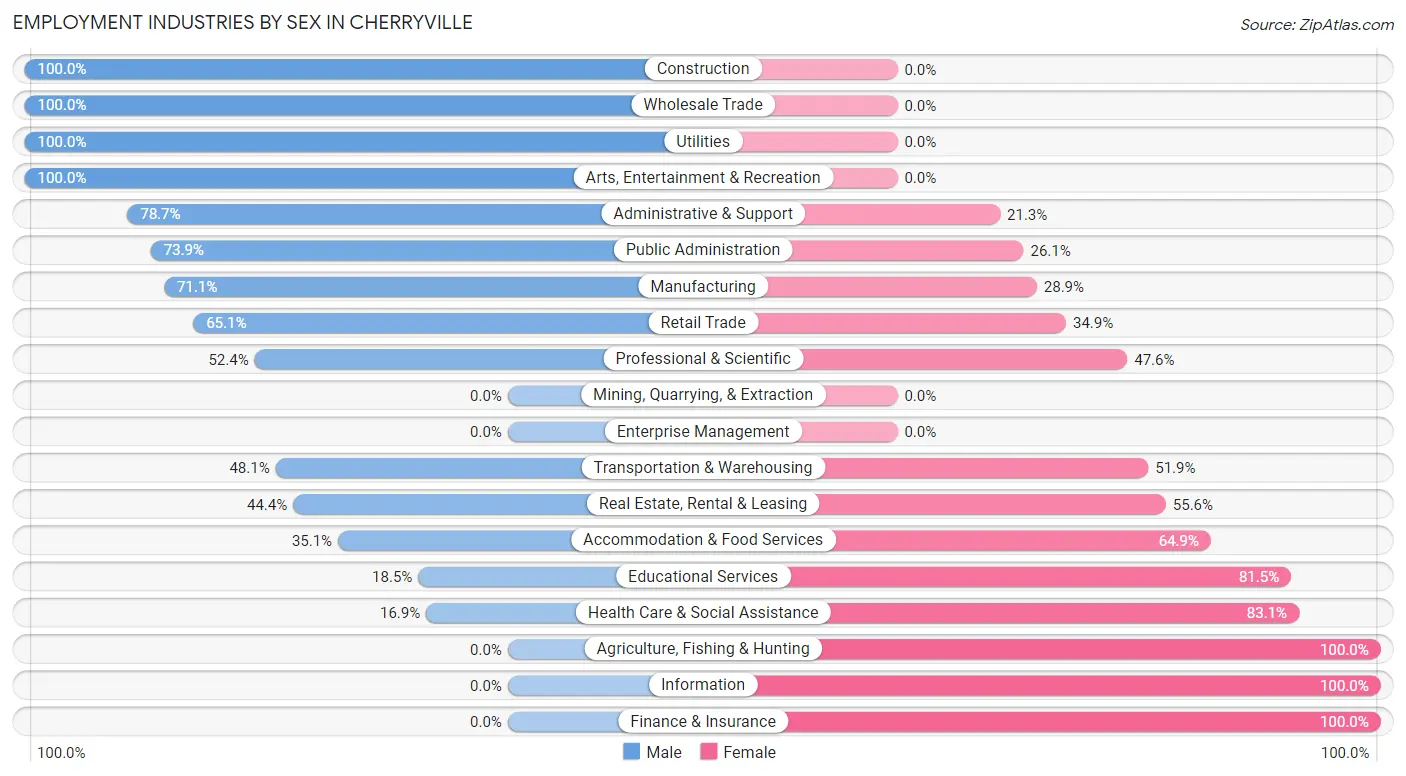
Employment Industries by Sex in Cherryville
The Cherryville industries that see more men than women are Construction (100.0%), Wholesale Trade (100.0%), and Utilities (100.0%), whereas the industries that tend to have a higher number of women are Agriculture, Fishing & Hunting (100.0%), Information (100.0%), and Finance & Insurance (100.0%).
| Industry | Male | Female |
| Agriculture, Fishing & Hunting | 0 (0.0%) | 19 (100.0%) |
| Mining, Quarrying, & Extraction | 0 (0.0%) | 0 (0.0%) |
| Construction | 114 (100.0%) | 0 (0.0%) |
| Manufacturing | 249 (71.1%) | 101 (28.9%) |
| Wholesale Trade | 19 (100.0%) | 0 (0.0%) |
| Retail Trade | 261 (65.1%) | 140 (34.9%) |
| Transportation & Warehousing | 87 (48.1%) | 94 (51.9%) |
| Utilities | 44 (100.0%) | 0 (0.0%) |
| Information | 0 (0.0%) | 14 (100.0%) |
| Finance & Insurance | 0 (0.0%) | 9 (100.0%) |
| Real Estate, Rental & Leasing | 24 (44.4%) | 30 (55.6%) |
| Professional & Scientific | 65 (52.4%) | 59 (47.6%) |
| Enterprise Management | 0 (0.0%) | 0 (0.0%) |
| Administrative & Support | 163 (78.7%) | 44 (21.3%) |
| Educational Services | 61 (18.5%) | 268 (81.5%) |
| Health Care & Social Assistance | 47 (16.9%) | 231 (83.1%) |
| Arts, Entertainment & Recreation | 22 (100.0%) | 0 (0.0%) |
| Accommodation & Food Services | 39 (35.1%) | 72 (64.9%) |
| Public Administration | 133 (73.9%) | 47 (26.1%) |
| Total | 1,442 (54.7%) | 1,196 (45.3%) |
Education in Cherryville
School Enrollment in Cherryville
The most common levels of schooling among the 1,447 students in Cherryville are high school (501 | 34.6%), middle school (464 | 32.1%), and elementary school (213 | 14.7%).
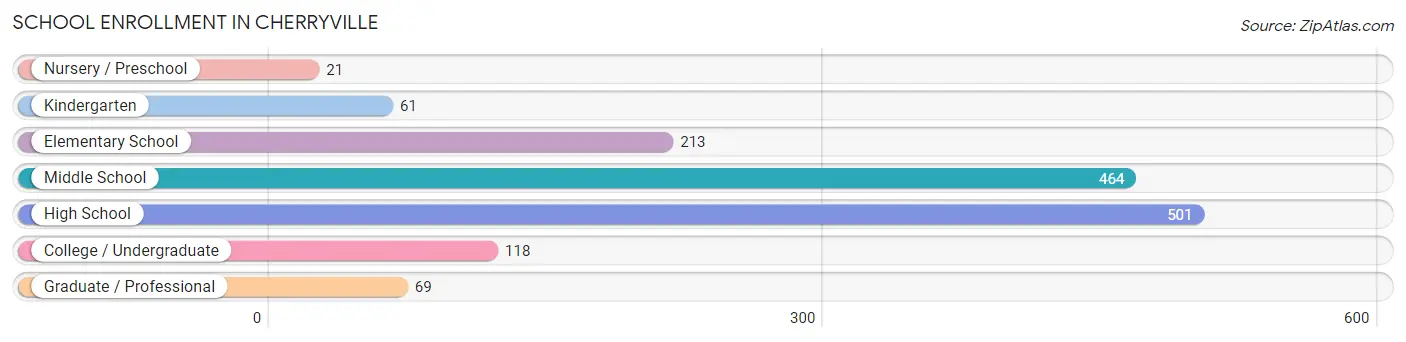
| School Level | # Students | % Students |
| Nursery / Preschool | 21 | 1.5% |
| Kindergarten | 61 | 4.2% |
| Elementary School | 213 | 14.7% |
| Middle School | 464 | 32.1% |
| High School | 501 | 34.6% |
| College / Undergraduate | 118 | 8.2% |
| Graduate / Professional | 69 | 4.8% |
| Total | 1,447 | 100.0% |
School Enrollment by Age by Funding Source in Cherryville
Out of a total of 1,447 students who are enrolled in schools in Cherryville, 116 (8.0%) attend a private institution, while the remaining 1,331 (92.0%) are enrolled in public schools. The age group of 3 to 4 year olds has the highest likelihood of being enrolled in private schools, with 21 (100.0% in the age bracket) enrolled. Conversely, the age group of 18 to 19 year olds has the lowest likelihood of being enrolled in a private school, with 139 (100.0% in the age bracket) attending a public institution.
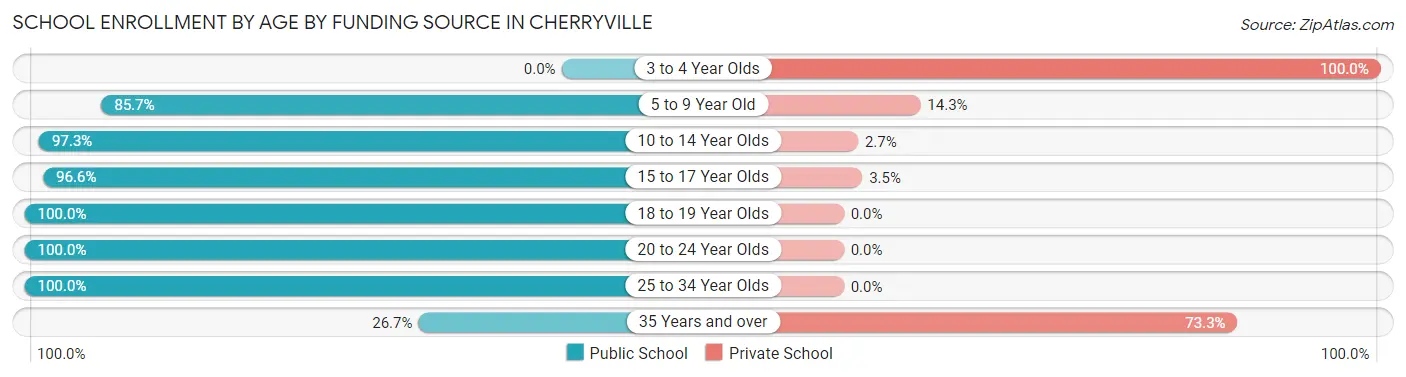
| Age Bracket | Public School | Private School |
| 3 to 4 Year Olds | 0 (0.0%) | 21 (100.0%) |
| 5 to 9 Year Old | 216 (85.7%) | 36 (14.3%) |
| 10 to 14 Year Olds | 473 (97.3%) | 13 (2.7%) |
| 15 to 17 Year Olds | 364 (96.6%) | 13 (3.5%) |
| 18 to 19 Year Olds | 139 (100.0%) | 0 (0.0%) |
| 20 to 24 Year Olds | 76 (100.0%) | 0 (0.0%) |
| 25 to 34 Year Olds | 51 (100.0%) | 0 (0.0%) |
| 35 Years and over | 12 (26.7%) | 33 (73.3%) |
| Total | 1,331 (92.0%) | 116 (8.0%) |
Educational Attainment by Field of Study in Cherryville
Education (325 | 28.1%), arts & humanities (234 | 20.2%), business (176 | 15.2%), visual & performing arts (99 | 8.6%), and science & technology (86 | 7.4%) are the most common fields of study among 1,157 individuals in Cherryville who have obtained a bachelor's degree or higher.
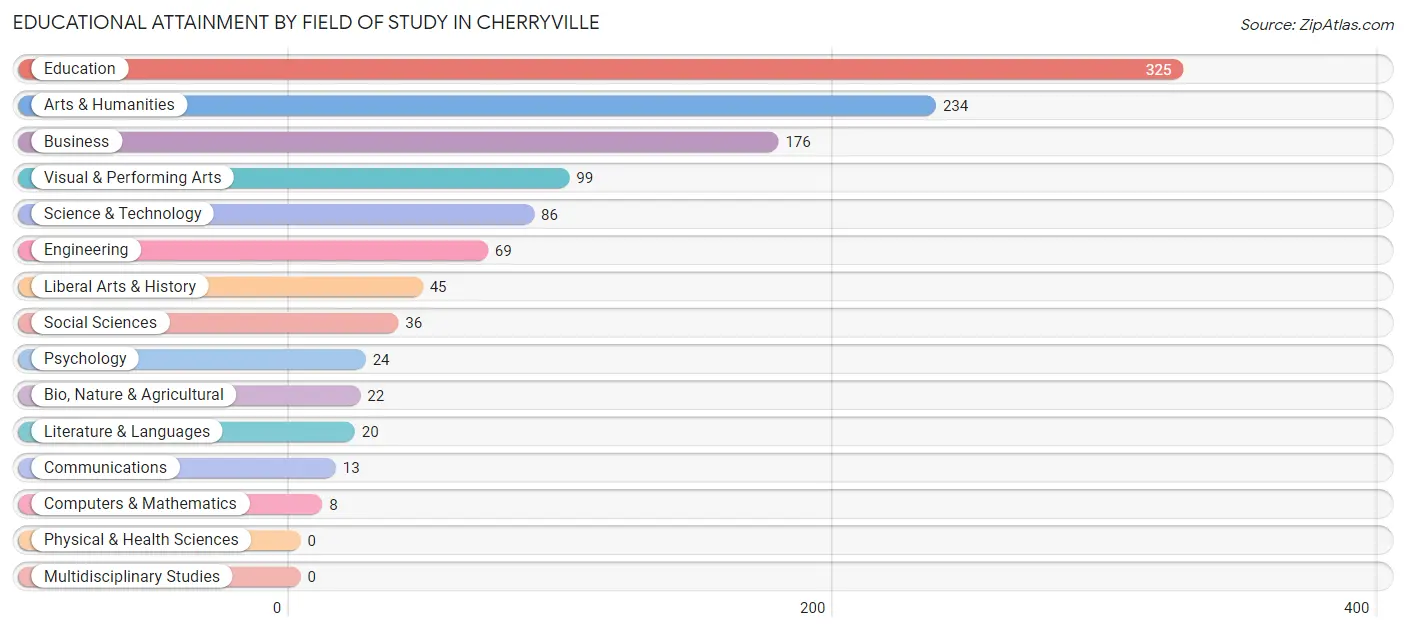
| Field of Study | # Graduates | % Graduates |
| Computers & Mathematics | 8 | 0.7% |
| Bio, Nature & Agricultural | 22 | 1.9% |
| Physical & Health Sciences | 0 | 0.0% |
| Psychology | 24 | 2.1% |
| Social Sciences | 36 | 3.1% |
| Engineering | 69 | 6.0% |
| Multidisciplinary Studies | 0 | 0.0% |
| Science & Technology | 86 | 7.4% |
| Business | 176 | 15.2% |
| Education | 325 | 28.1% |
| Literature & Languages | 20 | 1.7% |
| Liberal Arts & History | 45 | 3.9% |
| Visual & Performing Arts | 99 | 8.6% |
| Communications | 13 | 1.1% |
| Arts & Humanities | 234 | 20.2% |
| Total | 1,157 | 100.0% |
Transportation & Commute in Cherryville
Vehicle Availability by Sex in Cherryville
The most prevalent vehicle ownership categories in Cherryville are males with 2 vehicles (742, accounting for 51.6%) and females with 2 vehicles (374, making up 65.4%).
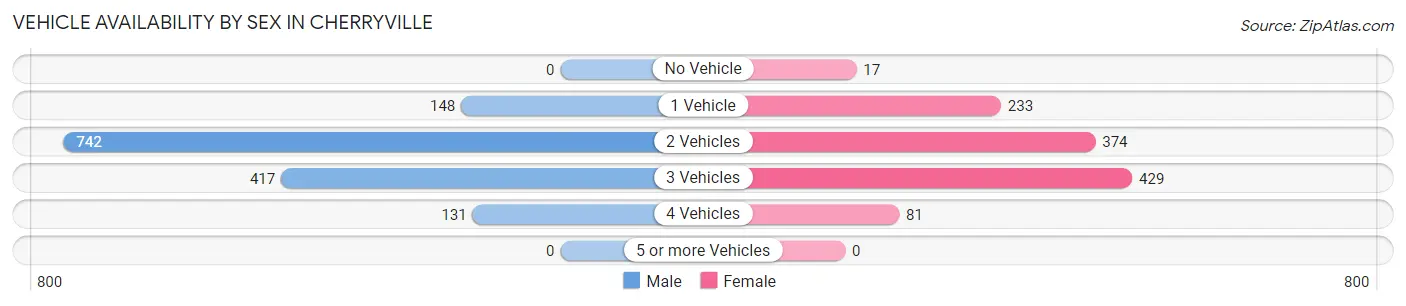
| Vehicles Available | Male | Female |
| No Vehicle | 0 (0.0%) | 17 (1.5%) |
| 1 Vehicle | 148 (10.3%) | 233 (20.5%) |
| 2 Vehicles | 742 (51.6%) | 374 (33.0%) |
| 3 Vehicles | 417 (29.0%) | 429 (37.8%) |
| 4 Vehicles | 131 (9.1%) | 81 (7.1%) |
| 5 or more Vehicles | 0 (0.0%) | 0 (0.0%) |
| Total | 1,438 (100.0%) | 1,134 (100.0%) |
Commute Time in Cherryville
The most frequently occuring commute durations in Cherryville are 45 to 59 minutes (465 commuters, 18.6%), 20 to 24 minutes (401 commuters, 16.1%), and 30 to 34 minutes (363 commuters, 14.5%).
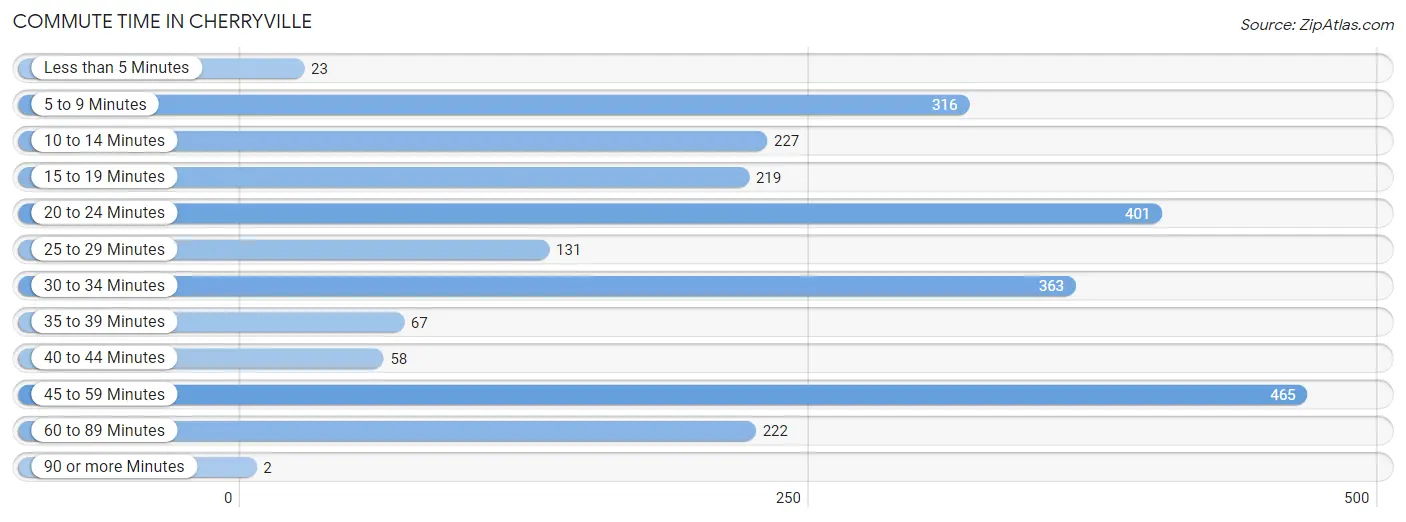
| Commute Time | # Commuters | % Commuters |
| Less than 5 Minutes | 23 | 0.9% |
| 5 to 9 Minutes | 316 | 12.7% |
| 10 to 14 Minutes | 227 | 9.1% |
| 15 to 19 Minutes | 219 | 8.8% |
| 20 to 24 Minutes | 401 | 16.1% |
| 25 to 29 Minutes | 131 | 5.2% |
| 30 to 34 Minutes | 363 | 14.5% |
| 35 to 39 Minutes | 67 | 2.7% |
| 40 to 44 Minutes | 58 | 2.3% |
| 45 to 59 Minutes | 465 | 18.6% |
| 60 to 89 Minutes | 222 | 8.9% |
| 90 or more Minutes | 2 | 0.1% |
Commute Time by Sex in Cherryville
The most common commute times in Cherryville are 45 to 59 minutes (343 commuters, 24.0%) for males and 20 to 24 minutes (171 commuters, 16.1%) for females.
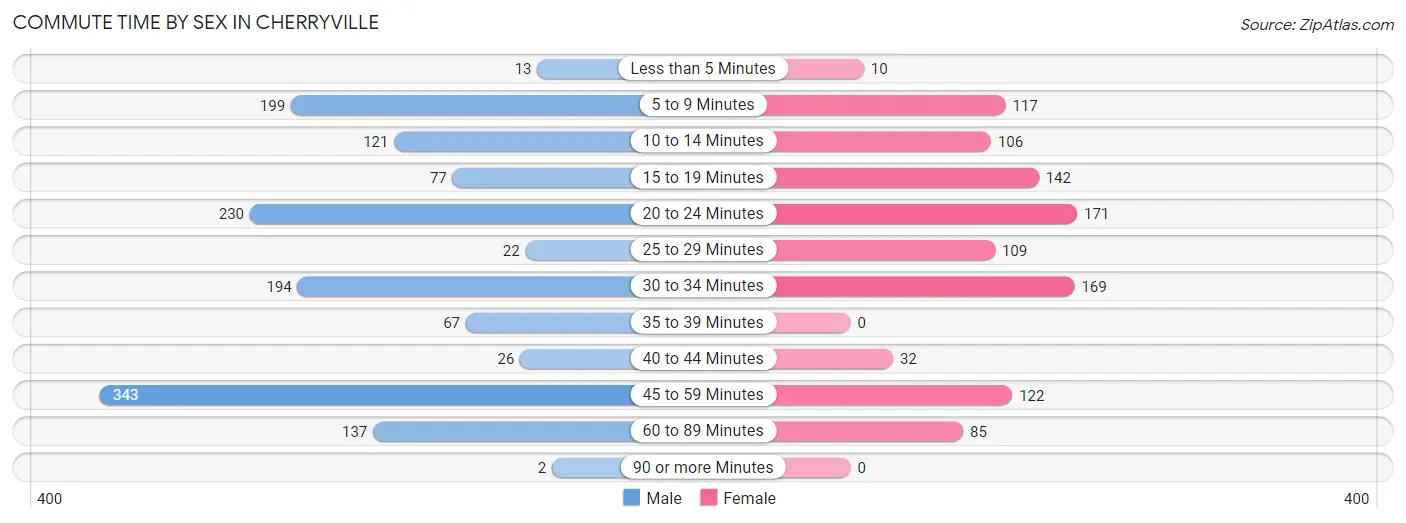
| Commute Time | Male | Female |
| Less than 5 Minutes | 13 (0.9%) | 10 (0.9%) |
| 5 to 9 Minutes | 199 (13.9%) | 117 (11.0%) |
| 10 to 14 Minutes | 121 (8.5%) | 106 (10.0%) |
| 15 to 19 Minutes | 77 (5.4%) | 142 (13.4%) |
| 20 to 24 Minutes | 230 (16.1%) | 171 (16.1%) |
| 25 to 29 Minutes | 22 (1.5%) | 109 (10.2%) |
| 30 to 34 Minutes | 194 (13.6%) | 169 (15.9%) |
| 35 to 39 Minutes | 67 (4.7%) | 0 (0.0%) |
| 40 to 44 Minutes | 26 (1.8%) | 32 (3.0%) |
| 45 to 59 Minutes | 343 (24.0%) | 122 (11.5%) |
| 60 to 89 Minutes | 137 (9.6%) | 85 (8.0%) |
| 90 or more Minutes | 2 (0.1%) | 0 (0.0%) |
Time of Departure to Work by Sex in Cherryville
The most frequent times of departure to work in Cherryville are 7:00 AM to 7:29 AM (235, 16.4%) for males and 7:30 AM to 7:59 AM (210, 19.8%) for females.
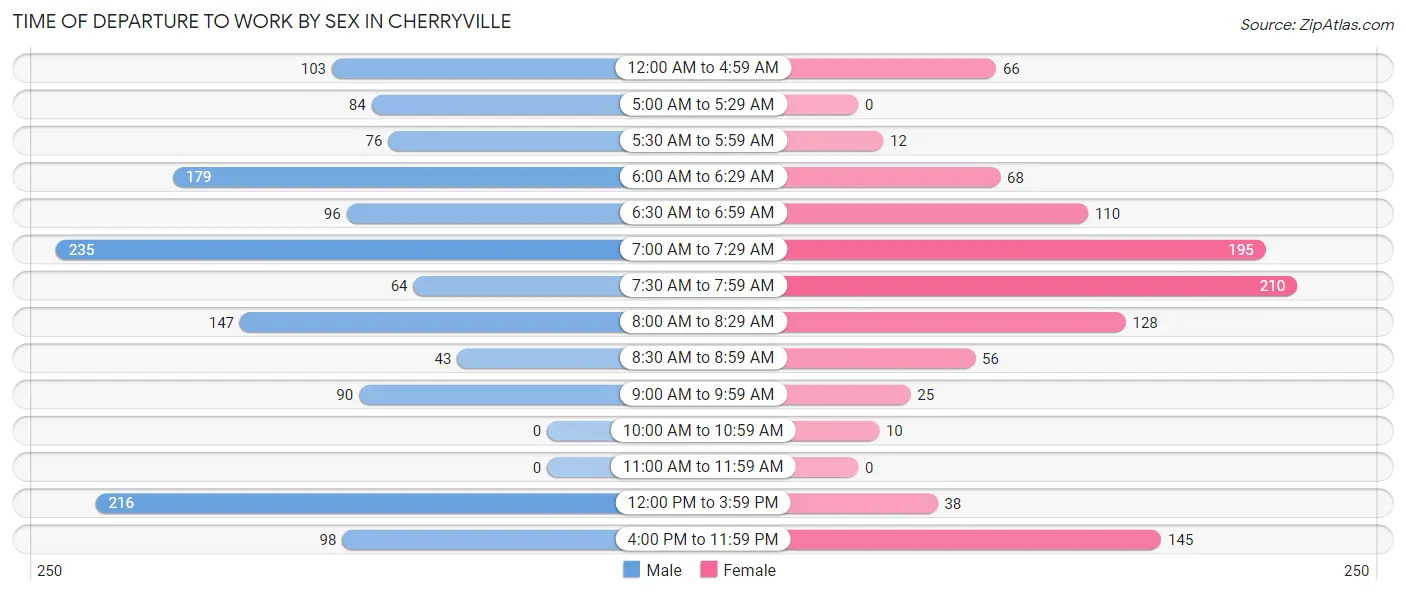
| Time of Departure | Male | Female |
| 12:00 AM to 4:59 AM | 103 (7.2%) | 66 (6.2%) |
| 5:00 AM to 5:29 AM | 84 (5.9%) | 0 (0.0%) |
| 5:30 AM to 5:59 AM | 76 (5.3%) | 12 (1.1%) |
| 6:00 AM to 6:29 AM | 179 (12.5%) | 68 (6.4%) |
| 6:30 AM to 6:59 AM | 96 (6.7%) | 110 (10.3%) |
| 7:00 AM to 7:29 AM | 235 (16.4%) | 195 (18.3%) |
| 7:30 AM to 7:59 AM | 64 (4.5%) | 210 (19.8%) |
| 8:00 AM to 8:29 AM | 147 (10.3%) | 128 (12.0%) |
| 8:30 AM to 8:59 AM | 43 (3.0%) | 56 (5.3%) |
| 9:00 AM to 9:59 AM | 90 (6.3%) | 25 (2.4%) |
| 10:00 AM to 10:59 AM | 0 (0.0%) | 10 (0.9%) |
| 11:00 AM to 11:59 AM | 0 (0.0%) | 0 (0.0%) |
| 12:00 PM to 3:59 PM | 216 (15.1%) | 38 (3.6%) |
| 4:00 PM to 11:59 PM | 98 (6.9%) | 145 (13.6%) |
| Total | 1,431 (100.0%) | 1,063 (100.0%) |
Housing Occupancy in Cherryville
Occupancy by Ownership in Cherryville
Of the total 2,432 dwellings in Cherryville, owner-occupied units account for 1,625 (66.8%), while renter-occupied units make up 807 (33.2%).
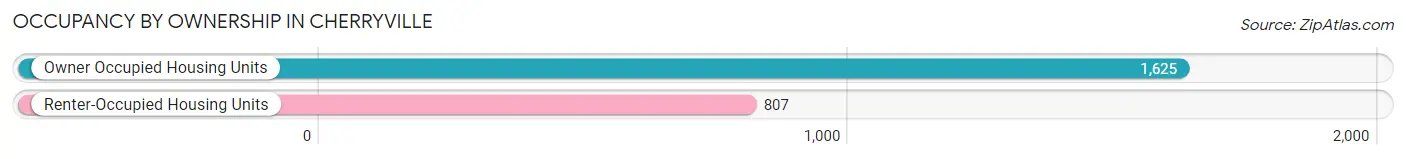
| Occupancy | # Housing Units | % Housing Units |
| Owner Occupied Housing Units | 1,625 | 66.8% |
| Renter-Occupied Housing Units | 807 | 33.2% |
| Total Occupied Housing Units | 2,432 | 100.0% |
Occupancy by Household Size in Cherryville
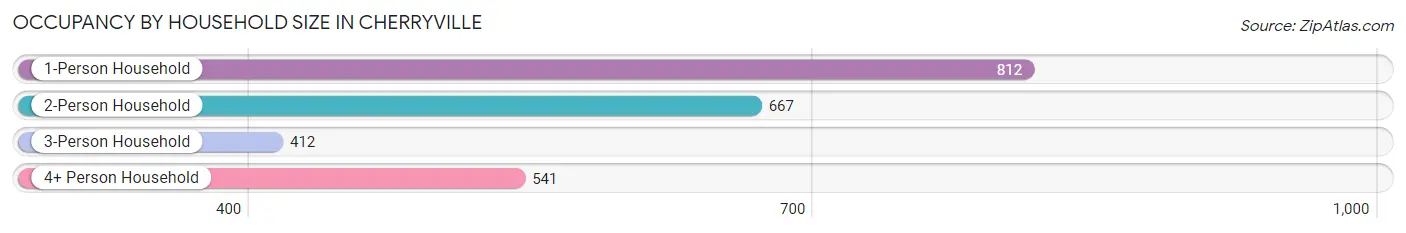
| Household Size | # Housing Units | % Housing Units |
| 1-Person Household | 812 | 33.4% |
| 2-Person Household | 667 | 27.4% |
| 3-Person Household | 412 | 16.9% |
| 4+ Person Household | 541 | 22.3% |
| Total Housing Units | 2,432 | 100.0% |
Occupancy by Ownership by Household Size in Cherryville
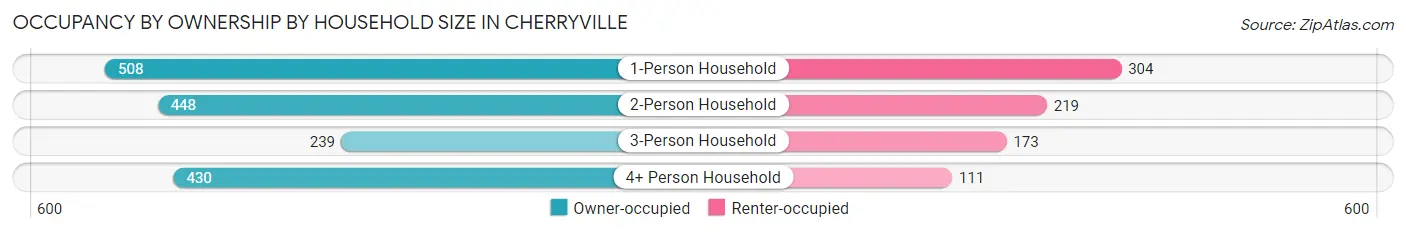
| Household Size | Owner-occupied | Renter-occupied |
| 1-Person Household | 508 (62.6%) | 304 (37.4%) |
| 2-Person Household | 448 (67.2%) | 219 (32.8%) |
| 3-Person Household | 239 (58.0%) | 173 (42.0%) |
| 4+ Person Household | 430 (79.5%) | 111 (20.5%) |
| Total Housing Units | 1,625 (66.8%) | 807 (33.2%) |
Occupancy by Educational Attainment in Cherryville
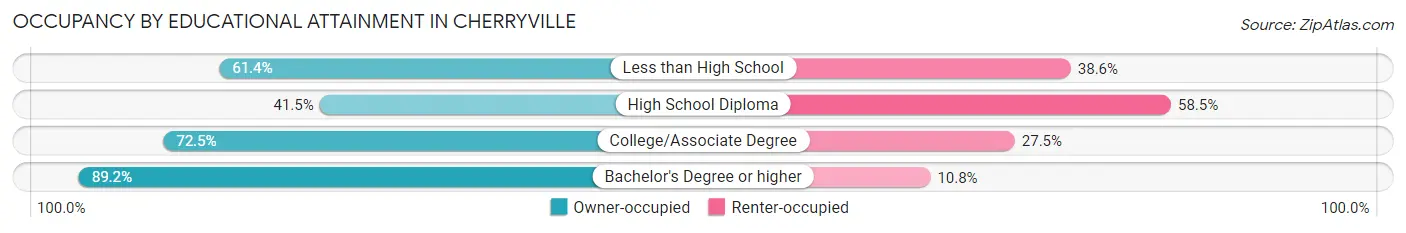
| Household Size | Owner-occupied | Renter-occupied |
| Less than High School | 167 (61.4%) | 105 (38.6%) |
| High School Diploma | 314 (41.5%) | 442 (58.5%) |
| College/Associate Degree | 472 (72.5%) | 179 (27.5%) |
| Bachelor's Degree or higher | 672 (89.2%) | 81 (10.8%) |
Occupancy by Age of Householder in Cherryville
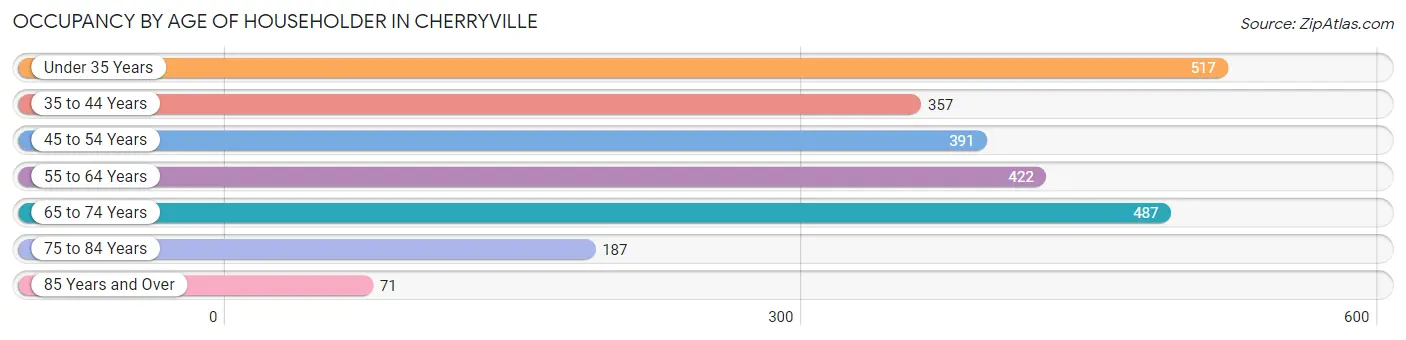
| Age Bracket | # Households | % Households |
| Under 35 Years | 517 | 21.3% |
| 35 to 44 Years | 357 | 14.7% |
| 45 to 54 Years | 391 | 16.1% |
| 55 to 64 Years | 422 | 17.3% |
| 65 to 74 Years | 487 | 20.0% |
| 75 to 84 Years | 187 | 7.7% |
| 85 Years and Over | 71 | 2.9% |
| Total | 2,432 | 100.0% |
Housing Finances in Cherryville
Median Income by Occupancy in Cherryville
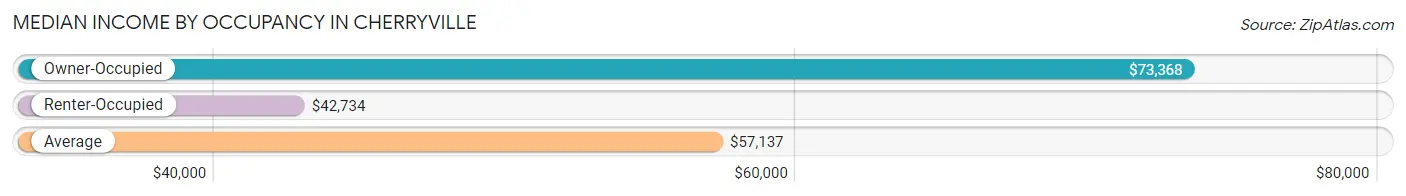
| Occupancy Type | # Households | Median Income |
| Owner-Occupied | 1,625 (66.8%) | $73,368 |
| Renter-Occupied | 807 (33.2%) | $42,734 |
| Average | 2,432 (100.0%) | $57,137 |
Occupancy by Householder Income Bracket in Cherryville
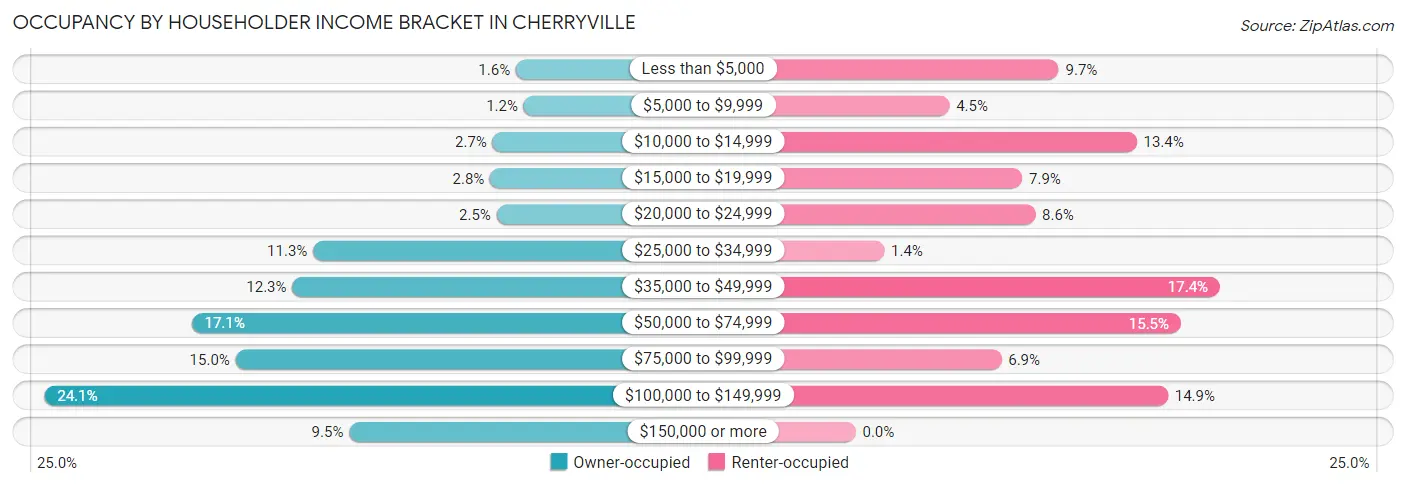
| Income Bracket | Owner-occupied | Renter-occupied |
| Less than $5,000 | 26 (1.6%) | 78 (9.7%) |
| $5,000 to $9,999 | 20 (1.2%) | 36 (4.5%) |
| $10,000 to $14,999 | 44 (2.7%) | 108 (13.4%) |
| $15,000 to $19,999 | 46 (2.8%) | 64 (7.9%) |
| $20,000 to $24,999 | 41 (2.5%) | 69 (8.6%) |
| $25,000 to $34,999 | 183 (11.3%) | 11 (1.4%) |
| $35,000 to $49,999 | 199 (12.2%) | 140 (17.3%) |
| $50,000 to $74,999 | 277 (17.1%) | 125 (15.5%) |
| $75,000 to $99,999 | 243 (14.9%) | 56 (6.9%) |
| $100,000 to $149,999 | 391 (24.1%) | 120 (14.9%) |
| $150,000 or more | 155 (9.5%) | 0 (0.0%) |
| Total | 1,625 (100.0%) | 807 (100.0%) |
Monthly Housing Cost Tiers in Cherryville
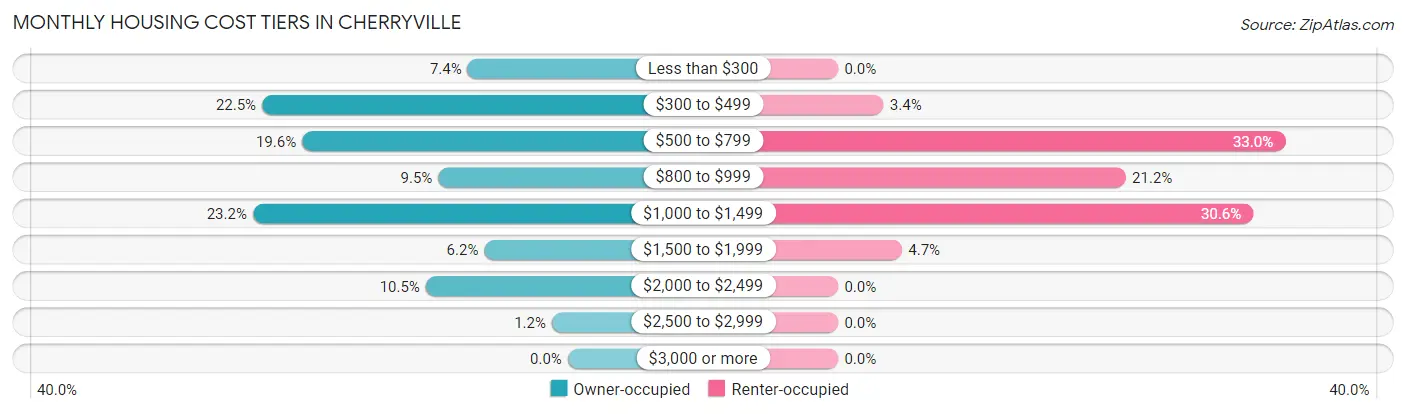
| Monthly Cost | Owner-occupied | Renter-occupied |
| Less than $300 | 120 (7.4%) | 0 (0.0%) |
| $300 to $499 | 366 (22.5%) | 27 (3.4%) |
| $500 to $799 | 318 (19.6%) | 266 (33.0%) |
| $800 to $999 | 155 (9.5%) | 171 (21.2%) |
| $1,000 to $1,499 | 377 (23.2%) | 247 (30.6%) |
| $1,500 to $1,999 | 100 (6.1%) | 38 (4.7%) |
| $2,000 to $2,499 | 170 (10.5%) | 0 (0.0%) |
| $2,500 to $2,999 | 19 (1.2%) | 0 (0.0%) |
| $3,000 or more | 0 (0.0%) | 0 (0.0%) |
| Total | 1,625 (100.0%) | 807 (100.0%) |
Physical Housing Characteristics in Cherryville
Housing Structures in Cherryville
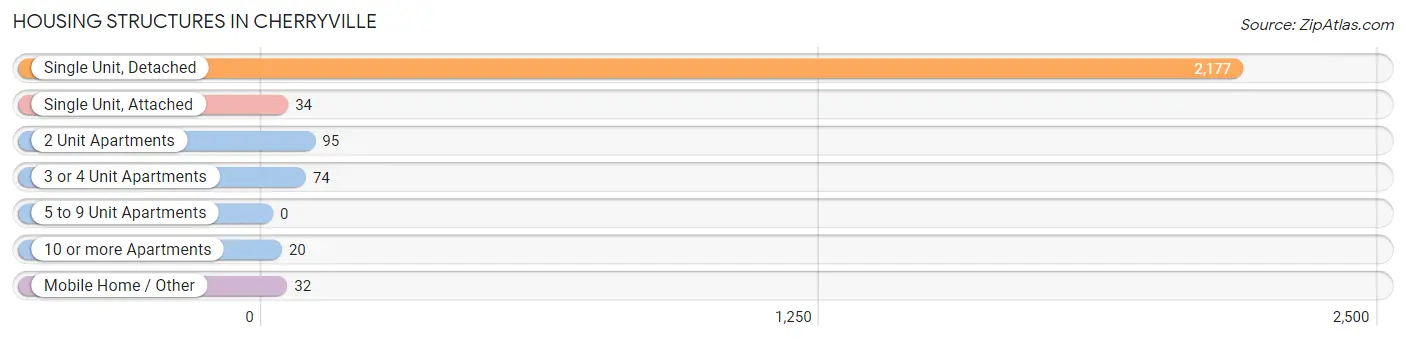
| Structure Type | # Housing Units | % Housing Units |
| Single Unit, Detached | 2,177 | 89.5% |
| Single Unit, Attached | 34 | 1.4% |
| 2 Unit Apartments | 95 | 3.9% |
| 3 or 4 Unit Apartments | 74 | 3.0% |
| 5 to 9 Unit Apartments | 0 | 0.0% |
| 10 or more Apartments | 20 | 0.8% |
| Mobile Home / Other | 32 | 1.3% |
| Total | 2,432 | 100.0% |
Housing Structures by Occupancy in Cherryville
| Structure Type | Owner-occupied | Renter-occupied |
| Single Unit, Detached | 1,600 (73.5%) | 577 (26.5%) |
| Single Unit, Attached | 0 (0.0%) | 34 (100.0%) |
| 2 Unit Apartments | 0 (0.0%) | 95 (100.0%) |
| 3 or 4 Unit Apartments | 0 (0.0%) | 74 (100.0%) |
| 5 to 9 Unit Apartments | 0 (0.0%) | 0 (0.0%) |
| 10 or more Apartments | 0 (0.0%) | 20 (100.0%) |
| Mobile Home / Other | 25 (78.1%) | 7 (21.9%) |
| Total | 1,625 (66.8%) | 807 (33.2%) |
Housing Structures by Number of Rooms in Cherryville
| Number of Rooms | Owner-occupied | Renter-occupied |
| 1 Room | 0 (0.0%) | 0 (0.0%) |
| 2 or 3 Rooms | 34 (2.1%) | 135 (16.7%) |
| 4 or 5 Rooms | 442 (27.2%) | 556 (68.9%) |
| 6 or 7 Rooms | 815 (50.1%) | 116 (14.4%) |
| 8 or more Rooms | 334 (20.5%) | 0 (0.0%) |
| Total | 1,625 (100.0%) | 807 (100.0%) |
Housing Structure by Heating Type in Cherryville
| Heating Type | Owner-occupied | Renter-occupied |
| Utility Gas | 778 (47.9%) | 361 (44.7%) |
| Bottled, Tank, or LP Gas | 60 (3.7%) | 12 (1.5%) |
| Electricity | 743 (45.7%) | 379 (47.0%) |
| Fuel Oil or Kerosene | 8 (0.5%) | 16 (2.0%) |
| Coal or Coke | 3 (0.2%) | 0 (0.0%) |
| All other Fuels | 12 (0.7%) | 13 (1.6%) |
| No Fuel Used | 21 (1.3%) | 26 (3.2%) |
| Total | 1,625 (100.0%) | 807 (100.0%) |
Household Vehicle Usage in Cherryville
| Vehicles per Household | Owner-occupied | Renter-occupied |
| No Vehicle | 36 (2.2%) | 72 (8.9%) |
| 1 Vehicle | 431 (26.5%) | 388 (48.1%) |
| 2 Vehicles | 666 (41.0%) | 244 (30.2%) |
| 3 or more Vehicles | 492 (30.3%) | 103 (12.8%) |
| Total | 1,625 (100.0%) | 807 (100.0%) |
Real Estate & Mortgages in Cherryville
Real Estate and Mortgage Overview in Cherryville
| Characteristic | Without Mortgage | With Mortgage |
| Housing Units | 757 | 868 |
| Median Property Value | $170,300 | $186,400 |
| Median Household Income | $56,082 | $50 |
| Monthly Housing Costs | $453 | $0 |
| Real Estate Taxes | $1,533 | $16 |
Property Value by Mortgage Status in Cherryville
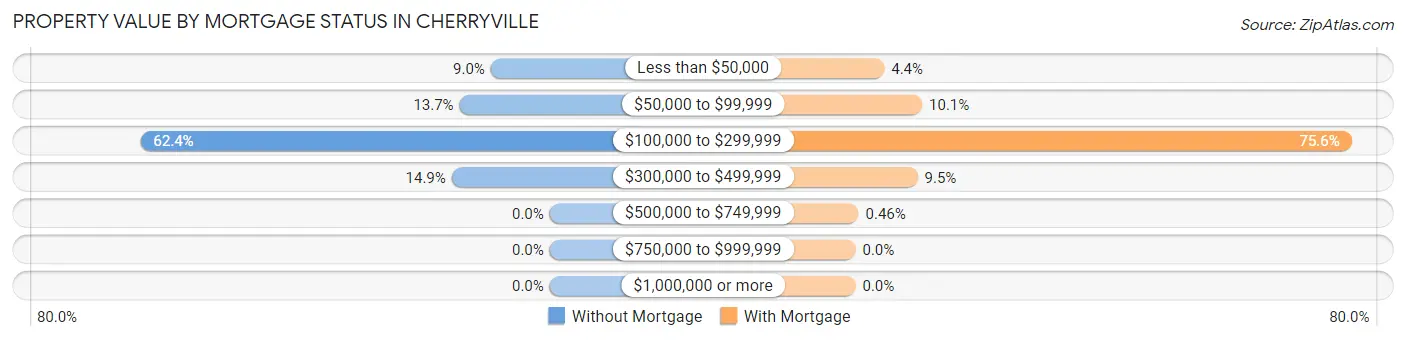
| Property Value | Without Mortgage | With Mortgage |
| Less than $50,000 | 68 (9.0%) | 38 (4.4%) |
| $50,000 to $99,999 | 104 (13.7%) | 88 (10.1%) |
| $100,000 to $299,999 | 472 (62.4%) | 656 (75.6%) |
| $300,000 to $499,999 | 113 (14.9%) | 82 (9.5%) |
| $500,000 to $749,999 | 0 (0.0%) | 4 (0.5%) |
| $750,000 to $999,999 | 0 (0.0%) | 0 (0.0%) |
| $1,000,000 or more | 0 (0.0%) | 0 (0.0%) |
| Total | 757 (100.0%) | 868 (100.0%) |
Household Income by Mortgage Status in Cherryville
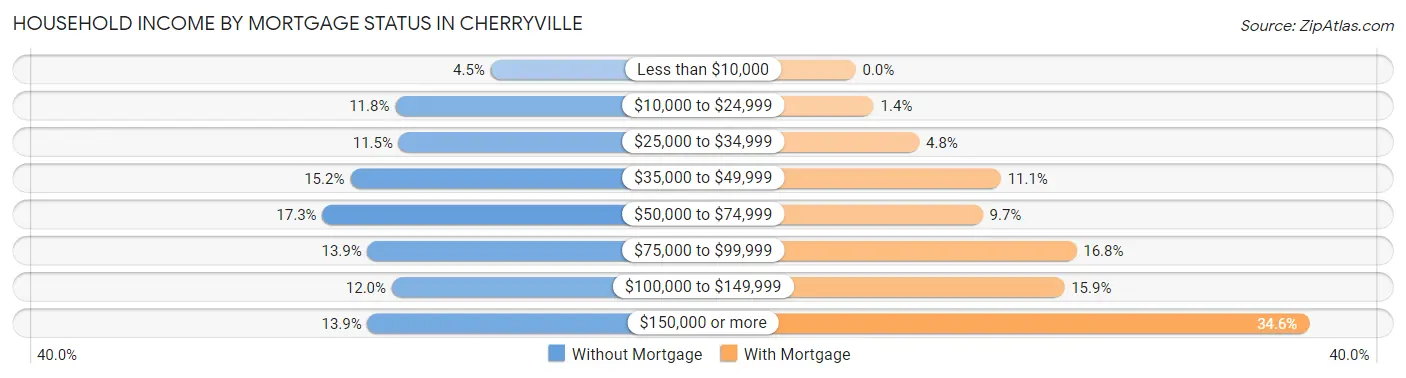
| Household Income | Without Mortgage | With Mortgage |
| Less than $10,000 | 34 (4.5%) | 0 (0.0%) |
| $10,000 to $24,999 | 89 (11.8%) | 12 (1.4%) |
| $25,000 to $34,999 | 87 (11.5%) | 42 (4.8%) |
| $35,000 to $49,999 | 115 (15.2%) | 96 (11.1%) |
| $50,000 to $74,999 | 131 (17.3%) | 84 (9.7%) |
| $75,000 to $99,999 | 105 (13.9%) | 146 (16.8%) |
| $100,000 to $149,999 | 91 (12.0%) | 138 (15.9%) |
| $150,000 or more | 105 (13.9%) | 300 (34.6%) |
| Total | 757 (100.0%) | 868 (100.0%) |
Property Value to Household Income Ratio in Cherryville
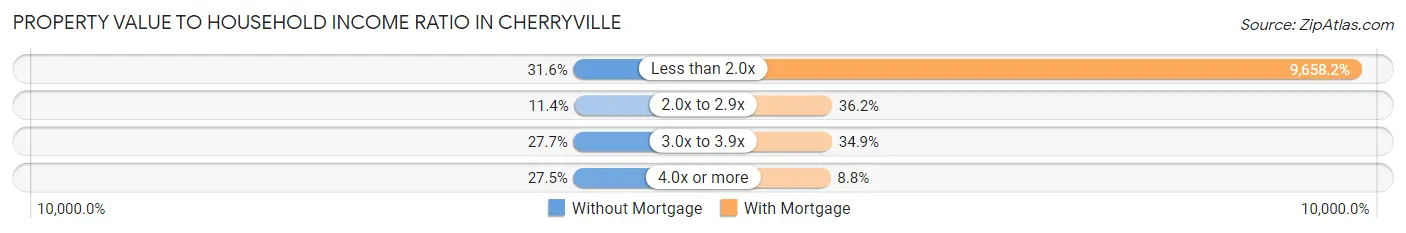
| Value-to-Income Ratio | Without Mortgage | With Mortgage |
| Less than 2.0x | 239 (31.6%) | 83,833 (9,658.2%) |
| 2.0x to 2.9x | 86 (11.4%) | 314 (36.2%) |
| 3.0x to 3.9x | 210 (27.7%) | 303 (34.9%) |
| 4.0x or more | 208 (27.5%) | 76 (8.8%) |
| Total | 757 (100.0%) | 868 (100.0%) |
Real Estate Taxes by Mortgage Status in Cherryville
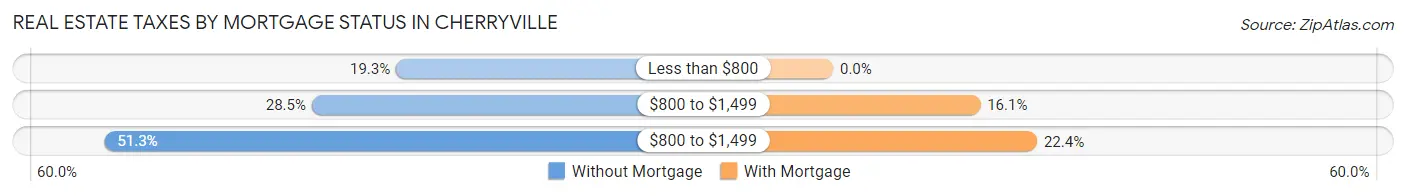
| Property Taxes | Without Mortgage | With Mortgage |
| Less than $800 | 146 (19.3%) | 0 (0.0%) |
| $800 to $1,499 | 216 (28.5%) | 140 (16.1%) |
| $800 to $1,499 | 388 (51.2%) | 194 (22.4%) |
| Total | 757 (100.0%) | 868 (100.0%) |
Health & Disability in Cherryville
Health Insurance Coverage by Age in Cherryville
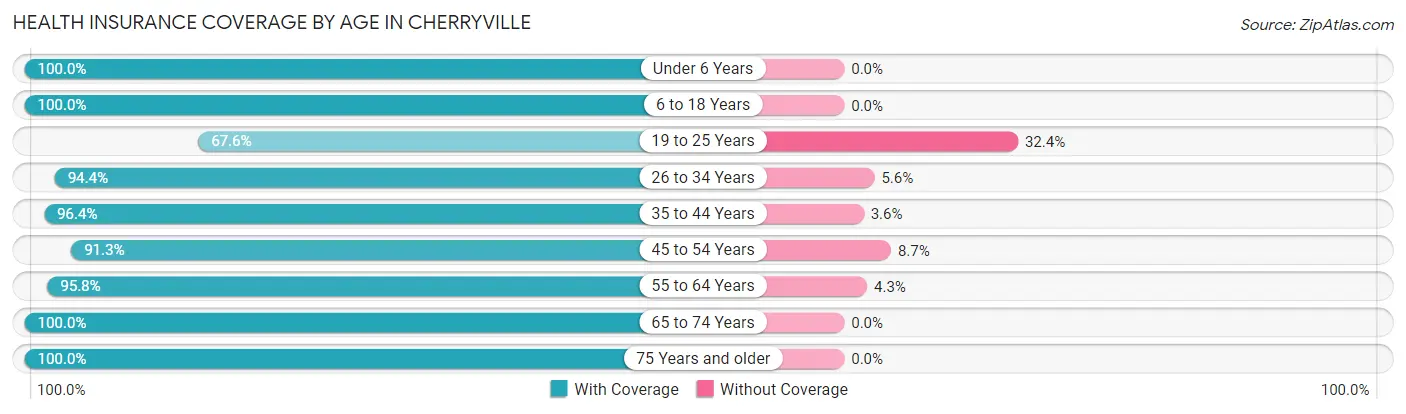
| Age Bracket | With Coverage | Without Coverage |
| Under 6 Years | 358 (100.0%) | 0 (0.0%) |
| 6 to 18 Years | 1,240 (100.0%) | 0 (0.0%) |
| 19 to 25 Years | 453 (67.6%) | 217 (32.4%) |
| 26 to 34 Years | 603 (94.4%) | 36 (5.6%) |
| 35 to 44 Years | 692 (96.4%) | 26 (3.6%) |
| 45 to 54 Years | 619 (91.3%) | 59 (8.7%) |
| 55 to 64 Years | 586 (95.8%) | 26 (4.3%) |
| 65 to 74 Years | 647 (100.0%) | 0 (0.0%) |
| 75 Years and older | 376 (100.0%) | 0 (0.0%) |
| Total | 5,574 (93.9%) | 364 (6.1%) |
Health Insurance Coverage by Citizenship Status in Cherryville
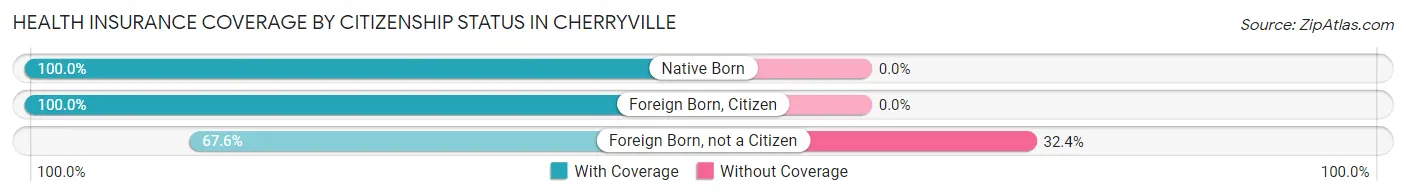
| Citizenship Status | With Coverage | Without Coverage |
| Native Born | 358 (100.0%) | 0 (0.0%) |
| Foreign Born, Citizen | 1,240 (100.0%) | 0 (0.0%) |
| Foreign Born, not a Citizen | 453 (67.6%) | 217 (32.4%) |
Health Insurance Coverage by Household Income in Cherryville
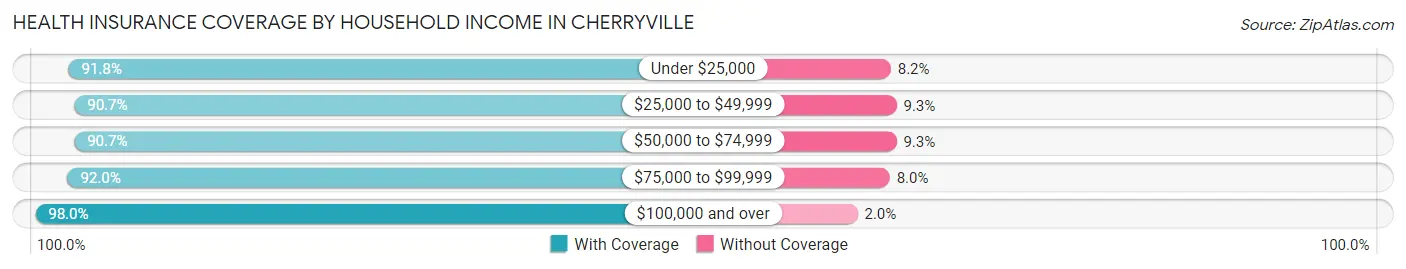
| Household Income | With Coverage | Without Coverage |
| Under $25,000 | 713 (91.8%) | 64 (8.2%) |
| $25,000 to $49,999 | 973 (90.7%) | 100 (9.3%) |
| $50,000 to $74,999 | 936 (90.7%) | 96 (9.3%) |
| $75,000 to $99,999 | 652 (92.0%) | 57 (8.0%) |
| $100,000 and over | 2,287 (98.0%) | 47 (2.0%) |
Public vs Private Health Insurance Coverage by Age in Cherryville
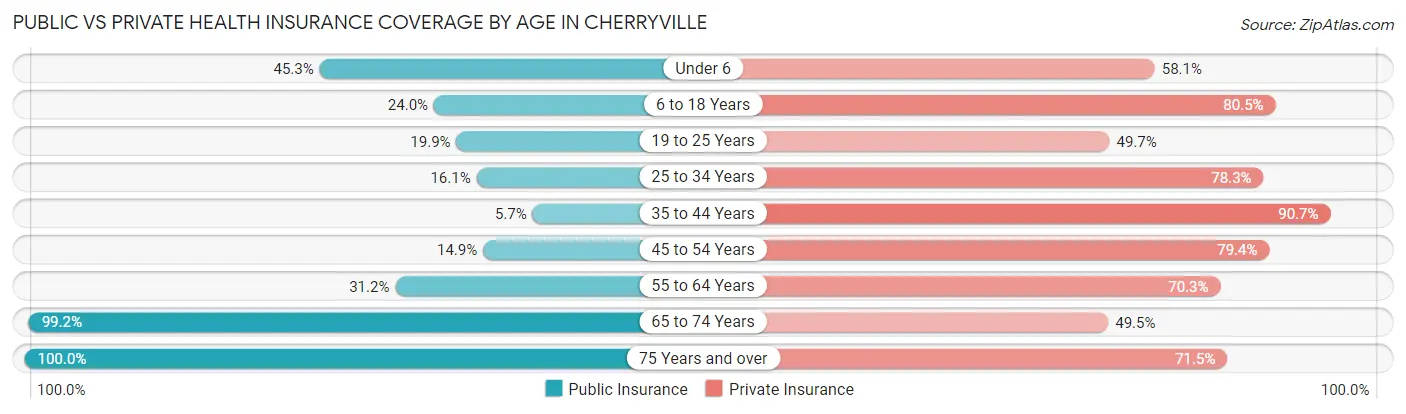
| Age Bracket | Public Insurance | Private Insurance |
| Under 6 | 162 (45.3%) | 208 (58.1%) |
| 6 to 18 Years | 298 (24.0%) | 998 (80.5%) |
| 19 to 25 Years | 133 (19.9%) | 333 (49.7%) |
| 25 to 34 Years | 103 (16.1%) | 500 (78.2%) |
| 35 to 44 Years | 41 (5.7%) | 651 (90.7%) |
| 45 to 54 Years | 101 (14.9%) | 538 (79.3%) |
| 55 to 64 Years | 191 (31.2%) | 430 (70.3%) |
| 65 to 74 Years | 642 (99.2%) | 320 (49.5%) |
| 75 Years and over | 376 (100.0%) | 269 (71.5%) |
| Total | 2,047 (34.5%) | 4,247 (71.5%) |
Disability Status by Sex by Age in Cherryville
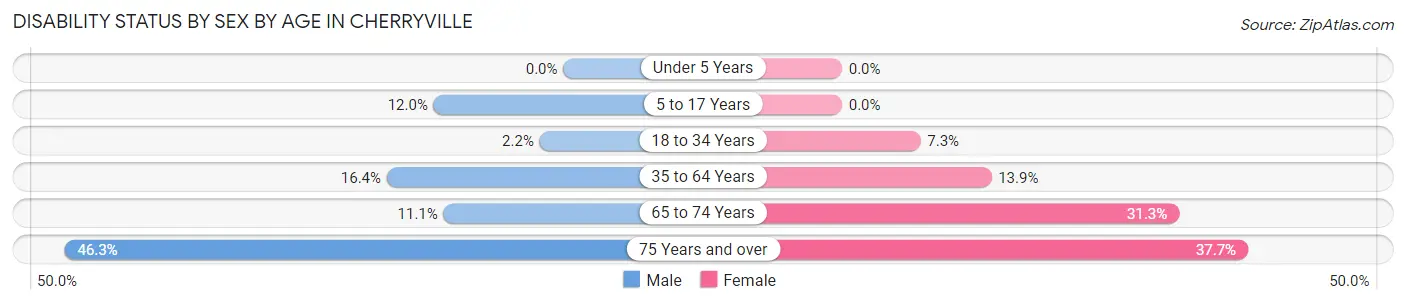
| Age Bracket | Male | Female |
| Under 5 Years | 0 (0.0%) | 0 (0.0%) |
| 5 to 17 Years | 86 (12.0%) | 0 (0.0%) |
| 18 to 34 Years | 16 (2.2%) | 49 (7.3%) |
| 35 to 64 Years | 160 (16.4%) | 143 (13.9%) |
| 65 to 74 Years | 30 (11.1%) | 118 (31.3%) |
| 75 Years and over | 50 (46.3%) | 101 (37.7%) |
Disability Class by Sex by Age in Cherryville
Disability Class: Hearing Difficulty
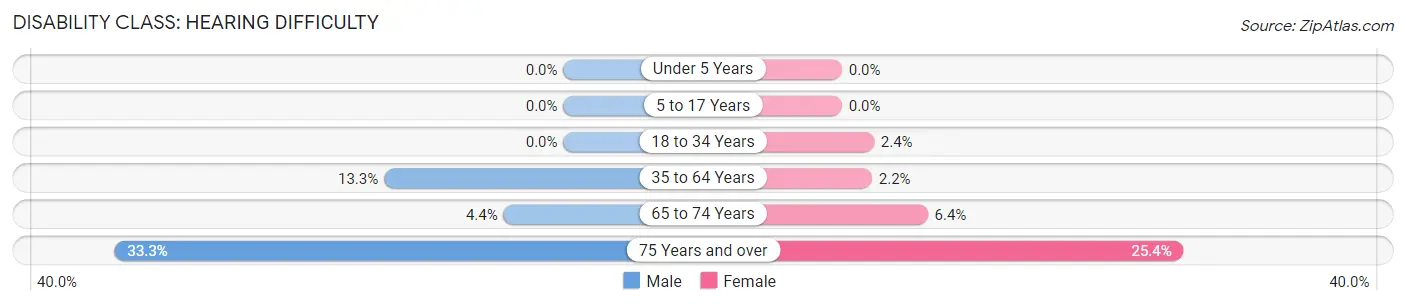
| Age Bracket | Male | Female |
| Under 5 Years | 0 (0.0%) | 0 (0.0%) |
| 5 to 17 Years | 0 (0.0%) | 0 (0.0%) |
| 18 to 34 Years | 0 (0.0%) | 16 (2.4%) |
| 35 to 64 Years | 130 (13.3%) | 23 (2.2%) |
| 65 to 74 Years | 12 (4.4%) | 24 (6.4%) |
| 75 Years and over | 36 (33.3%) | 68 (25.4%) |
Disability Class: Vision Difficulty
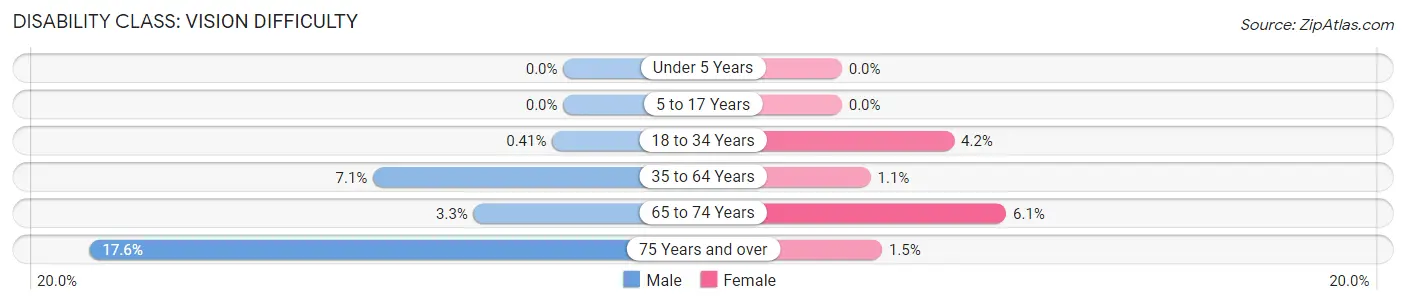
| Age Bracket | Male | Female |
| Under 5 Years | 0 (0.0%) | 0 (0.0%) |
| 5 to 17 Years | 0 (0.0%) | 0 (0.0%) |
| 18 to 34 Years | 3 (0.4%) | 28 (4.2%) |
| 35 to 64 Years | 69 (7.1%) | 11 (1.1%) |
| 65 to 74 Years | 9 (3.3%) | 23 (6.1%) |
| 75 Years and over | 19 (17.6%) | 4 (1.5%) |
Disability Class: Cognitive Difficulty
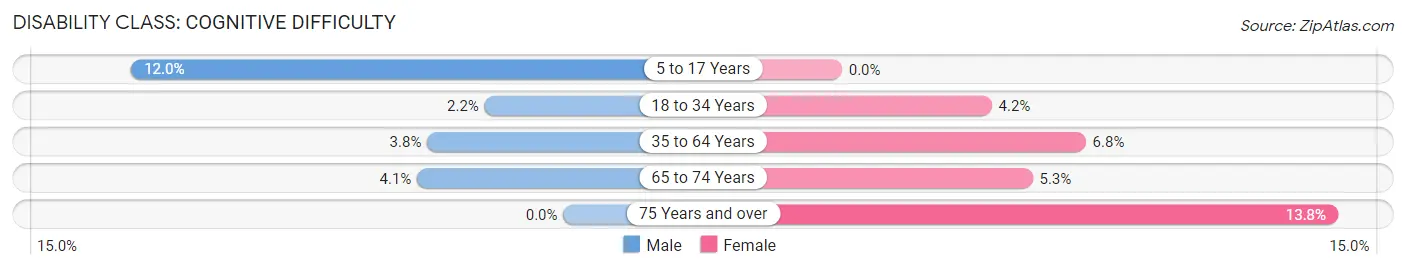
| Age Bracket | Male | Female |
| 5 to 17 Years | 86 (12.0%) | 0 (0.0%) |
| 18 to 34 Years | 16 (2.2%) | 28 (4.2%) |
| 35 to 64 Years | 37 (3.8%) | 70 (6.8%) |
| 65 to 74 Years | 11 (4.1%) | 20 (5.3%) |
| 75 Years and over | 0 (0.0%) | 37 (13.8%) |
Disability Class: Ambulatory Difficulty
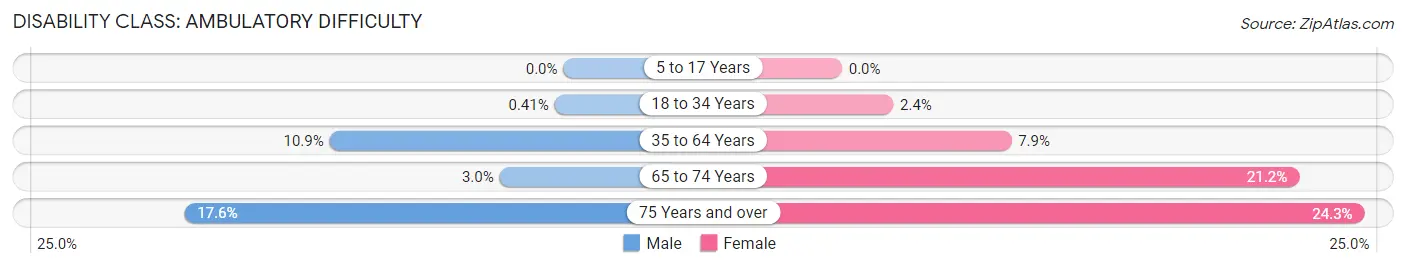
| Age Bracket | Male | Female |
| 5 to 17 Years | 0 (0.0%) | 0 (0.0%) |
| 18 to 34 Years | 3 (0.4%) | 16 (2.4%) |
| 35 to 64 Years | 106 (10.8%) | 81 (7.9%) |
| 65 to 74 Years | 8 (3.0%) | 80 (21.2%) |
| 75 Years and over | 19 (17.6%) | 65 (24.2%) |
Disability Class: Self-Care Difficulty
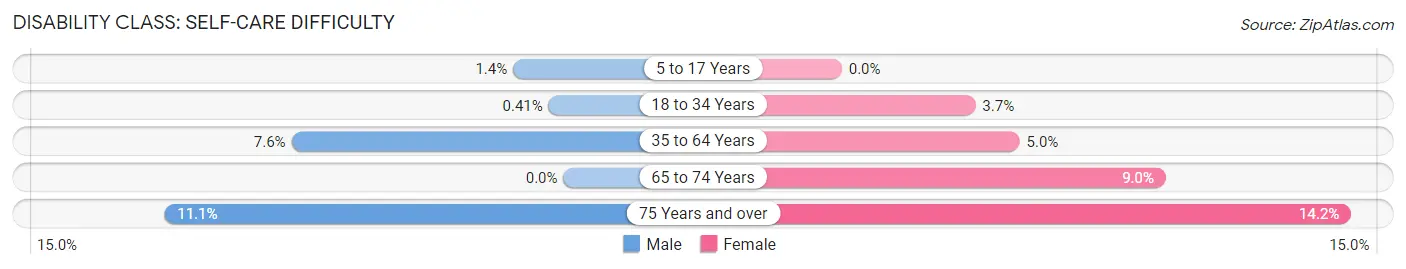
| Age Bracket | Male | Female |
| 5 to 17 Years | 10 (1.4%) | 0 (0.0%) |
| 18 to 34 Years | 3 (0.4%) | 25 (3.7%) |
| 35 to 64 Years | 74 (7.6%) | 51 (5.0%) |
| 65 to 74 Years | 0 (0.0%) | 34 (9.0%) |
| 75 Years and over | 12 (11.1%) | 38 (14.2%) |
Technology Access in Cherryville
Computing Device Access in Cherryville
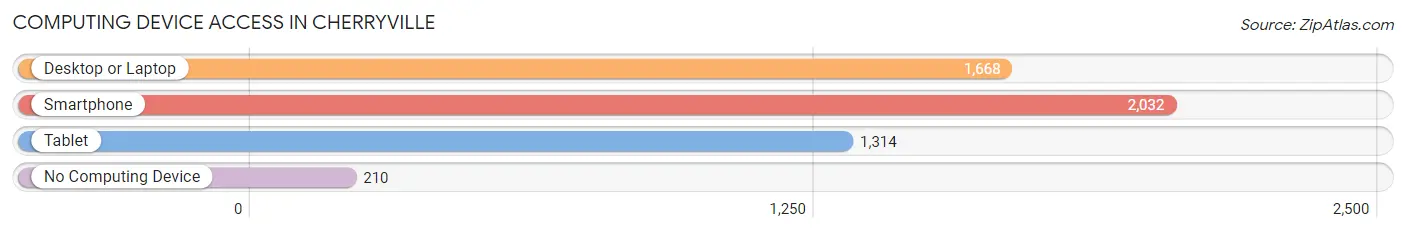
| Device Type | # Households | % Households |
| Desktop or Laptop | 1,668 | 68.6% |
| Smartphone | 2,032 | 83.6% |
| Tablet | 1,314 | 54.0% |
| No Computing Device | 210 | 8.6% |
| Total | 2,432 | 100.0% |
Internet Access in Cherryville
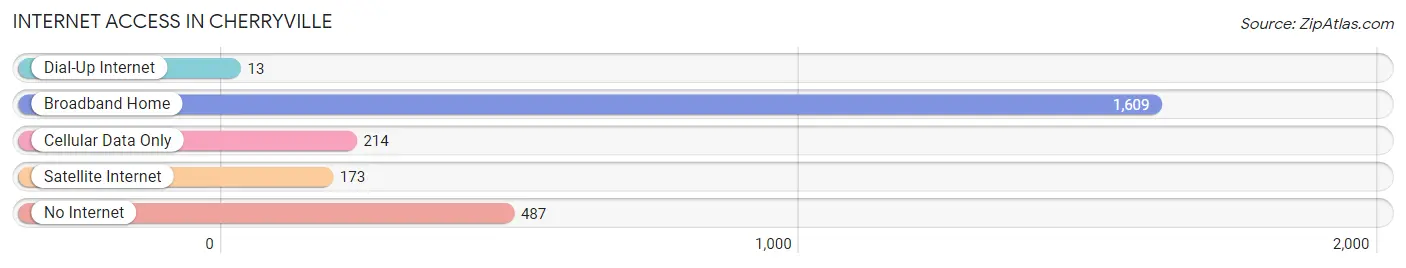
| Internet Type | # Households | % Households |
| Dial-Up Internet | 13 | 0.5% |
| Broadband Home | 1,609 | 66.2% |
| Cellular Data Only | 214 | 8.8% |
| Satellite Internet | 173 | 7.1% |
| No Internet | 487 | 20.0% |
| Total | 2,432 | 100.0% |
Cherryville Summary
Cherryville is a small city located in Gaston County, North Carolina. It is situated in the foothills of the Blue Ridge Mountains, approximately 25 miles west of Charlotte. The city has a population of 5,760 as of the 2010 census, and is the county seat of Gaston County.
Geography
Cherryville is located at 35°20'25" North, 81°17'45" West (35.340278, -81.295833). According to the United States Census Bureau, the city has a total area of 4.2 square miles, all of it land.
The city is located in the foothills of the Blue Ridge Mountains, and is surrounded by rolling hills and forests. The South Fork Catawba River runs through the city, and is a popular spot for fishing and other recreational activities.
History
Cherryville was founded in 1845 by a group of settlers from Pennsylvania. The city was named after the cherry trees that grew in abundance in the area. The city was incorporated in 1891, and has since grown to become the county seat of Gaston County.
The city was an important center for the textile industry in the early 20th century, and was home to several cotton mills. The city also had a thriving furniture industry, and was home to several furniture factories.
Economy
Cherryville is home to several small businesses, including restaurants, retail stores, and professional services. The city is also home to several manufacturing companies, including a furniture factory, a textile mill, and a plastics factory.
The city is also home to several large employers, including Gaston Memorial Hospital, the Gaston County Schools, and the Gaston County Government.
Demographics
As of the 2010 census, the population of Cherryville was 5,760. The racial makeup of the city was 79.2% White, 15.7% African American, 0.3% Native American, 0.7% Asian, 0.1% Pacific Islander, 2.2% from other races, and 2.0% from two or more races. Hispanic or Latino of any race were 4.3% of the population.
The median income for a household in the city was $35,938, and the median income for a family was $41,944. The per capita income for the city was $17,845. About 17.2% of families and 20.2% of the population were below the poverty line, including 28.3% of those under age 18 and 16.2% of those age 65 or over.
Conclusion
Cherryville is a small city located in Gaston County, North Carolina. It is situated in the foothills of the Blue Ridge Mountains, and is home to a population of 5,760 as of the 2010 census. The city has a rich history, and was an important center for the textile and furniture industries in the early 20th century. Today, the city is home to several small businesses, manufacturing companies, and large employers. The population of Cherryville is diverse, with 79.2% White, 15.7% African American, 0.3% Native American, 0.7% Asian, 0.1% Pacific Islander, 2.2% from other races, and 2.0% from two or more races. The median income for a household in the city was $35,938, and the median income for a family was $41,944.
Common Questions
What is Per Capita Income in Cherryville?
Per Capita income in Cherryville is $28,786.
What is the Median Family Income in Cherryville?
Median Family Income in Cherryville is $80,938.
What is the Median Household income in Cherryville?
Median Household Income in Cherryville is $57,137.
What is Income or Wage Gap in Cherryville?
Income or Wage Gap in Cherryville is 28.9%.
Women in Cherryville earn 71.1 cents for every dollar earned by a man.
What is Inequality or Gini Index in Cherryville?
Inequality or Gini Index in Cherryville is 0.41.
What is the Total Population of Cherryville?
Total Population of Cherryville is 6,113.
What is the Total Male Population of Cherryville?
Total Male Population of Cherryville is 3,079.
What is the Total Female Population of Cherryville?
Total Female Population of Cherryville is 3,034.
What is the Ratio of Males per 100 Females in Cherryville?
There are 101.48 Males per 100 Females in Cherryville.
What is the Ratio of Females per 100 Males in Cherryville?
There are 98.54 Females per 100 Males in Cherryville.
What is the Median Population Age in Cherryville?
Median Population Age in Cherryville is 37.4 Years.
What is the Average Family Size in Cherryville
Average Family Size in Cherryville is 3.1 People.
What is the Average Household Size in Cherryville
Average Household Size in Cherryville is 2.4 People.
How Large is the Labor Force in Cherryville?
There are 2,737 People in the Labor Forcein in Cherryville.
What is the Percentage of People in the Labor Force in Cherryville?
55.7% of People are in the Labor Force in Cherryville.
What is the Unemployment Rate in Cherryville?
Unemployment Rate in Cherryville is 3.5%.