Oak City, NC Map & Demographics
Oak City Map
Oak City Overview
$22,645
PER CAPITA INCOME
$58,393
AVG FAMILY INCOME
$57,769
AVG HOUSEHOLD INCOME
0.25
INEQUALITY / GINI INDEX
420
TOTAL POPULATION
203
MALE POPULATION
217
FEMALE POPULATION
93.55
MALES / 100 FEMALES
106.90
FEMALES / 100 MALES
49.0
MEDIAN AGE
2.7
AVG FAMILY SIZE
2.2
AVG HOUSEHOLD SIZE
244
LABOR FORCE [ PEOPLE ]
65.8%
PERCENT IN LABOR FORCE
2.9%
UNEMPLOYMENT RATE
Oak City Zip Codes
Oak City Area Codes
Income in Oak City
Income Overview in Oak City
Per Capita Income in Oak City is $22,645, while median incomes of families and households are $58,393 and $57,769 respectively.
| Characteristic | Number | Measure |
| Per Capita Income | 420 | $22,645 |
| Median Family Income | 129 | $58,393 |
| Mean Family Income | 129 | $58,449 |
| Median Household Income | 188 | $57,769 |
| Mean Household Income | 188 | $51,666 |
| Income Deficit | 129 | $0 |
| Wage / Income Gap (%) | 420 | 0.00% |
| Wage / Income Gap ($) | 420 | 100.00¢ per $1 |
| Gini / Inequality Index | 420 | 0.25 |
Earnings by Sex in Oak City
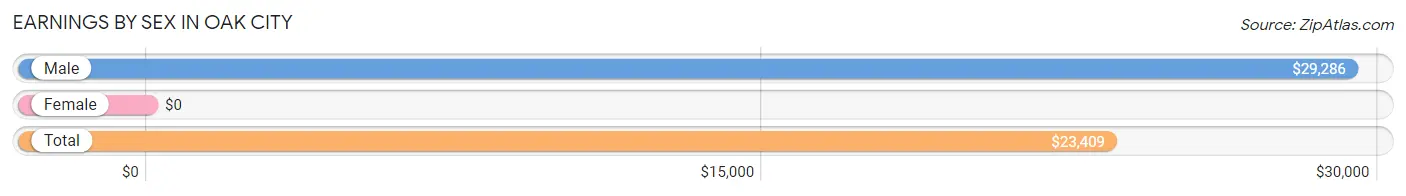
| Sex | Number | Average Earnings |
| Male | 120 (48.4%) | $29,286 |
| Female | 128 (51.6%) | $0 |
| Total | 248 (100.0%) | $23,409 |
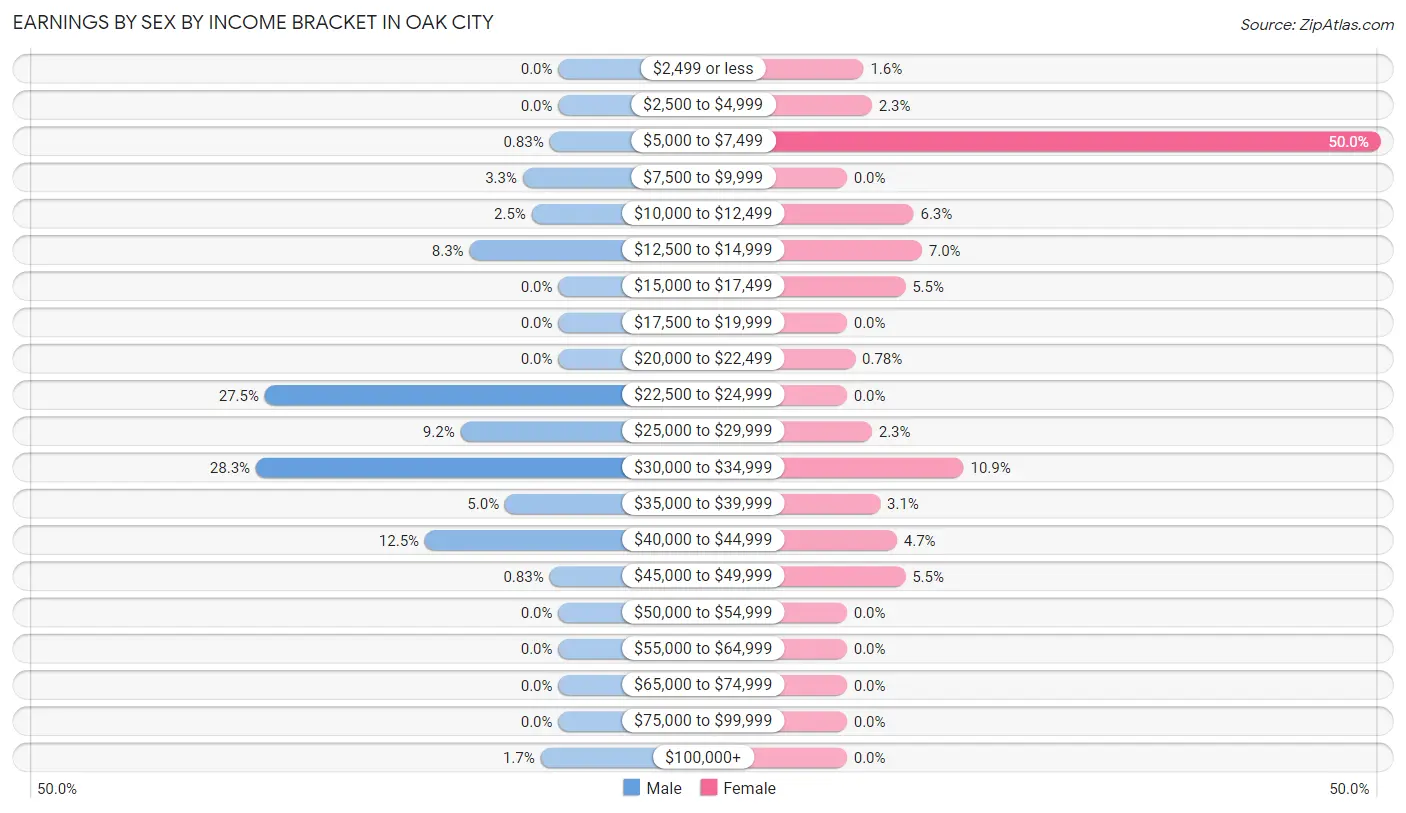
Earnings by Sex by Income Bracket in Oak City
The most common earnings brackets in Oak City are $30,000 to $34,999 for men (34 | 28.3%) and $5,000 to $7,499 for women (64 | 50.0%).
| Income | Male | Female |
| $2,499 or less | 0 (0.0%) | 2 (1.6%) |
| $2,500 to $4,999 | 0 (0.0%) | 3 (2.3%) |
| $5,000 to $7,499 | 1 (0.8%) | 64 (50.0%) |
| $7,500 to $9,999 | 4 (3.3%) | 0 (0.0%) |
| $10,000 to $12,499 | 3 (2.5%) | 8 (6.2%) |
| $12,500 to $14,999 | 10 (8.3%) | 9 (7.0%) |
| $15,000 to $17,499 | 0 (0.0%) | 7 (5.5%) |
| $17,500 to $19,999 | 0 (0.0%) | 0 (0.0%) |
| $20,000 to $22,499 | 0 (0.0%) | 1 (0.8%) |
| $22,500 to $24,999 | 33 (27.5%) | 0 (0.0%) |
| $25,000 to $29,999 | 11 (9.2%) | 3 (2.3%) |
| $30,000 to $34,999 | 34 (28.3%) | 14 (10.9%) |
| $35,000 to $39,999 | 6 (5.0%) | 4 (3.1%) |
| $40,000 to $44,999 | 15 (12.5%) | 6 (4.7%) |
| $45,000 to $49,999 | 1 (0.8%) | 7 (5.5%) |
| $50,000 to $54,999 | 0 (0.0%) | 0 (0.0%) |
| $55,000 to $64,999 | 0 (0.0%) | 0 (0.0%) |
| $65,000 to $74,999 | 0 (0.0%) | 0 (0.0%) |
| $75,000 to $99,999 | 0 (0.0%) | 0 (0.0%) |
| $100,000+ | 2 (1.7%) | 0 (0.0%) |
| Total | 120 (100.0%) | 128 (100.0%) |
Earnings by Sex by Educational Attainment in Oak City
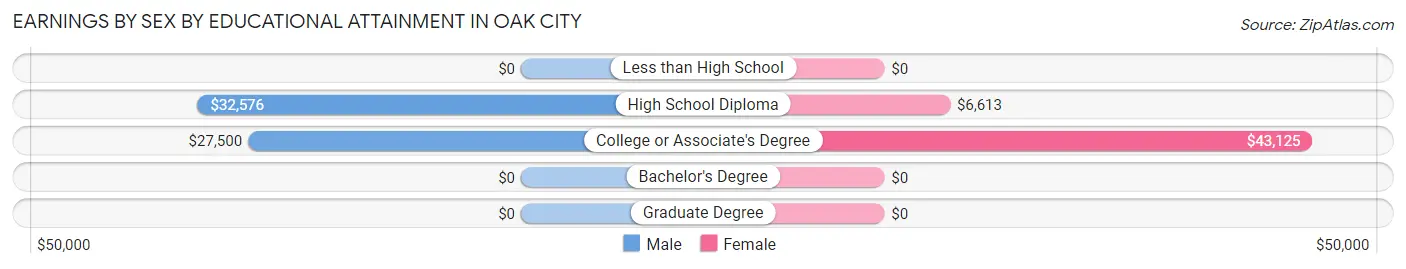
| Educational Attainment | Male Income | Female Income |
| Less than High School | - | - |
| High School Diploma | $32,576 | $6,613 |
| College or Associate's Degree | $27,500 | $43,125 |
| Bachelor's Degree | - | - |
| Graduate Degree | - | - |
| Total | $29,286 | $0 |
Family Income in Oak City
Family Income Brackets in Oak City
According to the Oak City family income data, there are 74 families falling into the $50,000 to $74,999 income range, which is the most common income bracket and makes up 57.4% of all families.
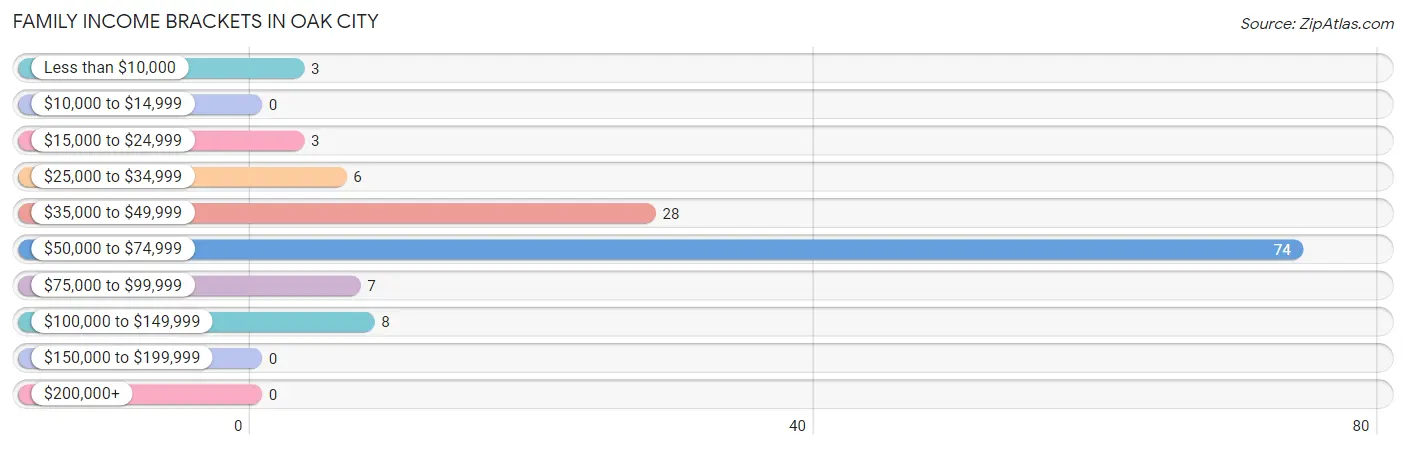
| Income Bracket | # Families | % Families |
| Less than $10,000 | 3 | 2.3% |
| $10,000 to $14,999 | 0 | 0.0% |
| $15,000 to $24,999 | 3 | 2.3% |
| $25,000 to $34,999 | 6 | 4.7% |
| $35,000 to $49,999 | 28 | 21.7% |
| $50,000 to $74,999 | 74 | 57.4% |
| $75,000 to $99,999 | 7 | 5.4% |
| $100,000 to $149,999 | 8 | 6.2% |
| $150,000 to $199,999 | 0 | 0.0% |
| $200,000+ | 0 | 0.0% |
Family Income by Famaliy Size in Oak City
4-person families (12 | 9.3%) account for the highest median family income in Oak City with $71,563 per family, while 2-person families (38 | 29.5%) have the highest median income of $24,286 per family member.
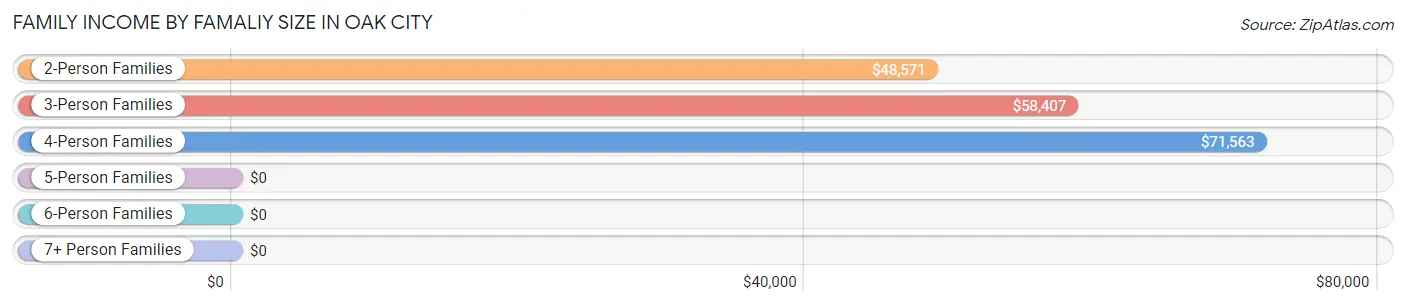
| Income Bracket | # Families | Median Income |
| 2-Person Families | 38 (29.5%) | $48,571 |
| 3-Person Families | 79 (61.2%) | $58,407 |
| 4-Person Families | 12 (9.3%) | $71,563 |
| 5-Person Families | 0 (0.0%) | $0 |
| 6-Person Families | 0 (0.0%) | $0 |
| 7+ Person Families | 0 (0.0%) | $0 |
| Total | 129 (100.0%) | $58,393 |
Family Income by Number of Earners in Oak City
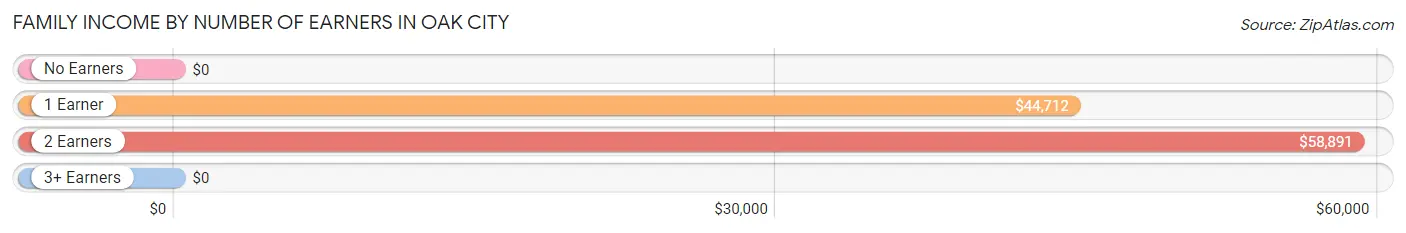
| Number of Earners | # Families | Median Income |
| No Earners | 6 (4.6%) | $0 |
| 1 Earner | 37 (28.7%) | $44,712 |
| 2 Earners | 85 (65.9%) | $58,891 |
| 3+ Earners | 1 (0.8%) | $0 |
| Total | 129 (100.0%) | $58,393 |
Household Income in Oak City
Household Income Brackets in Oak City
With 95 households falling in the category, the $50,000 to $74,999 income range is the most frequent in Oak City, accounting for 50.5% of all households.
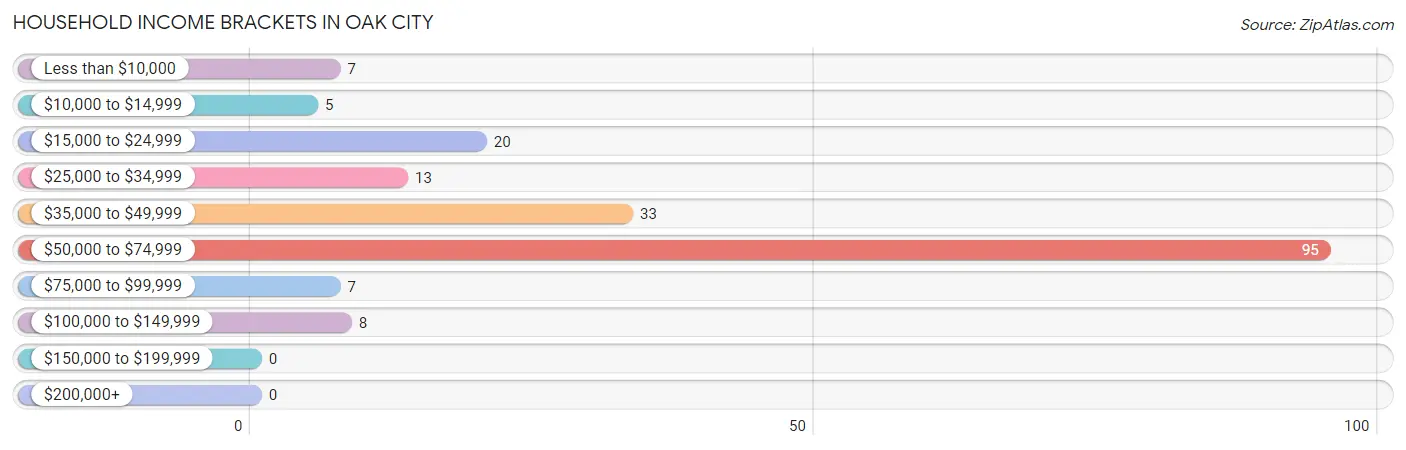
| Income Bracket | # Households | % Households |
| Less than $10,000 | 7 | 3.7% |
| $10,000 to $14,999 | 5 | 2.7% |
| $15,000 to $24,999 | 20 | 10.6% |
| $25,000 to $34,999 | 13 | 6.9% |
| $35,000 to $49,999 | 33 | 17.6% |
| $50,000 to $74,999 | 95 | 50.5% |
| $75,000 to $99,999 | 7 | 3.7% |
| $100,000 to $149,999 | 8 | 4.3% |
| $150,000 to $199,999 | 0 | 0.0% |
| $200,000+ | 0 | 0.0% |
Household Income by Householder Age in Oak City
The median household income in Oak City is $57,769, with the highest median household income of $58,214 found in the 65+ years age bracket for the primary householder. A total of 116 households (61.7%) fall into this category.
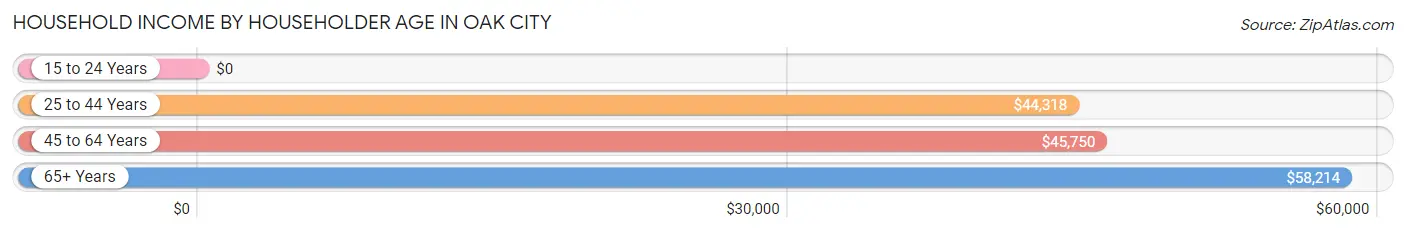
| Income Bracket | # Households | Median Income |
| 15 to 24 Years | 0 (0.0%) | $0 |
| 25 to 44 Years | 46 (24.5%) | $44,318 |
| 45 to 64 Years | 26 (13.8%) | $45,750 |
| 65+ Years | 116 (61.7%) | $58,214 |
| Total | 188 (100.0%) | $57,769 |
Poverty in Oak City
Income Below Poverty by Sex and Age in Oak City
With 3.9% poverty level for males and 5.5% for females among the residents of Oak City, 6 to 11 year old males and 35 to 44 year old females are the most vulnerable to poverty, with 4 males (100.0%) and 3 females (30.0%) in their respective age groups living below the poverty level.
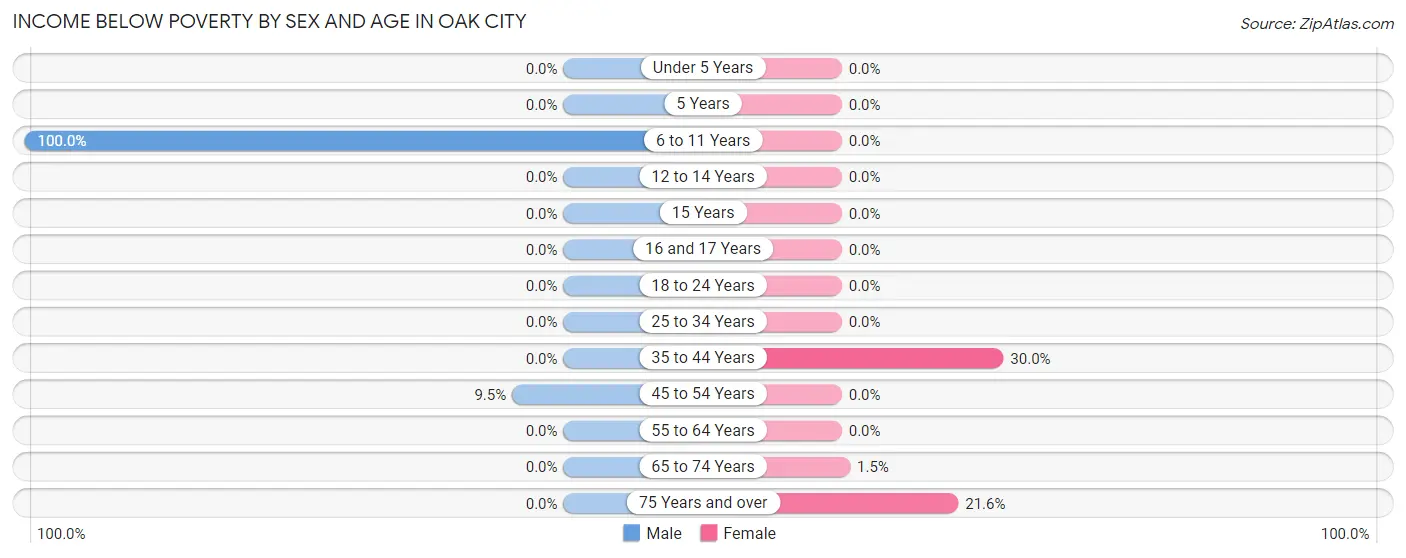
| Age Bracket | Male | Female |
| Under 5 Years | 0 (0.0%) | 0 (0.0%) |
| 5 Years | 0 (0.0%) | 0 (0.0%) |
| 6 to 11 Years | 4 (100.0%) | 0 (0.0%) |
| 12 to 14 Years | 0 (0.0%) | 0 (0.0%) |
| 15 Years | 0 (0.0%) | 0 (0.0%) |
| 16 and 17 Years | 0 (0.0%) | 0 (0.0%) |
| 18 to 24 Years | 0 (0.0%) | 0 (0.0%) |
| 25 to 34 Years | 0 (0.0%) | 0 (0.0%) |
| 35 to 44 Years | 0 (0.0%) | 3 (30.0%) |
| 45 to 54 Years | 4 (9.5%) | 0 (0.0%) |
| 55 to 64 Years | 0 (0.0%) | 0 (0.0%) |
| 65 to 74 Years | 0 (0.0%) | 1 (1.5%) |
| 75 Years and over | 0 (0.0%) | 8 (21.6%) |
| Total | 8 (3.9%) | 12 (5.5%) |
Income Above Poverty by Sex and Age in Oak City
According to the poverty statistics in Oak City, males aged 15 years and females aged under 5 years are the age groups that are most secure financially, with 100.0% of males and 100.0% of females in these age groups living above the poverty line.
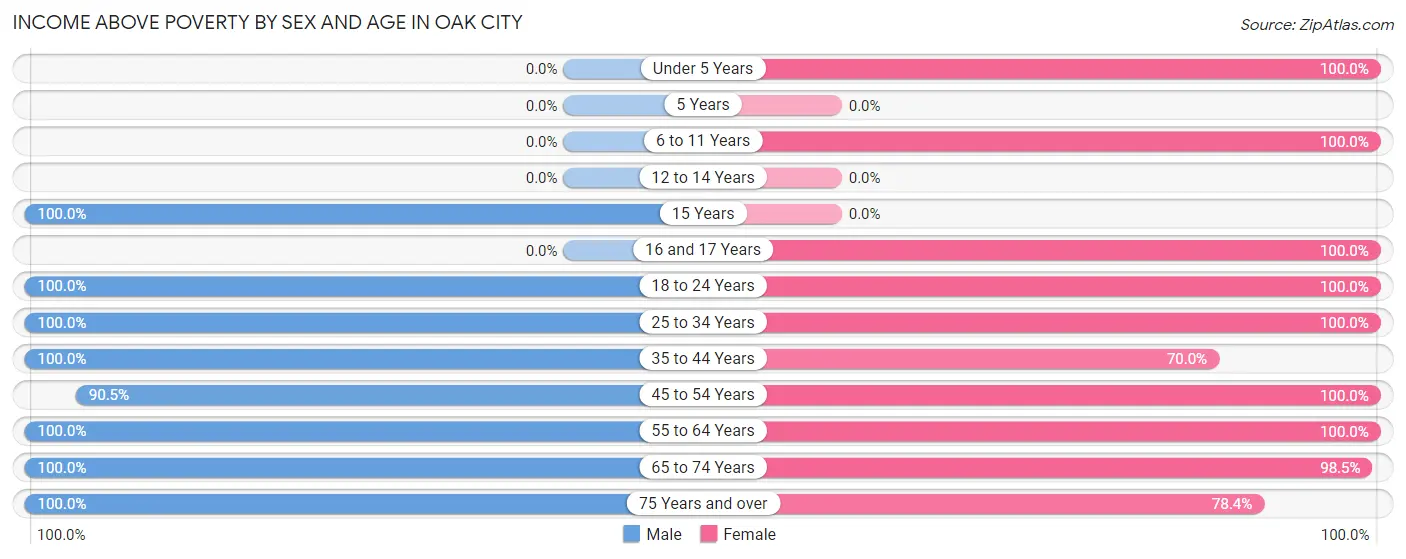
| Age Bracket | Male | Female |
| Under 5 Years | 0 (0.0%) | 29 (100.0%) |
| 5 Years | 0 (0.0%) | 0 (0.0%) |
| 6 to 11 Years | 0 (0.0%) | 12 (100.0%) |
| 12 to 14 Years | 0 (0.0%) | 0 (0.0%) |
| 15 Years | 4 (100.0%) | 0 (0.0%) |
| 16 and 17 Years | 0 (0.0%) | 2 (100.0%) |
| 18 to 24 Years | 1 (100.0%) | 9 (100.0%) |
| 25 to 34 Years | 51 (100.0%) | 24 (100.0%) |
| 35 to 44 Years | 26 (100.0%) | 7 (70.0%) |
| 45 to 54 Years | 38 (90.5%) | 16 (100.0%) |
| 55 to 64 Years | 46 (100.0%) | 13 (100.0%) |
| 65 to 74 Years | 19 (100.0%) | 64 (98.5%) |
| 75 Years and over | 10 (100.0%) | 29 (78.4%) |
| Total | 195 (96.1%) | 205 (94.5%) |
Income Below Poverty Among Married-Couple Families in Oak City
The poverty statistics for married-couple families in Oak City show that 7.9% or 3 of the total 38 families live below the poverty line. Families with 1 or 2 children have the highest poverty rate of 15.8%, comprising of 3 families. On the other hand, families with no children have the lowest poverty rate of 0.0%, which includes 0 families.
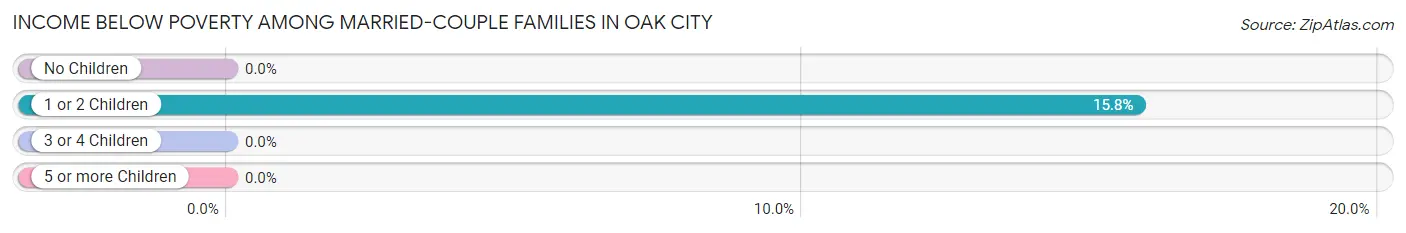
| Children | Above Poverty | Below Poverty |
| No Children | 19 (100.0%) | 0 (0.0%) |
| 1 or 2 Children | 16 (84.2%) | 3 (15.8%) |
| 3 or 4 Children | 0 (0.0%) | 0 (0.0%) |
| 5 or more Children | 0 (0.0%) | 0 (0.0%) |
| Total | 35 (92.1%) | 3 (7.9%) |
Income Below Poverty Among Single-Parent Households in Oak City
| Children | Single Father | Single Mother |
| No Children | 0 (0.0%) | 0 (0.0%) |
| 1 or 2 Children | 0 (0.0%) | 0 (0.0%) |
| 3 or 4 Children | 0 (0.0%) | 0 (0.0%) |
| 5 or more Children | 0 (0.0%) | 0 (0.0%) |
| Total | 0 (0.0%) | 0 (0.0%) |
Income Below Poverty Among Married-Couple vs Single-Parent Households in Oak City
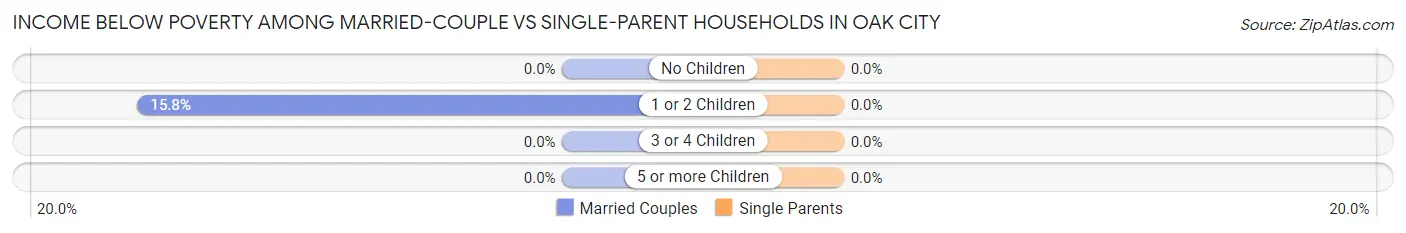
| Children | Married-Couple Families | Single-Parent Households |
| No Children | 0 (0.0%) | 0 (0.0%) |
| 1 or 2 Children | 3 (15.8%) | 0 (0.0%) |
| 3 or 4 Children | 0 (0.0%) | 0 (0.0%) |
| 5 or more Children | 0 (0.0%) | 0 (0.0%) |
| Total | 3 (7.9%) | 0 (0.0%) |
Race in Oak City
The most populous races in Oak City are Black / African American (322 | 76.7%), White / Caucasian (88 | 20.9%), and Hispanic or Latino (18 | 4.3%).
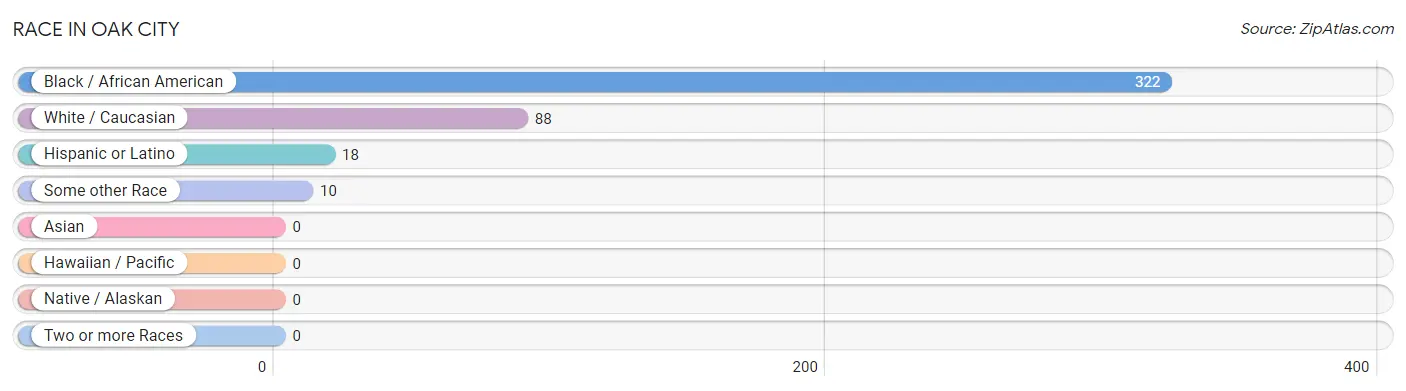
| Race | # Population | % Population |
| Asian | 0 | 0.0% |
| Black / African American | 322 | 76.7% |
| Hawaiian / Pacific | 0 | 0.0% |
| Hispanic or Latino | 18 | 4.3% |
| Native / Alaskan | 0 | 0.0% |
| White / Caucasian | 88 | 20.9% |
| Two or more Races | 0 | 0.0% |
| Some other Race | 10 | 2.4% |
| Total | 420 | 100.0% |
Ancestry in Oak City
The most populous ancestries reported in Oak City are American (41 | 9.8%), Puerto Rican (18 | 4.3%), German (10 | 2.4%), English (8 | 1.9%), and Irish (8 | 1.9%), together accounting for 20.2% of all Oak City residents.
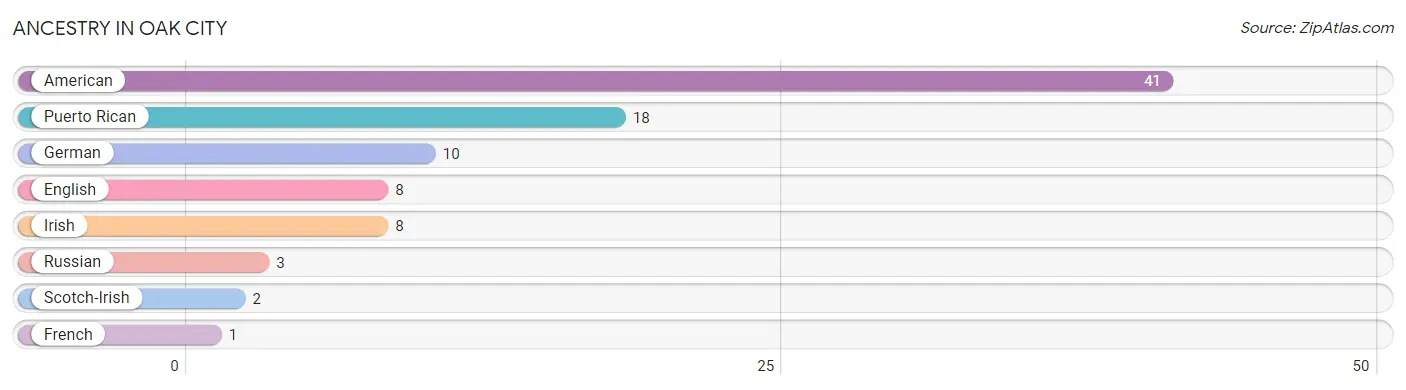
| Ancestry | # Population | % Population |
| American | 41 | 9.8% |
| English | 8 | 1.9% |
| French | 1 | 0.2% |
| German | 10 | 2.4% |
| Irish | 8 | 1.9% |
| Puerto Rican | 18 | 4.3% |
| Russian | 3 | 0.7% |
| Scotch-Irish | 2 | 0.5% | View All 8 Rows |
Immigrants in Oak City
The most numerous immigrant groups reported in Oak City came from Europe (10 | 2.4%), Germany (10 | 2.4%), and Western Europe (10 | 2.4%), together accounting for 7.1% of all Oak City residents.
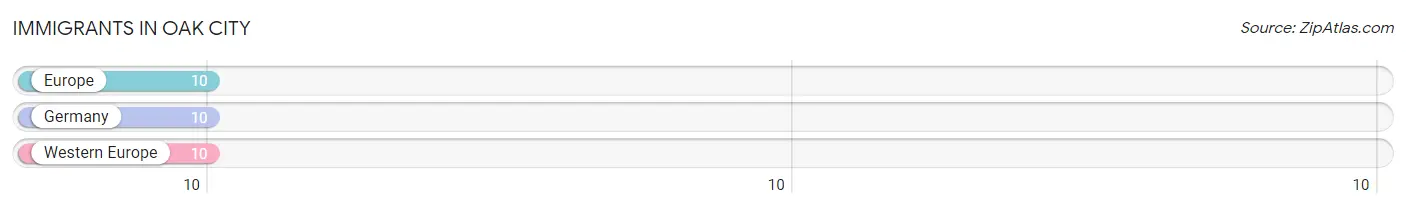
| Immigration Origin | # Population | % Population |
| Europe | 10 | 2.4% |
| Germany | 10 | 2.4% |
| Western Europe | 10 | 2.4% | View All 3 Rows |
Sex and Age in Oak City
Sex and Age in Oak City
The most populous age groups in Oak City are 60 to 64 Years (45 | 22.2%) for men and 65 to 69 Years (64 | 29.5%) for women.
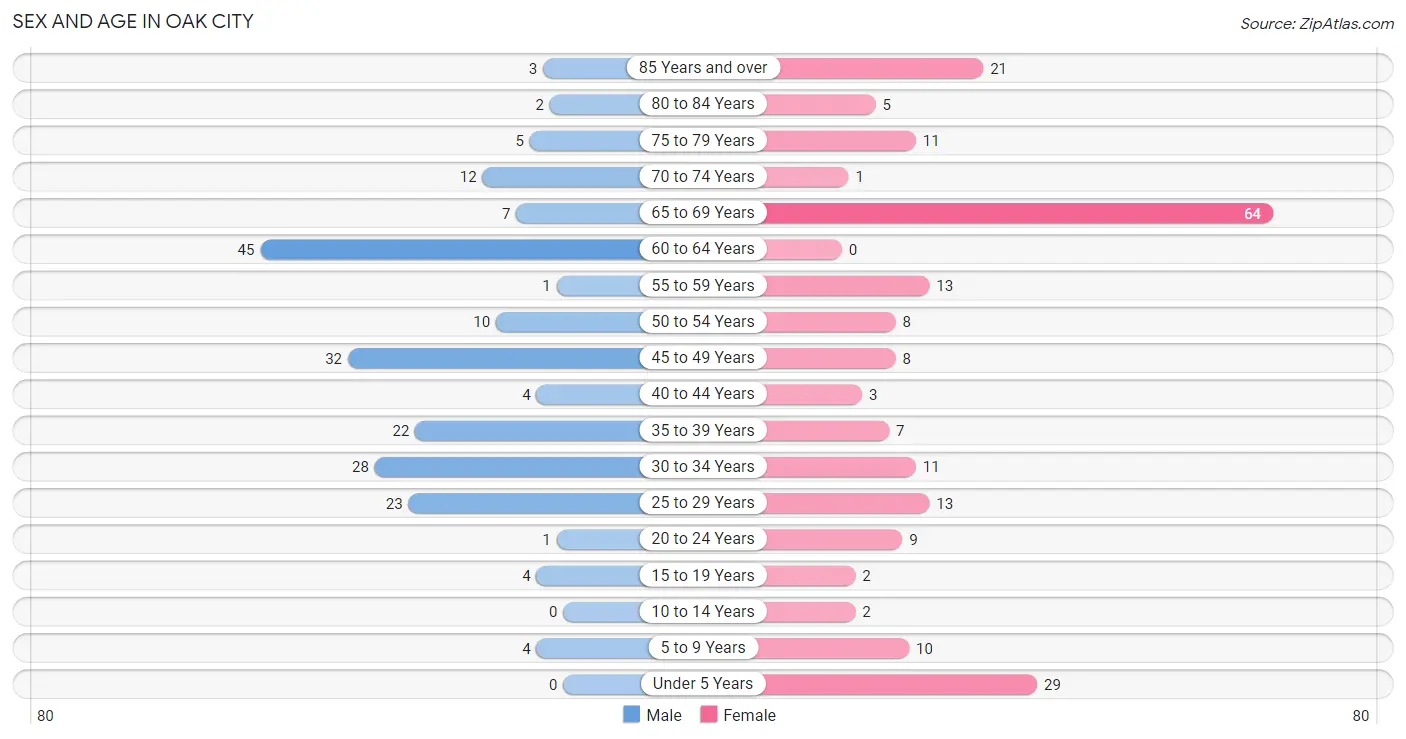
| Age Bracket | Male | Female |
| Under 5 Years | 0 (0.0%) | 29 (13.4%) |
| 5 to 9 Years | 4 (2.0%) | 10 (4.6%) |
| 10 to 14 Years | 0 (0.0%) | 2 (0.9%) |
| 15 to 19 Years | 4 (2.0%) | 2 (0.9%) |
| 20 to 24 Years | 1 (0.5%) | 9 (4.2%) |
| 25 to 29 Years | 23 (11.3%) | 13 (6.0%) |
| 30 to 34 Years | 28 (13.8%) | 11 (5.1%) |
| 35 to 39 Years | 22 (10.8%) | 7 (3.2%) |
| 40 to 44 Years | 4 (2.0%) | 3 (1.4%) |
| 45 to 49 Years | 32 (15.8%) | 8 (3.7%) |
| 50 to 54 Years | 10 (4.9%) | 8 (3.7%) |
| 55 to 59 Years | 1 (0.5%) | 13 (6.0%) |
| 60 to 64 Years | 45 (22.2%) | 0 (0.0%) |
| 65 to 69 Years | 7 (3.5%) | 64 (29.5%) |
| 70 to 74 Years | 12 (5.9%) | 1 (0.5%) |
| 75 to 79 Years | 5 (2.5%) | 11 (5.1%) |
| 80 to 84 Years | 2 (1.0%) | 5 (2.3%) |
| 85 Years and over | 3 (1.5%) | 21 (9.7%) |
| Total | 203 (100.0%) | 217 (100.0%) |
Families and Households in Oak City
Median Family Size in Oak City
The median family size in Oak City is 2.71 persons per family, with married-couple families (38 | 29.5%) accounting for the largest median family size of 4.39 persons per family. On the other hand, single female/mother families (72 | 55.8%) represent the smallest median family size with 1.94 persons per family.
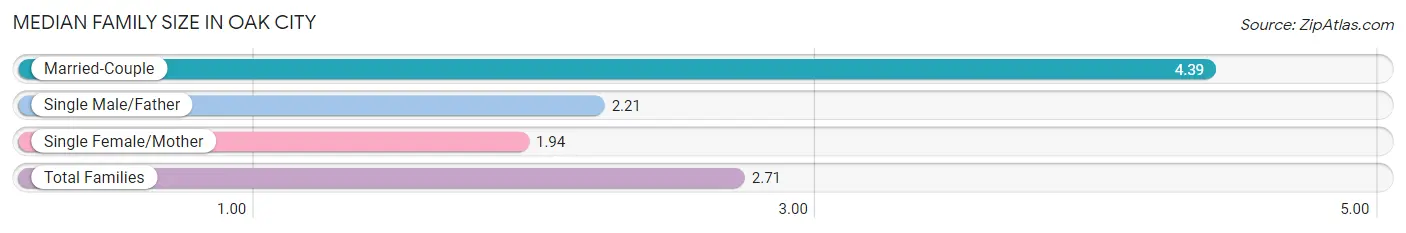
| Family Type | # Families | Family Size |
| Married-Couple | 38 (29.5%) | 4.39 |
| Single Male/Father | 19 (14.7%) | 2.21 |
| Single Female/Mother | 72 (55.8%) | 1.94 |
| Total Families | 129 (100.0%) | 2.71 |
Median Household Size in Oak City
The median household size in Oak City is 2.23 persons per household, with married-couple households (38 | 20.2%) accounting for the largest median household size of 4.39 persons per household. non-family households (59 | 31.4%) represent the smallest median household size with 1.08 persons per household.
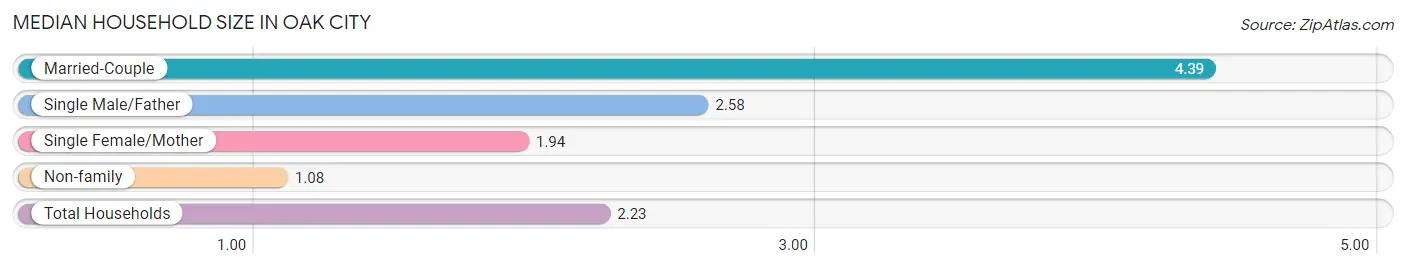
| Household Type | # Households | Household Size |
| Married-Couple | 38 (20.2%) | 4.39 |
| Single Male/Father | 19 (10.1%) | 2.58 |
| Single Female/Mother | 72 (38.3%) | 1.94 |
| Non-family | 59 (31.4%) | 1.08 |
| Total Households | 188 (100.0%) | 2.23 |
Household Size by Marriage Status in Oak City
Out of a total of 188 households in Oak City, 129 (68.6%) are family households, while 59 (31.4%) are nonfamily households. The most numerous type of family households are 3-person households, comprising 81, and the most common type of nonfamily households are 1-person households, comprising 54.
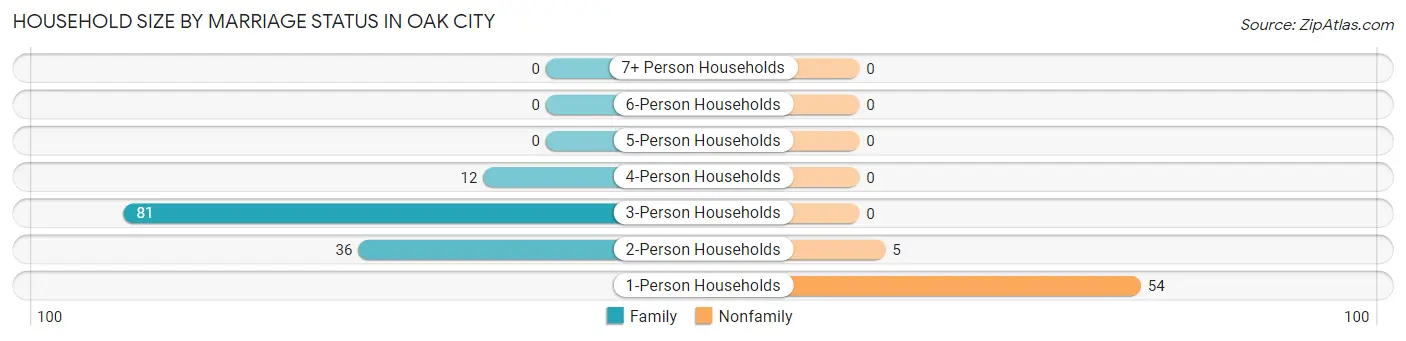
| Household Size | Family Households | Nonfamily Households |
| 1-Person Households | - | 54 (28.7%) |
| 2-Person Households | 36 (19.2%) | 5 (2.7%) |
| 3-Person Households | 81 (43.1%) | 0 (0.0%) |
| 4-Person Households | 12 (6.4%) | 0 (0.0%) |
| 5-Person Households | 0 (0.0%) | 0 (0.0%) |
| 6-Person Households | 0 (0.0%) | 0 (0.0%) |
| 7+ Person Households | 0 (0.0%) | 0 (0.0%) |
| Total | 129 (68.6%) | 59 (31.4%) |
Female Fertility in Oak City
Fertility by Age in Oak City
Average fertility rate in Oak City is 182.0 births per 1,000 women. Women in the age bracket of 20 to 34 years have the highest fertility rate with 303.0 births per 1,000 women. Women in the age bracket of 20 to 34 years acount for 100.0% of all women with births.
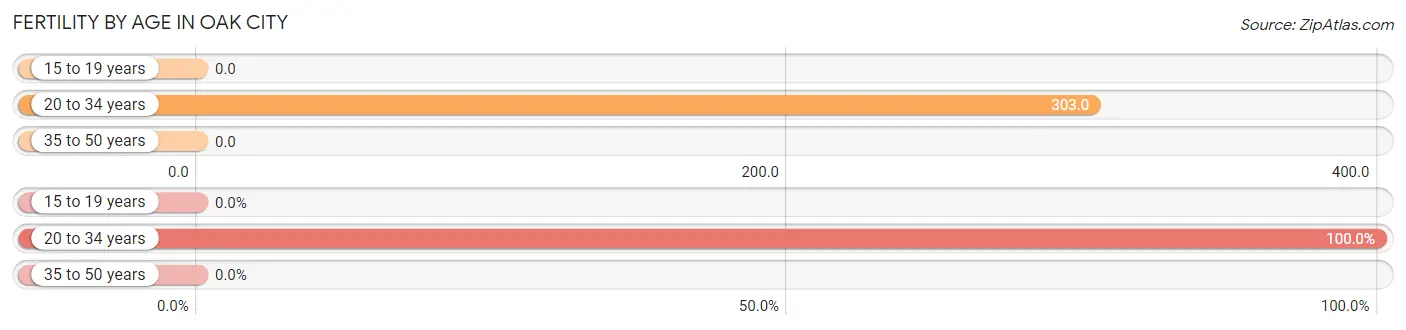
| Age Bracket | Women with Births | Births / 1,000 Women |
| 15 to 19 years | 0 (0.0%) | 0.0 |
| 20 to 34 years | 10 (100.0%) | 303.0 |
| 35 to 50 years | 0 (0.0%) | 0.0 |
| Total | 10 (100.0%) | 182.0 |
Fertility by Age by Marriage Status in Oak City
30.0% of women with births (10) in Oak City are married. The highest percentage of unmarried women with births falls into 20 to 34 years age bracket with 70.0% of them unmarried at the time of birth, while the lowest percentage of unmarried women with births belong to 20 to 34 years age bracket with 70.0% of them unmarried.
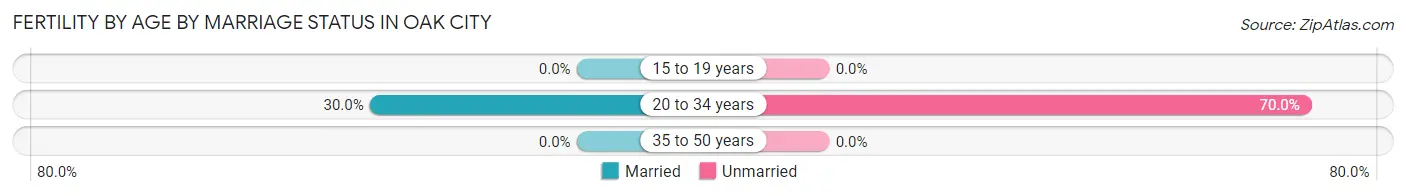
| Age Bracket | Married | Unmarried |
| 15 to 19 years | 0 (0.0%) | 0 (0.0%) |
| 20 to 34 years | 3 (30.0%) | 7 (70.0%) |
| 35 to 50 years | 0 (0.0%) | 0 (0.0%) |
| Total | 3 (30.0%) | 7 (70.0%) |
Fertility by Education in Oak City
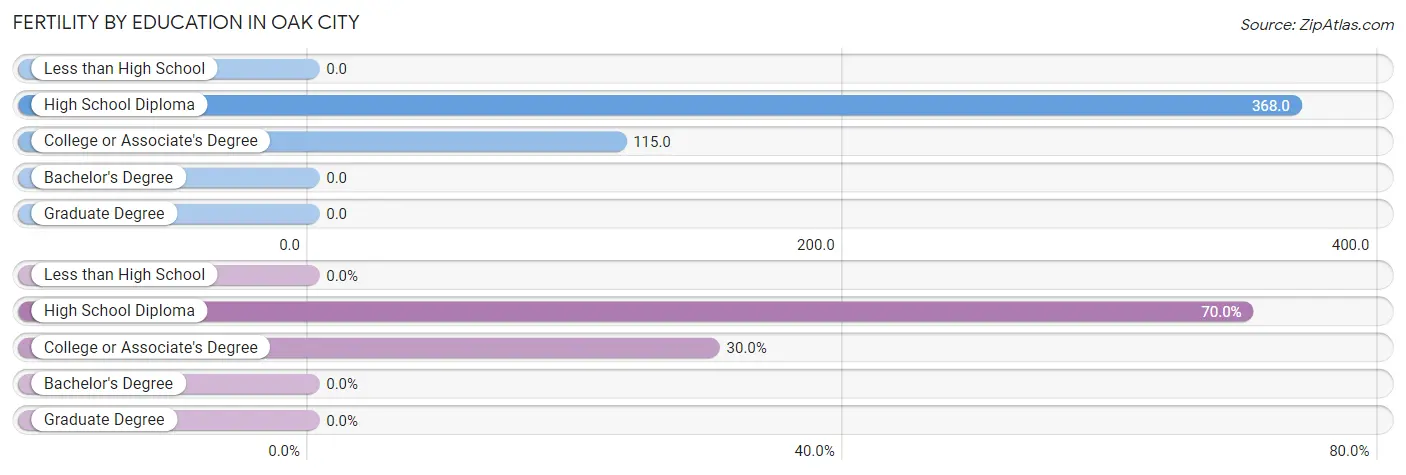
| Educational Attainment | Women with Births | Births / 1,000 Women |
| Less than High School | 0 (0.0%) | 0.0 |
| High School Diploma | 7 (70.0%) | 368.0 |
| College or Associate's Degree | 3 (30.0%) | 115.0 |
| Bachelor's Degree | 0 (0.0%) | 0.0 |
| Graduate Degree | 0 (0.0%) | 0.0 |
| Total | 10 (100.0%) | 182.0 |
Fertility by Education by Marriage Status in Oak City
70.0% of women with births in Oak City are unmarried. Women with the educational attainment of college or associate's degree are most likely to be married with 100.0% of them married at childbirth, while women with the educational attainment of high school diploma are least likely to be married with 100.0% of them unmarried at childbirth.
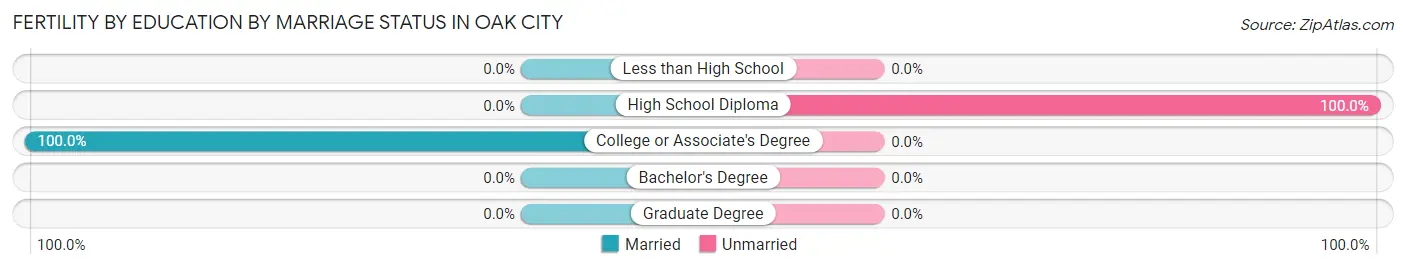
| Educational Attainment | Married | Unmarried |
| Less than High School | 0 (0.0%) | 0 (0.0%) |
| High School Diploma | 0 (0.0%) | 7 (100.0%) |
| College or Associate's Degree | 3 (100.0%) | 0 (0.0%) |
| Bachelor's Degree | 0 (0.0%) | 0 (0.0%) |
| Graduate Degree | 0 (0.0%) | 0 (0.0%) |
| Total | 3 (30.0%) | 7 (70.0%) |
Employment Characteristics in Oak City
Employment by Class of Employer in Oak City
Among the 234 employed individuals in Oak City, private company employees (213 | 91.0%), self-employed (incorporated) (7 | 3.0%), and federal government employees (5 | 2.1%) make up the most common classes of employment.
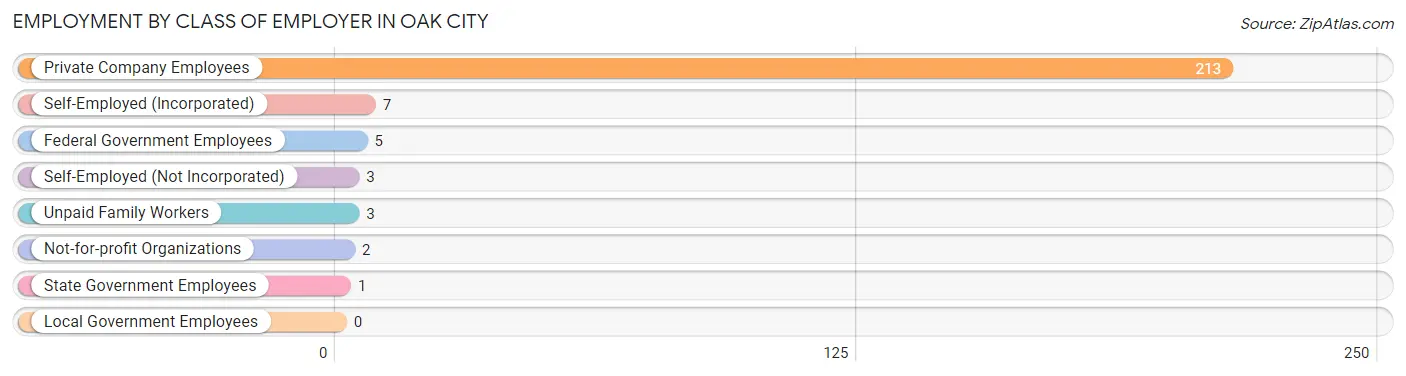
| Employer Class | # Employees | % Employees |
| Private Company Employees | 213 | 91.0% |
| Self-Employed (Incorporated) | 7 | 3.0% |
| Self-Employed (Not Incorporated) | 3 | 1.3% |
| Not-for-profit Organizations | 2 | 0.9% |
| Local Government Employees | 0 | 0.0% |
| State Government Employees | 1 | 0.4% |
| Federal Government Employees | 5 | 2.1% |
| Unpaid Family Workers | 3 | 1.3% |
| Total | 234 | 100.0% |
Employment Status by Age in Oak City
According to the labor force statistics for Oak City, out of the total population over 16 years of age (371), 65.8% or 244 individuals are in the labor force, with 2.9% or 7 of them unemployed. The age group with the highest labor force participation rate is 25 to 29 years, with 100.0% or 36 individuals in the labor force. Within the labor force, the 30 to 34 years age range has the highest percentage of unemployed individuals, with 18.4% or 7 of them being unemployed.
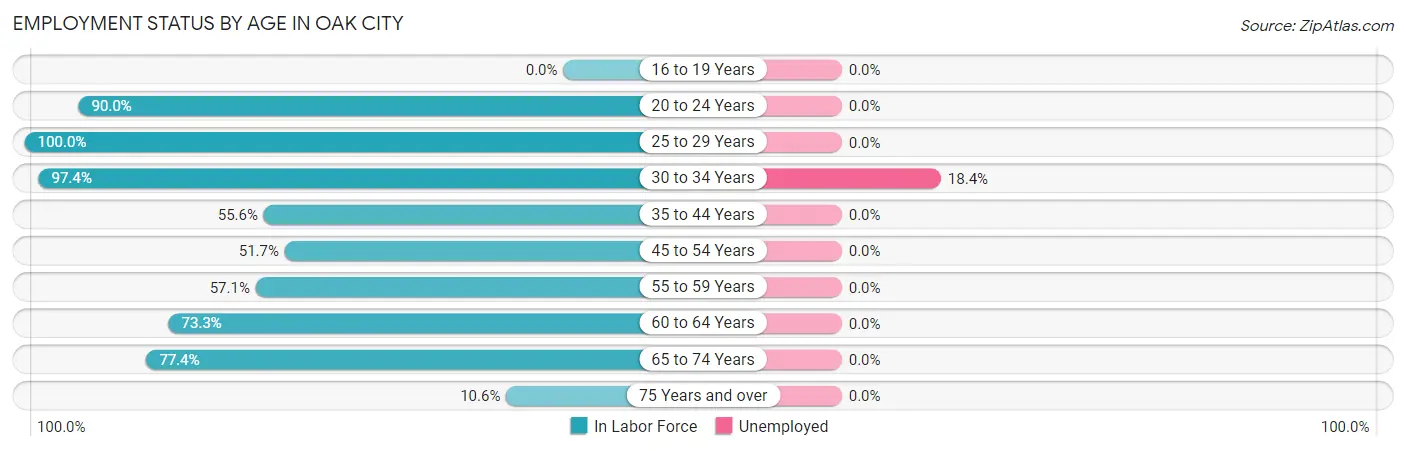
| Age Bracket | In Labor Force | Unemployed |
| 16 to 19 Years | 0 (0.0%) | 0 (0.0%) |
| 20 to 24 Years | 9 (90.0%) | 0 (0.0%) |
| 25 to 29 Years | 36 (100.0%) | 0 (0.0%) |
| 30 to 34 Years | 38 (97.4%) | 7 (18.4%) |
| 35 to 44 Years | 20 (55.6%) | 0 (0.0%) |
| 45 to 54 Years | 30 (51.7%) | 0 (0.0%) |
| 55 to 59 Years | 8 (57.1%) | 0 (0.0%) |
| 60 to 64 Years | 33 (73.3%) | 0 (0.0%) |
| 65 to 74 Years | 65 (77.4%) | 0 (0.0%) |
| 75 Years and over | 5 (10.6%) | 0 (0.0%) |
| Total | 244 (65.8%) | 7 (2.9%) |
Employment Status by Educational Attainment in Oak City
According to labor force statistics for Oak City, 72.4% of individuals (165) out of the total population between 25 and 64 years of age (228) are in the labor force, with 4.2% or 7 of them being unemployed. The group with the highest labor force participation rate are those with the educational attainment of high school diploma, with 100.0% or 107 individuals in the labor force. Within the labor force, individuals with high school diploma education have the highest percentage of unemployment, with 6.5% or 7 of them being unemployed.
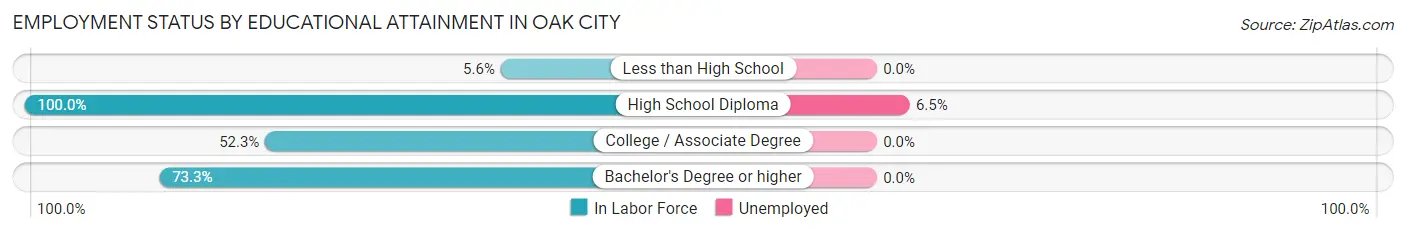
| Educational Attainment | In Labor Force | Unemployed |
| Less than High School | 1 (5.6%) | 0 (0.0%) |
| High School Diploma | 107 (100.0%) | 7 (6.5%) |
| College / Associate Degree | 46 (52.3%) | 0 (0.0%) |
| Bachelor's Degree or higher | 11 (73.3%) | 0 (0.0%) |
| Total | 165 (72.4%) | 10 (4.2%) |
Employment Occupations by Sex in Oak City
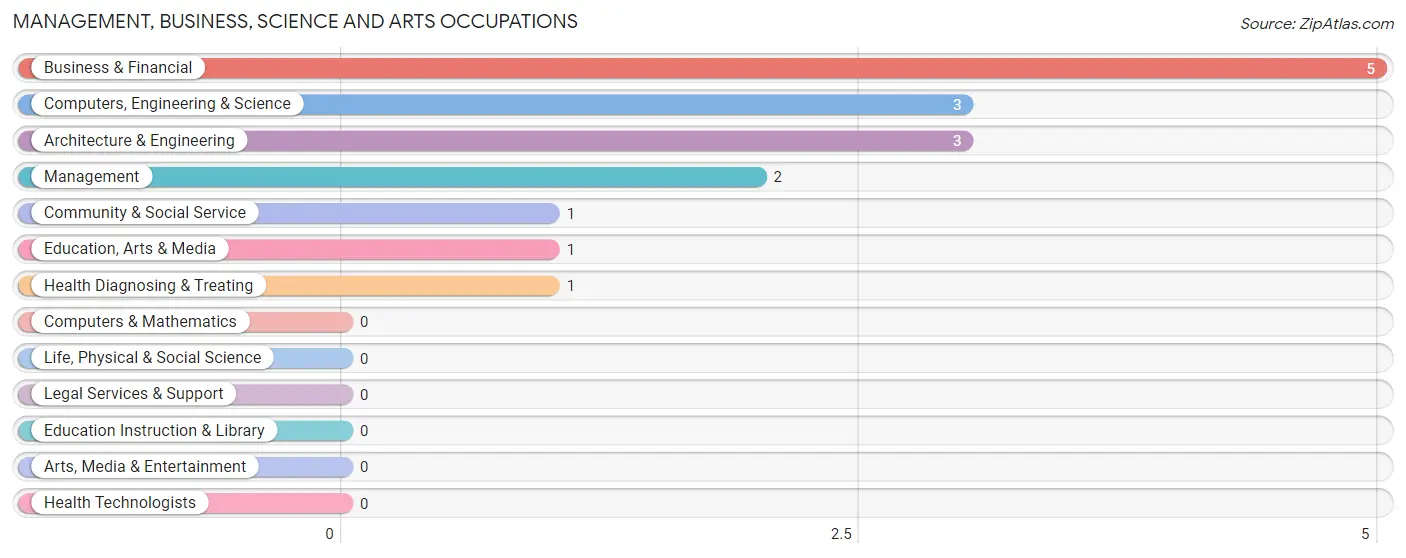
Management, Business, Science and Arts Occupations
The most common Management, Business, Science and Arts occupations in Oak City are Business & Financial (5 | 2.1%), Computers, Engineering & Science (3 | 1.3%), Architecture & Engineering (3 | 1.3%), Management (2 | 0.8%), and Community & Social Service (1 | 0.4%).
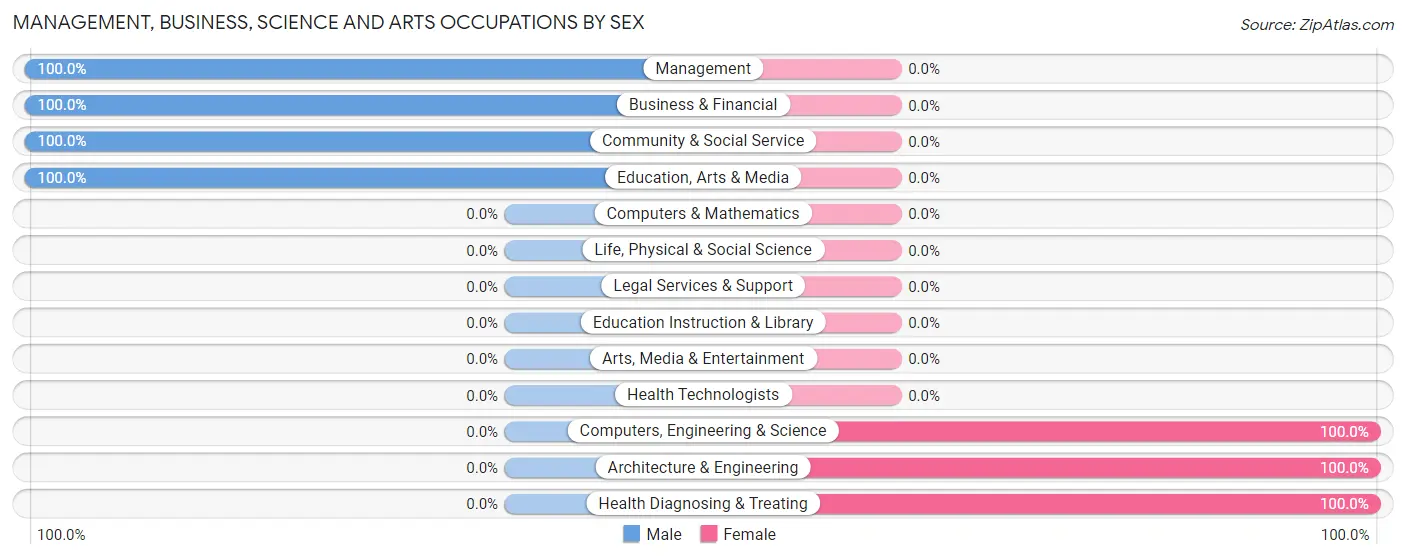
Management, Business, Science and Arts Occupations by Sex
Within the Management, Business, Science and Arts occupations in Oak City, the most male-oriented occupations are Management (100.0%), Business & Financial (100.0%), and Community & Social Service (100.0%), while the most female-oriented occupations are Computers, Engineering & Science (100.0%), Architecture & Engineering (100.0%), and Health Diagnosing & Treating (100.0%).
| Occupation | Male | Female |
| Management | 2 (100.0%) | 0 (0.0%) |
| Business & Financial | 5 (100.0%) | 0 (0.0%) |
| Computers, Engineering & Science | 0 (0.0%) | 3 (100.0%) |
| Computers & Mathematics | 0 (0.0%) | 0 (0.0%) |
| Architecture & Engineering | 0 (0.0%) | 3 (100.0%) |
| Life, Physical & Social Science | 0 (0.0%) | 0 (0.0%) |
| Community & Social Service | 1 (100.0%) | 0 (0.0%) |
| Education, Arts & Media | 1 (100.0%) | 0 (0.0%) |
| Legal Services & Support | 0 (0.0%) | 0 (0.0%) |
| Education Instruction & Library | 0 (0.0%) | 0 (0.0%) |
| Arts, Media & Entertainment | 0 (0.0%) | 0 (0.0%) |
| Health Diagnosing & Treating | 0 (0.0%) | 1 (100.0%) |
| Health Technologists | 0 (0.0%) | 0 (0.0%) |
| Total (Category) | 8 (66.7%) | 4 (33.3%) |
| Total (Overall) | 120 (50.6%) | 117 (49.4%) |
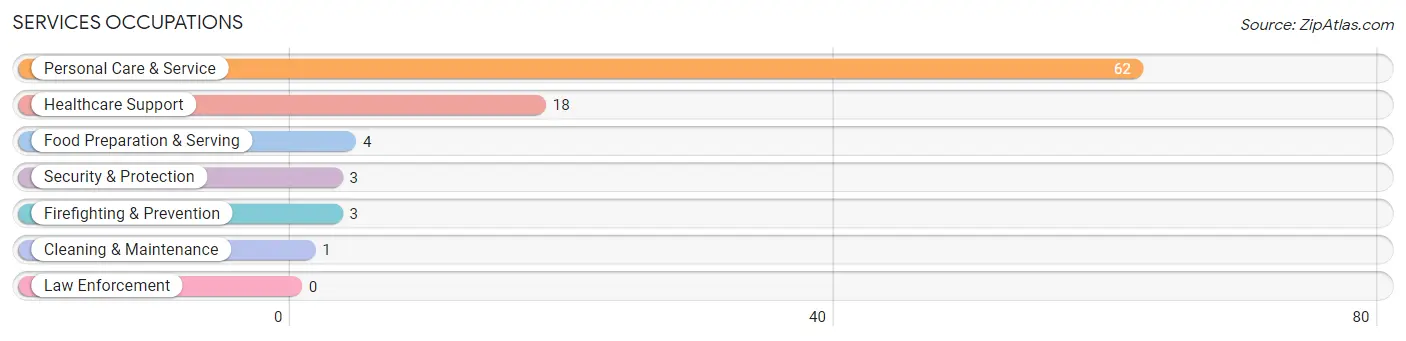
Services Occupations
The most common Services occupations in Oak City are Personal Care & Service (62 | 26.2%), Healthcare Support (18 | 7.6%), Food Preparation & Serving (4 | 1.7%), Security & Protection (3 | 1.3%), and Firefighting & Prevention (3 | 1.3%).
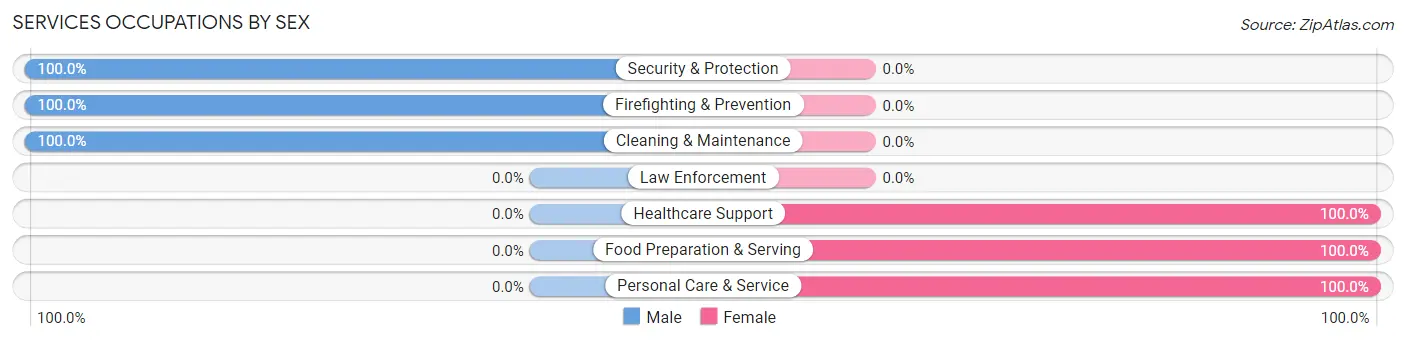
Services Occupations by Sex
Within the Services occupations in Oak City, the most male-oriented occupations are Security & Protection (100.0%), Firefighting & Prevention (100.0%), and Cleaning & Maintenance (100.0%), while the most female-oriented occupations are Healthcare Support (100.0%), Food Preparation & Serving (100.0%), and Personal Care & Service (100.0%).
| Occupation | Male | Female |
| Healthcare Support | 0 (0.0%) | 18 (100.0%) |
| Security & Protection | 3 (100.0%) | 0 (0.0%) |
| Firefighting & Prevention | 3 (100.0%) | 0 (0.0%) |
| Law Enforcement | 0 (0.0%) | 0 (0.0%) |
| Food Preparation & Serving | 0 (0.0%) | 4 (100.0%) |
| Cleaning & Maintenance | 1 (100.0%) | 0 (0.0%) |
| Personal Care & Service | 0 (0.0%) | 62 (100.0%) |
| Total (Category) | 4 (4.5%) | 84 (95.5%) |
| Total (Overall) | 120 (50.6%) | 117 (49.4%) |
Sales and Office Occupations
The most common Sales and Office occupations in Oak City are , and Office & Administration (17 | 7.2%).
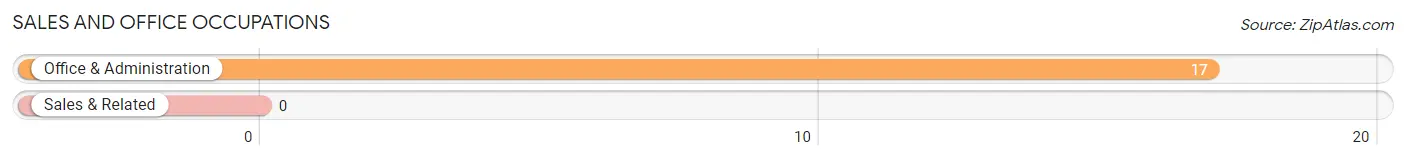
Sales and Office Occupations by Sex
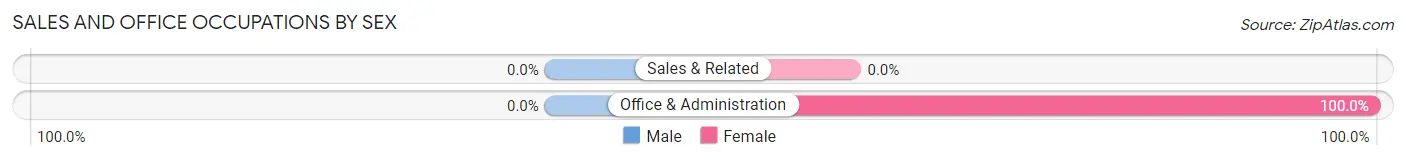
| Occupation | Male | Female |
| Sales & Related | 0 (0.0%) | 0 (0.0%) |
| Office & Administration | 0 (0.0%) | 17 (100.0%) |
| Total (Category) | 0 (0.0%) | 17 (100.0%) |
| Total (Overall) | 120 (50.6%) | 117 (49.4%) |
Natural Resources, Construction and Maintenance Occupations
The most common Natural Resources, Construction and Maintenance occupations in Oak City are Installation, Maintenance & Repair (37 | 15.6%), and Farming, Fishing & Forestry (2 | 0.8%).
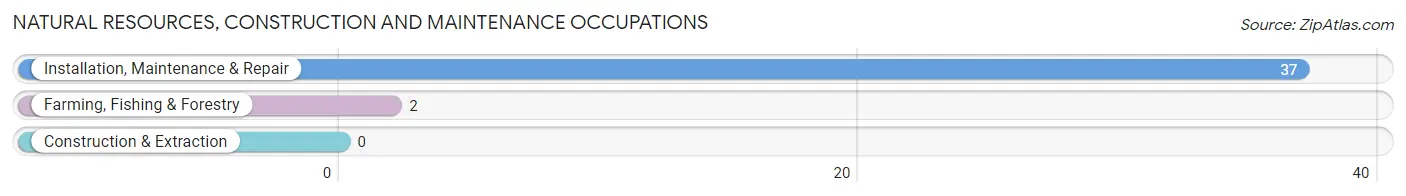
Natural Resources, Construction and Maintenance Occupations by Sex
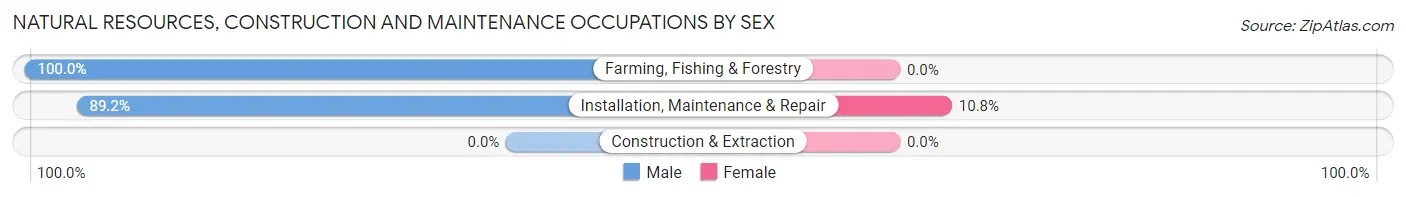
| Occupation | Male | Female |
| Farming, Fishing & Forestry | 2 (100.0%) | 0 (0.0%) |
| Construction & Extraction | 0 (0.0%) | 0 (0.0%) |
| Installation, Maintenance & Repair | 33 (89.2%) | 4 (10.8%) |
| Total (Category) | 35 (89.7%) | 4 (10.3%) |
| Total (Overall) | 120 (50.6%) | 117 (49.4%) |
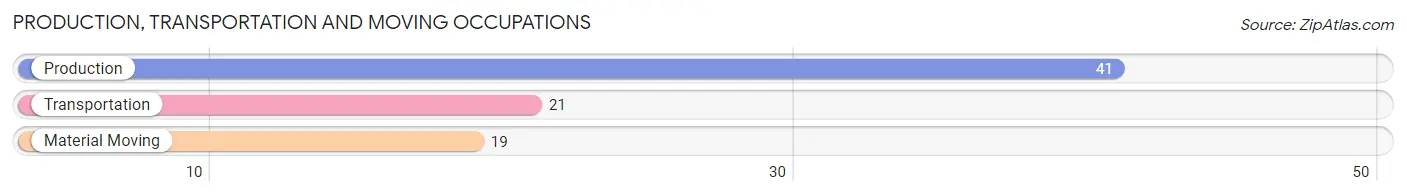
Production, Transportation and Moving Occupations
The most common Production, Transportation and Moving occupations in Oak City are Production (41 | 17.3%), Transportation (21 | 8.9%), and Material Moving (19 | 8.0%).
Production, Transportation and Moving Occupations by Sex
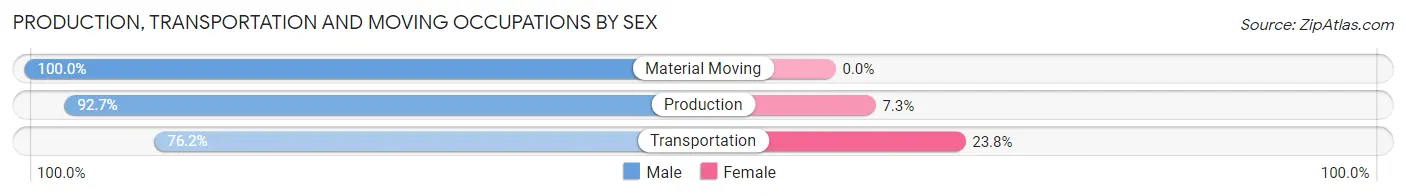
| Occupation | Male | Female |
| Production | 38 (92.7%) | 3 (7.3%) |
| Transportation | 16 (76.2%) | 5 (23.8%) |
| Material Moving | 19 (100.0%) | 0 (0.0%) |
| Total (Category) | 73 (90.1%) | 8 (9.9%) |
| Total (Overall) | 120 (50.6%) | 117 (49.4%) |
Employment Industries by Sex in Oak City
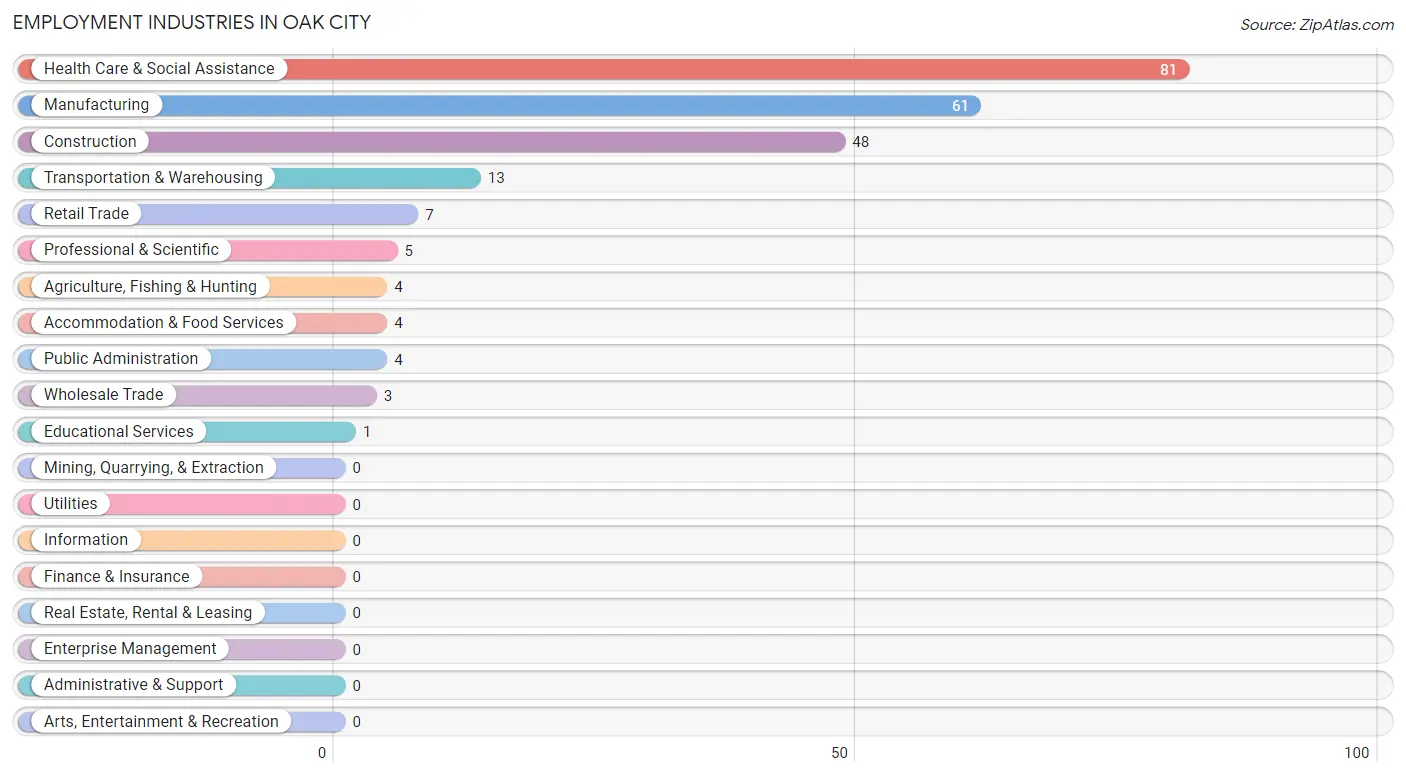
Employment Industries in Oak City
The major employment industries in Oak City include Health Care & Social Assistance (81 | 34.2%), Manufacturing (61 | 25.7%), Construction (48 | 20.3%), Transportation & Warehousing (13 | 5.5%), and Retail Trade (7 | 2.9%).
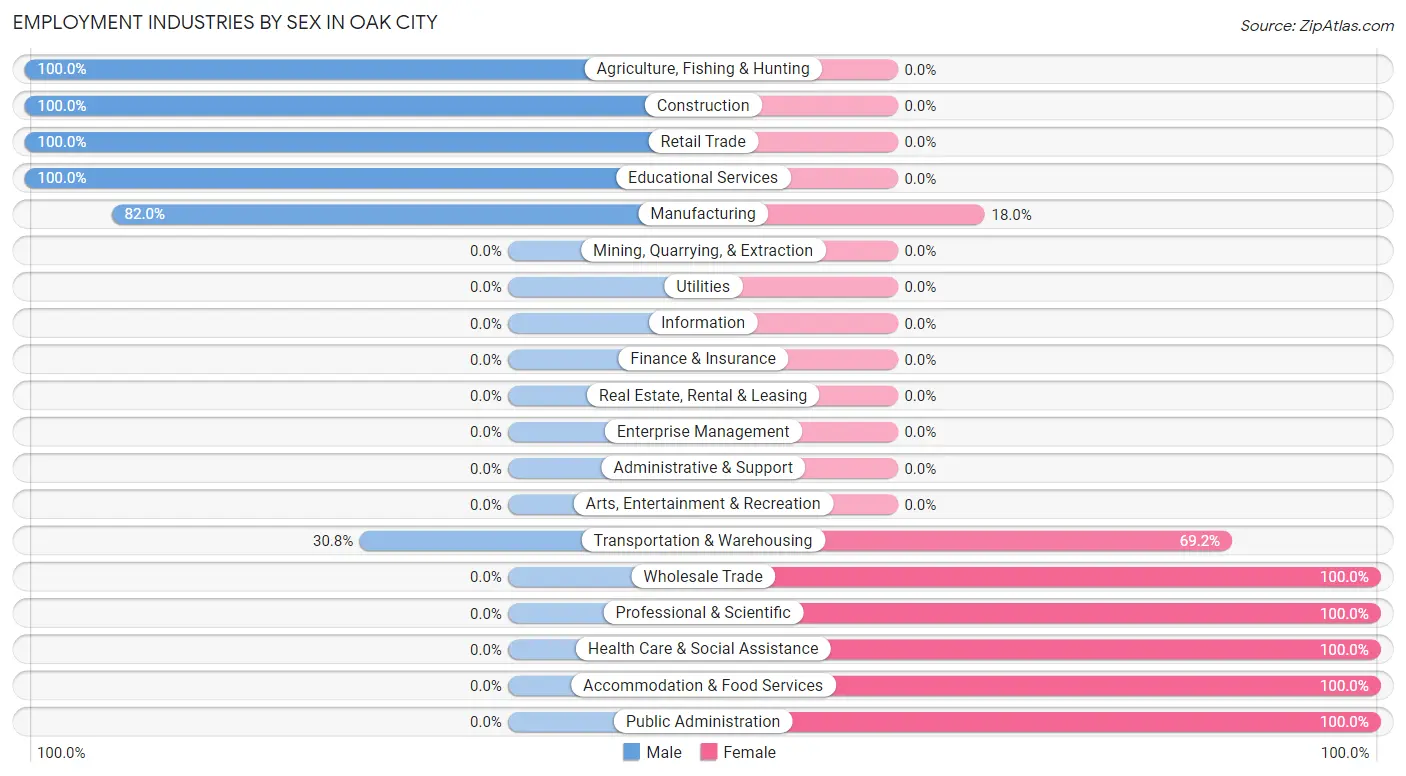
Employment Industries by Sex in Oak City
The Oak City industries that see more men than women are Agriculture, Fishing & Hunting (100.0%), Construction (100.0%), and Retail Trade (100.0%), whereas the industries that tend to have a higher number of women are Wholesale Trade (100.0%), Professional & Scientific (100.0%), and Health Care & Social Assistance (100.0%).
| Industry | Male | Female |
| Agriculture, Fishing & Hunting | 4 (100.0%) | 0 (0.0%) |
| Mining, Quarrying, & Extraction | 0 (0.0%) | 0 (0.0%) |
| Construction | 48 (100.0%) | 0 (0.0%) |
| Manufacturing | 50 (82.0%) | 11 (18.0%) |
| Wholesale Trade | 0 (0.0%) | 3 (100.0%) |
| Retail Trade | 7 (100.0%) | 0 (0.0%) |
| Transportation & Warehousing | 4 (30.8%) | 9 (69.2%) |
| Utilities | 0 (0.0%) | 0 (0.0%) |
| Information | 0 (0.0%) | 0 (0.0%) |
| Finance & Insurance | 0 (0.0%) | 0 (0.0%) |
| Real Estate, Rental & Leasing | 0 (0.0%) | 0 (0.0%) |
| Professional & Scientific | 0 (0.0%) | 5 (100.0%) |
| Enterprise Management | 0 (0.0%) | 0 (0.0%) |
| Administrative & Support | 0 (0.0%) | 0 (0.0%) |
| Educational Services | 1 (100.0%) | 0 (0.0%) |
| Health Care & Social Assistance | 0 (0.0%) | 81 (100.0%) |
| Arts, Entertainment & Recreation | 0 (0.0%) | 0 (0.0%) |
| Accommodation & Food Services | 0 (0.0%) | 4 (100.0%) |
| Public Administration | 0 (0.0%) | 4 (100.0%) |
| Total | 120 (50.6%) | 117 (49.4%) |
Education in Oak City
School Enrollment in Oak City
The most common levels of schooling among the 32 students in Oak City are college / undergraduate (11 | 34.4%), elementary school (10 | 31.2%), and kindergarten (4 | 12.5%).
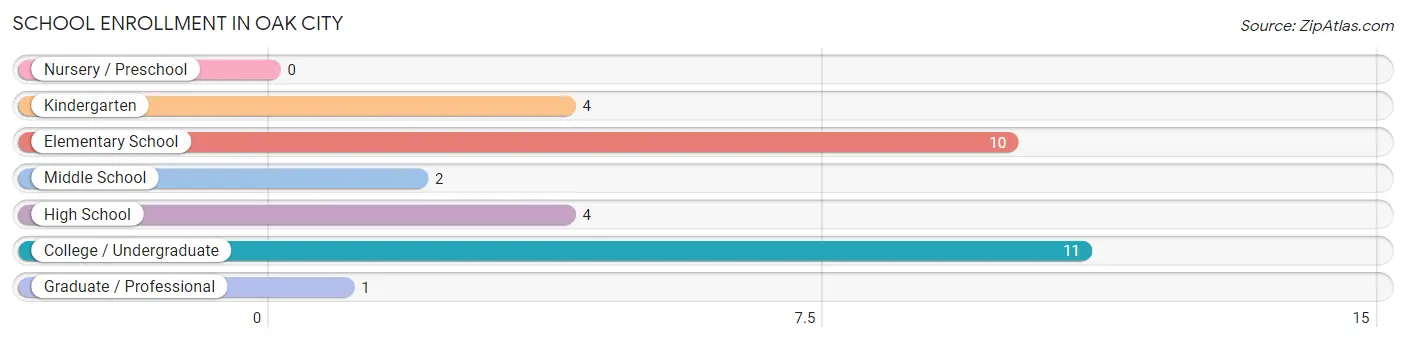
| School Level | # Students | % Students |
| Nursery / Preschool | 0 | 0.0% |
| Kindergarten | 4 | 12.5% |
| Elementary School | 10 | 31.2% |
| Middle School | 2 | 6.2% |
| High School | 4 | 12.5% |
| College / Undergraduate | 11 | 34.4% |
| Graduate / Professional | 1 | 3.1% |
| Total | 32 | 100.0% |
School Enrollment by Age by Funding Source in Oak City
Out of a total of 32 students who are enrolled in schools in Oak City, 3 (9.4%) attend a private institution, while the remaining 29 (90.6%) are enrolled in public schools. The age group of 10 to 14 year olds has the highest likelihood of being enrolled in private schools, with 2 (100.0% in the age bracket) enrolled. Conversely, the age group of 5 to 9 year old has the lowest likelihood of being enrolled in a private school, with 14 (100.0% in the age bracket) attending a public institution.
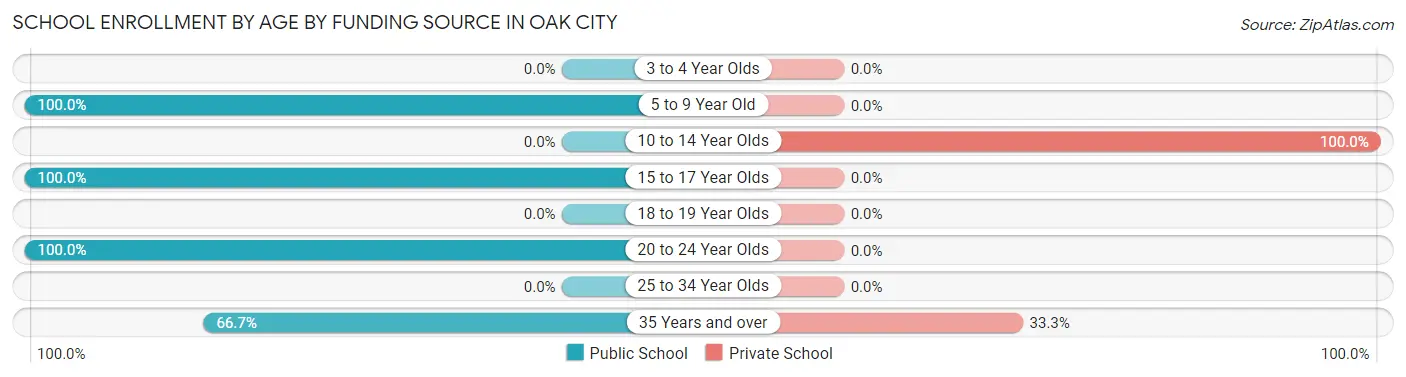
| Age Bracket | Public School | Private School |
| 3 to 4 Year Olds | 0 (0.0%) | 0 (0.0%) |
| 5 to 9 Year Old | 14 (100.0%) | 0 (0.0%) |
| 10 to 14 Year Olds | 0 (0.0%) | 2 (100.0%) |
| 15 to 17 Year Olds | 4 (100.0%) | 0 (0.0%) |
| 18 to 19 Year Olds | 0 (0.0%) | 0 (0.0%) |
| 20 to 24 Year Olds | 9 (100.0%) | 0 (0.0%) |
| 25 to 34 Year Olds | 0 (0.0%) | 0 (0.0%) |
| 35 Years and over | 2 (66.7%) | 1 (33.3%) |
| Total | 29 (90.6%) | 3 (9.4%) |
Educational Attainment by Field of Study in Oak City
Social sciences (8 | 28.6%), science & technology (6 | 21.4%), literature & languages (5 | 17.9%), liberal arts & history (3 | 10.7%), and business (2 | 7.1%) are the most common fields of study among 28 individuals in Oak City who have obtained a bachelor's degree or higher.
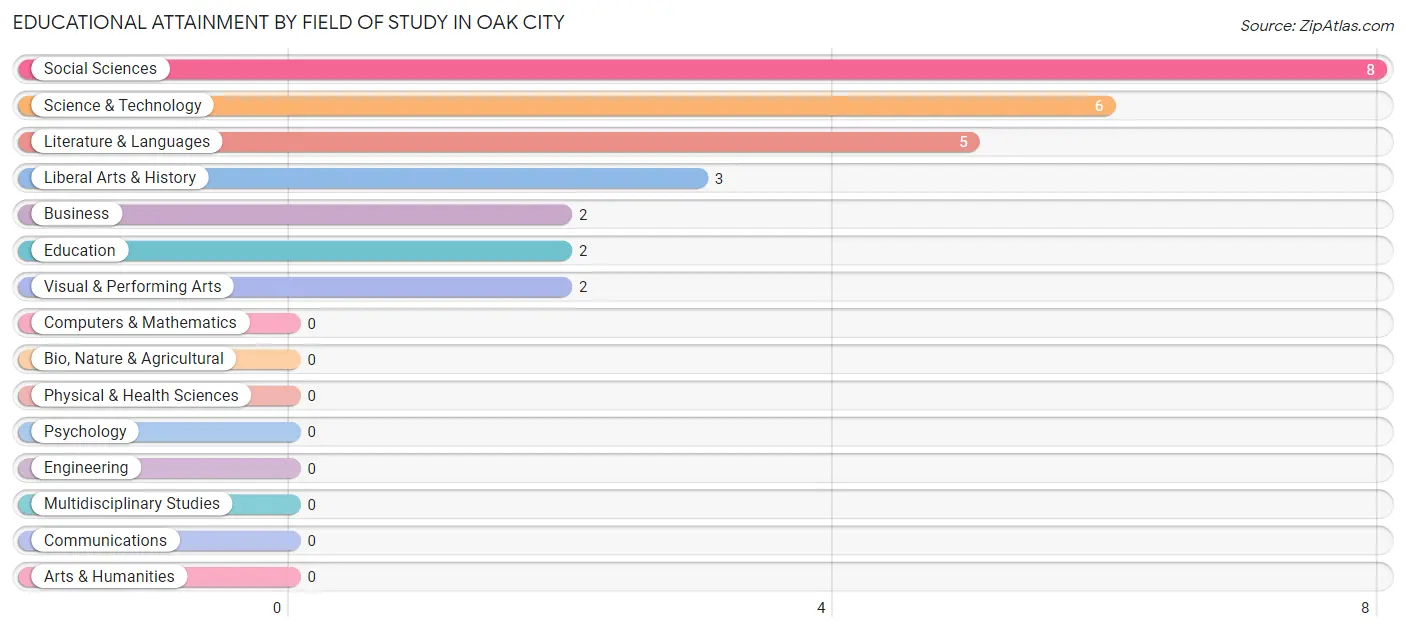
| Field of Study | # Graduates | % Graduates |
| Computers & Mathematics | 0 | 0.0% |
| Bio, Nature & Agricultural | 0 | 0.0% |
| Physical & Health Sciences | 0 | 0.0% |
| Psychology | 0 | 0.0% |
| Social Sciences | 8 | 28.6% |
| Engineering | 0 | 0.0% |
| Multidisciplinary Studies | 0 | 0.0% |
| Science & Technology | 6 | 21.4% |
| Business | 2 | 7.1% |
| Education | 2 | 7.1% |
| Literature & Languages | 5 | 17.9% |
| Liberal Arts & History | 3 | 10.7% |
| Visual & Performing Arts | 2 | 7.1% |
| Communications | 0 | 0.0% |
| Arts & Humanities | 0 | 0.0% |
| Total | 28 | 100.0% |
Transportation & Commute in Oak City
Vehicle Availability by Sex in Oak City
The most prevalent vehicle ownership categories in Oak City are males with 2 vehicles (76, accounting for 63.3%) and females with 2 vehicles (85, making up 66.7%).
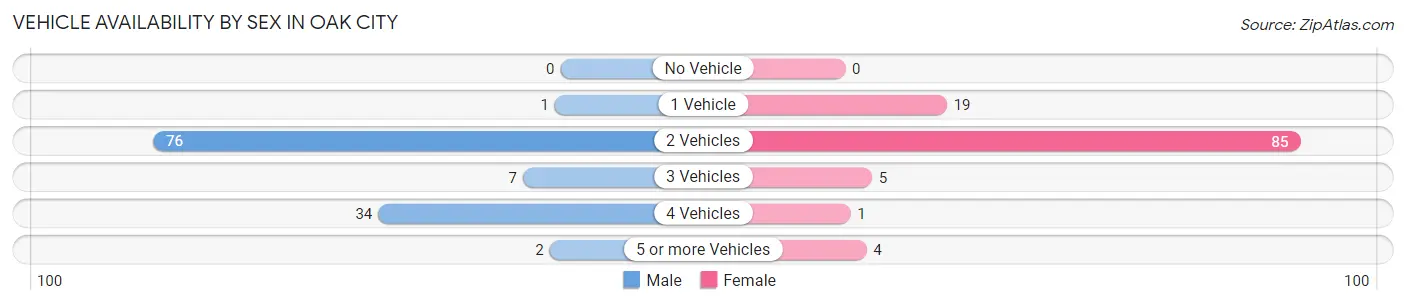
| Vehicles Available | Male | Female |
| No Vehicle | 0 (0.0%) | 0 (0.0%) |
| 1 Vehicle | 1 (0.8%) | 19 (16.7%) |
| 2 Vehicles | 76 (63.3%) | 85 (74.6%) |
| 3 Vehicles | 7 (5.8%) | 5 (4.4%) |
| 4 Vehicles | 34 (28.3%) | 1 (0.9%) |
| 5 or more Vehicles | 2 (1.7%) | 4 (3.5%) |
| Total | 120 (100.0%) | 114 (100.0%) |
Commute Time in Oak City
The most frequently occuring commute durations in Oak City are 40 to 44 minutes (73 commuters, 34.8%), 30 to 34 minutes (47 commuters, 22.4%), and 35 to 39 minutes (33 commuters, 15.7%).
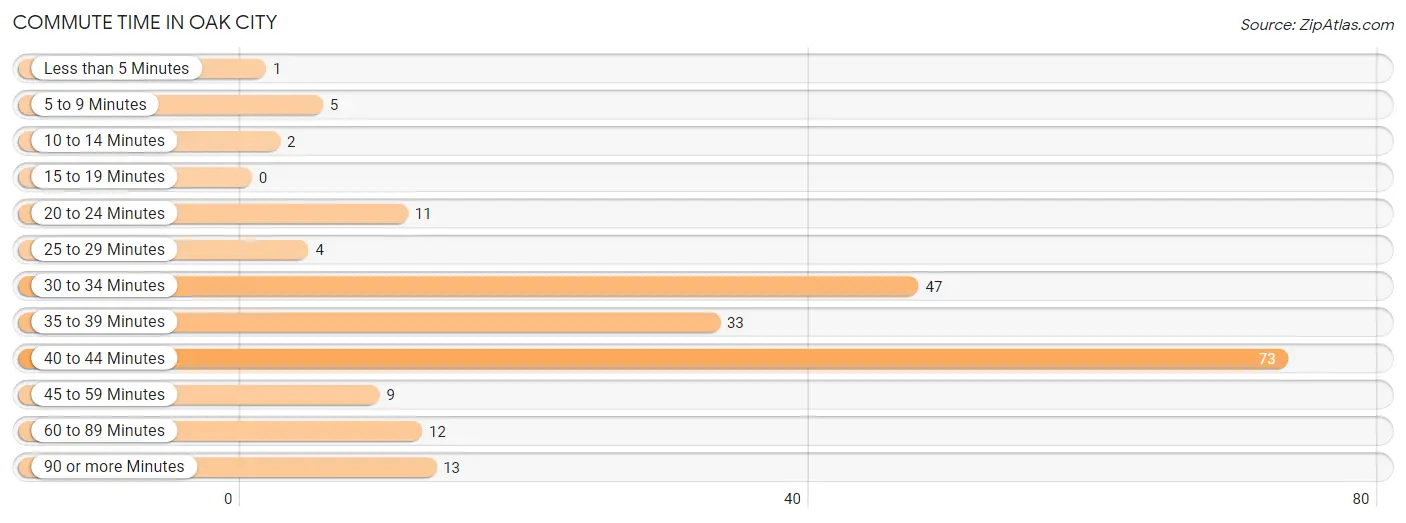
| Commute Time | # Commuters | % Commuters |
| Less than 5 Minutes | 1 | 0.5% |
| 5 to 9 Minutes | 5 | 2.4% |
| 10 to 14 Minutes | 2 | 0.9% |
| 15 to 19 Minutes | 0 | 0.0% |
| 20 to 24 Minutes | 11 | 5.2% |
| 25 to 29 Minutes | 4 | 1.9% |
| 30 to 34 Minutes | 47 | 22.4% |
| 35 to 39 Minutes | 33 | 15.7% |
| 40 to 44 Minutes | 73 | 34.8% |
| 45 to 59 Minutes | 9 | 4.3% |
| 60 to 89 Minutes | 12 | 5.7% |
| 90 or more Minutes | 13 | 6.2% |
Commute Time by Sex in Oak City
The most common commute times in Oak City are 35 to 39 minutes (33 commuters, 30.3%) for males and 40 to 44 minutes (62 commuters, 61.4%) for females.
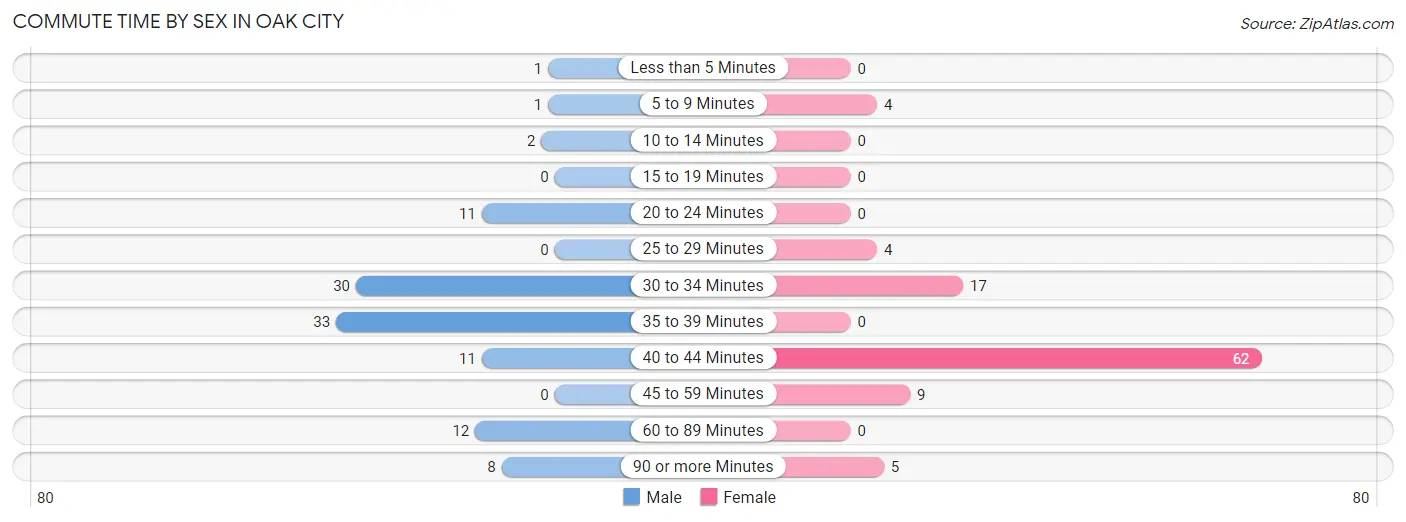
| Commute Time | Male | Female |
| Less than 5 Minutes | 1 (0.9%) | 0 (0.0%) |
| 5 to 9 Minutes | 1 (0.9%) | 4 (4.0%) |
| 10 to 14 Minutes | 2 (1.8%) | 0 (0.0%) |
| 15 to 19 Minutes | 0 (0.0%) | 0 (0.0%) |
| 20 to 24 Minutes | 11 (10.1%) | 0 (0.0%) |
| 25 to 29 Minutes | 0 (0.0%) | 4 (4.0%) |
| 30 to 34 Minutes | 30 (27.5%) | 17 (16.8%) |
| 35 to 39 Minutes | 33 (30.3%) | 0 (0.0%) |
| 40 to 44 Minutes | 11 (10.1%) | 62 (61.4%) |
| 45 to 59 Minutes | 0 (0.0%) | 9 (8.9%) |
| 60 to 89 Minutes | 12 (11.0%) | 0 (0.0%) |
| 90 or more Minutes | 8 (7.3%) | 5 (5.0%) |
Time of Departure to Work by Sex in Oak City
The most frequent times of departure to work in Oak City are 4:00 PM to 11:59 PM (34, 31.2%) for males and 7:00 AM to 7:29 AM (63, 62.4%) for females.
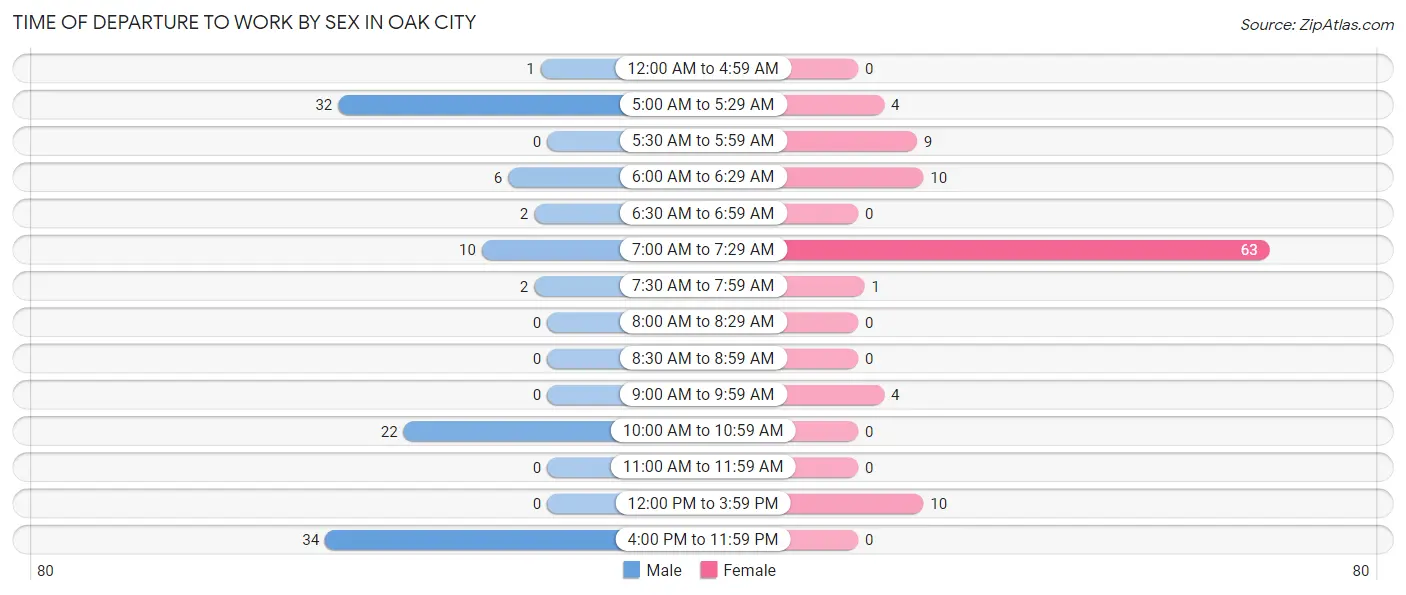
| Time of Departure | Male | Female |
| 12:00 AM to 4:59 AM | 1 (0.9%) | 0 (0.0%) |
| 5:00 AM to 5:29 AM | 32 (29.4%) | 4 (4.0%) |
| 5:30 AM to 5:59 AM | 0 (0.0%) | 9 (8.9%) |
| 6:00 AM to 6:29 AM | 6 (5.5%) | 10 (9.9%) |
| 6:30 AM to 6:59 AM | 2 (1.8%) | 0 (0.0%) |
| 7:00 AM to 7:29 AM | 10 (9.2%) | 63 (62.4%) |
| 7:30 AM to 7:59 AM | 2 (1.8%) | 1 (1.0%) |
| 8:00 AM to 8:29 AM | 0 (0.0%) | 0 (0.0%) |
| 8:30 AM to 8:59 AM | 0 (0.0%) | 0 (0.0%) |
| 9:00 AM to 9:59 AM | 0 (0.0%) | 4 (4.0%) |
| 10:00 AM to 10:59 AM | 22 (20.2%) | 0 (0.0%) |
| 11:00 AM to 11:59 AM | 0 (0.0%) | 0 (0.0%) |
| 12:00 PM to 3:59 PM | 0 (0.0%) | 10 (9.9%) |
| 4:00 PM to 11:59 PM | 34 (31.2%) | 0 (0.0%) |
| Total | 109 (100.0%) | 101 (100.0%) |
Housing Occupancy in Oak City
Occupancy by Ownership in Oak City
Of the total 188 dwellings in Oak City, owner-occupied units account for 68 (36.2%), while renter-occupied units make up 120 (63.8%).
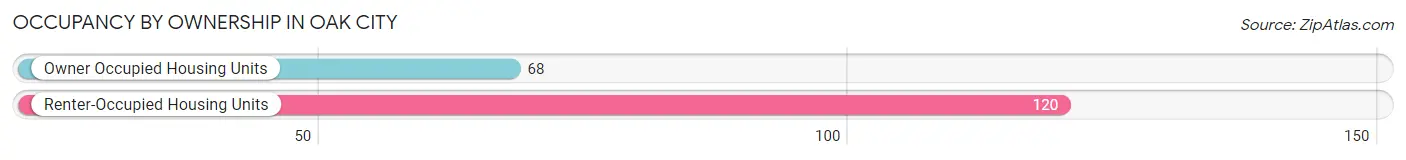
| Occupancy | # Housing Units | % Housing Units |
| Owner Occupied Housing Units | 68 | 36.2% |
| Renter-Occupied Housing Units | 120 | 63.8% |
| Total Occupied Housing Units | 188 | 100.0% |
Occupancy by Household Size in Oak City
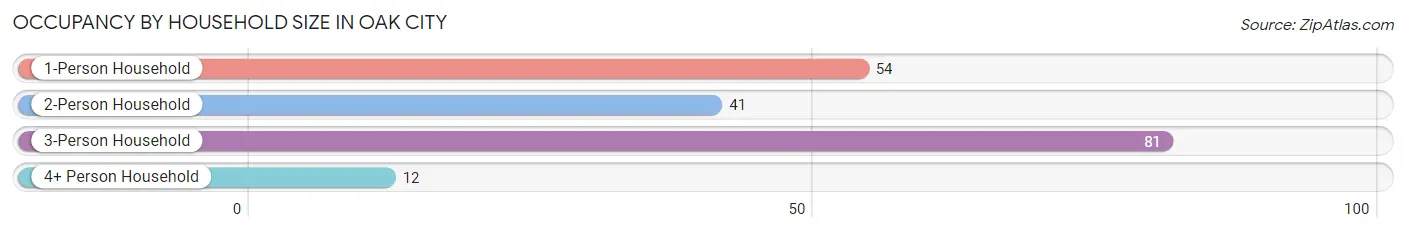
| Household Size | # Housing Units | % Housing Units |
| 1-Person Household | 54 | 28.7% |
| 2-Person Household | 41 | 21.8% |
| 3-Person Household | 81 | 43.1% |
| 4+ Person Household | 12 | 6.4% |
| Total Housing Units | 188 | 100.0% |
Occupancy by Ownership by Household Size in Oak City
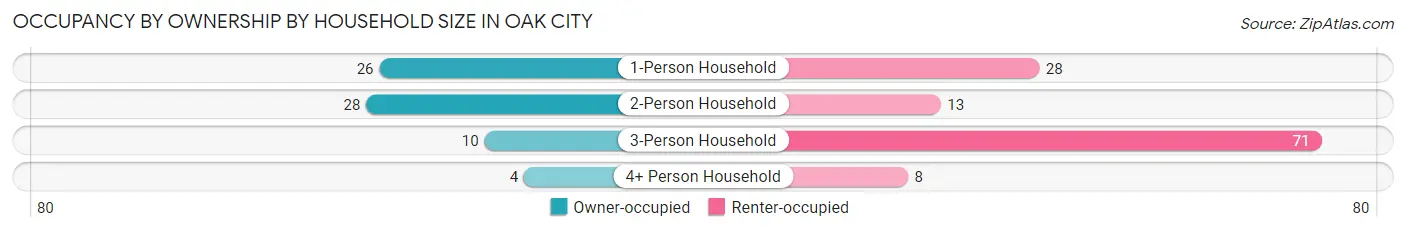
| Household Size | Owner-occupied | Renter-occupied |
| 1-Person Household | 26 (48.1%) | 28 (51.8%) |
| 2-Person Household | 28 (68.3%) | 13 (31.7%) |
| 3-Person Household | 10 (12.3%) | 71 (87.6%) |
| 4+ Person Household | 4 (33.3%) | 8 (66.7%) |
| Total Housing Units | 68 (36.2%) | 120 (63.8%) |
Occupancy by Educational Attainment in Oak City
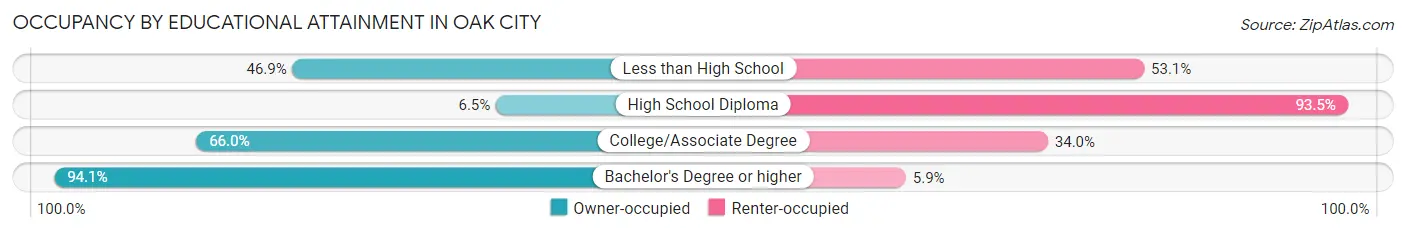
| Household Size | Owner-occupied | Renter-occupied |
| Less than High School | 15 (46.9%) | 17 (53.1%) |
| High School Diploma | 6 (6.5%) | 86 (93.5%) |
| College/Associate Degree | 31 (66.0%) | 16 (34.0%) |
| Bachelor's Degree or higher | 16 (94.1%) | 1 (5.9%) |
Occupancy by Age of Householder in Oak City
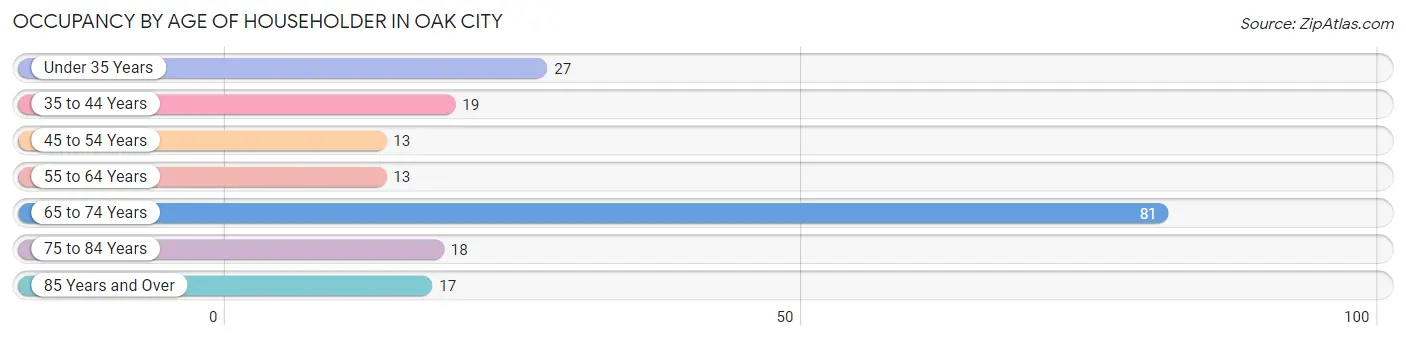
| Age Bracket | # Households | % Households |
| Under 35 Years | 27 | 14.4% |
| 35 to 44 Years | 19 | 10.1% |
| 45 to 54 Years | 13 | 6.9% |
| 55 to 64 Years | 13 | 6.9% |
| 65 to 74 Years | 81 | 43.1% |
| 75 to 84 Years | 18 | 9.6% |
| 85 Years and Over | 17 | 9.0% |
| Total | 188 | 100.0% |
Housing Finances in Oak City
Median Income by Occupancy in Oak City
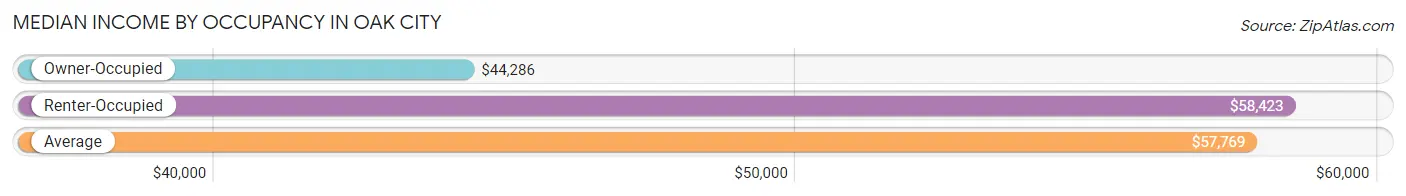
| Occupancy Type | # Households | Median Income |
| Owner-Occupied | 68 (36.2%) | $44,286 |
| Renter-Occupied | 120 (63.8%) | $58,423 |
| Average | 188 (100.0%) | $57,769 |
Occupancy by Householder Income Bracket in Oak City
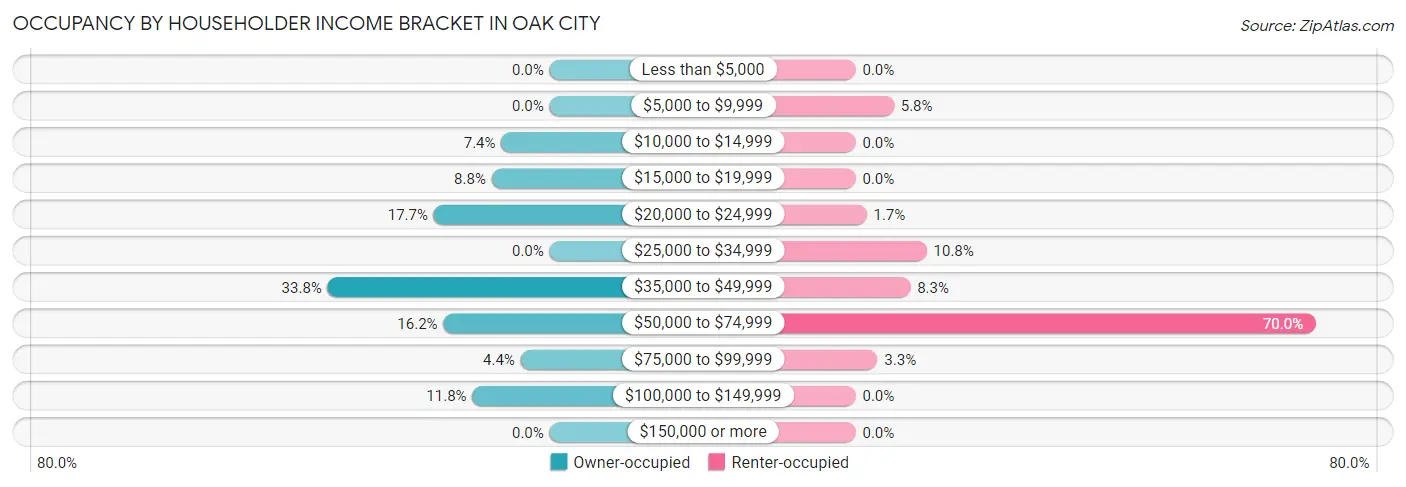
| Income Bracket | Owner-occupied | Renter-occupied |
| Less than $5,000 | 0 (0.0%) | 0 (0.0%) |
| $5,000 to $9,999 | 0 (0.0%) | 7 (5.8%) |
| $10,000 to $14,999 | 5 (7.3%) | 0 (0.0%) |
| $15,000 to $19,999 | 6 (8.8%) | 0 (0.0%) |
| $20,000 to $24,999 | 12 (17.6%) | 2 (1.7%) |
| $25,000 to $34,999 | 0 (0.0%) | 13 (10.8%) |
| $35,000 to $49,999 | 23 (33.8%) | 10 (8.3%) |
| $50,000 to $74,999 | 11 (16.2%) | 84 (70.0%) |
| $75,000 to $99,999 | 3 (4.4%) | 4 (3.3%) |
| $100,000 to $149,999 | 8 (11.8%) | 0 (0.0%) |
| $150,000 or more | 0 (0.0%) | 0 (0.0%) |
| Total | 68 (100.0%) | 120 (100.0%) |
Monthly Housing Cost Tiers in Oak City
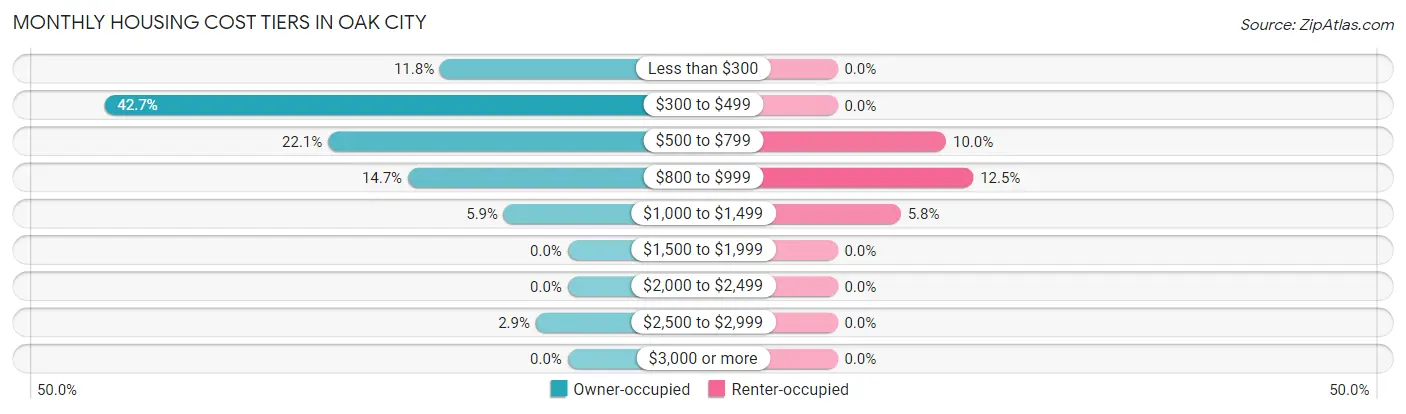
| Monthly Cost | Owner-occupied | Renter-occupied |
| Less than $300 | 8 (11.8%) | 0 (0.0%) |
| $300 to $499 | 29 (42.6%) | 0 (0.0%) |
| $500 to $799 | 15 (22.1%) | 12 (10.0%) |
| $800 to $999 | 10 (14.7%) | 15 (12.5%) |
| $1,000 to $1,499 | 4 (5.9%) | 7 (5.8%) |
| $1,500 to $1,999 | 0 (0.0%) | 0 (0.0%) |
| $2,000 to $2,499 | 0 (0.0%) | 0 (0.0%) |
| $2,500 to $2,999 | 2 (2.9%) | 0 (0.0%) |
| $3,000 or more | 0 (0.0%) | 0 (0.0%) |
| Total | 68 (100.0%) | 120 (100.0%) |
Physical Housing Characteristics in Oak City
Housing Structures in Oak City
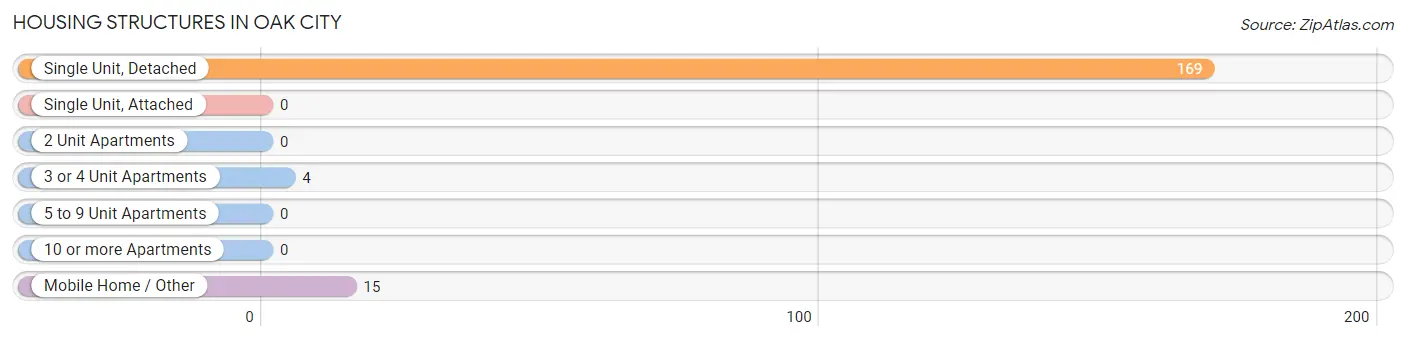
| Structure Type | # Housing Units | % Housing Units |
| Single Unit, Detached | 169 | 89.9% |
| Single Unit, Attached | 0 | 0.0% |
| 2 Unit Apartments | 0 | 0.0% |
| 3 or 4 Unit Apartments | 4 | 2.1% |
| 5 to 9 Unit Apartments | 0 | 0.0% |
| 10 or more Apartments | 0 | 0.0% |
| Mobile Home / Other | 15 | 8.0% |
| Total | 188 | 100.0% |
Housing Structures by Occupancy in Oak City
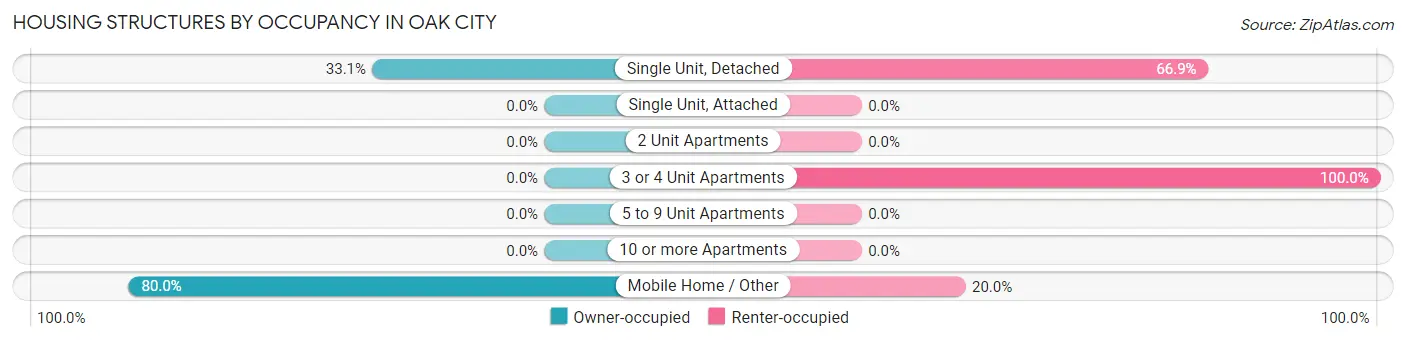
| Structure Type | Owner-occupied | Renter-occupied |
| Single Unit, Detached | 56 (33.1%) | 113 (66.9%) |
| Single Unit, Attached | 0 (0.0%) | 0 (0.0%) |
| 2 Unit Apartments | 0 (0.0%) | 0 (0.0%) |
| 3 or 4 Unit Apartments | 0 (0.0%) | 4 (100.0%) |
| 5 to 9 Unit Apartments | 0 (0.0%) | 0 (0.0%) |
| 10 or more Apartments | 0 (0.0%) | 0 (0.0%) |
| Mobile Home / Other | 12 (80.0%) | 3 (20.0%) |
| Total | 68 (36.2%) | 120 (63.8%) |
Housing Structures by Number of Rooms in Oak City
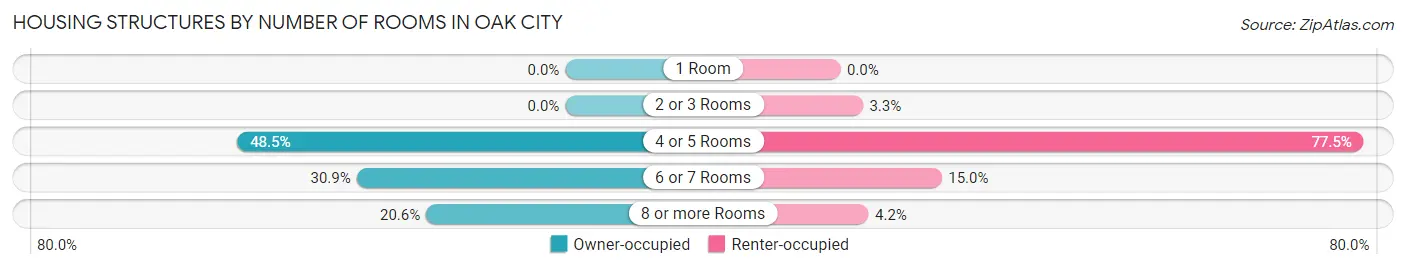
| Number of Rooms | Owner-occupied | Renter-occupied |
| 1 Room | 0 (0.0%) | 0 (0.0%) |
| 2 or 3 Rooms | 0 (0.0%) | 4 (3.3%) |
| 4 or 5 Rooms | 33 (48.5%) | 93 (77.5%) |
| 6 or 7 Rooms | 21 (30.9%) | 18 (15.0%) |
| 8 or more Rooms | 14 (20.6%) | 5 (4.2%) |
| Total | 68 (100.0%) | 120 (100.0%) |
Housing Structure by Heating Type in Oak City
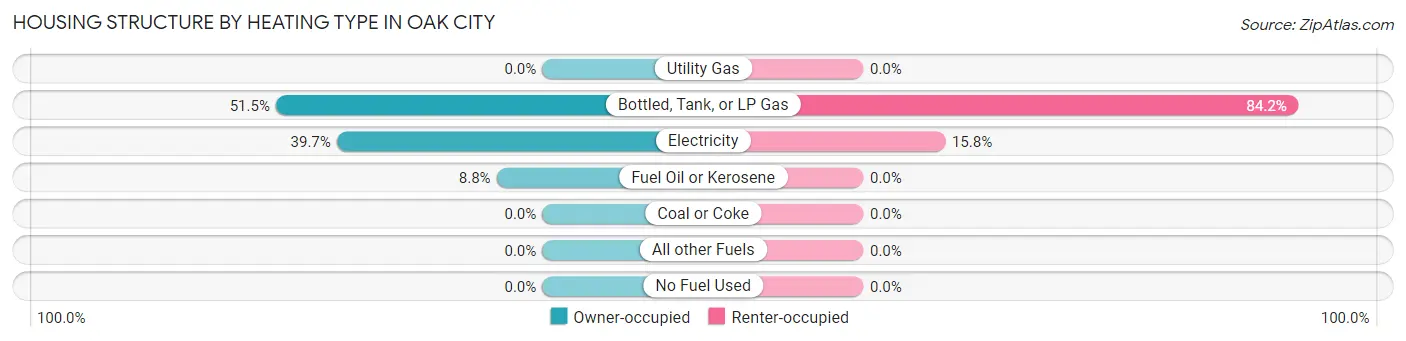
| Heating Type | Owner-occupied | Renter-occupied |
| Utility Gas | 0 (0.0%) | 0 (0.0%) |
| Bottled, Tank, or LP Gas | 35 (51.5%) | 101 (84.2%) |
| Electricity | 27 (39.7%) | 19 (15.8%) |
| Fuel Oil or Kerosene | 6 (8.8%) | 0 (0.0%) |
| Coal or Coke | 0 (0.0%) | 0 (0.0%) |
| All other Fuels | 0 (0.0%) | 0 (0.0%) |
| No Fuel Used | 0 (0.0%) | 0 (0.0%) |
| Total | 68 (100.0%) | 120 (100.0%) |
Household Vehicle Usage in Oak City
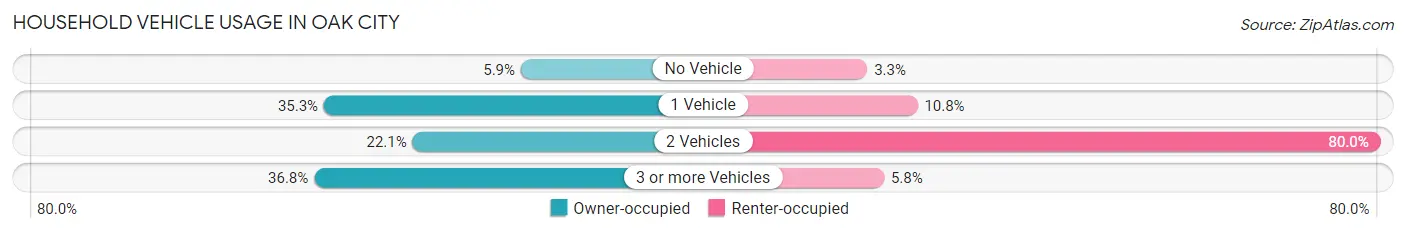
| Vehicles per Household | Owner-occupied | Renter-occupied |
| No Vehicle | 4 (5.9%) | 4 (3.3%) |
| 1 Vehicle | 24 (35.3%) | 13 (10.8%) |
| 2 Vehicles | 15 (22.1%) | 96 (80.0%) |
| 3 or more Vehicles | 25 (36.8%) | 7 (5.8%) |
| Total | 68 (100.0%) | 120 (100.0%) |
Real Estate & Mortgages in Oak City
Real Estate and Mortgage Overview in Oak City
| Characteristic | Without Mortgage | With Mortgage |
| Housing Units | 53 | 15 |
| Median Property Value | $87,700 | $102,500 |
| Median Household Income | $43,125 | $0 |
| Monthly Housing Costs | $445 | $0 |
| Real Estate Taxes | $817 | $0 |
Property Value by Mortgage Status in Oak City
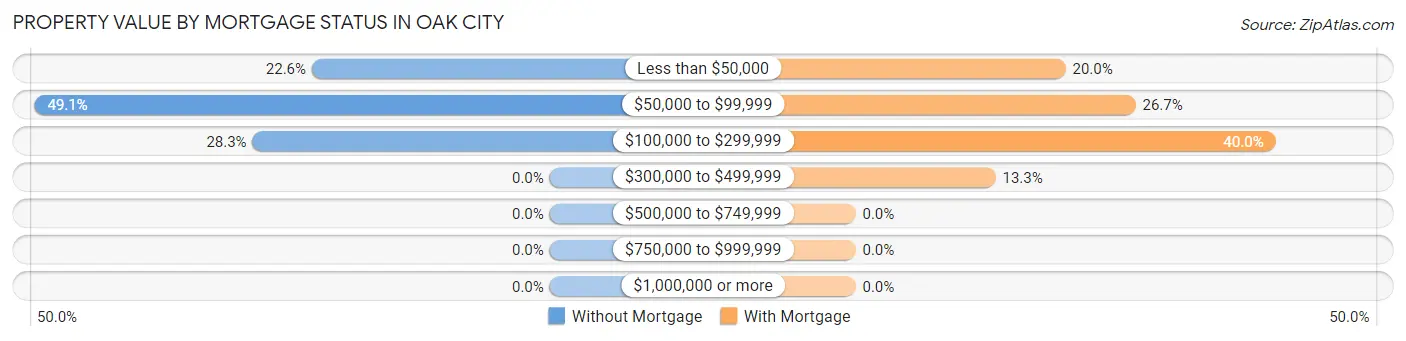
| Property Value | Without Mortgage | With Mortgage |
| Less than $50,000 | 12 (22.6%) | 3 (20.0%) |
| $50,000 to $99,999 | 26 (49.1%) | 4 (26.7%) |
| $100,000 to $299,999 | 15 (28.3%) | 6 (40.0%) |
| $300,000 to $499,999 | 0 (0.0%) | 2 (13.3%) |
| $500,000 to $749,999 | 0 (0.0%) | 0 (0.0%) |
| $750,000 to $999,999 | 0 (0.0%) | 0 (0.0%) |
| $1,000,000 or more | 0 (0.0%) | 0 (0.0%) |
| Total | 53 (100.0%) | 15 (100.0%) |
Household Income by Mortgage Status in Oak City
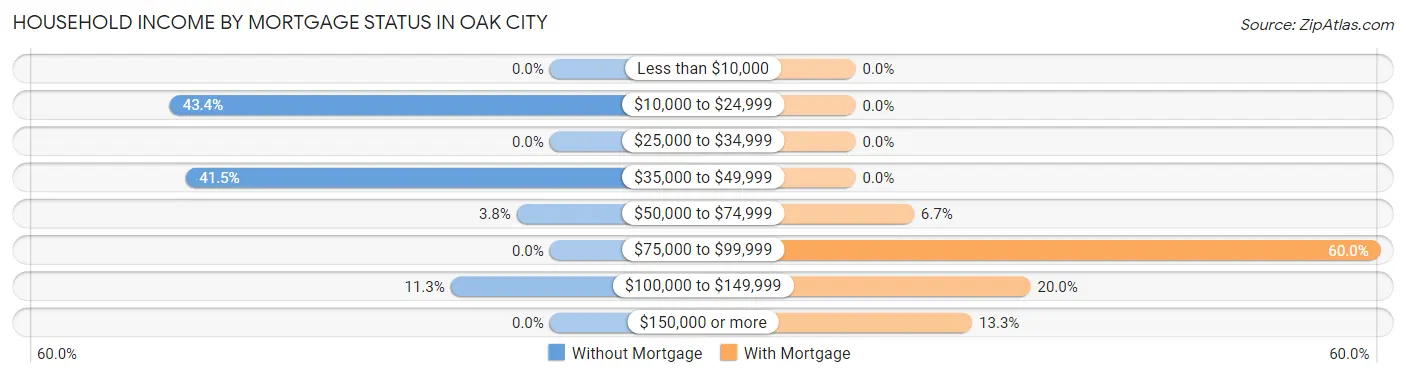
| Household Income | Without Mortgage | With Mortgage |
| Less than $10,000 | 0 (0.0%) | 0 (0.0%) |
| $10,000 to $24,999 | 23 (43.4%) | 0 (0.0%) |
| $25,000 to $34,999 | 0 (0.0%) | 0 (0.0%) |
| $35,000 to $49,999 | 22 (41.5%) | 0 (0.0%) |
| $50,000 to $74,999 | 2 (3.8%) | 1 (6.7%) |
| $75,000 to $99,999 | 0 (0.0%) | 9 (60.0%) |
| $100,000 to $149,999 | 6 (11.3%) | 3 (20.0%) |
| $150,000 or more | 0 (0.0%) | 2 (13.3%) |
| Total | 53 (100.0%) | 15 (100.0%) |
Property Value to Household Income Ratio in Oak City
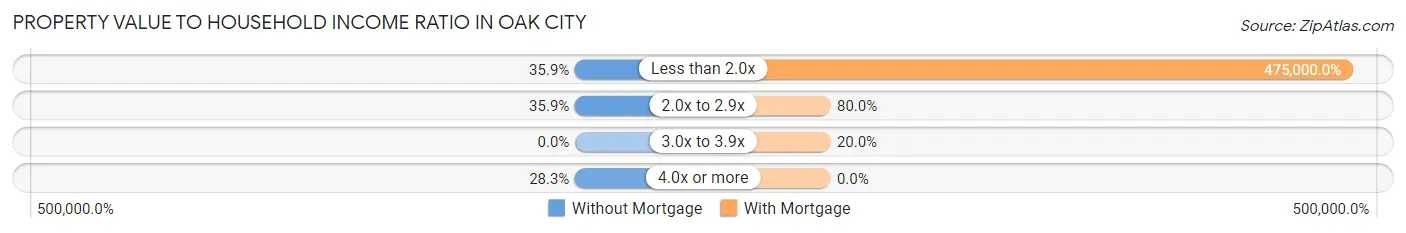
| Value-to-Income Ratio | Without Mortgage | With Mortgage |
| Less than 2.0x | 19 (35.8%) | 71,250 (475,000.0%) |
| 2.0x to 2.9x | 19 (35.8%) | 12 (80.0%) |
| 3.0x to 3.9x | 0 (0.0%) | 3 (20.0%) |
| 4.0x or more | 15 (28.3%) | 0 (0.0%) |
| Total | 53 (100.0%) | 15 (100.0%) |
Real Estate Taxes by Mortgage Status in Oak City
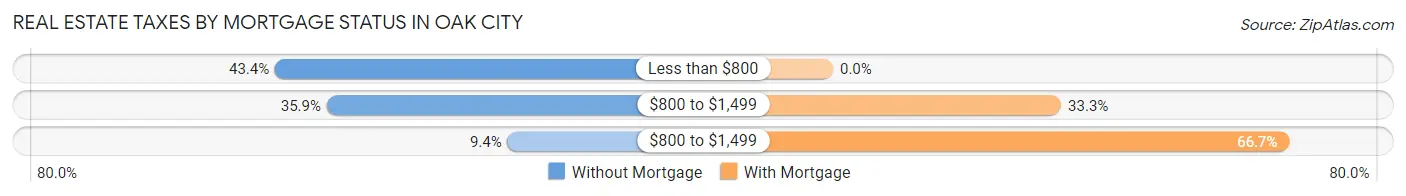
| Property Taxes | Without Mortgage | With Mortgage |
| Less than $800 | 23 (43.4%) | 0 (0.0%) |
| $800 to $1,499 | 19 (35.8%) | 5 (33.3%) |
| $800 to $1,499 | 5 (9.4%) | 10 (66.7%) |
| Total | 53 (100.0%) | 15 (100.0%) |
Health & Disability in Oak City
Health Insurance Coverage by Age in Oak City
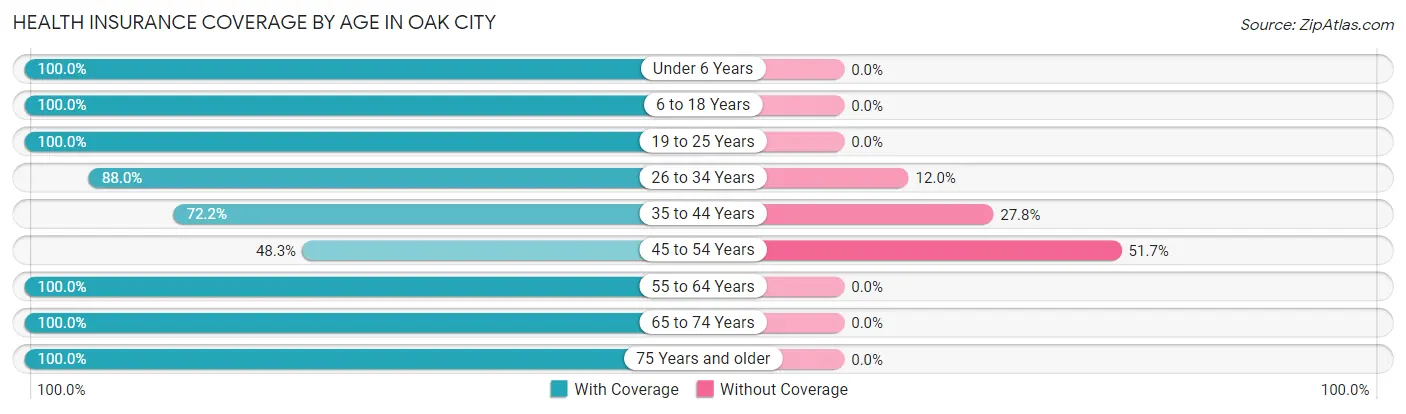
| Age Bracket | With Coverage | Without Coverage |
| Under 6 Years | 29 (100.0%) | 0 (0.0%) |
| 6 to 18 Years | 22 (100.0%) | 0 (0.0%) |
| 19 to 25 Years | 10 (100.0%) | 0 (0.0%) |
| 26 to 34 Years | 66 (88.0%) | 9 (12.0%) |
| 35 to 44 Years | 26 (72.2%) | 10 (27.8%) |
| 45 to 54 Years | 28 (48.3%) | 30 (51.7%) |
| 55 to 64 Years | 59 (100.0%) | 0 (0.0%) |
| 65 to 74 Years | 84 (100.0%) | 0 (0.0%) |
| 75 Years and older | 47 (100.0%) | 0 (0.0%) |
| Total | 371 (88.3%) | 49 (11.7%) |
Health Insurance Coverage by Citizenship Status in Oak City
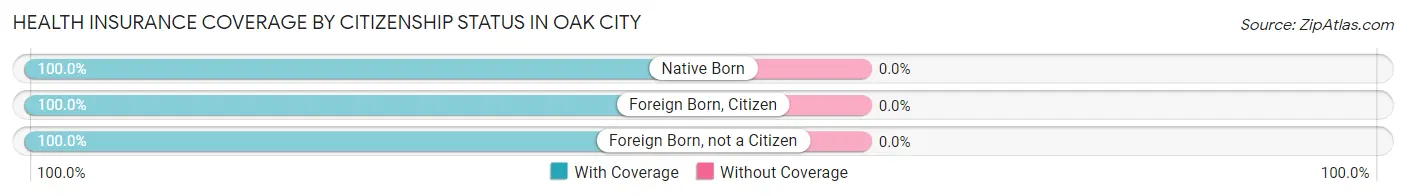
| Citizenship Status | With Coverage | Without Coverage |
| Native Born | 29 (100.0%) | 0 (0.0%) |
| Foreign Born, Citizen | 22 (100.0%) | 0 (0.0%) |
| Foreign Born, not a Citizen | 10 (100.0%) | 0 (0.0%) |
Health Insurance Coverage by Household Income in Oak City
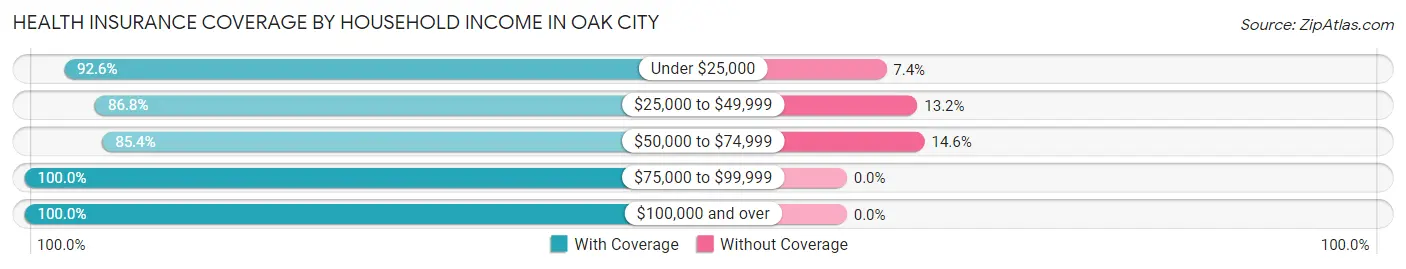
| Household Income | With Coverage | Without Coverage |
| Under $25,000 | 50 (92.6%) | 4 (7.4%) |
| $25,000 to $49,999 | 105 (86.8%) | 16 (13.2%) |
| $50,000 to $74,999 | 170 (85.4%) | 29 (14.6%) |
| $75,000 to $99,999 | 29 (100.0%) | 0 (0.0%) |
| $100,000 and over | 17 (100.0%) | 0 (0.0%) |
Public vs Private Health Insurance Coverage by Age in Oak City
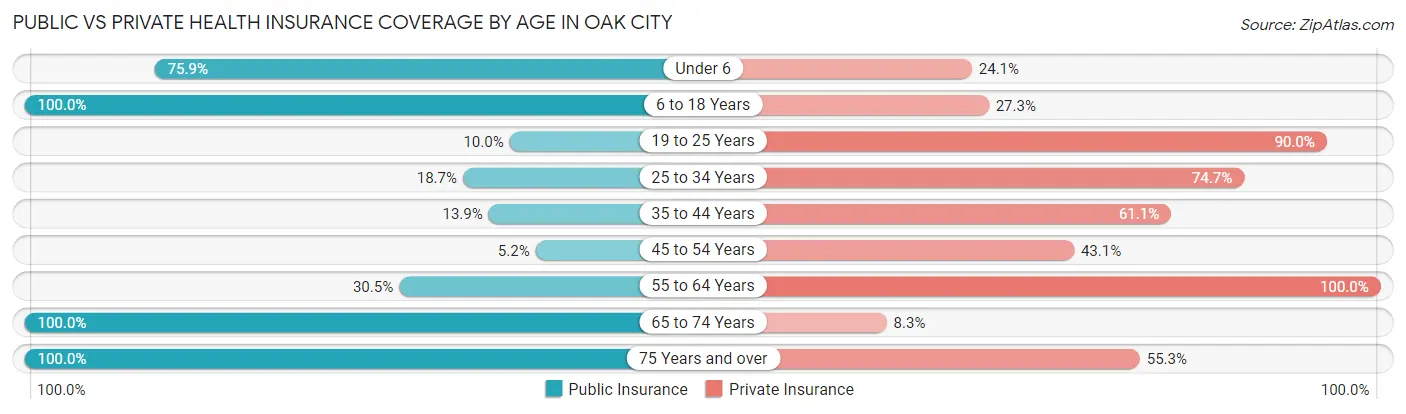
| Age Bracket | Public Insurance | Private Insurance |
| Under 6 | 22 (75.9%) | 7 (24.1%) |
| 6 to 18 Years | 22 (100.0%) | 6 (27.3%) |
| 19 to 25 Years | 1 (10.0%) | 9 (90.0%) |
| 25 to 34 Years | 14 (18.7%) | 56 (74.7%) |
| 35 to 44 Years | 5 (13.9%) | 22 (61.1%) |
| 45 to 54 Years | 3 (5.2%) | 25 (43.1%) |
| 55 to 64 Years | 18 (30.5%) | 59 (100.0%) |
| 65 to 74 Years | 84 (100.0%) | 7 (8.3%) |
| 75 Years and over | 47 (100.0%) | 26 (55.3%) |
| Total | 216 (51.4%) | 217 (51.7%) |
Disability Status by Sex by Age in Oak City
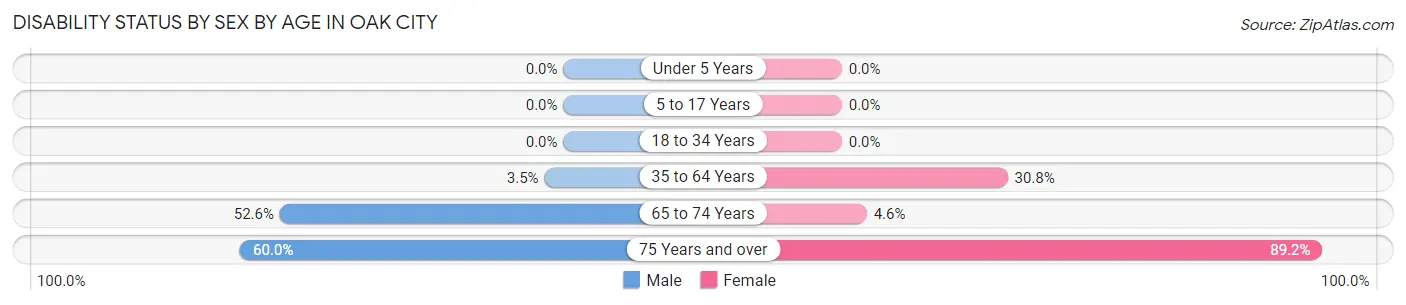
| Age Bracket | Male | Female |
| Under 5 Years | 0 (0.0%) | 0 (0.0%) |
| 5 to 17 Years | 0 (0.0%) | 0 (0.0%) |
| 18 to 34 Years | 0 (0.0%) | 0 (0.0%) |
| 35 to 64 Years | 4 (3.5%) | 12 (30.8%) |
| 65 to 74 Years | 10 (52.6%) | 3 (4.6%) |
| 75 Years and over | 6 (60.0%) | 33 (89.2%) |
Disability Class by Sex by Age in Oak City
Disability Class: Hearing Difficulty
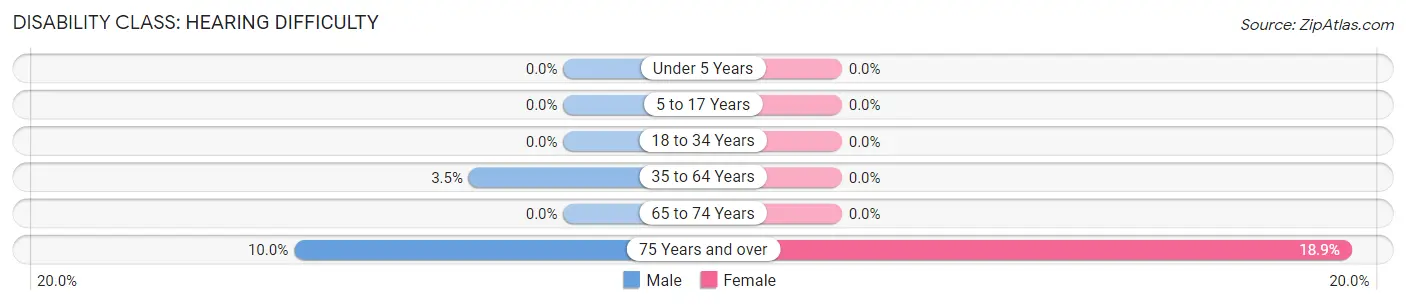
| Age Bracket | Male | Female |
| Under 5 Years | 0 (0.0%) | 0 (0.0%) |
| 5 to 17 Years | 0 (0.0%) | 0 (0.0%) |
| 18 to 34 Years | 0 (0.0%) | 0 (0.0%) |
| 35 to 64 Years | 4 (3.5%) | 0 (0.0%) |
| 65 to 74 Years | 0 (0.0%) | 0 (0.0%) |
| 75 Years and over | 1 (10.0%) | 7 (18.9%) |
Disability Class: Vision Difficulty
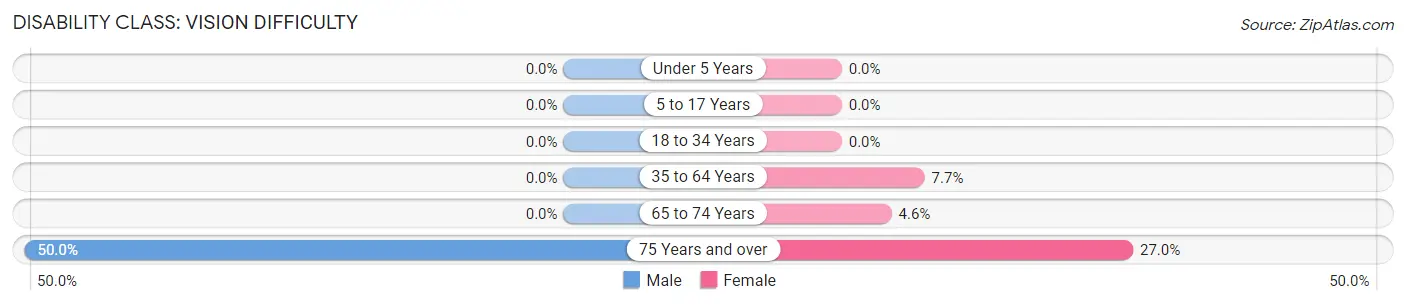
| Age Bracket | Male | Female |
| Under 5 Years | 0 (0.0%) | 0 (0.0%) |
| 5 to 17 Years | 0 (0.0%) | 0 (0.0%) |
| 18 to 34 Years | 0 (0.0%) | 0 (0.0%) |
| 35 to 64 Years | 0 (0.0%) | 3 (7.7%) |
| 65 to 74 Years | 0 (0.0%) | 3 (4.6%) |
| 75 Years and over | 5 (50.0%) | 10 (27.0%) |
Disability Class: Cognitive Difficulty
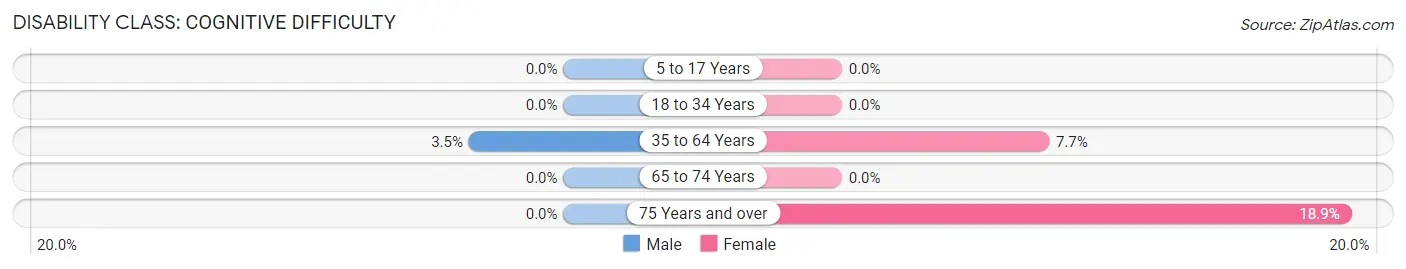
| Age Bracket | Male | Female |
| 5 to 17 Years | 0 (0.0%) | 0 (0.0%) |
| 18 to 34 Years | 0 (0.0%) | 0 (0.0%) |
| 35 to 64 Years | 4 (3.5%) | 3 (7.7%) |
| 65 to 74 Years | 0 (0.0%) | 0 (0.0%) |
| 75 Years and over | 0 (0.0%) | 7 (18.9%) |
Disability Class: Ambulatory Difficulty
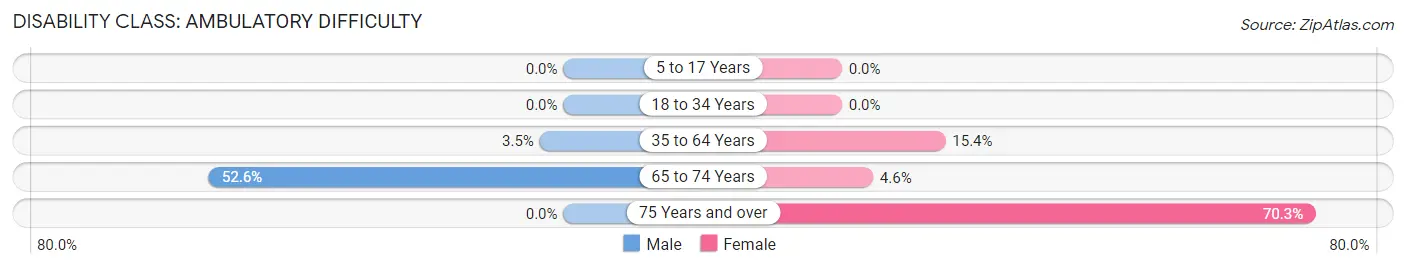
| Age Bracket | Male | Female |
| 5 to 17 Years | 0 (0.0%) | 0 (0.0%) |
| 18 to 34 Years | 0 (0.0%) | 0 (0.0%) |
| 35 to 64 Years | 4 (3.5%) | 6 (15.4%) |
| 65 to 74 Years | 10 (52.6%) | 3 (4.6%) |
| 75 Years and over | 0 (0.0%) | 26 (70.3%) |
Disability Class: Self-Care Difficulty
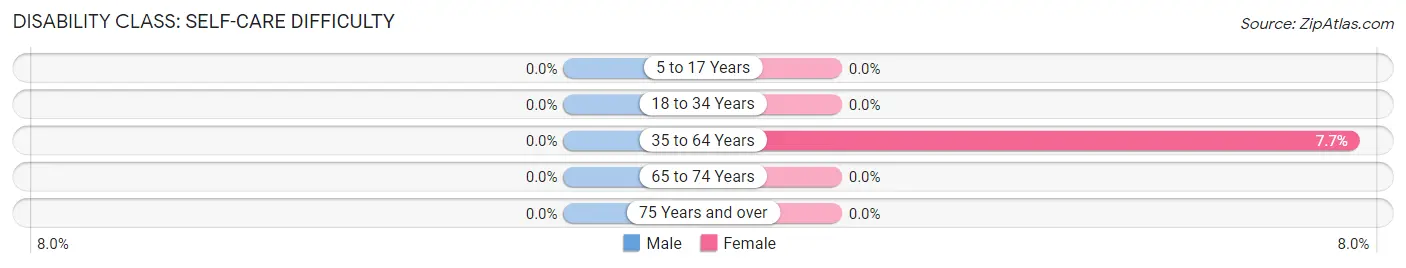
| Age Bracket | Male | Female |
| 5 to 17 Years | 0 (0.0%) | 0 (0.0%) |
| 18 to 34 Years | 0 (0.0%) | 0 (0.0%) |
| 35 to 64 Years | 0 (0.0%) | 3 (7.7%) |
| 65 to 74 Years | 0 (0.0%) | 0 (0.0%) |
| 75 Years and over | 0 (0.0%) | 0 (0.0%) |
Technology Access in Oak City
Computing Device Access in Oak City
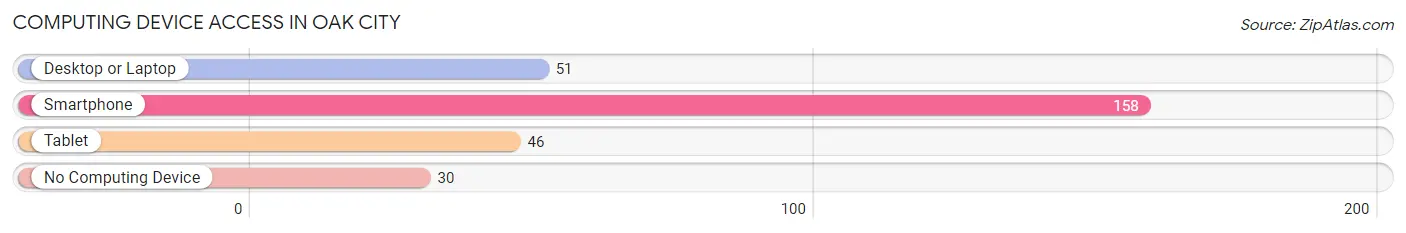
| Device Type | # Households | % Households |
| Desktop or Laptop | 51 | 27.1% |
| Smartphone | 158 | 84.0% |
| Tablet | 46 | 24.5% |
| No Computing Device | 30 | 16.0% |
| Total | 188 | 100.0% |
Internet Access in Oak City
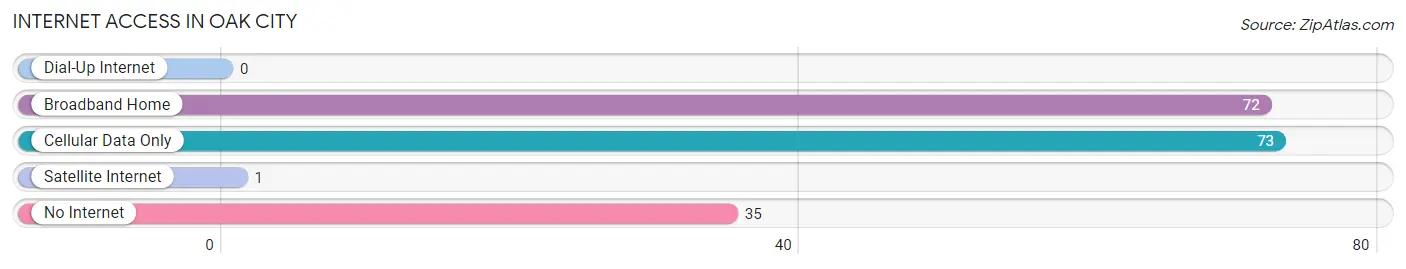
| Internet Type | # Households | % Households |
| Dial-Up Internet | 0 | 0.0% |
| Broadband Home | 72 | 38.3% |
| Cellular Data Only | 73 | 38.8% |
| Satellite Internet | 1 | 0.5% |
| No Internet | 35 | 18.6% |
| Total | 188 | 100.0% |
Oak City Summary
City of Oak City
Oak City is a small city located in the state of North Carolina. It is situated in the northeastern part of the state, in the county of Nash. The city is located on the banks of the Tar River, and is home to a population of approximately 4,000 people.
History
Oak City was founded in 1820 by a group of settlers from Virginia. The city was named after the abundance of oak trees in the area. The settlers were attracted to the area due to its fertile soil and abundant natural resources. The city quickly grew and became a center for trade and commerce.
In the late 19th century, Oak City was a major hub for the tobacco industry. The city was home to several tobacco warehouses and factories, and was a major supplier of tobacco products to the rest of the country.
In the early 20th century, Oak City experienced a period of decline. The tobacco industry had moved away, and the city’s population began to decline. However, in the late 20th century, the city experienced a resurgence. The city was revitalized with the construction of a new shopping center, and the opening of several new businesses.
Geography
Oak City is located in the northeastern part of North Carolina, in the county of Nash. The city is situated on the banks of the Tar River, and is surrounded by rolling hills and forests. The city has a total area of 4.2 square miles, and is located at an elevation of approximately 200 feet.
The climate in Oak City is humid subtropical, with hot, humid summers and mild winters. The average annual temperature is around 70 degrees Fahrenheit, and the average annual precipitation is around 45 inches.
Economy
Oak City’s economy is largely based on agriculture and manufacturing. The city is home to several large farms, and is a major producer of tobacco, cotton, and soybeans. The city is also home to several manufacturing plants, including a furniture factory and a textile mill.
The city is also home to several retail stores, restaurants, and other businesses. The city is a popular tourist destination, and is home to several historic sites, including the Oak City Historic District.
Demographics
As of the 2010 census, the population of Oak City was 4,000. The racial makeup of the city was 79.2% White, 15.2% African American, 0.7% Native American, 0.7% Asian, and 4.2% from other races. The median household income was $35,000, and the median family income was $41,000.
Conclusion
Oak City is a small city located in the northeastern part of North Carolina. The city was founded in 1820, and has a long history of agriculture and manufacturing. The city is home to a population of approximately 4,000 people, and has a diverse economy. The city is a popular tourist destination, and is home to several historic sites.
Common Questions
What is Per Capita Income in Oak City?
Per Capita income in Oak City is $22,645.
What is the Median Family Income in Oak City?
Median Family Income in Oak City is $58,393.
What is the Median Household income in Oak City?
Median Household Income in Oak City is $57,769.
What is Inequality or Gini Index in Oak City?
Inequality or Gini Index in Oak City is 0.25.
What is the Total Population of Oak City?
Total Population of Oak City is 420.
What is the Total Male Population of Oak City?
Total Male Population of Oak City is 203.
What is the Total Female Population of Oak City?
Total Female Population of Oak City is 217.
What is the Ratio of Males per 100 Females in Oak City?
There are 93.55 Males per 100 Females in Oak City.
What is the Ratio of Females per 100 Males in Oak City?
There are 106.90 Females per 100 Males in Oak City.
What is the Median Population Age in Oak City?
Median Population Age in Oak City is 49.0 Years.
What is the Average Family Size in Oak City
Average Family Size in Oak City is 2.7 People.
What is the Average Household Size in Oak City
Average Household Size in Oak City is 2.2 People.
How Large is the Labor Force in Oak City?
There are 244 People in the Labor Forcein in Oak City.
What is the Percentage of People in the Labor Force in Oak City?
65.8% of People are in the Labor Force in Oak City.
What is the Unemployment Rate in Oak City?
Unemployment Rate in Oak City is 2.9%.