Norwood, NC Map & Demographics
Norwood Map
Norwood Overview
$27,578
PER CAPITA INCOME
$72,038
AVG FAMILY INCOME
$55,897
AVG HOUSEHOLD INCOME
8.2%
WAGE / INCOME GAP [ % ]
91.8¢/ $1
WAGE / INCOME GAP [ $ ]
0.45
INEQUALITY / GINI INDEX
2,906
TOTAL POPULATION
1,614
MALE POPULATION
1,292
FEMALE POPULATION
124.92
MALES / 100 FEMALES
80.05
FEMALES / 100 MALES
40.8
MEDIAN AGE
4.0
AVG FAMILY SIZE
2.8
AVG HOUSEHOLD SIZE
1,543
LABOR FORCE [ PEOPLE ]
61.7%
PERCENT IN LABOR FORCE
5.1%
UNEMPLOYMENT RATE
Norwood Zip Codes
Income in Norwood
Income Overview in Norwood
Per Capita Income in Norwood is $27,578, while median incomes of families and households are $72,038 and $55,897 respectively.
| Characteristic | Number | Measure |
| Per Capita Income | 2,906 | $27,578 |
| Median Family Income | 573 | $72,038 |
| Mean Family Income | 573 | $85,600 |
| Median Household Income | 1,037 | $55,897 |
| Mean Household Income | 1,037 | $67,071 |
| Income Deficit | 573 | $0 |
| Wage / Income Gap (%) | 2,906 | 8.24% |
| Wage / Income Gap ($) | 2,906 | 91.76¢ per $1 |
| Gini / Inequality Index | 2,906 | 0.45 |
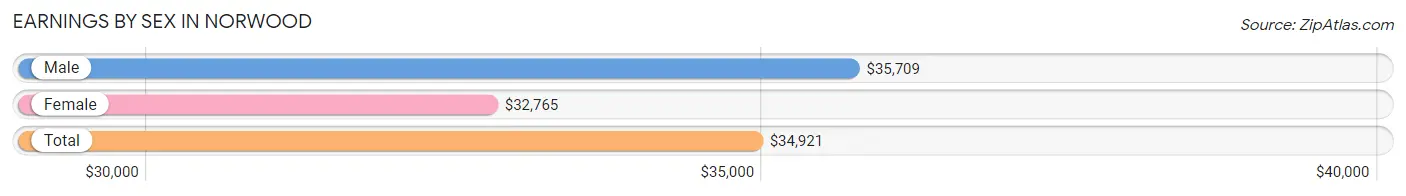
Earnings by Sex in Norwood
Average Earnings in Norwood are $34,921, $35,709 for men and $32,765 for women, a difference of 8.2%.
| Sex | Number | Average Earnings |
| Male | 1,109 (69.7%) | $35,709 |
| Female | 483 (30.3%) | $32,765 |
| Total | 1,592 (100.0%) | $34,921 |
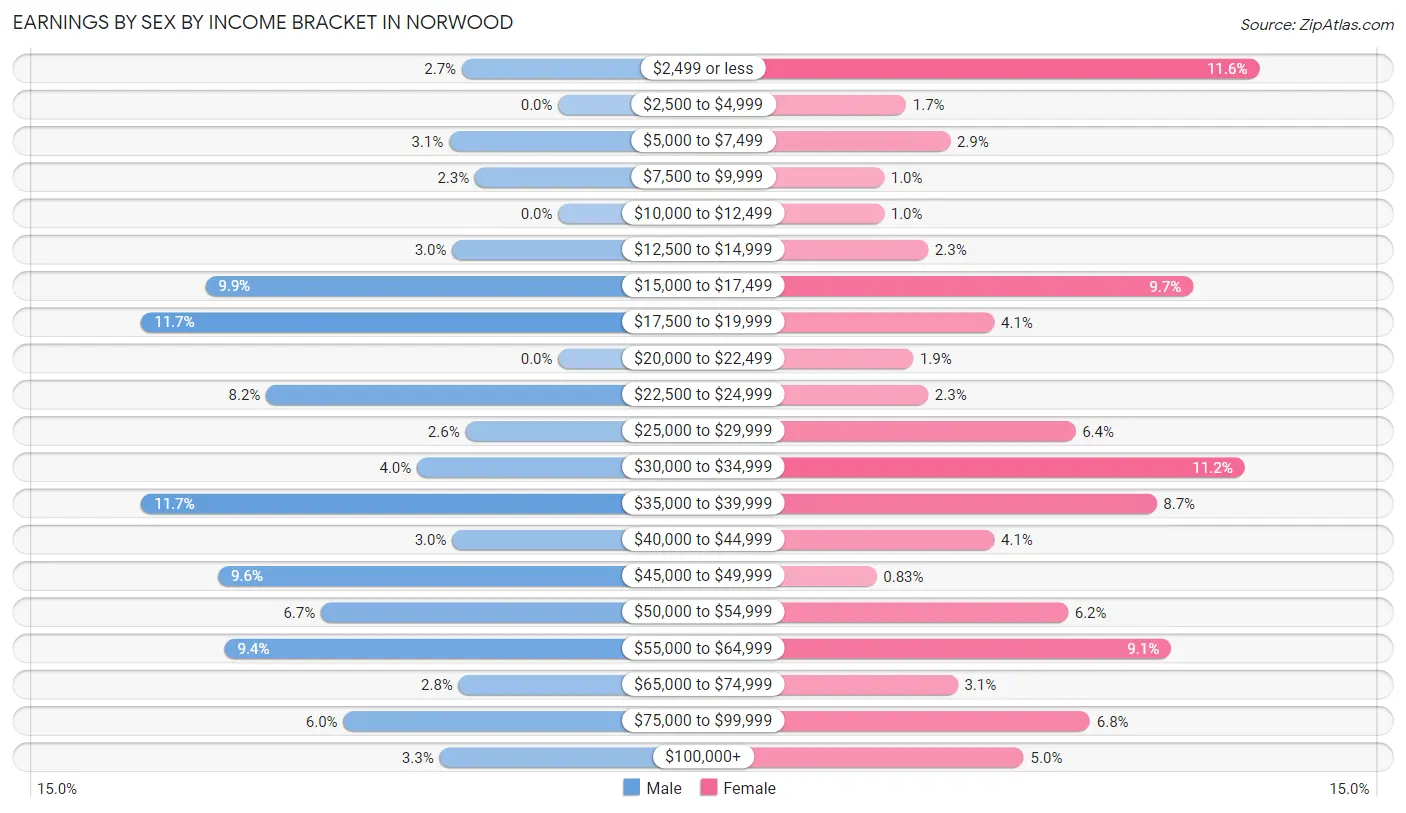
Earnings by Sex by Income Bracket in Norwood
The most common earnings brackets in Norwood are $17,500 to $19,999 for men (130 | 11.7%) and $2,499 or less for women (56 | 11.6%).
| Income | Male | Female |
| $2,499 or less | 30 (2.7%) | 56 (11.6%) |
| $2,500 to $4,999 | 0 (0.0%) | 8 (1.7%) |
| $5,000 to $7,499 | 34 (3.1%) | 14 (2.9%) |
| $7,500 to $9,999 | 26 (2.3%) | 5 (1.0%) |
| $10,000 to $12,499 | 0 (0.0%) | 5 (1.0%) |
| $12,500 to $14,999 | 33 (3.0%) | 11 (2.3%) |
| $15,000 to $17,499 | 110 (9.9%) | 47 (9.7%) |
| $17,500 to $19,999 | 130 (11.7%) | 20 (4.1%) |
| $20,000 to $22,499 | 0 (0.0%) | 9 (1.9%) |
| $22,500 to $24,999 | 91 (8.2%) | 11 (2.3%) |
| $25,000 to $29,999 | 29 (2.6%) | 31 (6.4%) |
| $30,000 to $34,999 | 44 (4.0%) | 54 (11.2%) |
| $35,000 to $39,999 | 130 (11.7%) | 42 (8.7%) |
| $40,000 to $44,999 | 33 (3.0%) | 20 (4.1%) |
| $45,000 to $49,999 | 106 (9.6%) | 4 (0.8%) |
| $50,000 to $54,999 | 74 (6.7%) | 30 (6.2%) |
| $55,000 to $64,999 | 104 (9.4%) | 44 (9.1%) |
| $65,000 to $74,999 | 31 (2.8%) | 15 (3.1%) |
| $75,000 to $99,999 | 67 (6.0%) | 33 (6.8%) |
| $100,000+ | 37 (3.3%) | 24 (5.0%) |
| Total | 1,109 (100.0%) | 483 (100.0%) |
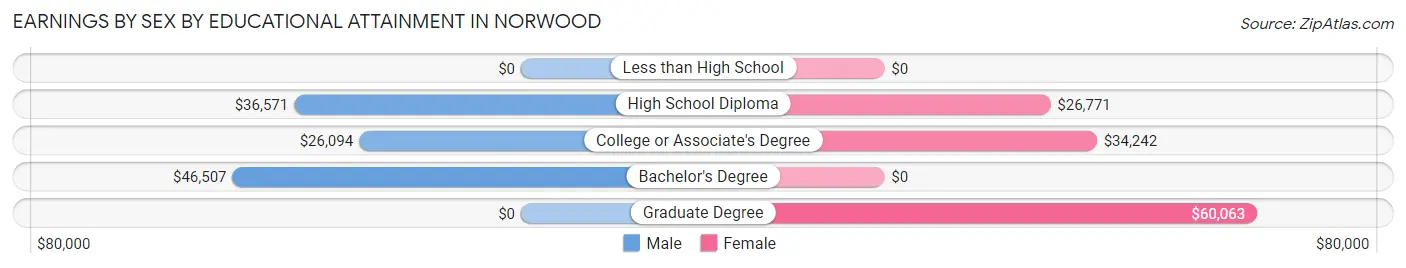
Earnings by Sex by Educational Attainment in Norwood
Average earnings in Norwood are $36,714 for men and $34,470 for women, a difference of 6.1%. Men with an educational attainment of bachelor's degree enjoy the highest average annual earnings of $46,507, while those with college or associate's degree education earn the least with $26,094. Women with an educational attainment of graduate degree earn the most with the average annual earnings of $60,063, while those with high school diploma education have the smallest earnings of $26,771.
| Educational Attainment | Male Income | Female Income |
| Less than High School | - | - |
| High School Diploma | $36,571 | $26,771 |
| College or Associate's Degree | $26,094 | $34,242 |
| Bachelor's Degree | $46,507 | $0 |
| Graduate Degree | - | - |
| Total | $36,714 | $34,470 |
Family Income in Norwood
Family Income Brackets in Norwood
According to the Norwood family income data, there are 184 families falling into the $50,000 to $74,999 income range, which is the most common income bracket and makes up 32.1% of all families. Conversely, the $10,000 to $14,999 income bracket is the least frequent group with only 3 families (0.5%) belonging to this category.
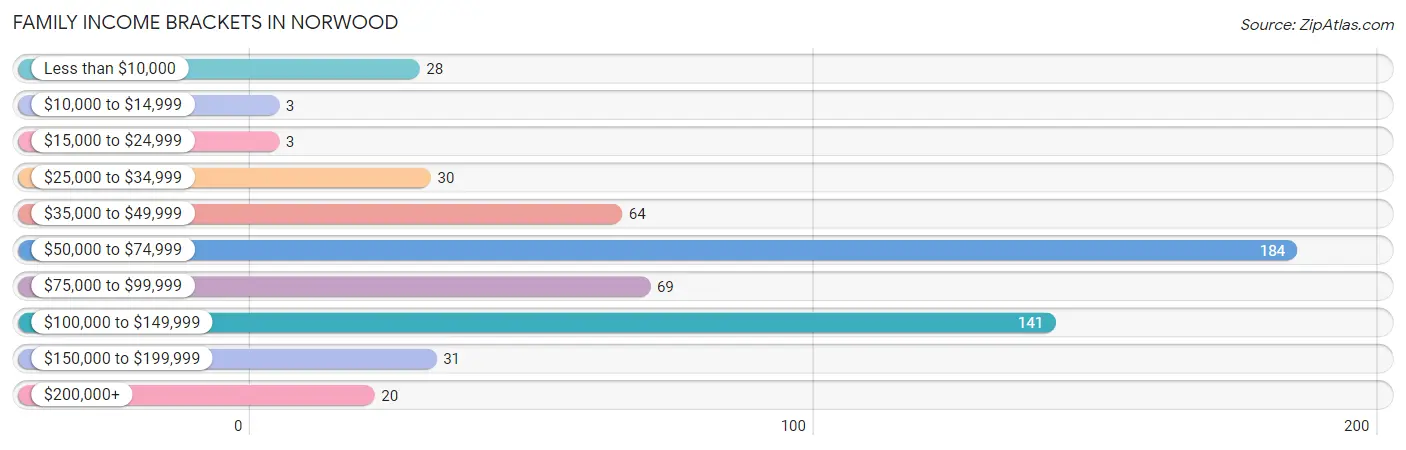
| Income Bracket | # Families | % Families |
| Less than $10,000 | 28 | 4.9% |
| $10,000 to $14,999 | 3 | 0.5% |
| $15,000 to $24,999 | 3 | 0.5% |
| $25,000 to $34,999 | 30 | 5.2% |
| $35,000 to $49,999 | 64 | 11.2% |
| $50,000 to $74,999 | 184 | 32.1% |
| $75,000 to $99,999 | 69 | 12.0% |
| $100,000 to $149,999 | 141 | 24.6% |
| $150,000 to $199,999 | 31 | 5.4% |
| $200,000+ | 20 | 3.5% |
Family Income by Famaliy Size in Norwood
5-person families (38 | 6.6%) account for the highest median family income in Norwood with $125,500 per family, while 3-person families (75 | 13.1%) have the highest median income of $35,156 per family member.
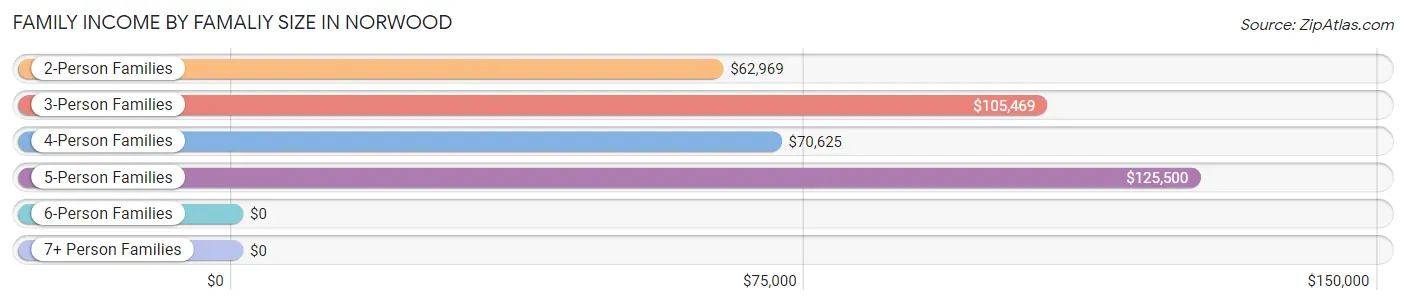
| Income Bracket | # Families | Median Income |
| 2-Person Families | 236 (41.2%) | $62,969 |
| 3-Person Families | 75 (13.1%) | $105,469 |
| 4-Person Families | 186 (32.5%) | $70,625 |
| 5-Person Families | 38 (6.6%) | $125,500 |
| 6-Person Families | 21 (3.7%) | $0 |
| 7+ Person Families | 17 (3.0%) | $0 |
| Total | 573 (100.0%) | $72,038 |
Family Income by Number of Earners in Norwood
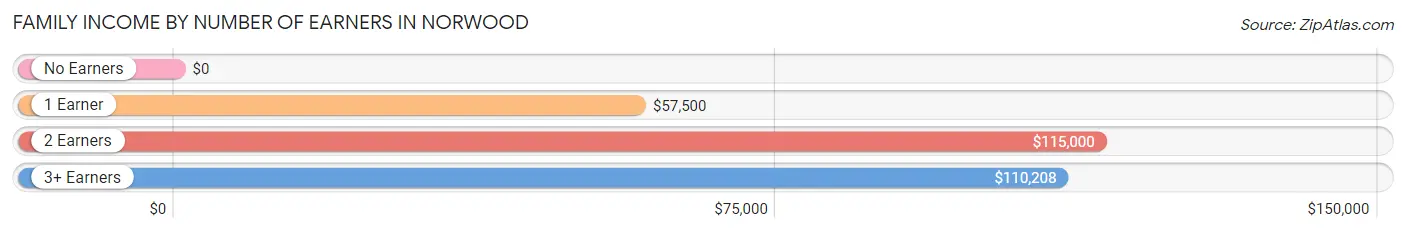
| Number of Earners | # Families | Median Income |
| No Earners | 72 (12.6%) | $0 |
| 1 Earner | 228 (39.8%) | $57,500 |
| 2 Earners | 152 (26.5%) | $115,000 |
| 3+ Earners | 121 (21.1%) | $110,208 |
| Total | 573 (100.0%) | $72,038 |
Household Income in Norwood
Household Income Brackets in Norwood
With 196 households falling in the category, the $50,000 to $74,999 income range is the most frequent in Norwood, accounting for 18.9% of all households. In contrast, only 34 households (3.3%) fall into the $200,000+ income bracket, making it the least populous group.
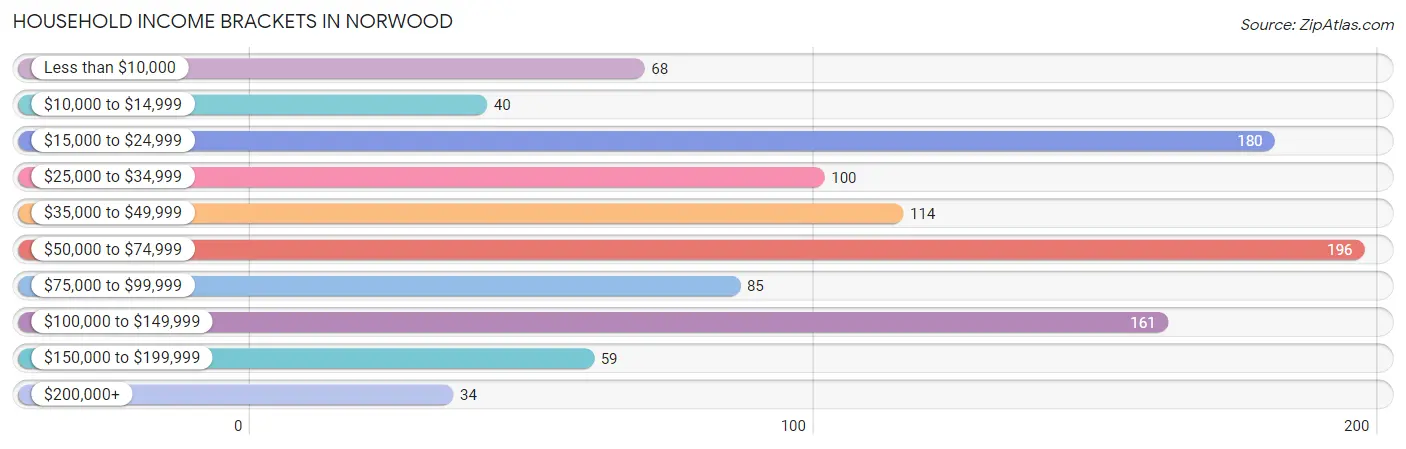
| Income Bracket | # Households | % Households |
| Less than $10,000 | 68 | 6.6% |
| $10,000 to $14,999 | 40 | 3.9% |
| $15,000 to $24,999 | 180 | 17.4% |
| $25,000 to $34,999 | 100 | 9.6% |
| $35,000 to $49,999 | 114 | 11.0% |
| $50,000 to $74,999 | 196 | 18.9% |
| $75,000 to $99,999 | 85 | 8.2% |
| $100,000 to $149,999 | 161 | 15.5% |
| $150,000 to $199,999 | 59 | 5.7% |
| $200,000+ | 34 | 3.3% |
Household Income by Householder Age in Norwood
The median household income in Norwood is $55,897, with the highest median household income of $72,941 found in the 15 to 24 years age bracket for the primary householder. A total of 28 households (2.7%) fall into this category. Meanwhile, the 65+ years age bracket for the primary householder has the lowest median household income of $34,107, with 200 households (19.3%) in this group.
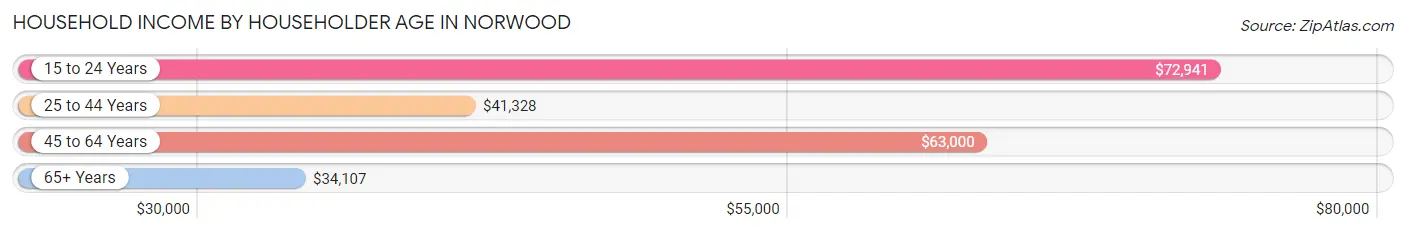
| Income Bracket | # Households | Median Income |
| 15 to 24 Years | 28 (2.7%) | $72,941 |
| 25 to 44 Years | 359 (34.6%) | $41,328 |
| 45 to 64 Years | 450 (43.4%) | $63,000 |
| 65+ Years | 200 (19.3%) | $34,107 |
| Total | 1,037 (100.0%) | $55,897 |
Poverty in Norwood
Income Below Poverty by Sex and Age in Norwood
With 10.1% poverty level for males and 11.1% for females among the residents of Norwood, under 5 year old males and under 5 year old females are the most vulnerable to poverty, with 56 males (100.0%) and 40 females (87.0%) in their respective age groups living below the poverty level.
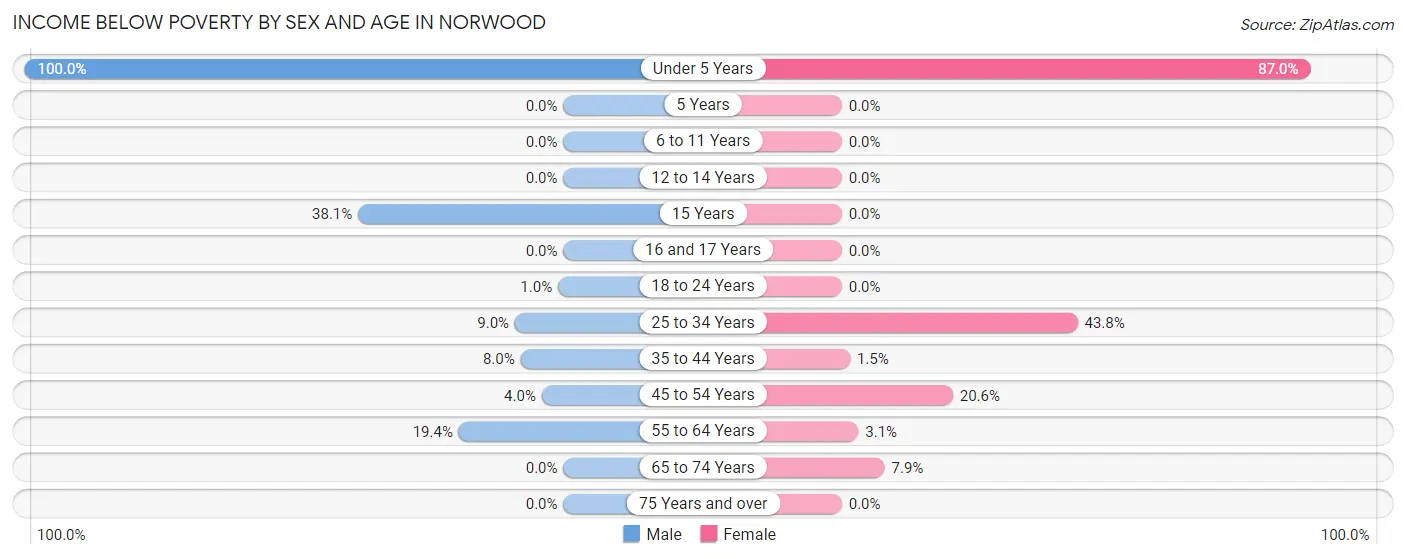
| Age Bracket | Male | Female |
| Under 5 Years | 56 (100.0%) | 40 (87.0%) |
| 5 Years | 0 (0.0%) | 0 (0.0%) |
| 6 to 11 Years | 0 (0.0%) | 0 (0.0%) |
| 12 to 14 Years | 0 (0.0%) | 0 (0.0%) |
| 15 Years | 8 (38.1%) | 0 (0.0%) |
| 16 and 17 Years | 0 (0.0%) | 0 (0.0%) |
| 18 to 24 Years | 2 (1.0%) | 0 (0.0%) |
| 25 to 34 Years | 33 (9.0%) | 35 (43.8%) |
| 35 to 44 Years | 12 (8.0%) | 3 (1.5%) |
| 45 to 54 Years | 12 (4.0%) | 48 (20.6%) |
| 55 to 64 Years | 40 (19.4%) | 7 (3.1%) |
| 65 to 74 Years | 0 (0.0%) | 10 (7.9%) |
| 75 Years and over | 0 (0.0%) | 0 (0.0%) |
| Total | 163 (10.1%) | 143 (11.1%) |
Income Above Poverty by Sex and Age in Norwood
According to the poverty statistics in Norwood, males aged 5 years and females aged 5 years are the age groups that are most secure financially, with 100.0% of males and 100.0% of females in these age groups living above the poverty line.
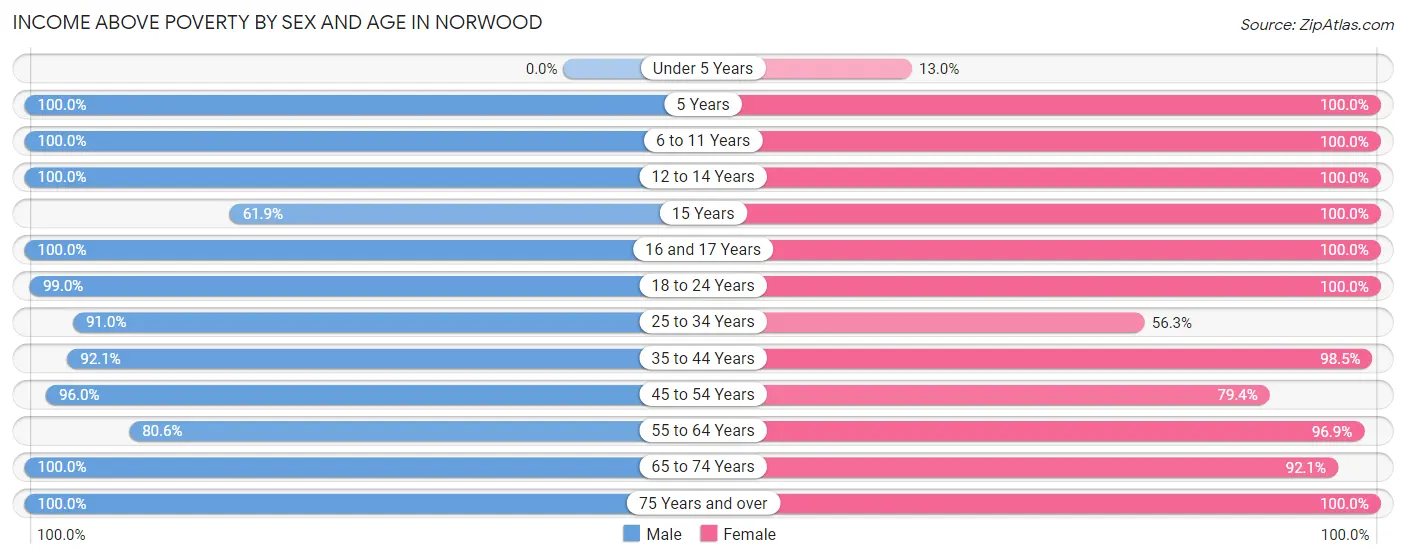
| Age Bracket | Male | Female |
| Under 5 Years | 0 (0.0%) | 6 (13.0%) |
| 5 Years | 11 (100.0%) | 12 (100.0%) |
| 6 to 11 Years | 87 (100.0%) | 60 (100.0%) |
| 12 to 14 Years | 34 (100.0%) | 70 (100.0%) |
| 15 Years | 13 (61.9%) | 7 (100.0%) |
| 16 and 17 Years | 15 (100.0%) | 78 (100.0%) |
| 18 to 24 Years | 198 (99.0%) | 62 (100.0%) |
| 25 to 34 Years | 334 (91.0%) | 45 (56.2%) |
| 35 to 44 Years | 139 (92.0%) | 195 (98.5%) |
| 45 to 54 Years | 287 (96.0%) | 185 (79.4%) |
| 55 to 64 Years | 166 (80.6%) | 221 (96.9%) |
| 65 to 74 Years | 116 (100.0%) | 116 (92.1%) |
| 75 Years and over | 50 (100.0%) | 92 (100.0%) |
| Total | 1,450 (89.9%) | 1,149 (88.9%) |
Income Below Poverty Among Married-Couple Families in Norwood
The poverty statistics for married-couple families in Norwood show that 6.8% or 28 of the total 415 families live below the poverty line. Families with 1 or 2 children have the highest poverty rate of 16.0%, comprising of 28 families. On the other hand, families with no children have the lowest poverty rate of 0.0%, which includes 0 families.
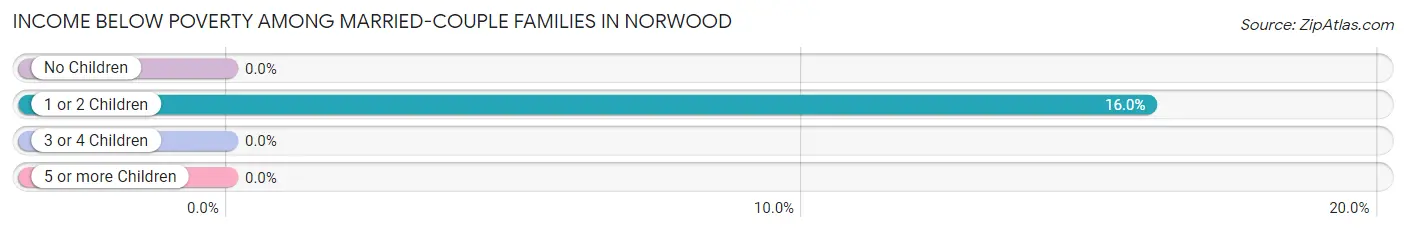
| Children | Above Poverty | Below Poverty |
| No Children | 240 (100.0%) | 0 (0.0%) |
| 1 or 2 Children | 147 (84.0%) | 28 (16.0%) |
| 3 or 4 Children | 0 (0.0%) | 0 (0.0%) |
| 5 or more Children | 0 (0.0%) | 0 (0.0%) |
| Total | 387 (93.2%) | 28 (6.8%) |
Income Below Poverty Among Single-Parent Households in Norwood
According to the poverty data in Norwood, 2.9% or 3 single-father households and 5.4% or 3 single-mother households are living below the poverty line. Among single-father households, those with 1 or 2 children have the highest poverty rate, with 3 households (4.0%) experiencing poverty. Likewise, among single-mother households, those with no children have the highest poverty rate, with 3 households (9.1%) falling below the poverty line.
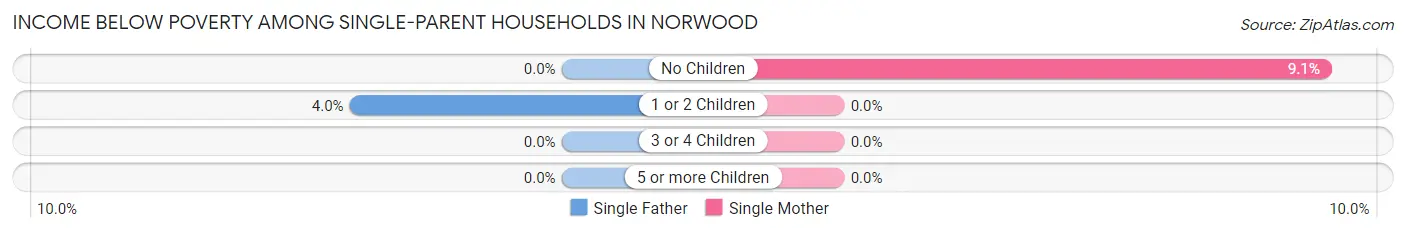
| Children | Single Father | Single Mother |
| No Children | 0 (0.0%) | 3 (9.1%) |
| 1 or 2 Children | 3 (4.0%) | 0 (0.0%) |
| 3 or 4 Children | 0 (0.0%) | 0 (0.0%) |
| 5 or more Children | 0 (0.0%) | 0 (0.0%) |
| Total | 3 (2.9%) | 3 (5.4%) |
Income Below Poverty Among Married-Couple vs Single-Parent Households in Norwood
The poverty data for Norwood shows that 28 of the married-couple family households (6.8%) and 6 of the single-parent households (3.8%) are living below the poverty level. Within the married-couple family households, those with 1 or 2 children have the highest poverty rate, with 28 households (16.0%) falling below the poverty line. Among the single-parent households, those with no children have the highest poverty rate, with 3 household (5.8%) living below poverty.
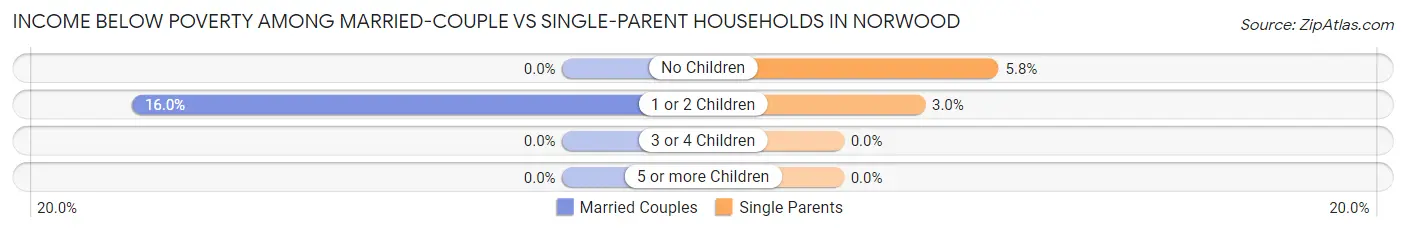
| Children | Married-Couple Families | Single-Parent Households |
| No Children | 0 (0.0%) | 3 (5.8%) |
| 1 or 2 Children | 28 (16.0%) | 3 (3.0%) |
| 3 or 4 Children | 0 (0.0%) | 0 (0.0%) |
| 5 or more Children | 0 (0.0%) | 0 (0.0%) |
| Total | 28 (6.8%) | 6 (3.8%) |
Race in Norwood
The most populous races in Norwood are White / Caucasian (1,971 | 67.8%), Black / African American (709 | 24.4%), and Asian (157 | 5.4%).
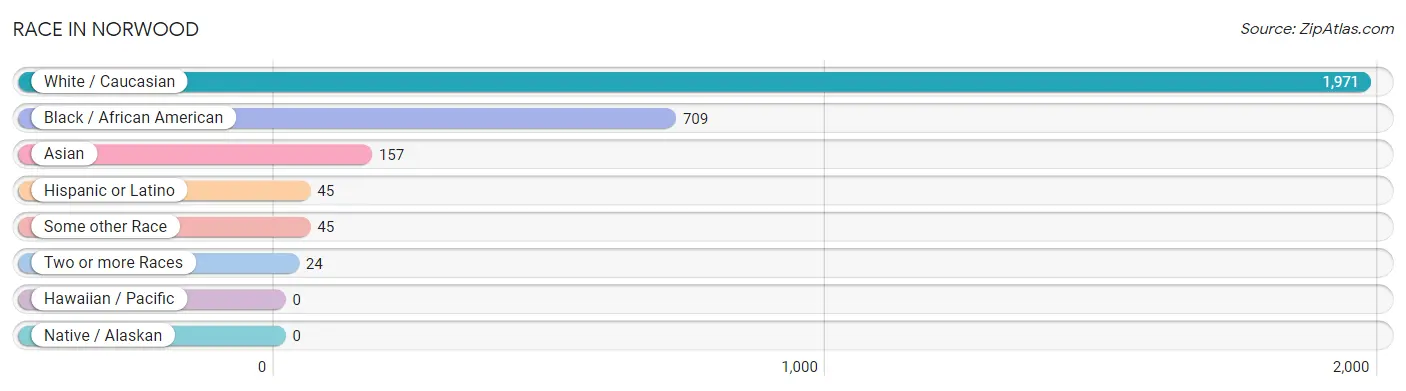
| Race | # Population | % Population |
| Asian | 157 | 5.4% |
| Black / African American | 709 | 24.4% |
| Hawaiian / Pacific | 0 | 0.0% |
| Hispanic or Latino | 45 | 1.5% |
| Native / Alaskan | 0 | 0.0% |
| White / Caucasian | 1,971 | 67.8% |
| Two or more Races | 24 | 0.8% |
| Some other Race | 45 | 1.5% |
| Total | 2,906 | 100.0% |
Ancestry in Norwood
The most populous ancestries reported in Norwood are American (241 | 8.3%), English (171 | 5.9%), Bangladeshi (137 | 4.7%), German (128 | 4.4%), and Scotch-Irish (76 | 2.6%), together accounting for 25.9% of all Norwood residents.
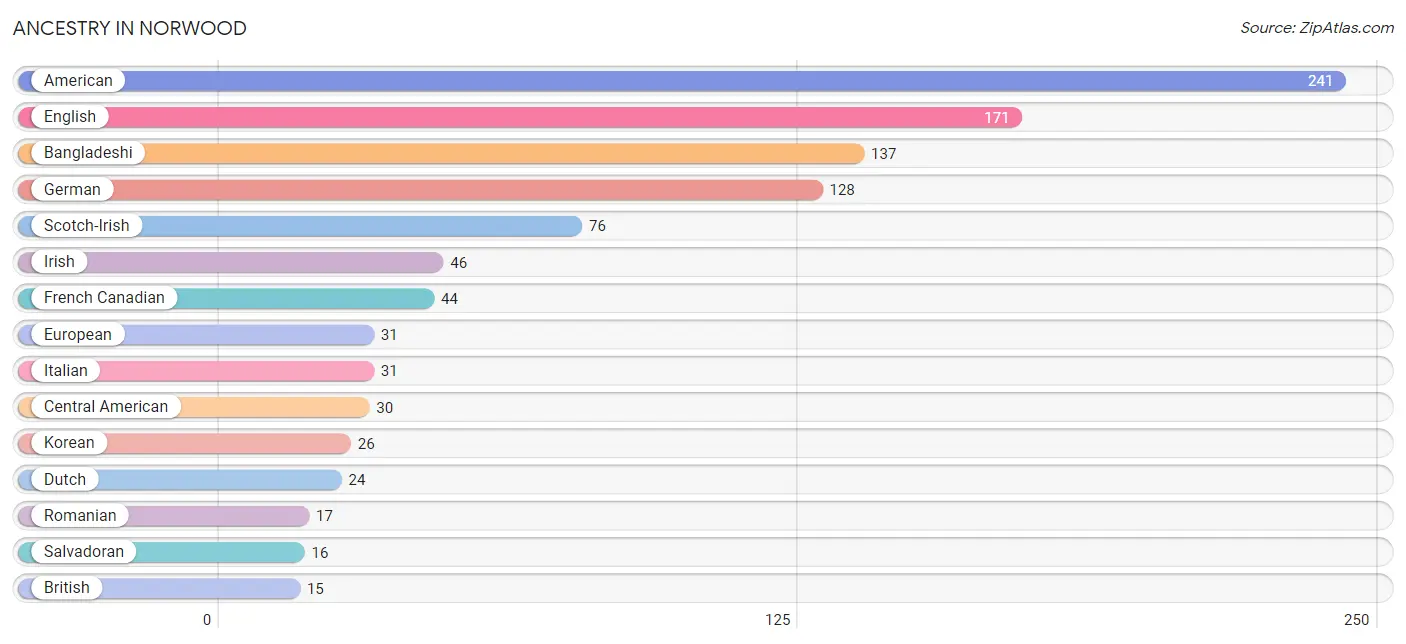
| Ancestry | # Population | % Population |
| American | 241 | 8.3% |
| Bangladeshi | 137 | 4.7% |
| British | 15 | 0.5% |
| Central American | 30 | 1.0% |
| Cherokee | 3 | 0.1% |
| Dutch | 24 | 0.8% |
| English | 171 | 5.9% |
| European | 31 | 1.1% |
| French | 6 | 0.2% |
| French Canadian | 44 | 1.5% |
| German | 128 | 4.4% |
| Honduran | 14 | 0.5% |
| Indian (Asian) | 5 | 0.2% |
| Irish | 46 | 1.6% |
| Italian | 31 | 1.1% |
| Korean | 26 | 0.9% |
| Lumbee | 3 | 0.1% |
| Mexican | 15 | 0.5% |
| Northern European | 12 | 0.4% |
| Norwegian | 13 | 0.4% |
| Pakistani | 5 | 0.2% |
| Romanian | 17 | 0.6% |
| Salvadoran | 16 | 0.5% |
| Scotch-Irish | 76 | 2.6% |
| Scottish | 14 | 0.5% |
| Swiss | 4 | 0.1% |
| Welsh | 10 | 0.3% | View All 27 Rows |
Immigrants in Norwood
The most numerous immigrant groups reported in Norwood came from Asia (53 | 1.8%), South Eastern Asia (53 | 1.8%), Central America (45 | 1.5%), Latin America (45 | 1.5%), and Europe (34 | 1.2%), together accounting for 7.9% of all Norwood residents.
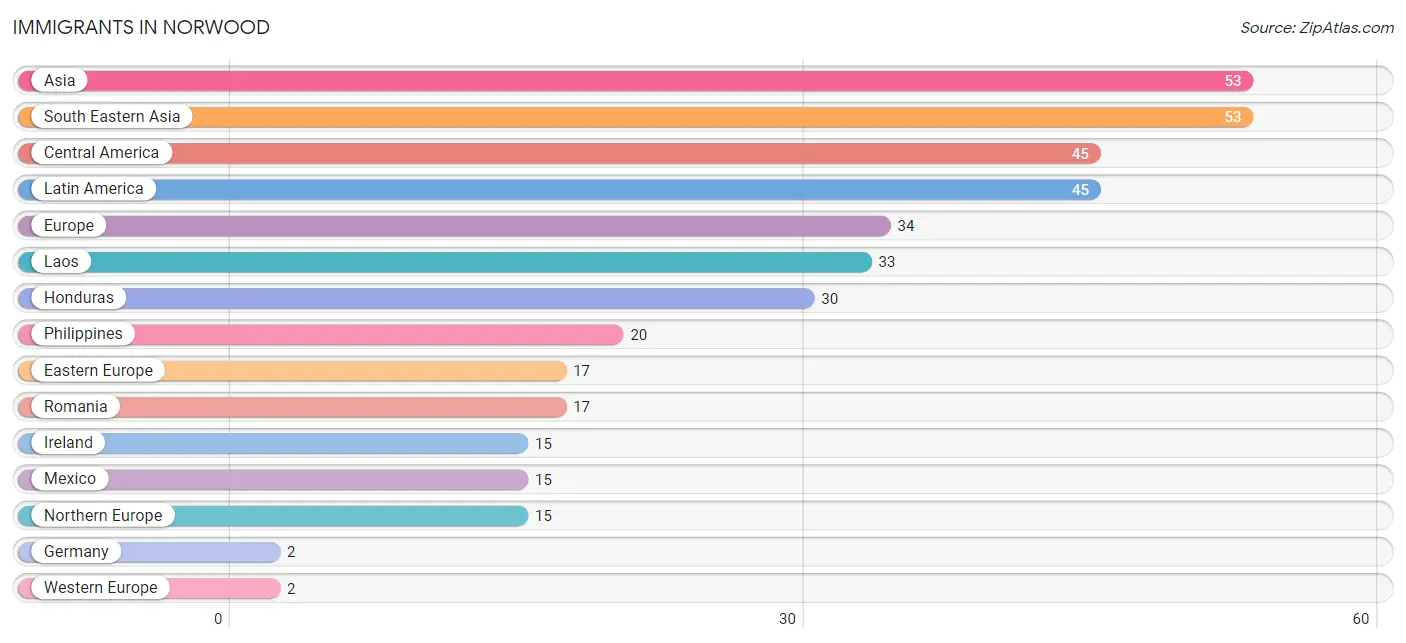
| Immigration Origin | # Population | % Population |
| Asia | 53 | 1.8% |
| Central America | 45 | 1.5% |
| Eastern Europe | 17 | 0.6% |
| Europe | 34 | 1.2% |
| Germany | 2 | 0.1% |
| Honduras | 30 | 1.0% |
| Ireland | 15 | 0.5% |
| Laos | 33 | 1.1% |
| Latin America | 45 | 1.5% |
| Mexico | 15 | 0.5% |
| Northern Europe | 15 | 0.5% |
| Philippines | 20 | 0.7% |
| Romania | 17 | 0.6% |
| South Eastern Asia | 53 | 1.8% |
| Western Europe | 2 | 0.1% | View All 15 Rows |
Sex and Age in Norwood
Sex and Age in Norwood
The most populous age groups in Norwood are 25 to 29 Years (224 | 13.9%) for men and 35 to 39 Years (144 | 11.2%) for women.
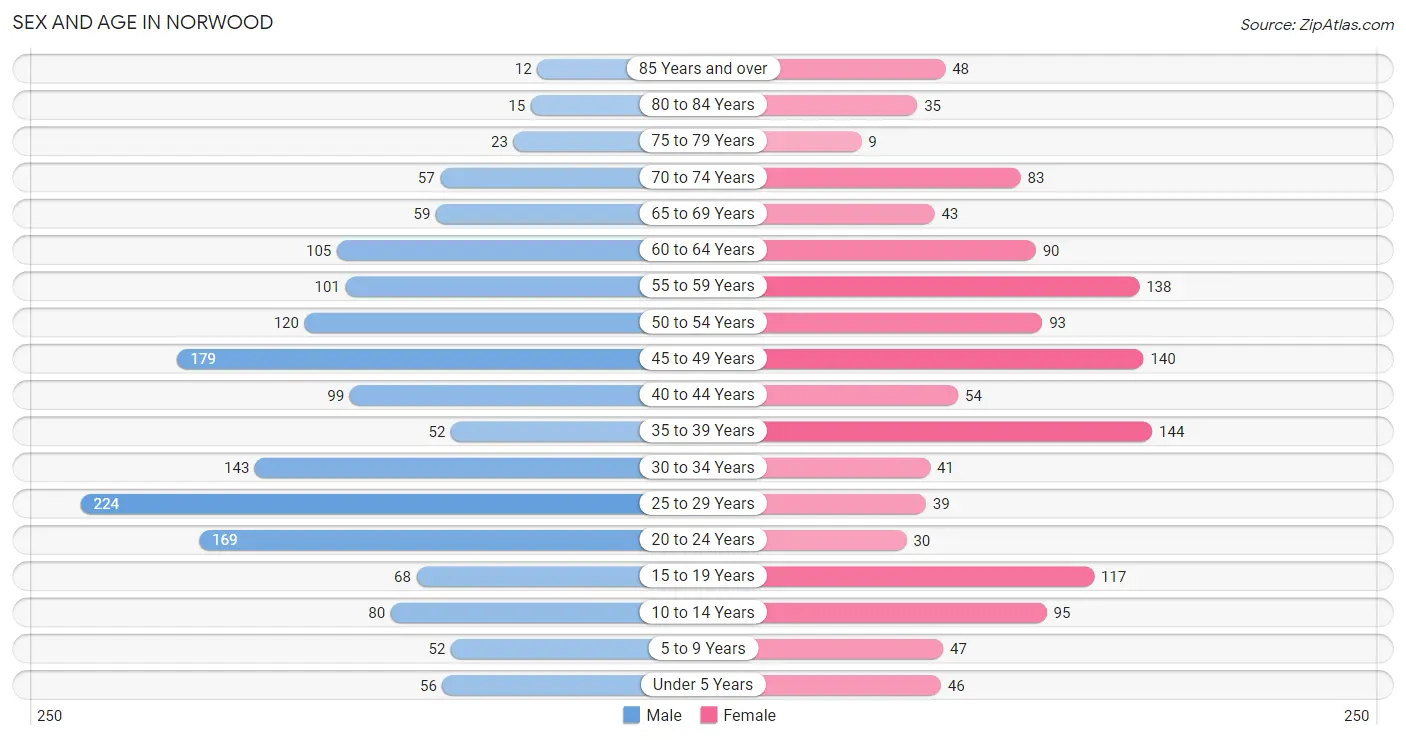
| Age Bracket | Male | Female |
| Under 5 Years | 56 (3.5%) | 46 (3.6%) |
| 5 to 9 Years | 52 (3.2%) | 47 (3.6%) |
| 10 to 14 Years | 80 (5.0%) | 95 (7.3%) |
| 15 to 19 Years | 68 (4.2%) | 117 (9.1%) |
| 20 to 24 Years | 169 (10.5%) | 30 (2.3%) |
| 25 to 29 Years | 224 (13.9%) | 39 (3.0%) |
| 30 to 34 Years | 143 (8.9%) | 41 (3.2%) |
| 35 to 39 Years | 52 (3.2%) | 144 (11.2%) |
| 40 to 44 Years | 99 (6.1%) | 54 (4.2%) |
| 45 to 49 Years | 179 (11.1%) | 140 (10.8%) |
| 50 to 54 Years | 120 (7.4%) | 93 (7.2%) |
| 55 to 59 Years | 101 (6.3%) | 138 (10.7%) |
| 60 to 64 Years | 105 (6.5%) | 90 (7.0%) |
| 65 to 69 Years | 59 (3.7%) | 43 (3.3%) |
| 70 to 74 Years | 57 (3.5%) | 83 (6.4%) |
| 75 to 79 Years | 23 (1.4%) | 9 (0.7%) |
| 80 to 84 Years | 15 (0.9%) | 35 (2.7%) |
| 85 Years and over | 12 (0.7%) | 48 (3.7%) |
| Total | 1,614 (100.0%) | 1,292 (100.0%) |
Families and Households in Norwood
Median Family Size in Norwood
The median family size in Norwood is 4.01 persons per family, with married-couple families (415 | 72.4%) accounting for the largest median family size of 4.14 persons per family. On the other hand, single male/father families (102 | 17.8%) represent the smallest median family size with 3.68 persons per family.
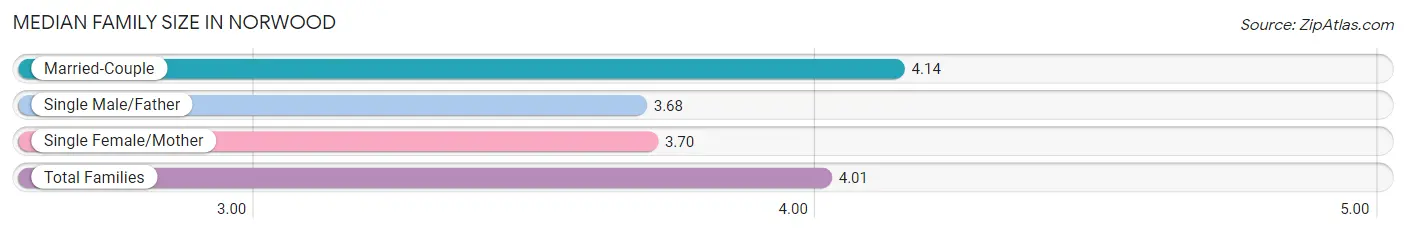
| Family Type | # Families | Family Size |
| Married-Couple | 415 (72.4%) | 4.14 |
| Single Male/Father | 102 (17.8%) | 3.68 |
| Single Female/Mother | 56 (9.8%) | 3.70 |
| Total Families | 573 (100.0%) | 4.01 |
Median Household Size in Norwood
The median household size in Norwood is 2.80 persons per household, with married-couple households (415 | 40.0%) accounting for the largest median household size of 4.14 persons per household. non-family households (464 | 44.7%) represent the smallest median household size with 1.22 persons per household.
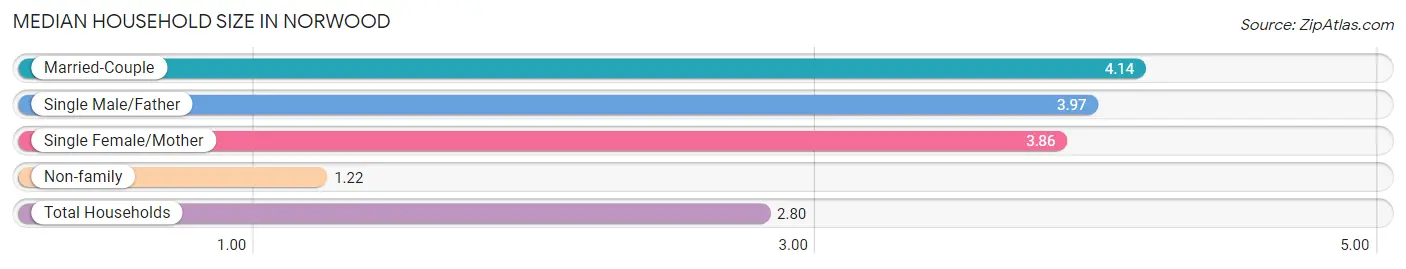
| Household Type | # Households | Household Size |
| Married-Couple | 415 (40.0%) | 4.14 |
| Single Male/Father | 102 (9.8%) | 3.97 |
| Single Female/Mother | 56 (5.4%) | 3.86 |
| Non-family | 464 (44.7%) | 1.22 |
| Total Households | 1,037 (100.0%) | 2.80 |
Household Size by Marriage Status in Norwood
Out of a total of 1,037 households in Norwood, 573 (55.3%) are family households, while 464 (44.7%) are nonfamily households. The most numerous type of family households are 2-person households, comprising 210, and the most common type of nonfamily households are 1-person households, comprising 391.
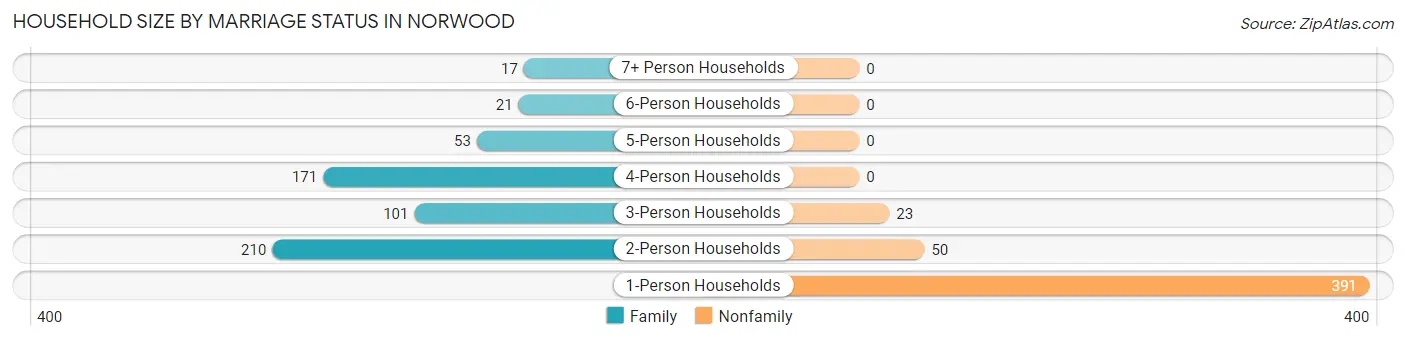
| Household Size | Family Households | Nonfamily Households |
| 1-Person Households | - | 391 (37.7%) |
| 2-Person Households | 210 (20.3%) | 50 (4.8%) |
| 3-Person Households | 101 (9.7%) | 23 (2.2%) |
| 4-Person Households | 171 (16.5%) | 0 (0.0%) |
| 5-Person Households | 53 (5.1%) | 0 (0.0%) |
| 6-Person Households | 21 (2.0%) | 0 (0.0%) |
| 7+ Person Households | 17 (1.6%) | 0 (0.0%) |
| Total | 573 (55.3%) | 464 (44.7%) |
Female Fertility in Norwood
Fertility by Age in Norwood
Average fertility rate in Norwood is 20.0 births per 1,000 women. Women in the age bracket of 15 to 19 years have the highest fertility rate with 103.0 births per 1,000 women. Women in the age bracket of 15 to 19 years acount for 100.0% of all women with births.
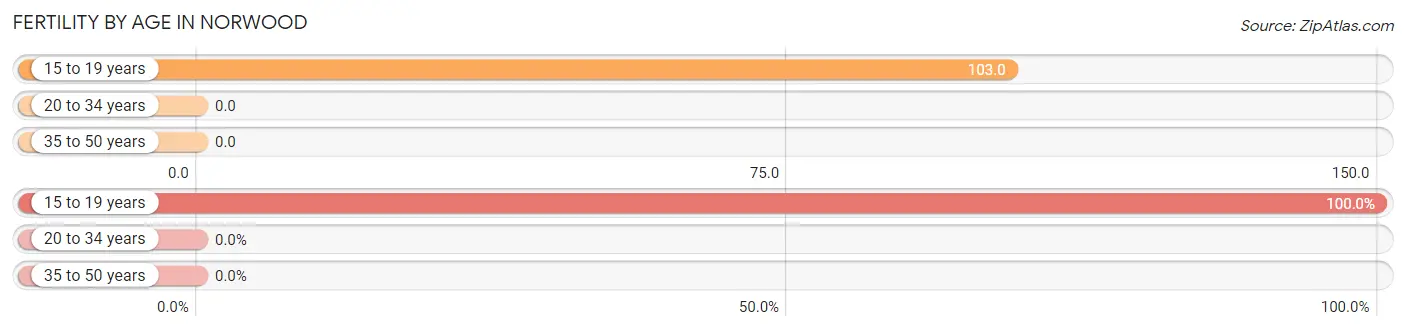
| Age Bracket | Women with Births | Births / 1,000 Women |
| 15 to 19 years | 12 (100.0%) | 103.0 |
| 20 to 34 years | 0 (0.0%) | 0.0 |
| 35 to 50 years | 0 (0.0%) | 0.0 |
| Total | 12 (100.0%) | 20.0 |
Fertility by Age by Marriage Status in Norwood
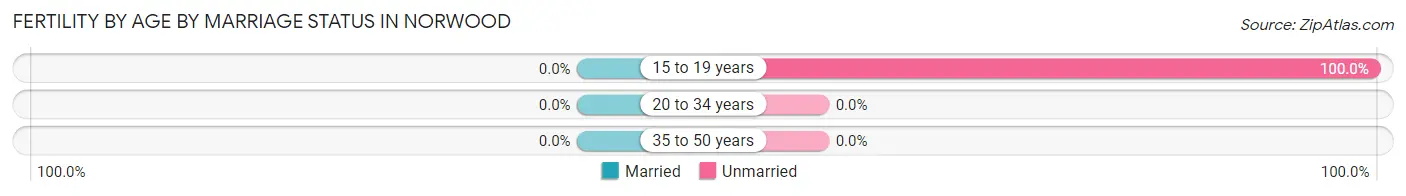
| Age Bracket | Married | Unmarried |
| 15 to 19 years | 0 (0.0%) | 12 (100.0%) |
| 20 to 34 years | 0 (0.0%) | 0 (0.0%) |
| 35 to 50 years | 0 (0.0%) | 0 (0.0%) |
| Total | 0 (0.0%) | 12 (100.0%) |
Fertility by Education in Norwood
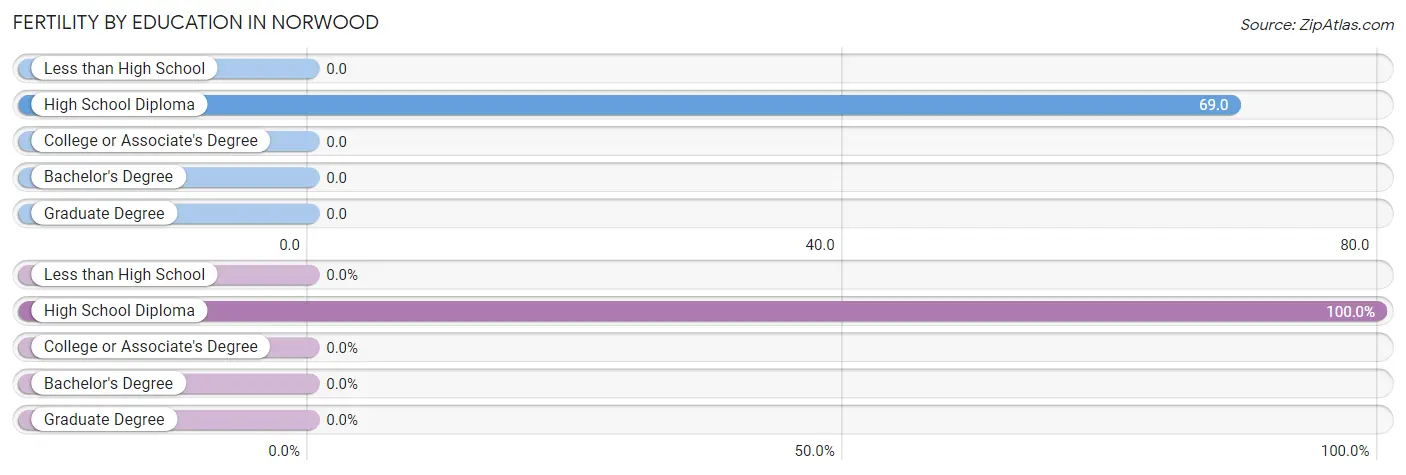
| Educational Attainment | Women with Births | Births / 1,000 Women |
| Less than High School | 0 (0.0%) | 0.0 |
| High School Diploma | 12 (100.0%) | 69.0 |
| College or Associate's Degree | 0 (0.0%) | 0.0 |
| Bachelor's Degree | 0 (0.0%) | 0.0 |
| Graduate Degree | 0 (0.0%) | 0.0 |
| Total | 12 (100.0%) | 20.0 |
Fertility by Education by Marriage Status in Norwood
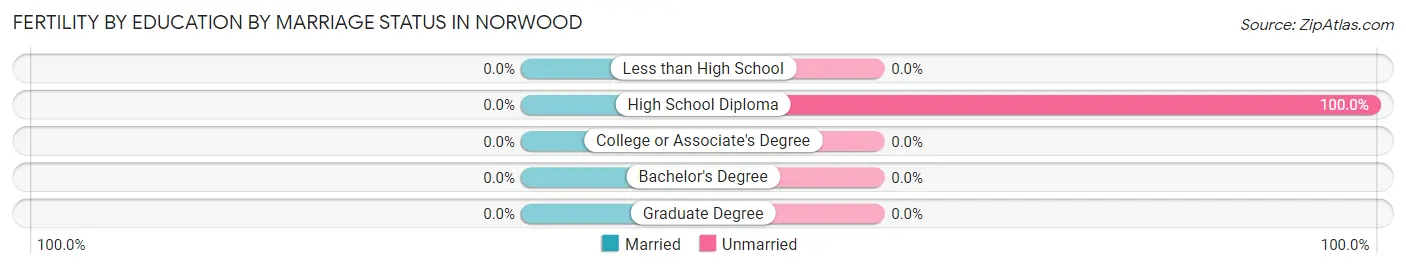
| Educational Attainment | Married | Unmarried |
| Less than High School | 0 (0.0%) | 0 (0.0%) |
| High School Diploma | 0 (0.0%) | 12 (100.0%) |
| College or Associate's Degree | 0 (0.0%) | 0 (0.0%) |
| Bachelor's Degree | 0 (0.0%) | 0 (0.0%) |
| Graduate Degree | 0 (0.0%) | 0 (0.0%) |
| Total | 0 (0.0%) | 12 (100.0%) |
Employment Characteristics in Norwood
Employment by Class of Employer in Norwood
Among the 1,408 employed individuals in Norwood, private company employees (967 | 68.7%), local government employees (148 | 10.5%), and self-employed (incorporated) (92 | 6.5%) make up the most common classes of employment.
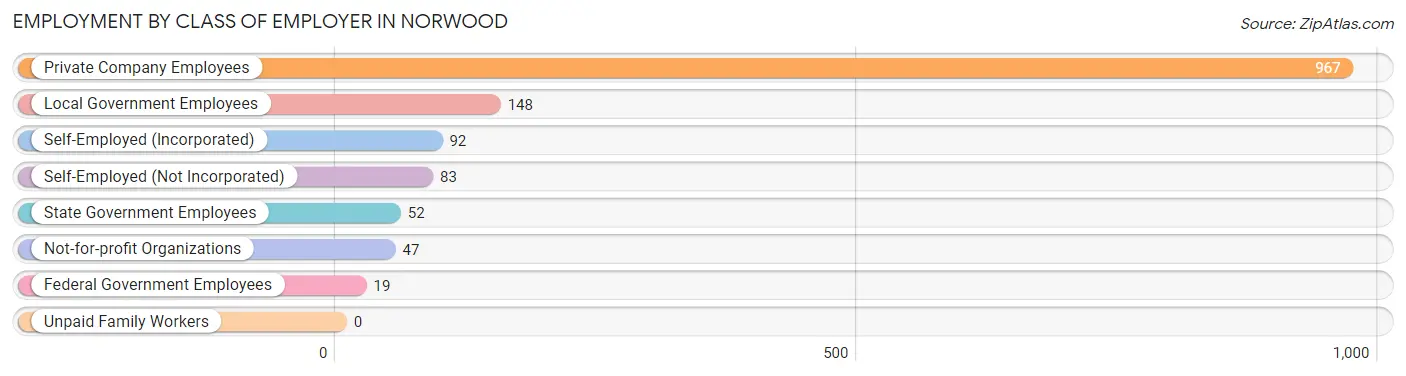
| Employer Class | # Employees | % Employees |
| Private Company Employees | 967 | 68.7% |
| Self-Employed (Incorporated) | 92 | 6.5% |
| Self-Employed (Not Incorporated) | 83 | 5.9% |
| Not-for-profit Organizations | 47 | 3.3% |
| Local Government Employees | 148 | 10.5% |
| State Government Employees | 52 | 3.7% |
| Federal Government Employees | 19 | 1.3% |
| Unpaid Family Workers | 0 | 0.0% |
| Total | 1,408 | 100.0% |
Employment Status by Age in Norwood
According to the labor force statistics for Norwood, out of the total population over 16 years of age (2,501), 61.7% or 1,543 individuals are in the labor force, with 5.1% or 79 of them unemployed. The age group with the highest labor force participation rate is 45 to 54 years, with 90.6% or 482 individuals in the labor force. Within the labor force, the 20 to 24 years age range has the highest percentage of unemployed individuals, with 8.7% or 13 of them being unemployed.
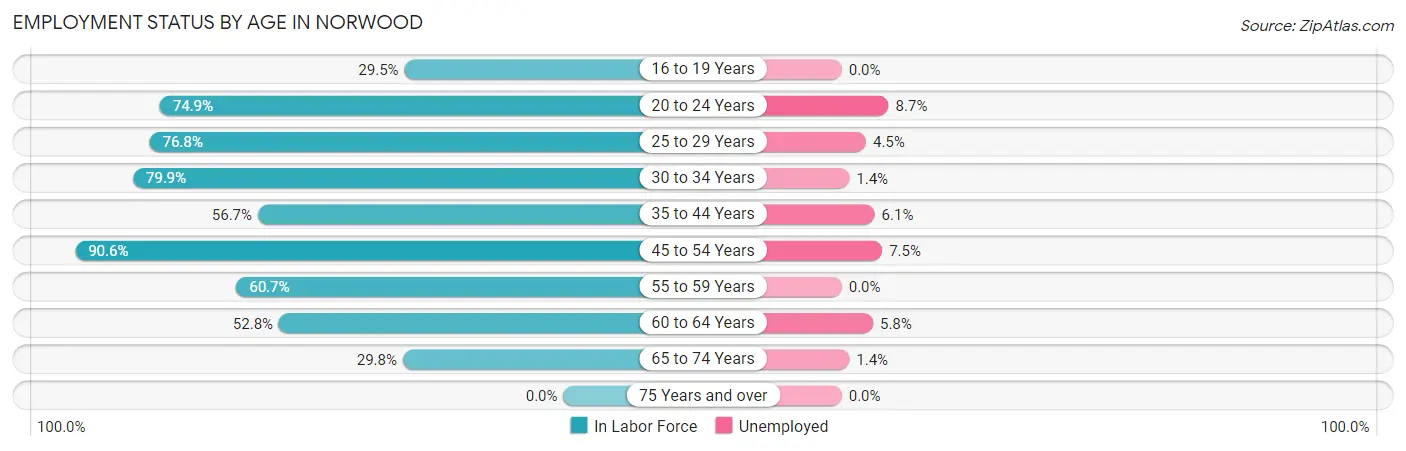
| Age Bracket | In Labor Force | Unemployed |
| 16 to 19 Years | 46 (29.5%) | 0 (0.0%) |
| 20 to 24 Years | 149 (74.9%) | 13 (8.7%) |
| 25 to 29 Years | 202 (76.8%) | 9 (4.5%) |
| 30 to 34 Years | 147 (79.9%) | 2 (1.4%) |
| 35 to 44 Years | 198 (56.7%) | 12 (6.1%) |
| 45 to 54 Years | 482 (90.6%) | 36 (7.5%) |
| 55 to 59 Years | 145 (60.7%) | 0 (0.0%) |
| 60 to 64 Years | 103 (52.8%) | 6 (5.8%) |
| 65 to 74 Years | 72 (29.8%) | 1 (1.4%) |
| 75 Years and over | 0 (0.0%) | 0 (0.0%) |
| Total | 1,543 (61.7%) | 79 (5.1%) |
Employment Status by Educational Attainment in Norwood
According to labor force statistics for Norwood, 72.5% of individuals (1,277) out of the total population between 25 and 64 years of age (1,762) are in the labor force, with 5.1% or 65 of them being unemployed. The group with the highest labor force participation rate are those with the educational attainment of bachelor's degree or higher, with 89.4% or 328 individuals in the labor force. Within the labor force, individuals with less than high school education have the highest percentage of unemployment, with 20.5% or 32 of them being unemployed.
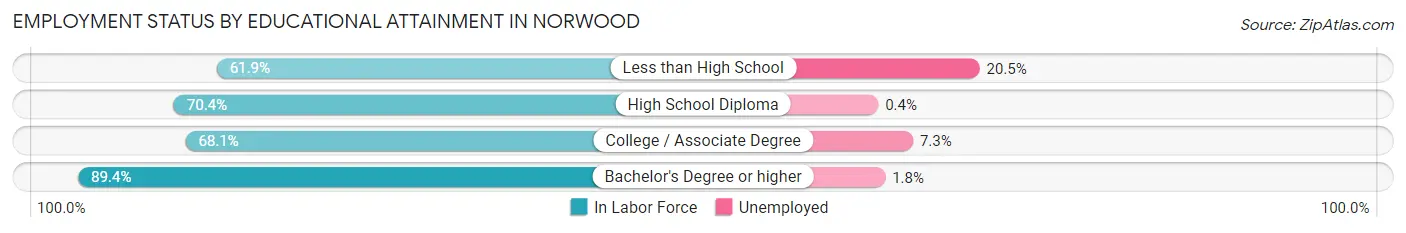
| Educational Attainment | In Labor Force | Unemployed |
| Less than High School | 156 (61.9%) | 52 (20.5%) |
| High School Diploma | 449 (70.4%) | 3 (0.4%) |
| College / Associate Degree | 344 (68.1%) | 37 (7.3%) |
| Bachelor's Degree or higher | 328 (89.4%) | 7 (1.8%) |
| Total | 1,277 (72.5%) | 90 (5.1%) |
Employment Occupations by Sex in Norwood
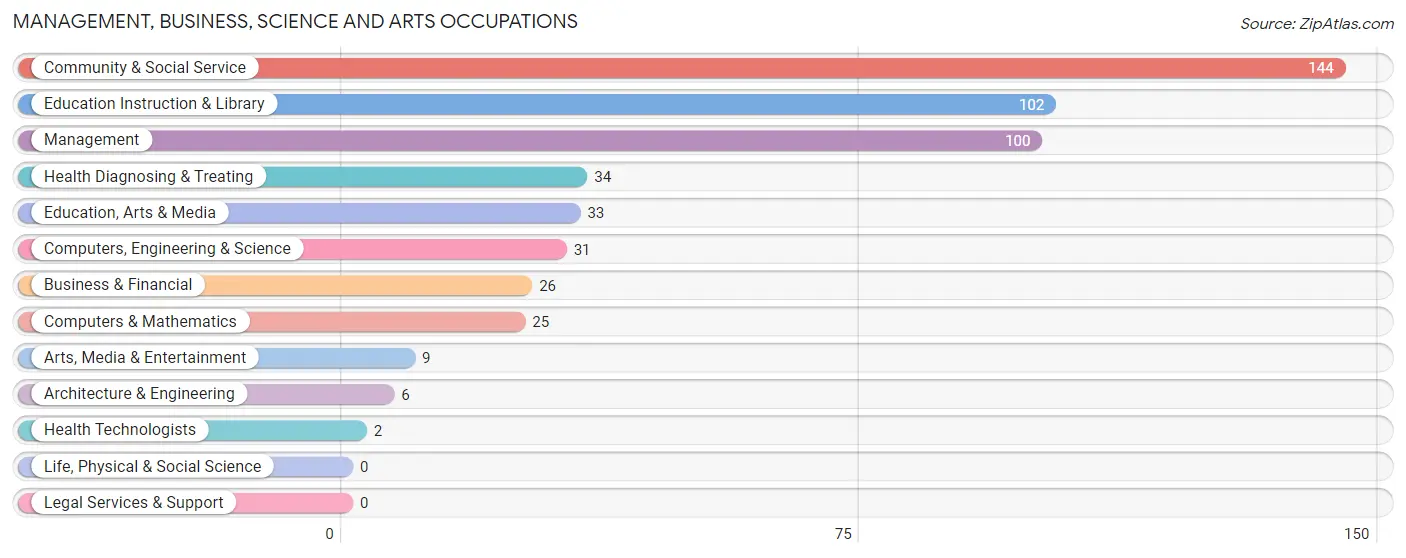
Management, Business, Science and Arts Occupations
The most common Management, Business, Science and Arts occupations in Norwood are Community & Social Service (144 | 9.8%), Education Instruction & Library (102 | 7.0%), Management (100 | 6.8%), Health Diagnosing & Treating (34 | 2.3%), and Education, Arts & Media (33 | 2.2%).
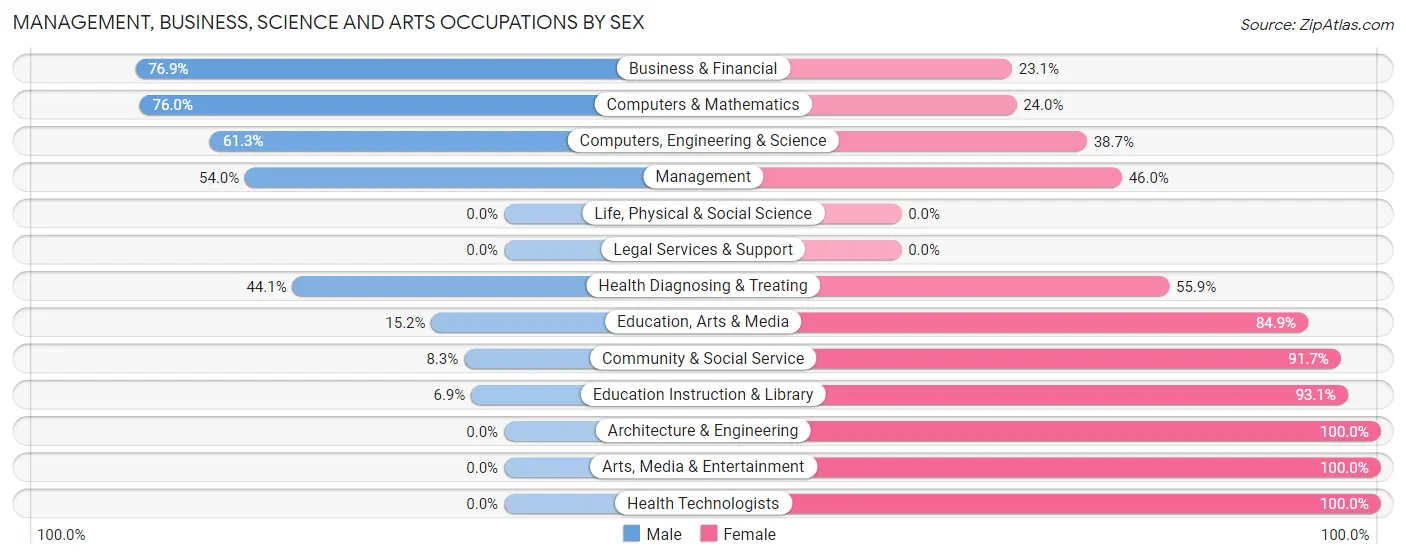
Management, Business, Science and Arts Occupations by Sex
Within the Management, Business, Science and Arts occupations in Norwood, the most male-oriented occupations are Business & Financial (76.9%), Computers & Mathematics (76.0%), and Computers, Engineering & Science (61.3%), while the most female-oriented occupations are Architecture & Engineering (100.0%), Arts, Media & Entertainment (100.0%), and Health Technologists (100.0%).
| Occupation | Male | Female |
| Management | 54 (54.0%) | 46 (46.0%) |
| Business & Financial | 20 (76.9%) | 6 (23.1%) |
| Computers, Engineering & Science | 19 (61.3%) | 12 (38.7%) |
| Computers & Mathematics | 19 (76.0%) | 6 (24.0%) |
| Architecture & Engineering | 0 (0.0%) | 6 (100.0%) |
| Life, Physical & Social Science | 0 (0.0%) | 0 (0.0%) |
| Community & Social Service | 12 (8.3%) | 132 (91.7%) |
| Education, Arts & Media | 5 (15.1%) | 28 (84.9%) |
| Legal Services & Support | 0 (0.0%) | 0 (0.0%) |
| Education Instruction & Library | 7 (6.9%) | 95 (93.1%) |
| Arts, Media & Entertainment | 0 (0.0%) | 9 (100.0%) |
| Health Diagnosing & Treating | 15 (44.1%) | 19 (55.9%) |
| Health Technologists | 0 (0.0%) | 2 (100.0%) |
| Total (Category) | 120 (35.8%) | 215 (64.2%) |
| Total (Overall) | 1,006 (68.7%) | 459 (31.3%) |
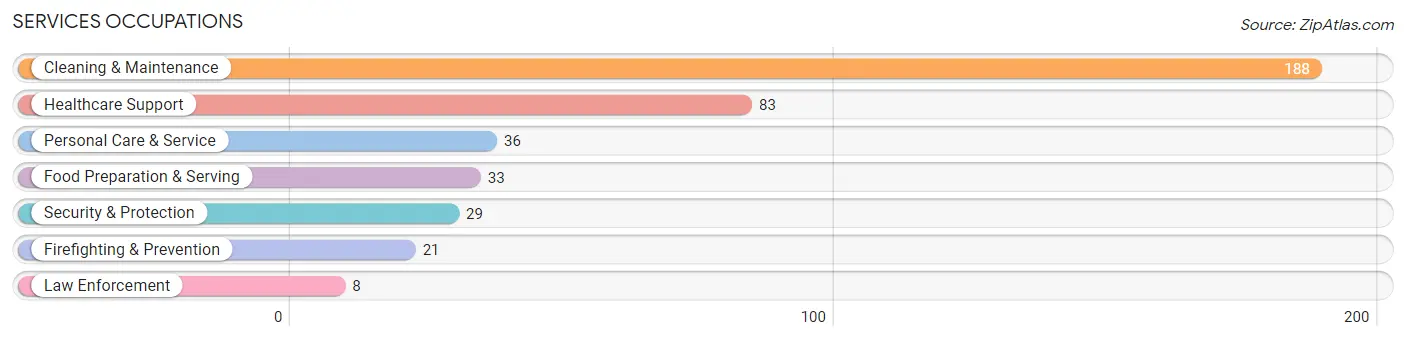
Services Occupations
The most common Services occupations in Norwood are Cleaning & Maintenance (188 | 12.8%), Healthcare Support (83 | 5.7%), Personal Care & Service (36 | 2.5%), Food Preparation & Serving (33 | 2.2%), and Security & Protection (29 | 2.0%).
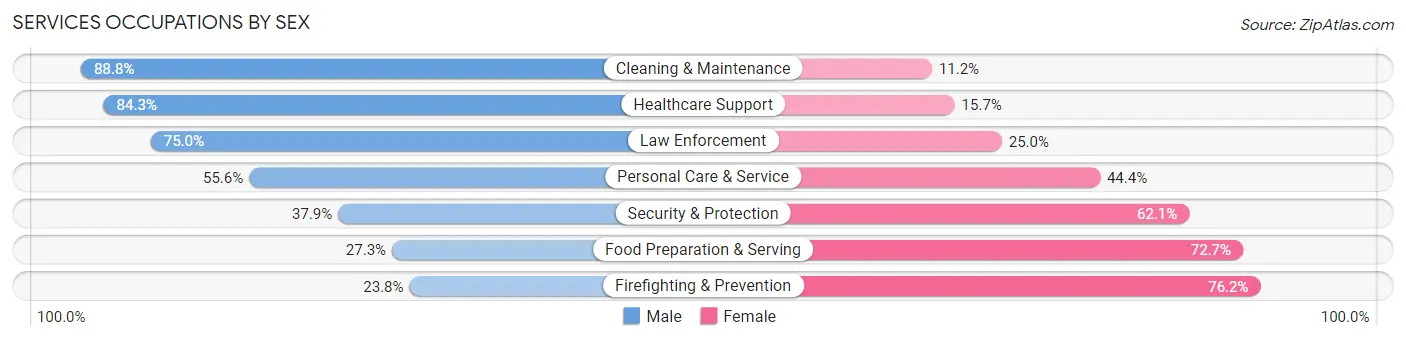
Services Occupations by Sex
Within the Services occupations in Norwood, the most male-oriented occupations are Cleaning & Maintenance (88.8%), Healthcare Support (84.3%), and Law Enforcement (75.0%), while the most female-oriented occupations are Firefighting & Prevention (76.2%), Food Preparation & Serving (72.7%), and Security & Protection (62.1%).
| Occupation | Male | Female |
| Healthcare Support | 70 (84.3%) | 13 (15.7%) |
| Security & Protection | 11 (37.9%) | 18 (62.1%) |
| Firefighting & Prevention | 5 (23.8%) | 16 (76.2%) |
| Law Enforcement | 6 (75.0%) | 2 (25.0%) |
| Food Preparation & Serving | 9 (27.3%) | 24 (72.7%) |
| Cleaning & Maintenance | 167 (88.8%) | 21 (11.2%) |
| Personal Care & Service | 20 (55.6%) | 16 (44.4%) |
| Total (Category) | 277 (75.1%) | 92 (24.9%) |
| Total (Overall) | 1,006 (68.7%) | 459 (31.3%) |
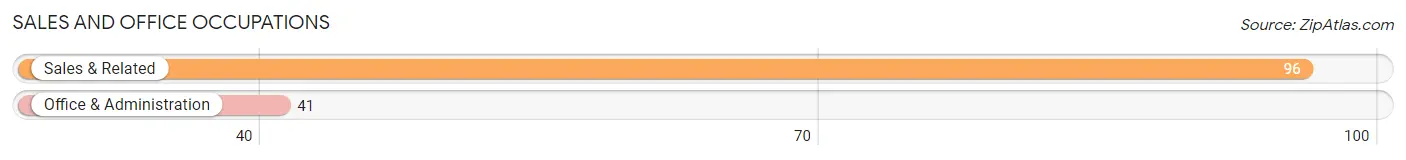
Sales and Office Occupations
The most common Sales and Office occupations in Norwood are Sales & Related (96 | 6.6%), and Office & Administration (41 | 2.8%).
Sales and Office Occupations by Sex
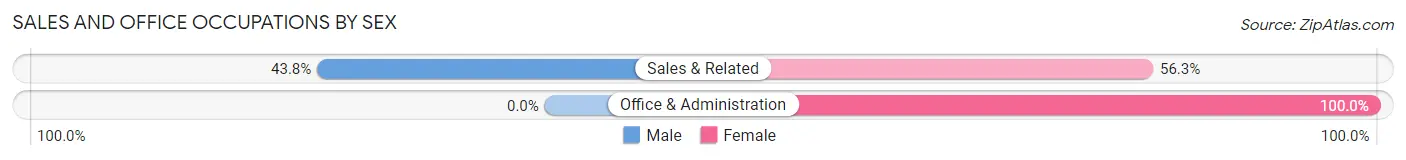
| Occupation | Male | Female |
| Sales & Related | 42 (43.8%) | 54 (56.2%) |
| Office & Administration | 0 (0.0%) | 41 (100.0%) |
| Total (Category) | 42 (30.7%) | 95 (69.3%) |
| Total (Overall) | 1,006 (68.7%) | 459 (31.3%) |
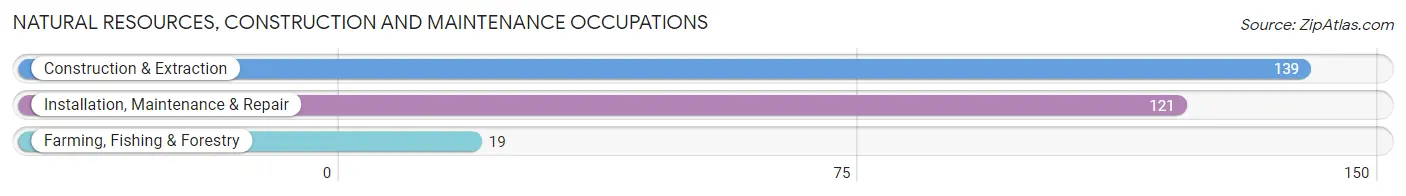
Natural Resources, Construction and Maintenance Occupations
The most common Natural Resources, Construction and Maintenance occupations in Norwood are Construction & Extraction (139 | 9.5%), Installation, Maintenance & Repair (121 | 8.3%), and Farming, Fishing & Forestry (19 | 1.3%).
Natural Resources, Construction and Maintenance Occupations by Sex
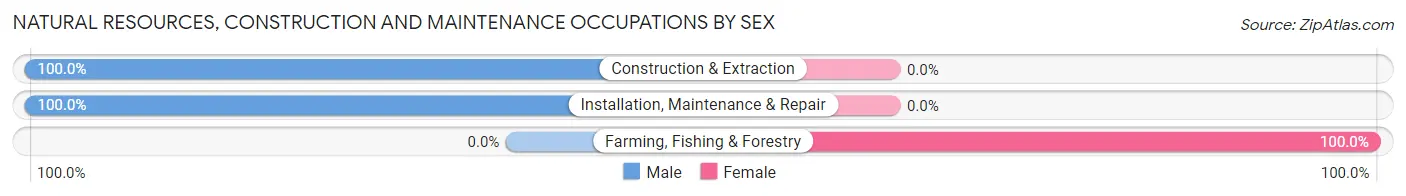
| Occupation | Male | Female |
| Farming, Fishing & Forestry | 0 (0.0%) | 19 (100.0%) |
| Construction & Extraction | 139 (100.0%) | 0 (0.0%) |
| Installation, Maintenance & Repair | 121 (100.0%) | 0 (0.0%) |
| Total (Category) | 260 (93.2%) | 19 (6.8%) |
| Total (Overall) | 1,006 (68.7%) | 459 (31.3%) |
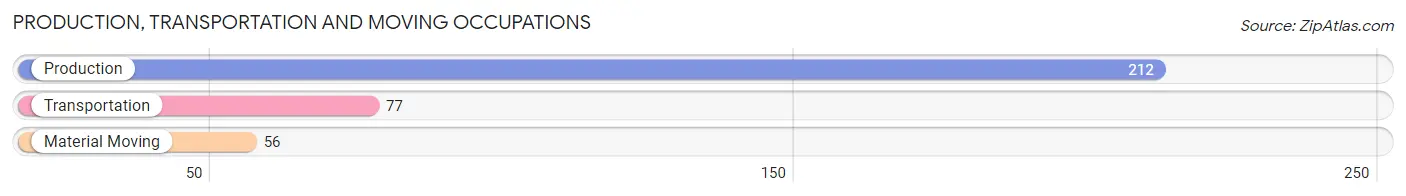
Production, Transportation and Moving Occupations
The most common Production, Transportation and Moving occupations in Norwood are Production (212 | 14.5%), Transportation (77 | 5.3%), and Material Moving (56 | 3.8%).
Production, Transportation and Moving Occupations by Sex
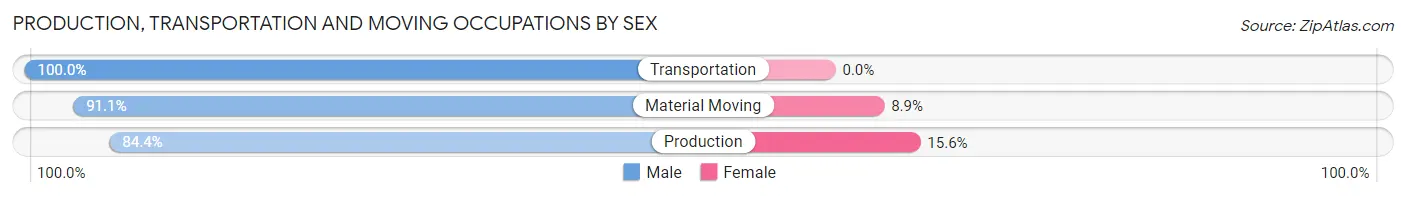
| Occupation | Male | Female |
| Production | 179 (84.4%) | 33 (15.6%) |
| Transportation | 77 (100.0%) | 0 (0.0%) |
| Material Moving | 51 (91.1%) | 5 (8.9%) |
| Total (Category) | 307 (89.0%) | 38 (11.0%) |
| Total (Overall) | 1,006 (68.7%) | 459 (31.3%) |
Employment Industries by Sex in Norwood
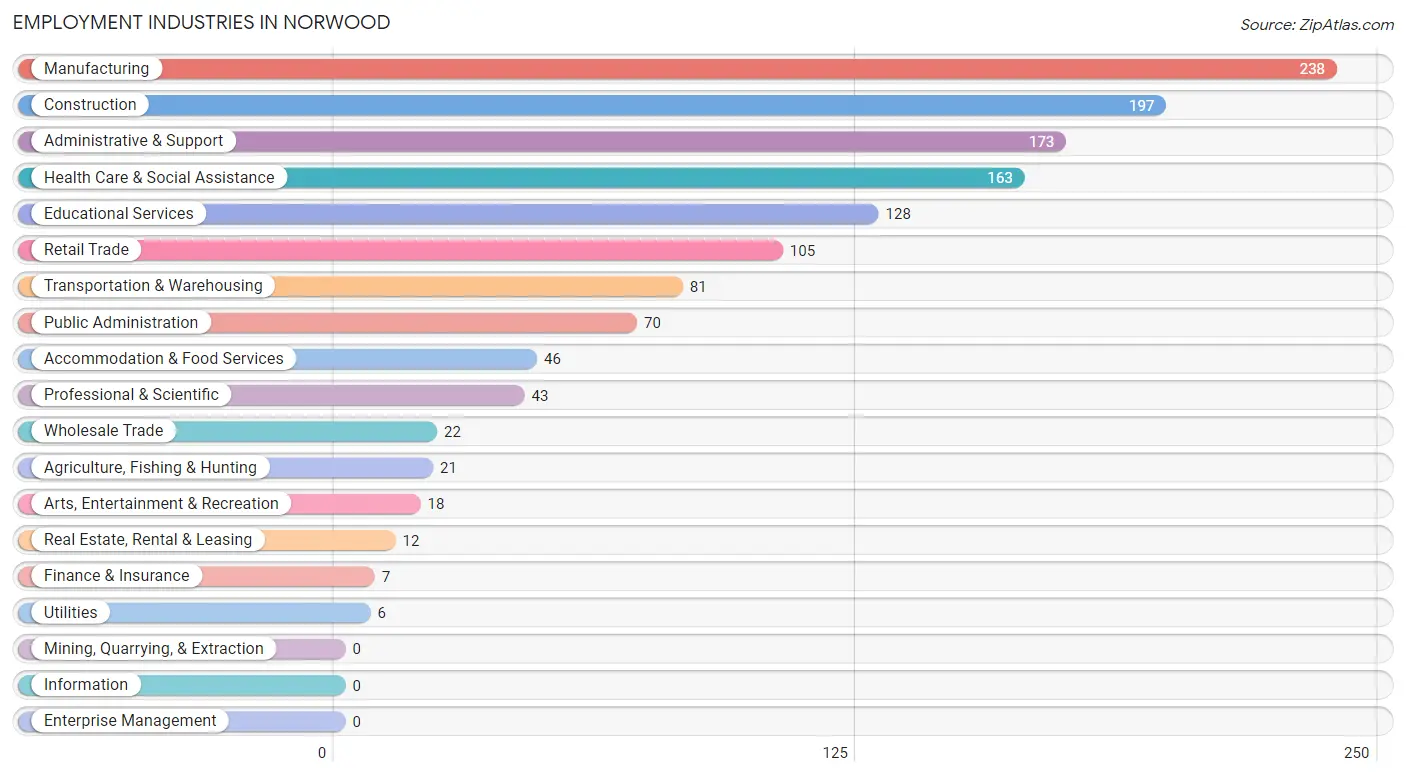
Employment Industries in Norwood
The major employment industries in Norwood include Manufacturing (238 | 16.3%), Construction (197 | 13.5%), Administrative & Support (173 | 11.8%), Health Care & Social Assistance (163 | 11.1%), and Educational Services (128 | 8.7%).
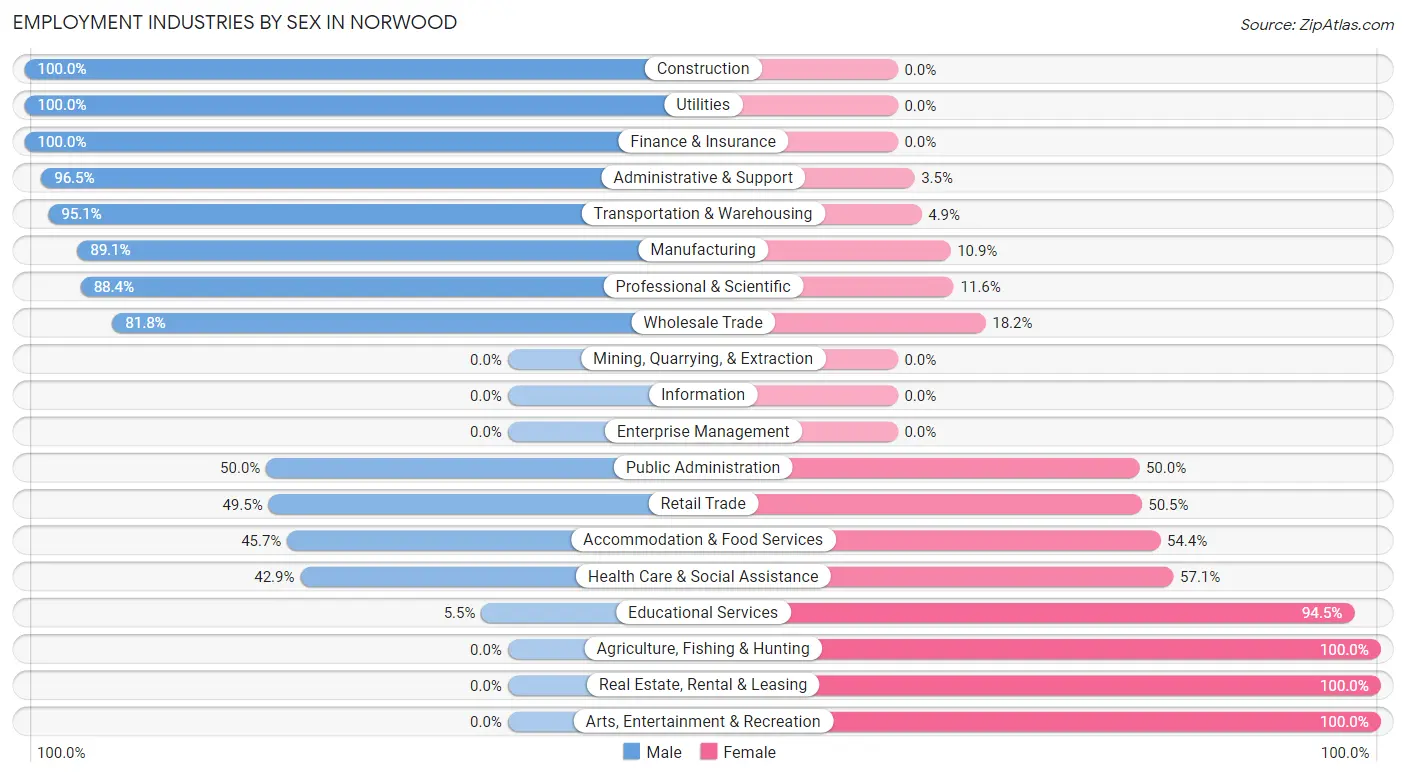
Employment Industries by Sex in Norwood
The Norwood industries that see more men than women are Construction (100.0%), Utilities (100.0%), and Finance & Insurance (100.0%), whereas the industries that tend to have a higher number of women are Agriculture, Fishing & Hunting (100.0%), Real Estate, Rental & Leasing (100.0%), and Arts, Entertainment & Recreation (100.0%).
| Industry | Male | Female |
| Agriculture, Fishing & Hunting | 0 (0.0%) | 21 (100.0%) |
| Mining, Quarrying, & Extraction | 0 (0.0%) | 0 (0.0%) |
| Construction | 197 (100.0%) | 0 (0.0%) |
| Manufacturing | 212 (89.1%) | 26 (10.9%) |
| Wholesale Trade | 18 (81.8%) | 4 (18.2%) |
| Retail Trade | 52 (49.5%) | 53 (50.5%) |
| Transportation & Warehousing | 77 (95.1%) | 4 (4.9%) |
| Utilities | 6 (100.0%) | 0 (0.0%) |
| Information | 0 (0.0%) | 0 (0.0%) |
| Finance & Insurance | 7 (100.0%) | 0 (0.0%) |
| Real Estate, Rental & Leasing | 0 (0.0%) | 12 (100.0%) |
| Professional & Scientific | 38 (88.4%) | 5 (11.6%) |
| Enterprise Management | 0 (0.0%) | 0 (0.0%) |
| Administrative & Support | 167 (96.5%) | 6 (3.5%) |
| Educational Services | 7 (5.5%) | 121 (94.5%) |
| Health Care & Social Assistance | 70 (42.9%) | 93 (57.1%) |
| Arts, Entertainment & Recreation | 0 (0.0%) | 18 (100.0%) |
| Accommodation & Food Services | 21 (45.7%) | 25 (54.3%) |
| Public Administration | 35 (50.0%) | 35 (50.0%) |
| Total | 1,006 (68.7%) | 459 (31.3%) |
Education in Norwood
School Enrollment in Norwood
The most common levels of schooling among the 478 students in Norwood are high school (152 | 31.8%), middle school (125 | 26.2%), and elementary school (96 | 20.1%).
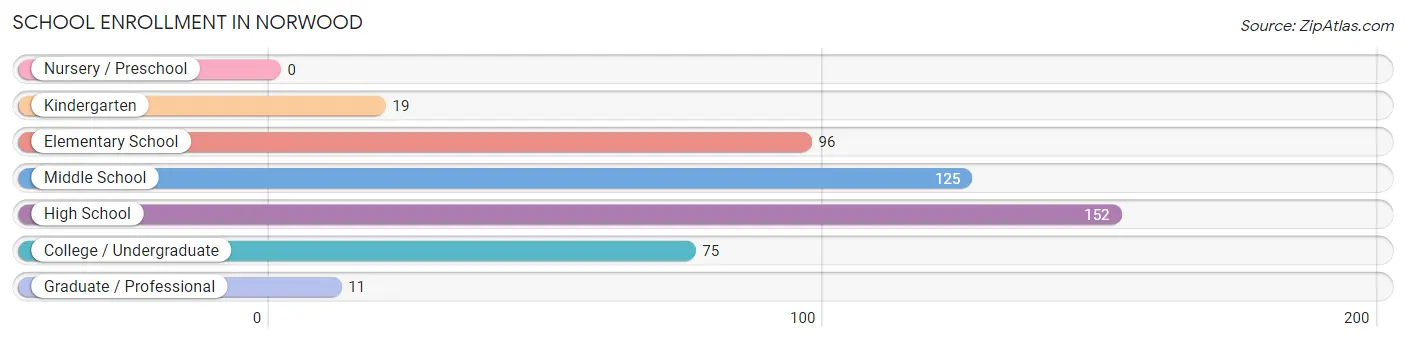
| School Level | # Students | % Students |
| Nursery / Preschool | 0 | 0.0% |
| Kindergarten | 19 | 4.0% |
| Elementary School | 96 | 20.1% |
| Middle School | 125 | 26.2% |
| High School | 152 | 31.8% |
| College / Undergraduate | 75 | 15.7% |
| Graduate / Professional | 11 | 2.3% |
| Total | 478 | 100.0% |
School Enrollment by Age by Funding Source in Norwood
Out of a total of 478 students who are enrolled in schools in Norwood, 39 (8.2%) attend a private institution, while the remaining 439 (91.8%) are enrolled in public schools. The age group of 35 years and over has the highest likelihood of being enrolled in private schools, with 9 (27.3% in the age bracket) enrolled. Conversely, the age group of 18 to 19 year olds has the lowest likelihood of being enrolled in a private school, with 27 (100.0% in the age bracket) attending a public institution.
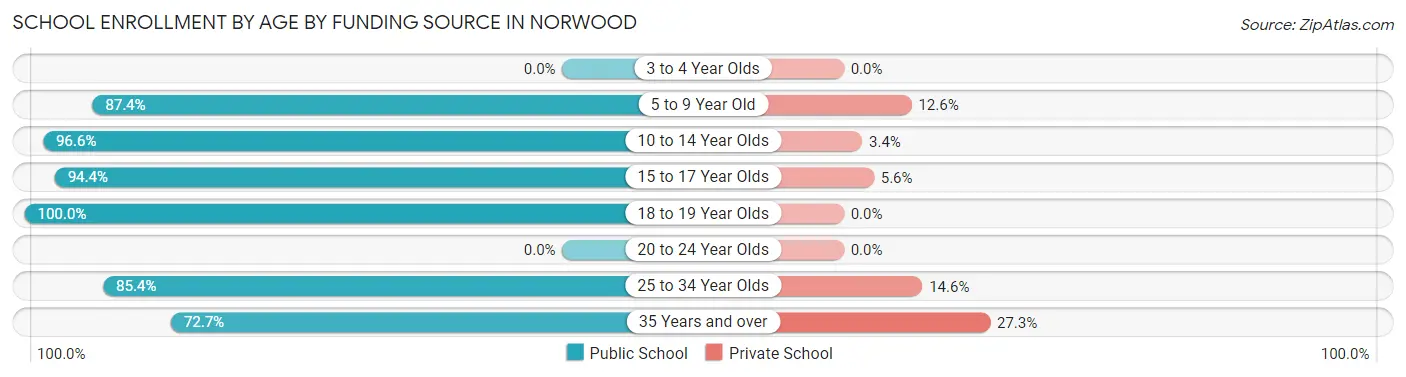
| Age Bracket | Public School | Private School |
| 3 to 4 Year Olds | 0 (0.0%) | 0 (0.0%) |
| 5 to 9 Year Old | 83 (87.4%) | 12 (12.6%) |
| 10 to 14 Year Olds | 169 (96.6%) | 6 (3.4%) |
| 15 to 17 Year Olds | 101 (94.4%) | 6 (5.6%) |
| 18 to 19 Year Olds | 27 (100.0%) | 0 (0.0%) |
| 20 to 24 Year Olds | 0 (0.0%) | 0 (0.0%) |
| 25 to 34 Year Olds | 35 (85.4%) | 6 (14.6%) |
| 35 Years and over | 24 (72.7%) | 9 (27.3%) |
| Total | 439 (91.8%) | 39 (8.2%) |
Educational Attainment by Field of Study in Norwood
Arts & humanities (148 | 36.2%), business (79 | 19.3%), science & technology (56 | 13.7%), education (21 | 5.1%), and engineering (20 | 4.9%) are the most common fields of study among 409 individuals in Norwood who have obtained a bachelor's degree or higher.
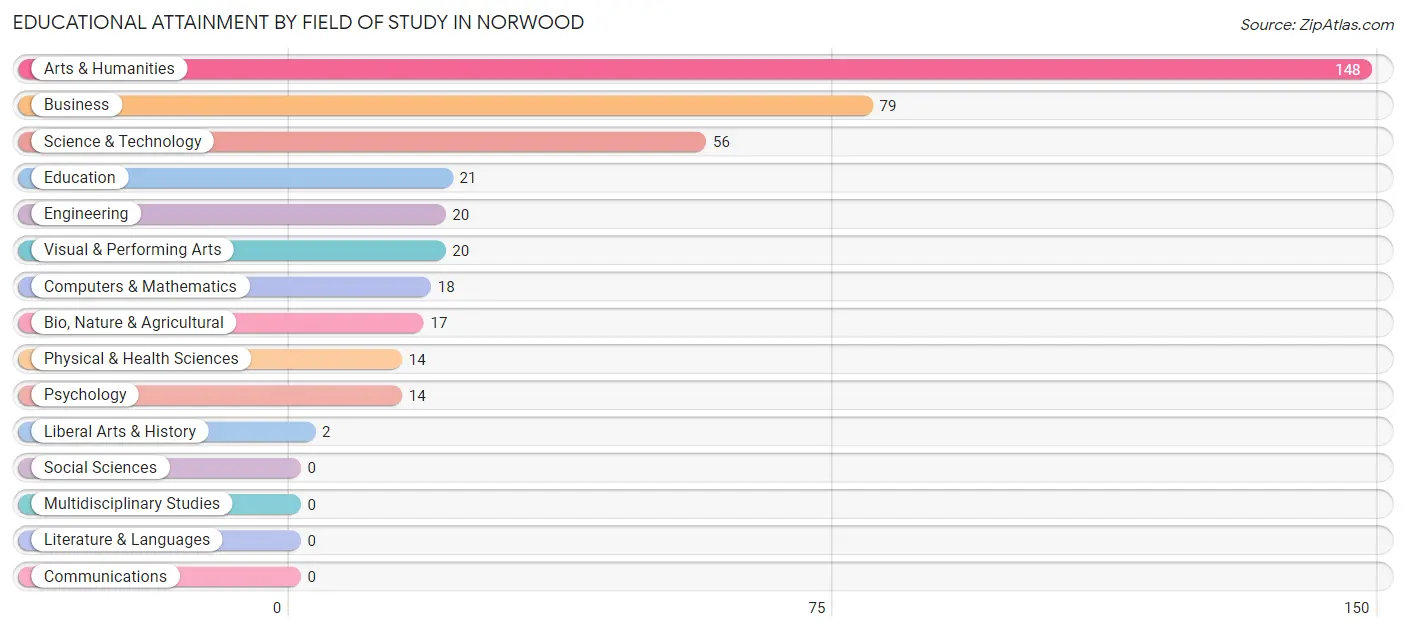
| Field of Study | # Graduates | % Graduates |
| Computers & Mathematics | 18 | 4.4% |
| Bio, Nature & Agricultural | 17 | 4.2% |
| Physical & Health Sciences | 14 | 3.4% |
| Psychology | 14 | 3.4% |
| Social Sciences | 0 | 0.0% |
| Engineering | 20 | 4.9% |
| Multidisciplinary Studies | 0 | 0.0% |
| Science & Technology | 56 | 13.7% |
| Business | 79 | 19.3% |
| Education | 21 | 5.1% |
| Literature & Languages | 0 | 0.0% |
| Liberal Arts & History | 2 | 0.5% |
| Visual & Performing Arts | 20 | 4.9% |
| Communications | 0 | 0.0% |
| Arts & Humanities | 148 | 36.2% |
| Total | 409 | 100.0% |
Transportation & Commute in Norwood
Vehicle Availability by Sex in Norwood
The most prevalent vehicle ownership categories in Norwood are males with 3 vehicles (567, accounting for 59.0%) and females with 3 vehicles (143, making up 126.8%).
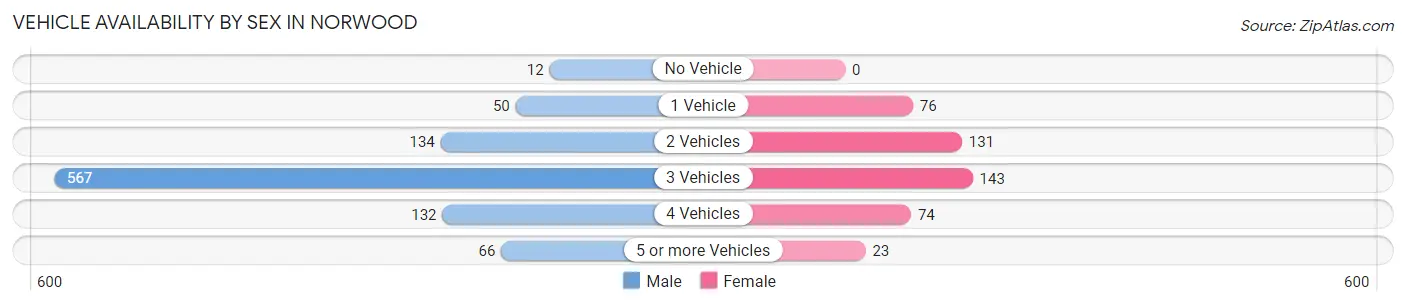
| Vehicles Available | Male | Female |
| No Vehicle | 12 (1.3%) | 0 (0.0%) |
| 1 Vehicle | 50 (5.2%) | 76 (17.0%) |
| 2 Vehicles | 134 (13.9%) | 131 (29.3%) |
| 3 Vehicles | 567 (59.0%) | 143 (32.0%) |
| 4 Vehicles | 132 (13.7%) | 74 (16.6%) |
| 5 or more Vehicles | 66 (6.9%) | 23 (5.1%) |
| Total | 961 (100.0%) | 447 (100.0%) |
Commute Time in Norwood
The most frequently occuring commute durations in Norwood are 20 to 24 minutes (249 commuters, 19.1%), 5 to 9 minutes (172 commuters, 13.2%), and 15 to 19 minutes (167 commuters, 12.8%).
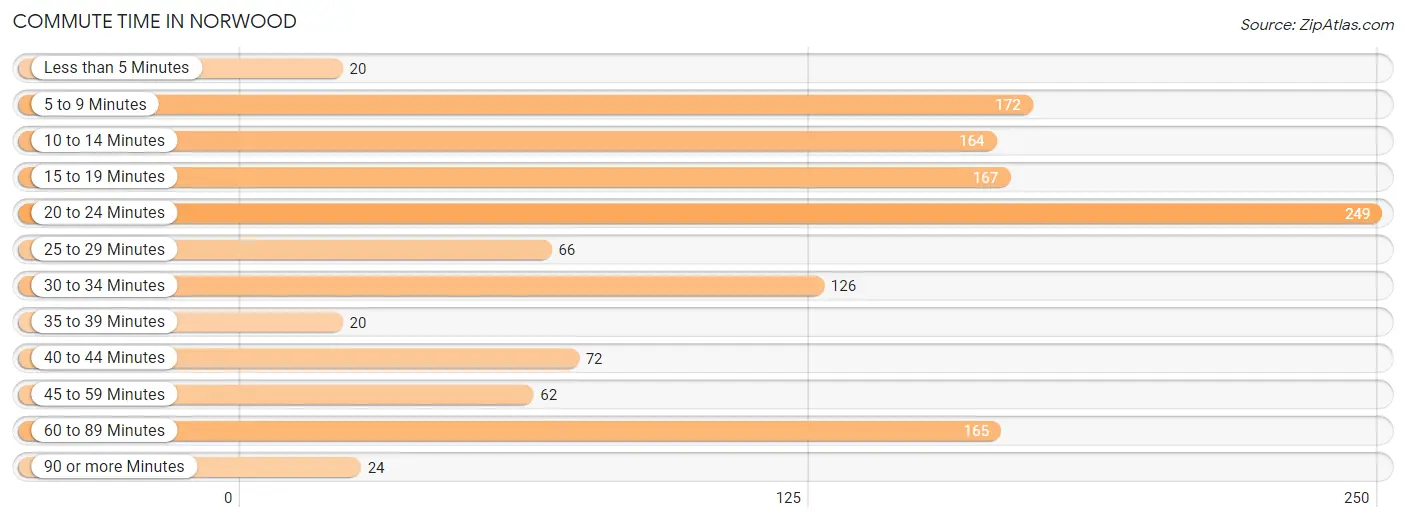
| Commute Time | # Commuters | % Commuters |
| Less than 5 Minutes | 20 | 1.5% |
| 5 to 9 Minutes | 172 | 13.2% |
| 10 to 14 Minutes | 164 | 12.6% |
| 15 to 19 Minutes | 167 | 12.8% |
| 20 to 24 Minutes | 249 | 19.1% |
| 25 to 29 Minutes | 66 | 5.1% |
| 30 to 34 Minutes | 126 | 9.6% |
| 35 to 39 Minutes | 20 | 1.5% |
| 40 to 44 Minutes | 72 | 5.5% |
| 45 to 59 Minutes | 62 | 4.7% |
| 60 to 89 Minutes | 165 | 12.6% |
| 90 or more Minutes | 24 | 1.8% |
Commute Time by Sex in Norwood
The most common commute times in Norwood are 20 to 24 minutes (173 commuters, 19.2%) for males and 20 to 24 minutes (76 commuters, 18.8%) for females.
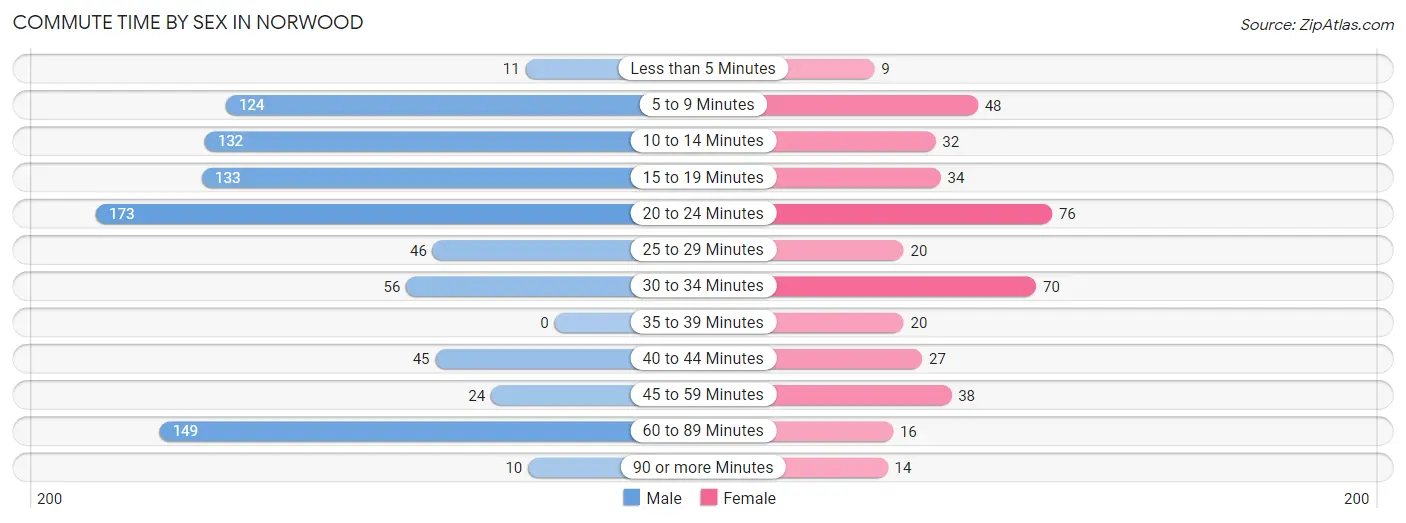
| Commute Time | Male | Female |
| Less than 5 Minutes | 11 (1.2%) | 9 (2.2%) |
| 5 to 9 Minutes | 124 (13.7%) | 48 (11.9%) |
| 10 to 14 Minutes | 132 (14.6%) | 32 (7.9%) |
| 15 to 19 Minutes | 133 (14.7%) | 34 (8.4%) |
| 20 to 24 Minutes | 173 (19.2%) | 76 (18.8%) |
| 25 to 29 Minutes | 46 (5.1%) | 20 (5.0%) |
| 30 to 34 Minutes | 56 (6.2%) | 70 (17.3%) |
| 35 to 39 Minutes | 0 (0.0%) | 20 (5.0%) |
| 40 to 44 Minutes | 45 (5.0%) | 27 (6.7%) |
| 45 to 59 Minutes | 24 (2.7%) | 38 (9.4%) |
| 60 to 89 Minutes | 149 (16.5%) | 16 (4.0%) |
| 90 or more Minutes | 10 (1.1%) | 14 (3.5%) |
Time of Departure to Work by Sex in Norwood
The most frequent times of departure to work in Norwood are 7:00 AM to 7:29 AM (160, 17.7%) for males and 7:00 AM to 7:29 AM (109, 27.0%) for females.
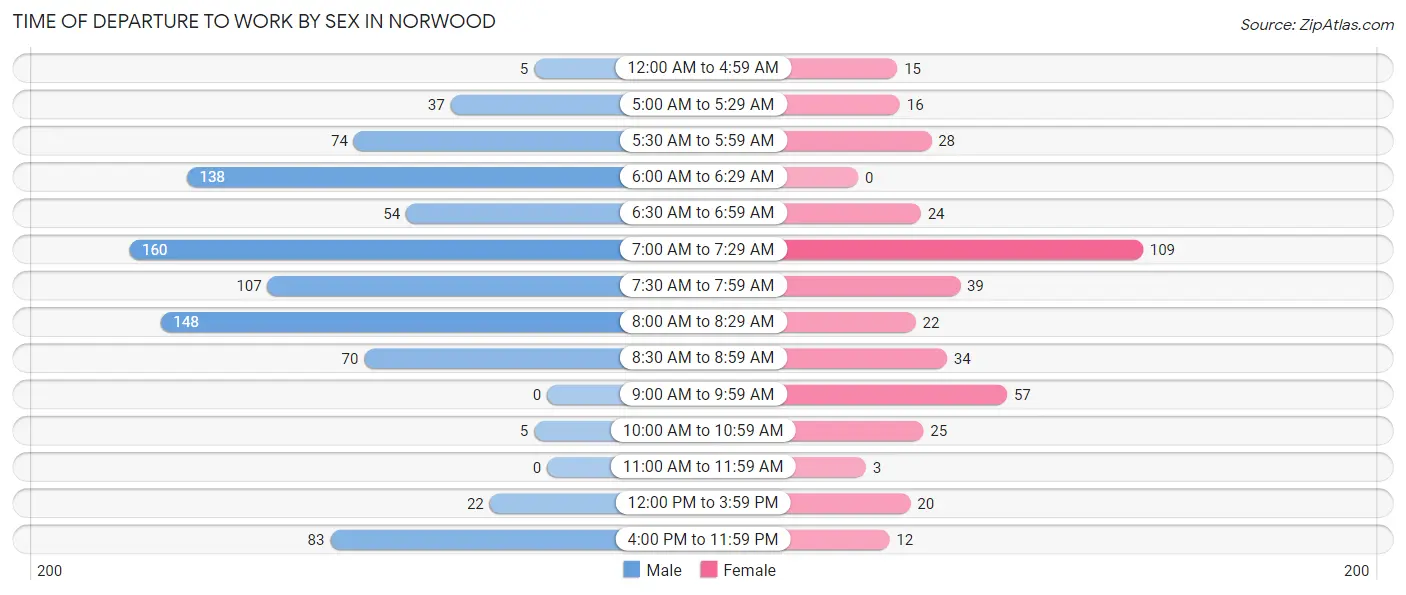
| Time of Departure | Male | Female |
| 12:00 AM to 4:59 AM | 5 (0.5%) | 15 (3.7%) |
| 5:00 AM to 5:29 AM | 37 (4.1%) | 16 (4.0%) |
| 5:30 AM to 5:59 AM | 74 (8.2%) | 28 (6.9%) |
| 6:00 AM to 6:29 AM | 138 (15.3%) | 0 (0.0%) |
| 6:30 AM to 6:59 AM | 54 (6.0%) | 24 (5.9%) |
| 7:00 AM to 7:29 AM | 160 (17.7%) | 109 (27.0%) |
| 7:30 AM to 7:59 AM | 107 (11.8%) | 39 (9.7%) |
| 8:00 AM to 8:29 AM | 148 (16.4%) | 22 (5.4%) |
| 8:30 AM to 8:59 AM | 70 (7.7%) | 34 (8.4%) |
| 9:00 AM to 9:59 AM | 0 (0.0%) | 57 (14.1%) |
| 10:00 AM to 10:59 AM | 5 (0.5%) | 25 (6.2%) |
| 11:00 AM to 11:59 AM | 0 (0.0%) | 3 (0.7%) |
| 12:00 PM to 3:59 PM | 22 (2.4%) | 20 (5.0%) |
| 4:00 PM to 11:59 PM | 83 (9.2%) | 12 (3.0%) |
| Total | 903 (100.0%) | 404 (100.0%) |
Housing Occupancy in Norwood
Occupancy by Ownership in Norwood
Of the total 1,037 dwellings in Norwood, owner-occupied units account for 665 (64.1%), while renter-occupied units make up 372 (35.9%).
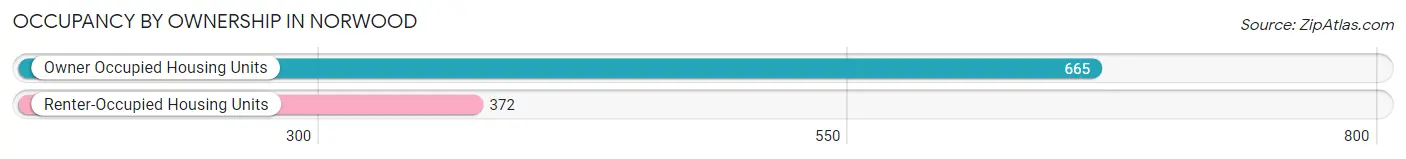
| Occupancy | # Housing Units | % Housing Units |
| Owner Occupied Housing Units | 665 | 64.1% |
| Renter-Occupied Housing Units | 372 | 35.9% |
| Total Occupied Housing Units | 1,037 | 100.0% |
Occupancy by Household Size in Norwood
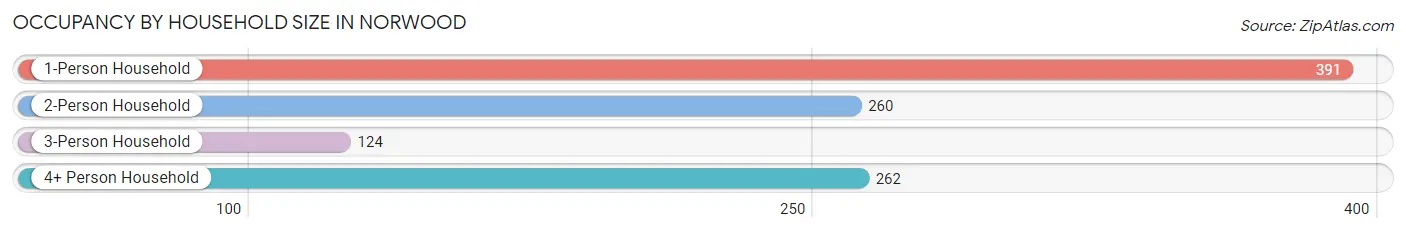
| Household Size | # Housing Units | % Housing Units |
| 1-Person Household | 391 | 37.7% |
| 2-Person Household | 260 | 25.1% |
| 3-Person Household | 124 | 12.0% |
| 4+ Person Household | 262 | 25.3% |
| Total Housing Units | 1,037 | 100.0% |
Occupancy by Ownership by Household Size in Norwood
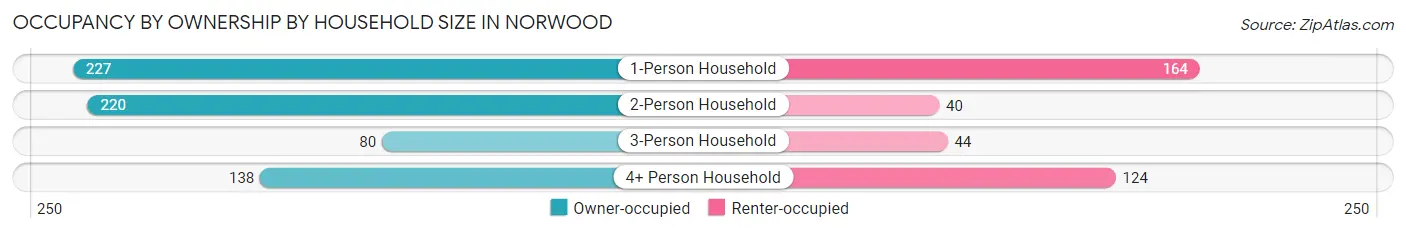
| Household Size | Owner-occupied | Renter-occupied |
| 1-Person Household | 227 (58.1%) | 164 (41.9%) |
| 2-Person Household | 220 (84.6%) | 40 (15.4%) |
| 3-Person Household | 80 (64.5%) | 44 (35.5%) |
| 4+ Person Household | 138 (52.7%) | 124 (47.3%) |
| Total Housing Units | 665 (64.1%) | 372 (35.9%) |
Occupancy by Educational Attainment in Norwood
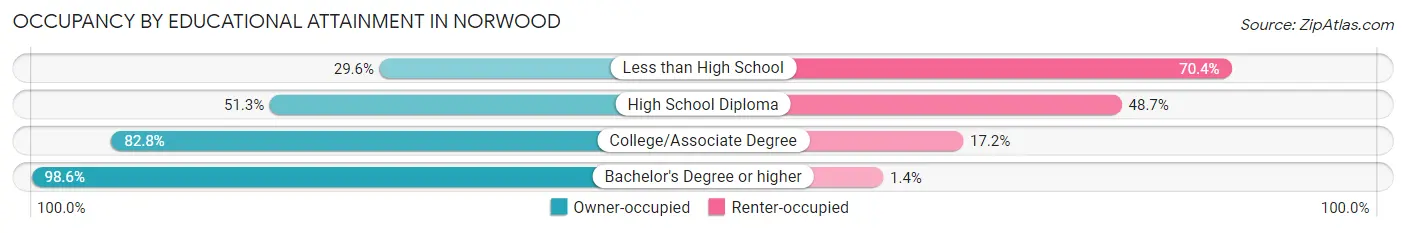
| Household Size | Owner-occupied | Renter-occupied |
| Less than High School | 42 (29.6%) | 100 (70.4%) |
| High School Diploma | 230 (51.3%) | 218 (48.7%) |
| College/Associate Degree | 250 (82.8%) | 52 (17.2%) |
| Bachelor's Degree or higher | 143 (98.6%) | 2 (1.4%) |
Occupancy by Age of Householder in Norwood
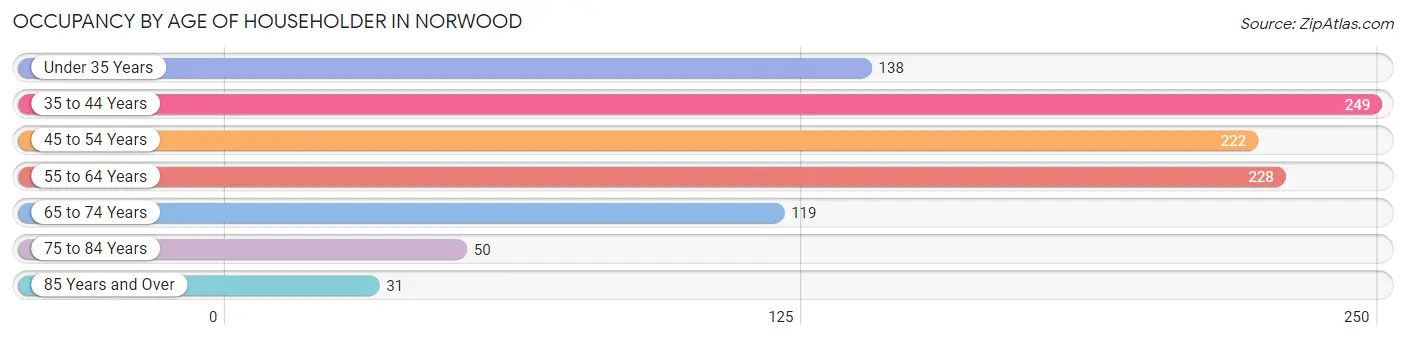
| Age Bracket | # Households | % Households |
| Under 35 Years | 138 | 13.3% |
| 35 to 44 Years | 249 | 24.0% |
| 45 to 54 Years | 222 | 21.4% |
| 55 to 64 Years | 228 | 22.0% |
| 65 to 74 Years | 119 | 11.5% |
| 75 to 84 Years | 50 | 4.8% |
| 85 Years and Over | 31 | 3.0% |
| Total | 1,037 | 100.0% |
Housing Finances in Norwood
Median Income by Occupancy in Norwood
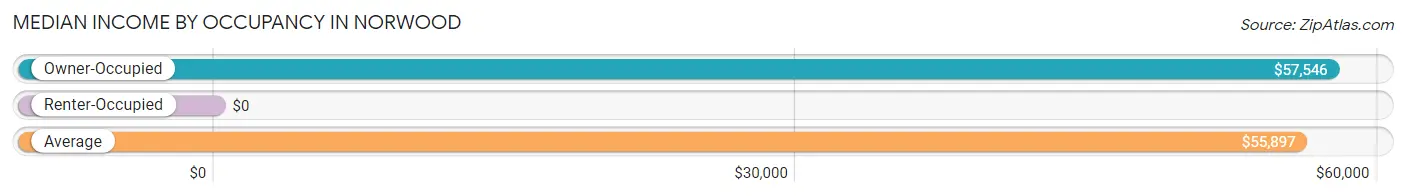
| Occupancy Type | # Households | Median Income |
| Owner-Occupied | 665 (64.1%) | $57,546 |
| Renter-Occupied | 372 (35.9%) | $0 |
| Average | 1,037 (100.0%) | $55,897 |
Occupancy by Householder Income Bracket in Norwood
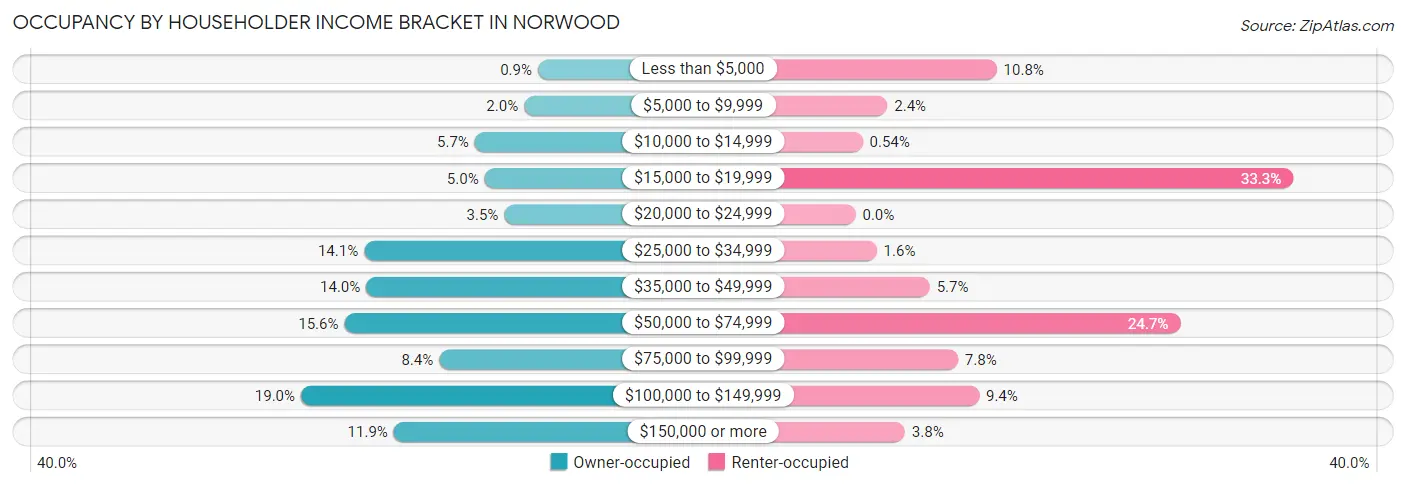
| Income Bracket | Owner-occupied | Renter-occupied |
| Less than $5,000 | 6 (0.9%) | 40 (10.7%) |
| $5,000 to $9,999 | 13 (1.9%) | 9 (2.4%) |
| $10,000 to $14,999 | 38 (5.7%) | 2 (0.5%) |
| $15,000 to $19,999 | 33 (5.0%) | 124 (33.3%) |
| $20,000 to $24,999 | 23 (3.5%) | 0 (0.0%) |
| $25,000 to $34,999 | 94 (14.1%) | 6 (1.6%) |
| $35,000 to $49,999 | 93 (14.0%) | 21 (5.7%) |
| $50,000 to $74,999 | 104 (15.6%) | 92 (24.7%) |
| $75,000 to $99,999 | 56 (8.4%) | 29 (7.8%) |
| $100,000 to $149,999 | 126 (19.0%) | 35 (9.4%) |
| $150,000 or more | 79 (11.9%) | 14 (3.8%) |
| Total | 665 (100.0%) | 372 (100.0%) |
Monthly Housing Cost Tiers in Norwood
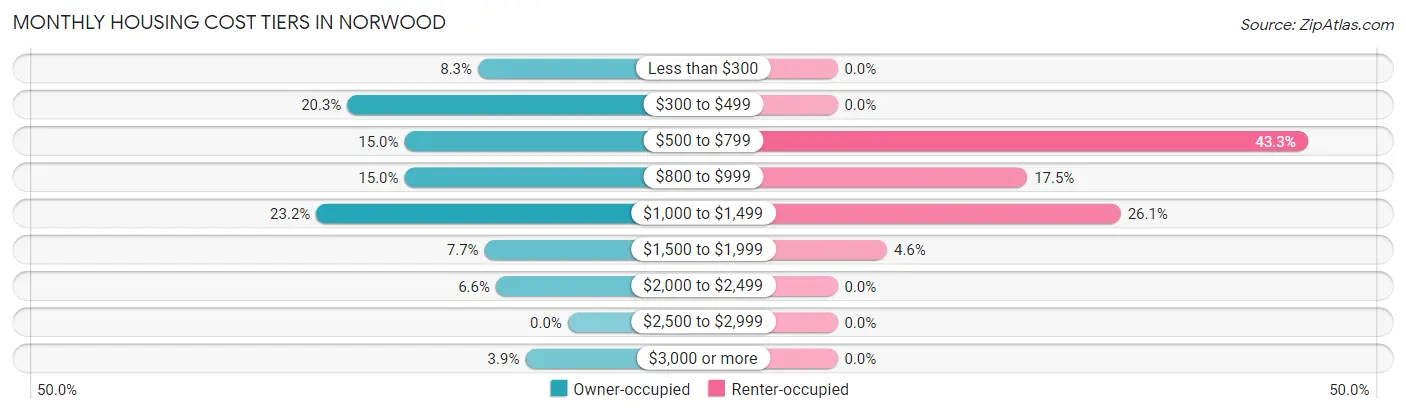
| Monthly Cost | Owner-occupied | Renter-occupied |
| Less than $300 | 55 (8.3%) | 0 (0.0%) |
| $300 to $499 | 135 (20.3%) | 0 (0.0%) |
| $500 to $799 | 100 (15.0%) | 161 (43.3%) |
| $800 to $999 | 100 (15.0%) | 65 (17.5%) |
| $1,000 to $1,499 | 154 (23.2%) | 97 (26.1%) |
| $1,500 to $1,999 | 51 (7.7%) | 17 (4.6%) |
| $2,000 to $2,499 | 44 (6.6%) | 0 (0.0%) |
| $2,500 to $2,999 | 0 (0.0%) | 0 (0.0%) |
| $3,000 or more | 26 (3.9%) | 0 (0.0%) |
| Total | 665 (100.0%) | 372 (100.0%) |
Physical Housing Characteristics in Norwood
Housing Structures in Norwood
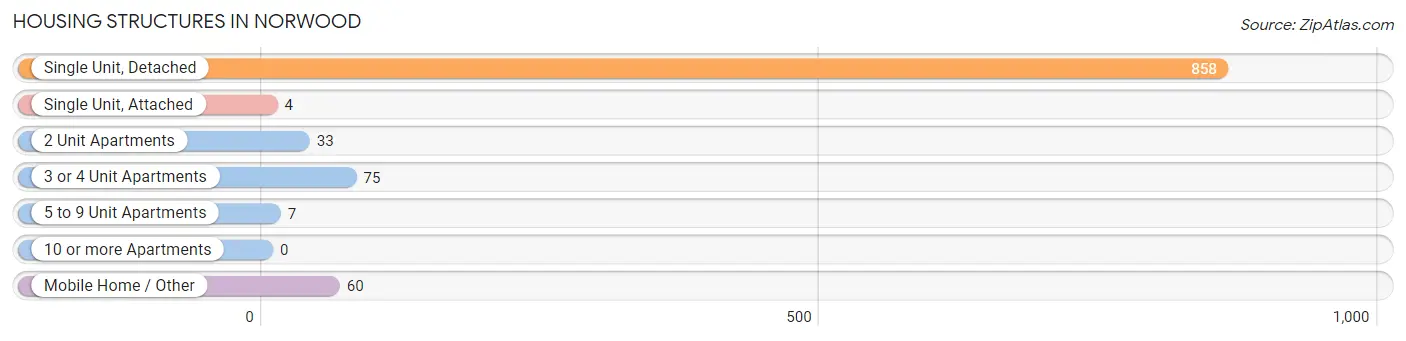
| Structure Type | # Housing Units | % Housing Units |
| Single Unit, Detached | 858 | 82.7% |
| Single Unit, Attached | 4 | 0.4% |
| 2 Unit Apartments | 33 | 3.2% |
| 3 or 4 Unit Apartments | 75 | 7.2% |
| 5 to 9 Unit Apartments | 7 | 0.7% |
| 10 or more Apartments | 0 | 0.0% |
| Mobile Home / Other | 60 | 5.8% |
| Total | 1,037 | 100.0% |
Housing Structures by Occupancy in Norwood
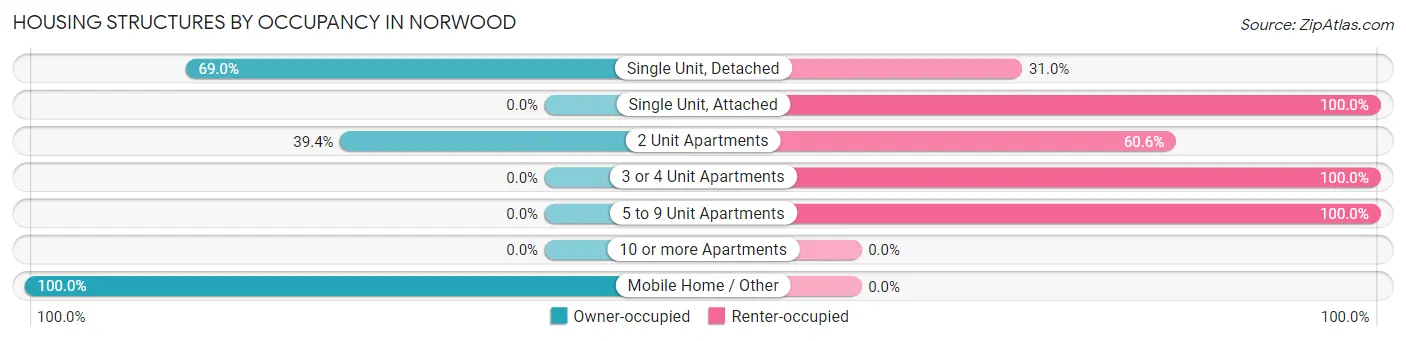
| Structure Type | Owner-occupied | Renter-occupied |
| Single Unit, Detached | 592 (69.0%) | 266 (31.0%) |
| Single Unit, Attached | 0 (0.0%) | 4 (100.0%) |
| 2 Unit Apartments | 13 (39.4%) | 20 (60.6%) |
| 3 or 4 Unit Apartments | 0 (0.0%) | 75 (100.0%) |
| 5 to 9 Unit Apartments | 0 (0.0%) | 7 (100.0%) |
| 10 or more Apartments | 0 (0.0%) | 0 (0.0%) |
| Mobile Home / Other | 60 (100.0%) | 0 (0.0%) |
| Total | 665 (64.1%) | 372 (35.9%) |
Housing Structures by Number of Rooms in Norwood
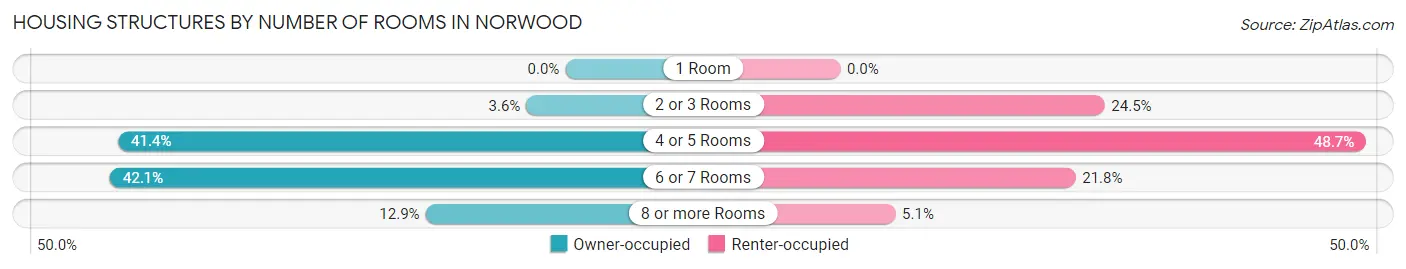
| Number of Rooms | Owner-occupied | Renter-occupied |
| 1 Room | 0 (0.0%) | 0 (0.0%) |
| 2 or 3 Rooms | 24 (3.6%) | 91 (24.5%) |
| 4 or 5 Rooms | 275 (41.3%) | 181 (48.7%) |
| 6 or 7 Rooms | 280 (42.1%) | 81 (21.8%) |
| 8 or more Rooms | 86 (12.9%) | 19 (5.1%) |
| Total | 665 (100.0%) | 372 (100.0%) |
Housing Structure by Heating Type in Norwood
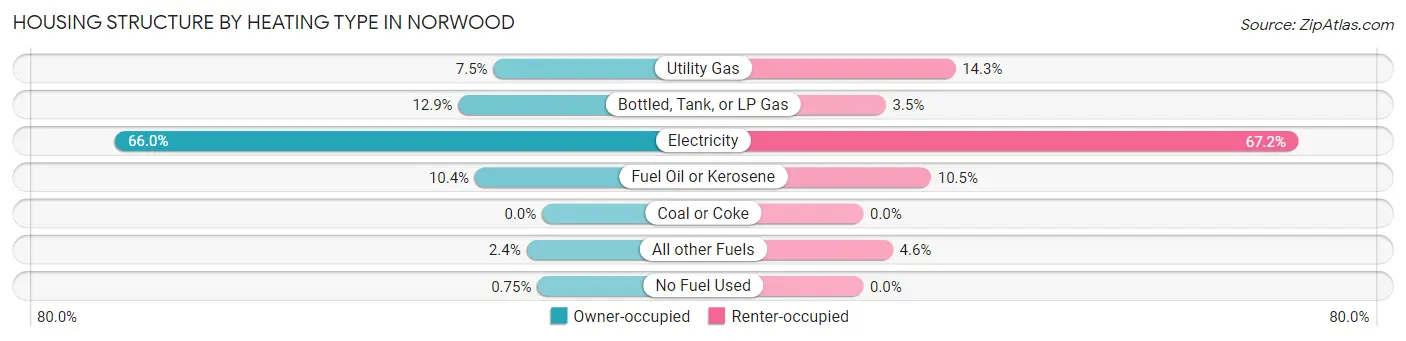
| Heating Type | Owner-occupied | Renter-occupied |
| Utility Gas | 50 (7.5%) | 53 (14.2%) |
| Bottled, Tank, or LP Gas | 86 (12.9%) | 13 (3.5%) |
| Electricity | 439 (66.0%) | 250 (67.2%) |
| Fuel Oil or Kerosene | 69 (10.4%) | 39 (10.5%) |
| Coal or Coke | 0 (0.0%) | 0 (0.0%) |
| All other Fuels | 16 (2.4%) | 17 (4.6%) |
| No Fuel Used | 5 (0.7%) | 0 (0.0%) |
| Total | 665 (100.0%) | 372 (100.0%) |
Household Vehicle Usage in Norwood
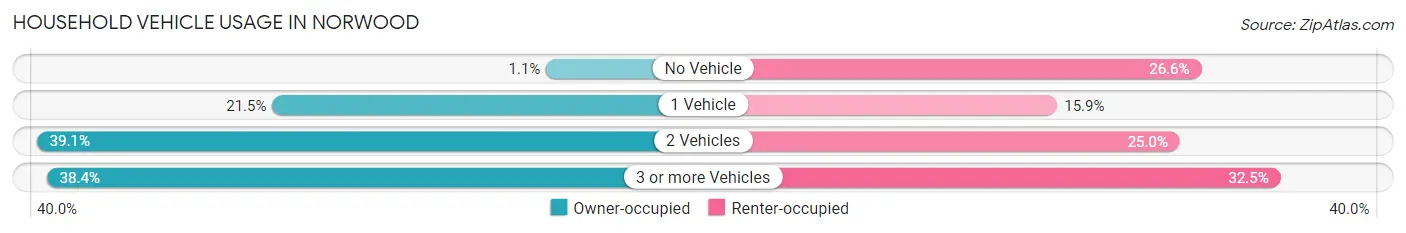
| Vehicles per Household | Owner-occupied | Renter-occupied |
| No Vehicle | 7 (1.1%) | 99 (26.6%) |
| 1 Vehicle | 143 (21.5%) | 59 (15.9%) |
| 2 Vehicles | 260 (39.1%) | 93 (25.0%) |
| 3 or more Vehicles | 255 (38.4%) | 121 (32.5%) |
| Total | 665 (100.0%) | 372 (100.0%) |
Real Estate & Mortgages in Norwood
Real Estate and Mortgage Overview in Norwood
| Characteristic | Without Mortgage | With Mortgage |
| Housing Units | 270 | 395 |
| Median Property Value | $130,600 | $152,200 |
| Median Household Income | $39,605 | $56 |
| Monthly Housing Costs | $426 | $21 |
| Real Estate Taxes | $990 | $39 |
Property Value by Mortgage Status in Norwood
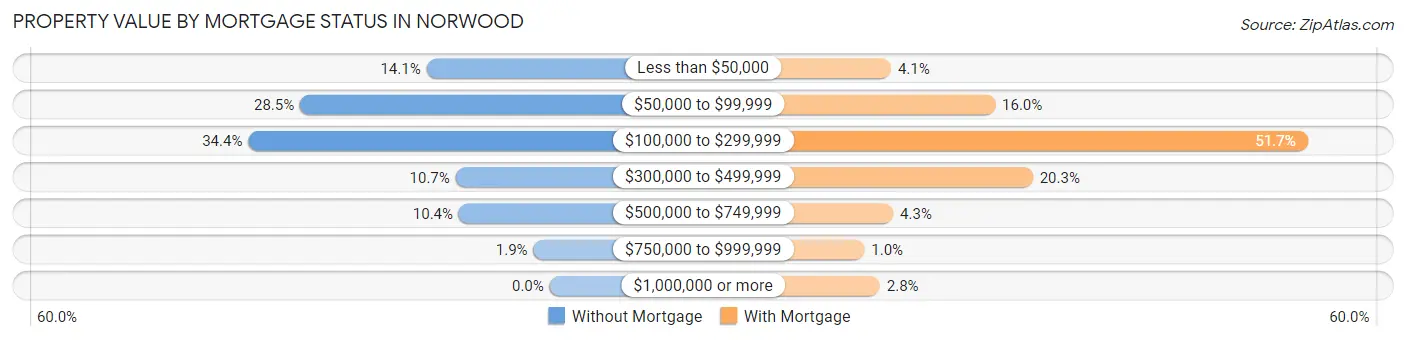
| Property Value | Without Mortgage | With Mortgage |
| Less than $50,000 | 38 (14.1%) | 16 (4.1%) |
| $50,000 to $99,999 | 77 (28.5%) | 63 (16.0%) |
| $100,000 to $299,999 | 93 (34.4%) | 204 (51.6%) |
| $300,000 to $499,999 | 29 (10.7%) | 80 (20.3%) |
| $500,000 to $749,999 | 28 (10.4%) | 17 (4.3%) |
| $750,000 to $999,999 | 5 (1.8%) | 4 (1.0%) |
| $1,000,000 or more | 0 (0.0%) | 11 (2.8%) |
| Total | 270 (100.0%) | 395 (100.0%) |
Household Income by Mortgage Status in Norwood
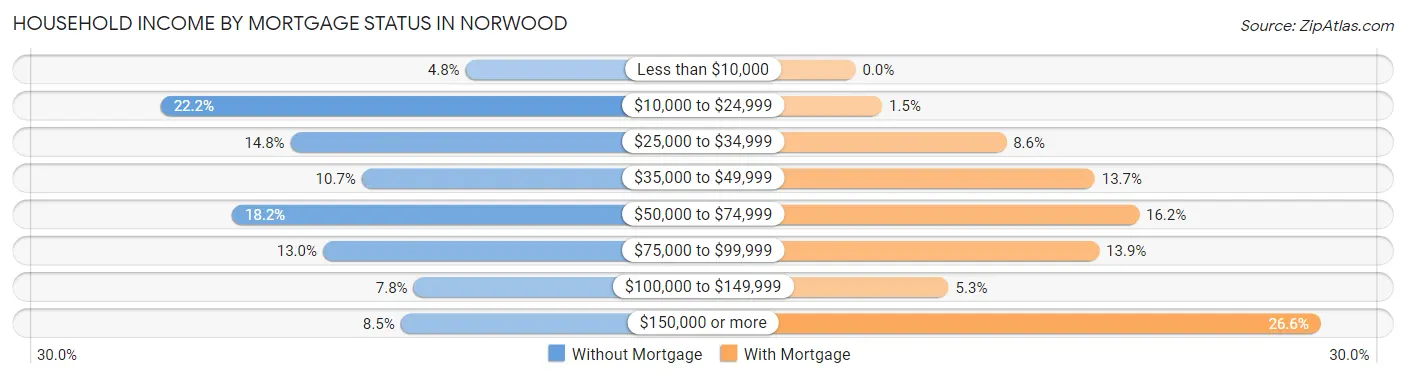
| Household Income | Without Mortgage | With Mortgage |
| Less than $10,000 | 13 (4.8%) | 0 (0.0%) |
| $10,000 to $24,999 | 60 (22.2%) | 6 (1.5%) |
| $25,000 to $34,999 | 40 (14.8%) | 34 (8.6%) |
| $35,000 to $49,999 | 29 (10.7%) | 54 (13.7%) |
| $50,000 to $74,999 | 49 (18.1%) | 64 (16.2%) |
| $75,000 to $99,999 | 35 (13.0%) | 55 (13.9%) |
| $100,000 to $149,999 | 21 (7.8%) | 21 (5.3%) |
| $150,000 or more | 23 (8.5%) | 105 (26.6%) |
| Total | 270 (100.0%) | 395 (100.0%) |
Property Value to Household Income Ratio in Norwood
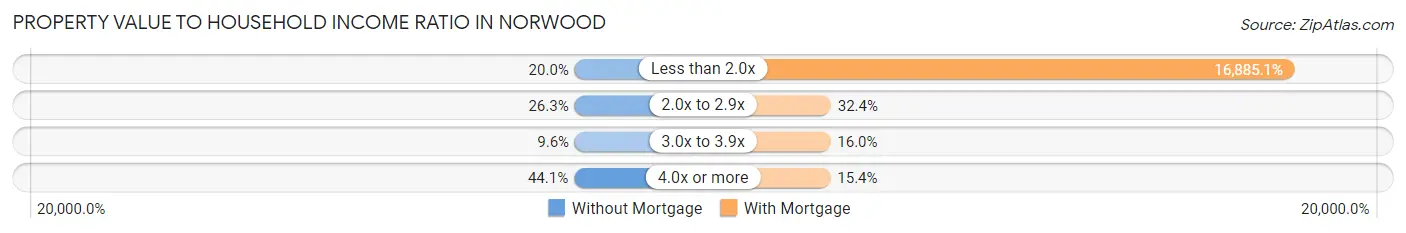
| Value-to-Income Ratio | Without Mortgage | With Mortgage |
| Less than 2.0x | 54 (20.0%) | 66,696 (16,885.1%) |
| 2.0x to 2.9x | 71 (26.3%) | 128 (32.4%) |
| 3.0x to 3.9x | 26 (9.6%) | 63 (16.0%) |
| 4.0x or more | 119 (44.1%) | 61 (15.4%) |
| Total | 270 (100.0%) | 395 (100.0%) |
Real Estate Taxes by Mortgage Status in Norwood
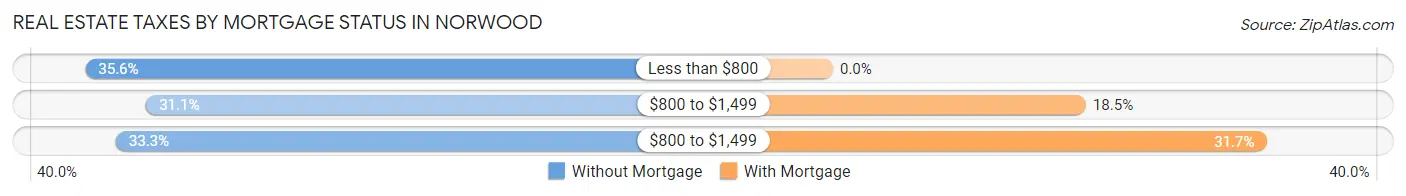
| Property Taxes | Without Mortgage | With Mortgage |
| Less than $800 | 96 (35.6%) | 0 (0.0%) |
| $800 to $1,499 | 84 (31.1%) | 73 (18.5%) |
| $800 to $1,499 | 90 (33.3%) | 125 (31.7%) |
| Total | 270 (100.0%) | 395 (100.0%) |
Health & Disability in Norwood
Health Insurance Coverage by Age in Norwood
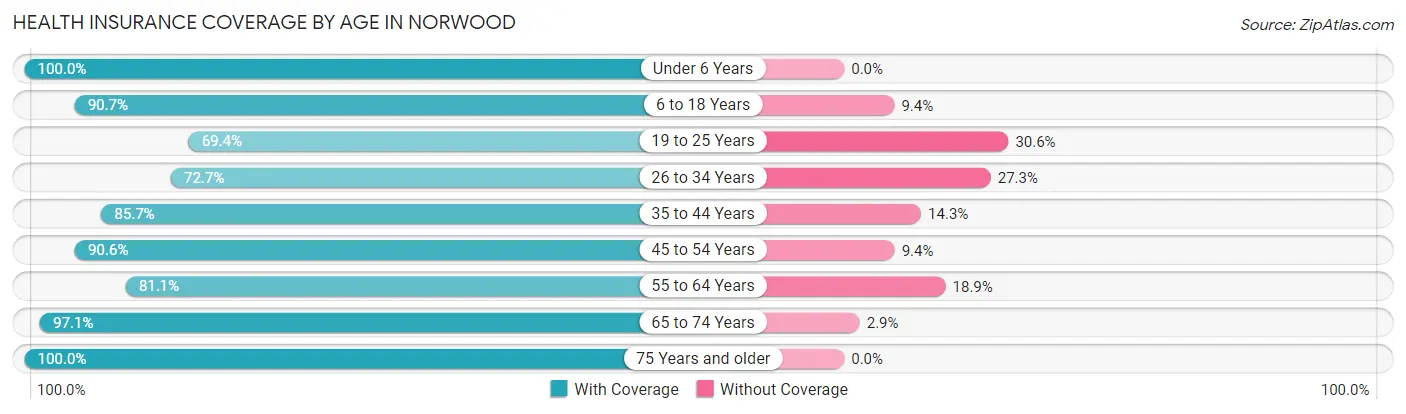
| Age Bracket | With Coverage | Without Coverage |
| Under 6 Years | 125 (100.0%) | 0 (0.0%) |
| 6 to 18 Years | 349 (90.6%) | 36 (9.3%) |
| 19 to 25 Years | 229 (69.4%) | 101 (30.6%) |
| 26 to 34 Years | 266 (72.7%) | 100 (27.3%) |
| 35 to 44 Years | 299 (85.7%) | 50 (14.3%) |
| 45 to 54 Years | 482 (90.6%) | 50 (9.4%) |
| 55 to 64 Years | 352 (81.1%) | 82 (18.9%) |
| 65 to 74 Years | 235 (97.1%) | 7 (2.9%) |
| 75 Years and older | 142 (100.0%) | 0 (0.0%) |
| Total | 2,479 (85.3%) | 426 (14.7%) |
Health Insurance Coverage by Citizenship Status in Norwood
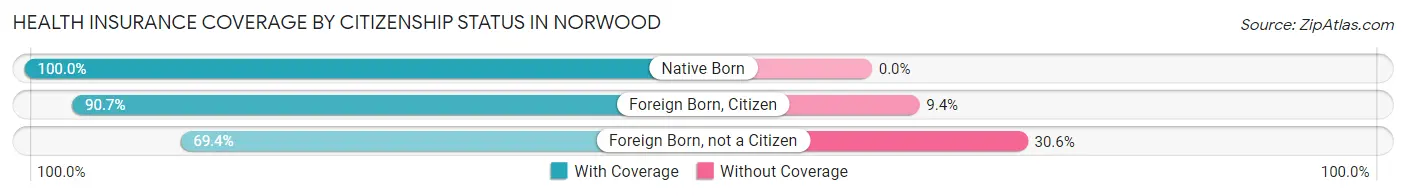
| Citizenship Status | With Coverage | Without Coverage |
| Native Born | 125 (100.0%) | 0 (0.0%) |
| Foreign Born, Citizen | 349 (90.6%) | 36 (9.3%) |
| Foreign Born, not a Citizen | 229 (69.4%) | 101 (30.6%) |
Health Insurance Coverage by Household Income in Norwood
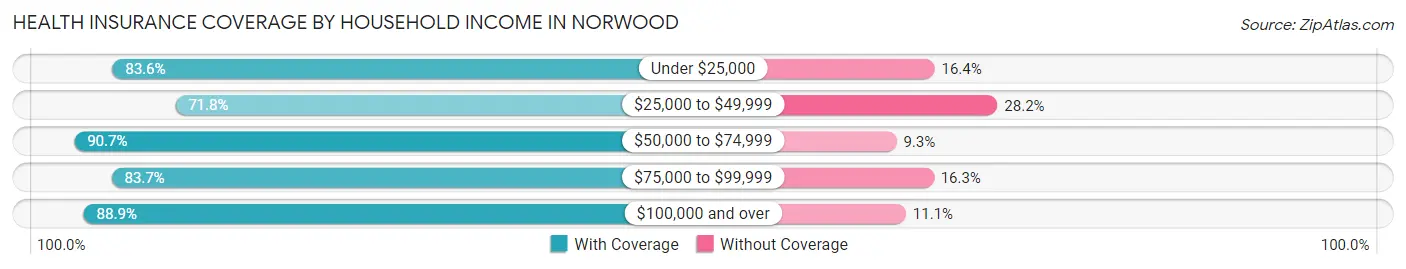
| Household Income | With Coverage | Without Coverage |
| Under $25,000 | 361 (83.6%) | 71 (16.4%) |
| $25,000 to $49,999 | 323 (71.8%) | 127 (28.2%) |
| $50,000 to $74,999 | 585 (90.7%) | 60 (9.3%) |
| $75,000 to $99,999 | 252 (83.7%) | 49 (16.3%) |
| $100,000 and over | 956 (88.9%) | 119 (11.1%) |
Public vs Private Health Insurance Coverage by Age in Norwood
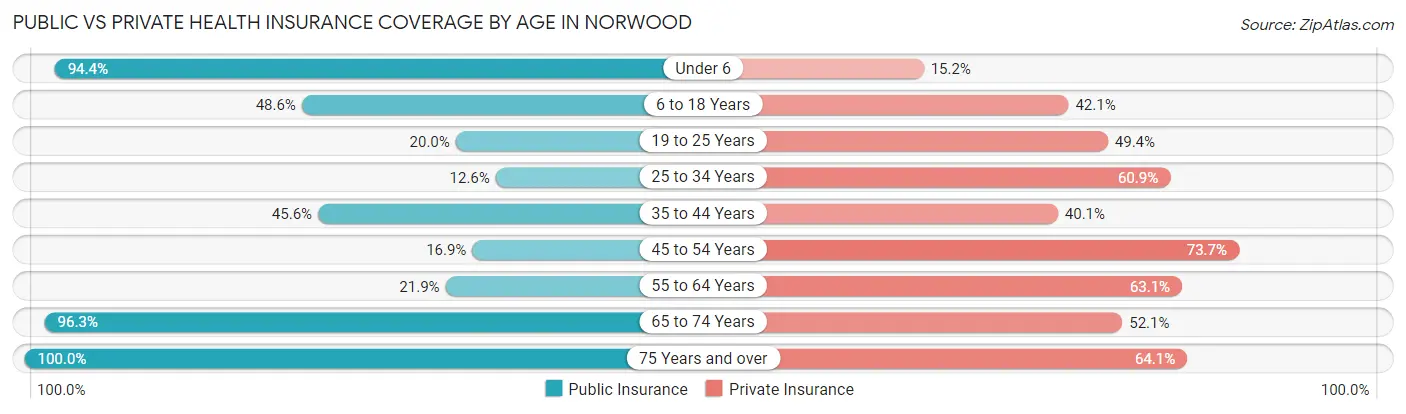
| Age Bracket | Public Insurance | Private Insurance |
| Under 6 | 118 (94.4%) | 19 (15.2%) |
| 6 to 18 Years | 187 (48.6%) | 162 (42.1%) |
| 19 to 25 Years | 66 (20.0%) | 163 (49.4%) |
| 25 to 34 Years | 46 (12.6%) | 223 (60.9%) |
| 35 to 44 Years | 159 (45.6%) | 140 (40.1%) |
| 45 to 54 Years | 90 (16.9%) | 392 (73.7%) |
| 55 to 64 Years | 95 (21.9%) | 274 (63.1%) |
| 65 to 74 Years | 233 (96.3%) | 126 (52.1%) |
| 75 Years and over | 142 (100.0%) | 91 (64.1%) |
| Total | 1,136 (39.1%) | 1,590 (54.7%) |
Disability Status by Sex by Age in Norwood
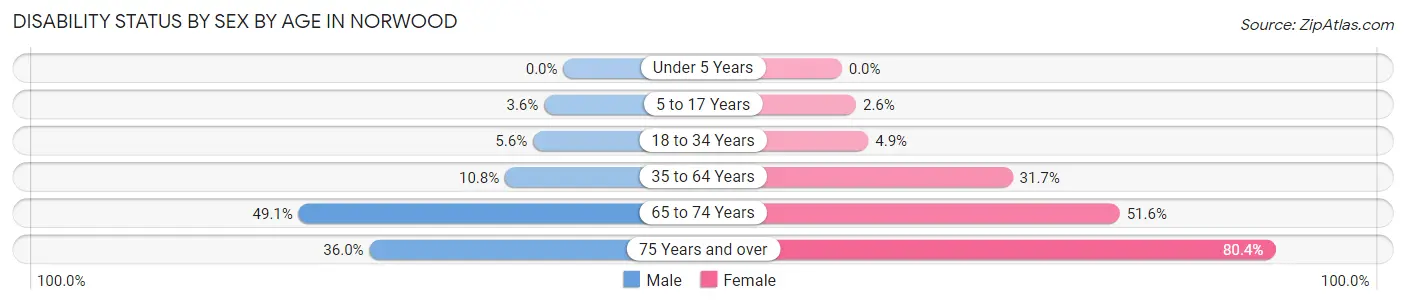
| Age Bracket | Male | Female |
| Under 5 Years | 0 (0.0%) | 0 (0.0%) |
| 5 to 17 Years | 6 (3.6%) | 6 (2.6%) |
| 18 to 34 Years | 32 (5.6%) | 7 (4.9%) |
| 35 to 64 Years | 71 (10.8%) | 209 (31.7%) |
| 65 to 74 Years | 57 (49.1%) | 65 (51.6%) |
| 75 Years and over | 18 (36.0%) | 74 (80.4%) |
Disability Class by Sex by Age in Norwood
Disability Class: Hearing Difficulty
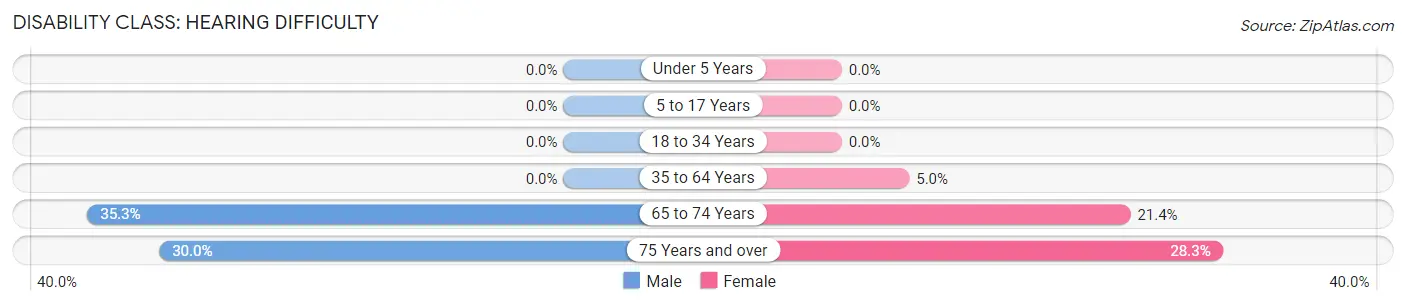
| Age Bracket | Male | Female |
| Under 5 Years | 0 (0.0%) | 0 (0.0%) |
| 5 to 17 Years | 0 (0.0%) | 0 (0.0%) |
| 18 to 34 Years | 0 (0.0%) | 0 (0.0%) |
| 35 to 64 Years | 0 (0.0%) | 33 (5.0%) |
| 65 to 74 Years | 41 (35.3%) | 27 (21.4%) |
| 75 Years and over | 15 (30.0%) | 26 (28.3%) |
Disability Class: Vision Difficulty
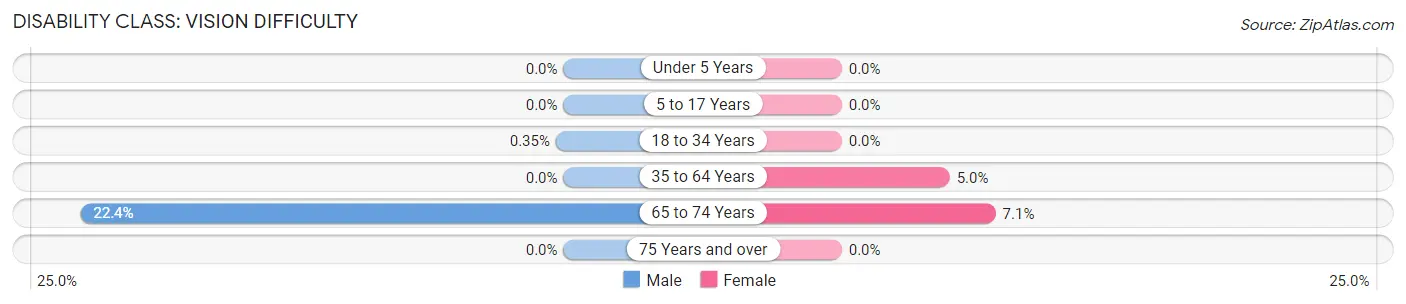
| Age Bracket | Male | Female |
| Under 5 Years | 0 (0.0%) | 0 (0.0%) |
| 5 to 17 Years | 0 (0.0%) | 0 (0.0%) |
| 18 to 34 Years | 2 (0.4%) | 0 (0.0%) |
| 35 to 64 Years | 0 (0.0%) | 33 (5.0%) |
| 65 to 74 Years | 26 (22.4%) | 9 (7.1%) |
| 75 Years and over | 0 (0.0%) | 0 (0.0%) |
Disability Class: Cognitive Difficulty
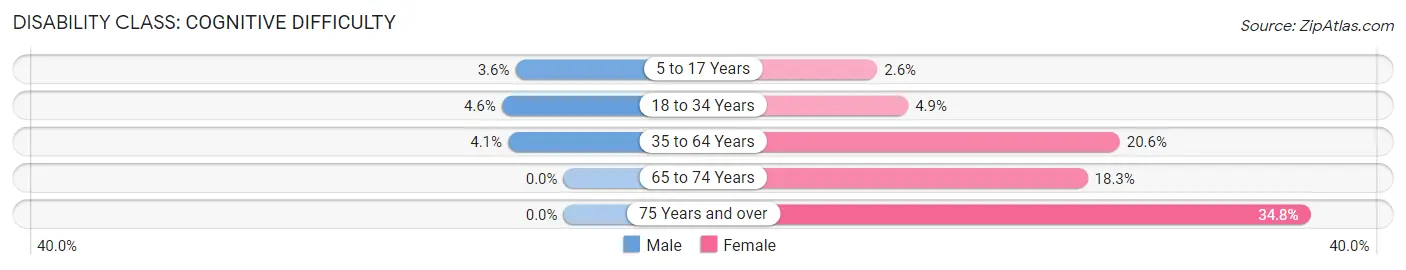
| Age Bracket | Male | Female |
| 5 to 17 Years | 6 (3.6%) | 6 (2.6%) |
| 18 to 34 Years | 26 (4.6%) | 7 (4.9%) |
| 35 to 64 Years | 27 (4.1%) | 136 (20.6%) |
| 65 to 74 Years | 0 (0.0%) | 23 (18.2%) |
| 75 Years and over | 0 (0.0%) | 32 (34.8%) |
Disability Class: Ambulatory Difficulty
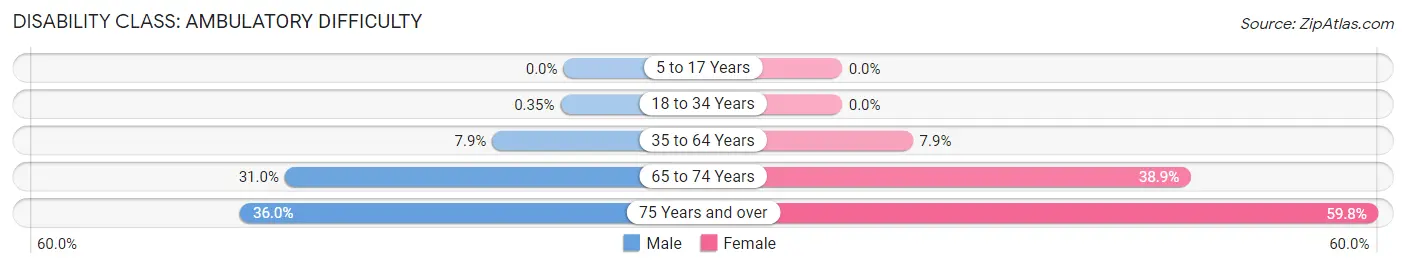
| Age Bracket | Male | Female |
| 5 to 17 Years | 0 (0.0%) | 0 (0.0%) |
| 18 to 34 Years | 2 (0.4%) | 0 (0.0%) |
| 35 to 64 Years | 52 (7.9%) | 52 (7.9%) |
| 65 to 74 Years | 36 (31.0%) | 49 (38.9%) |
| 75 Years and over | 18 (36.0%) | 55 (59.8%) |
Disability Class: Self-Care Difficulty
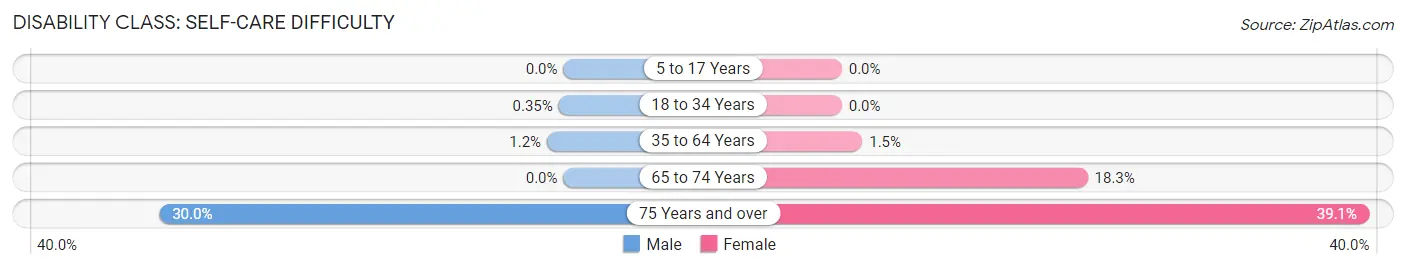
| Age Bracket | Male | Female |
| 5 to 17 Years | 0 (0.0%) | 0 (0.0%) |
| 18 to 34 Years | 2 (0.4%) | 0 (0.0%) |
| 35 to 64 Years | 8 (1.2%) | 10 (1.5%) |
| 65 to 74 Years | 0 (0.0%) | 23 (18.2%) |
| 75 Years and over | 15 (30.0%) | 36 (39.1%) |
Technology Access in Norwood
Computing Device Access in Norwood
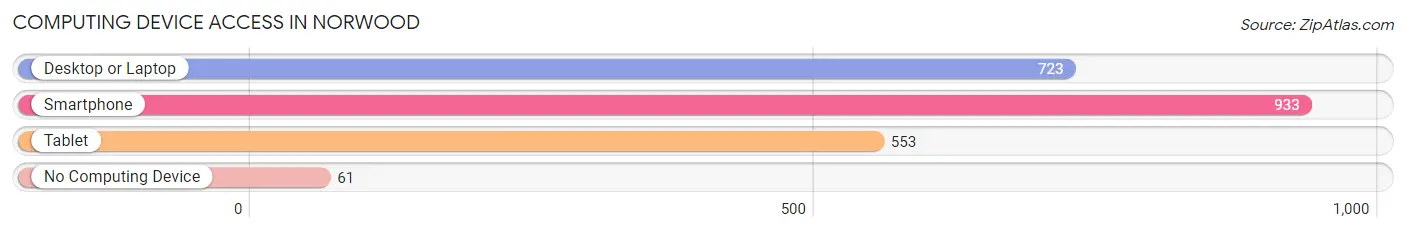
| Device Type | # Households | % Households |
| Desktop or Laptop | 723 | 69.7% |
| Smartphone | 933 | 90.0% |
| Tablet | 553 | 53.3% |
| No Computing Device | 61 | 5.9% |
| Total | 1,037 | 100.0% |
Internet Access in Norwood
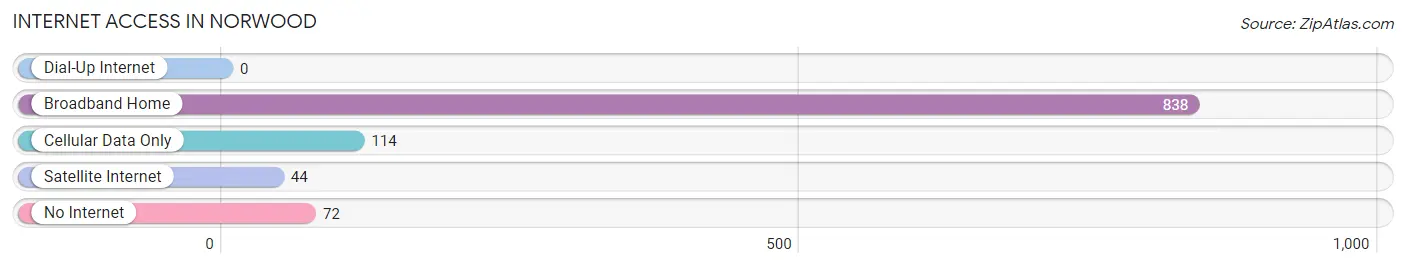
| Internet Type | # Households | % Households |
| Dial-Up Internet | 0 | 0.0% |
| Broadband Home | 838 | 80.8% |
| Cellular Data Only | 114 | 11.0% |
| Satellite Internet | 44 | 4.2% |
| No Internet | 72 | 6.9% |
| Total | 1,037 | 100.0% |
Norwood Summary
Norwood is a small town located in Stanly County, North Carolina. It is situated in the Piedmont region of the state, approximately 40 miles east of Charlotte. The town has a population of 1,845 people, according to the 2010 census.
History
Norwood was founded in 1887 by the Norwood family, who had moved to the area from Virginia. The town was named after the family’s ancestral home in England. The town was incorporated in 1899 and has remained relatively small since then.
Geography
Norwood is located in the Piedmont region of North Carolina, approximately 40 miles east of Charlotte. The town is situated on the banks of the Yadkin River, which flows through the town. The town is surrounded by rolling hills and forests, and is located in the foothills of the Blue Ridge Mountains.
Economy
Norwood’s economy is largely based on agriculture and manufacturing. The town is home to several small businesses, including a furniture factory, a sawmill, and a textile mill. The town also has a few retail stores, restaurants, and other small businesses.
Demographics
According to the 2010 census, Norwood has a population of 1,845 people. The town is predominantly white, with a small African American population. The median household income is $35,000, and the median age is 39. The town has a low unemployment rate of 4.2%.
Conclusion
Norwood is a small town located in Stanly County, North Carolina. It was founded in 1887 by the Norwood family and has remained relatively small since then. The town is situated in the Piedmont region of the state, on the banks of the Yadkin River. Norwood’s economy is largely based on agriculture and manufacturing, and the town has a population of 1,845 people. The town is predominantly white, with a small African American population. The median household income is $35,000, and the median age is 39.
Common Questions
What is Per Capita Income in Norwood?
Per Capita income in Norwood is $27,578.
What is the Median Family Income in Norwood?
Median Family Income in Norwood is $72,038.
What is the Median Household income in Norwood?
Median Household Income in Norwood is $55,897.
What is Income or Wage Gap in Norwood?
Income or Wage Gap in Norwood is 8.2%.
Women in Norwood earn 91.8 cents for every dollar earned by a man.
What is Inequality or Gini Index in Norwood?
Inequality or Gini Index in Norwood is 0.45.
What is the Total Population of Norwood?
Total Population of Norwood is 2,906.
What is the Total Male Population of Norwood?
Total Male Population of Norwood is 1,614.
What is the Total Female Population of Norwood?
Total Female Population of Norwood is 1,292.
What is the Ratio of Males per 100 Females in Norwood?
There are 124.92 Males per 100 Females in Norwood.
What is the Ratio of Females per 100 Males in Norwood?
There are 80.05 Females per 100 Males in Norwood.
What is the Median Population Age in Norwood?
Median Population Age in Norwood is 40.8 Years.
What is the Average Family Size in Norwood
Average Family Size in Norwood is 4.0 People.
What is the Average Household Size in Norwood
Average Household Size in Norwood is 2.8 People.
How Large is the Labor Force in Norwood?
There are 1,543 People in the Labor Forcein in Norwood.
What is the Percentage of People in the Labor Force in Norwood?
61.7% of People are in the Labor Force in Norwood.
What is the Unemployment Rate in Norwood?
Unemployment Rate in Norwood is 5.1%.