Saltillo, MS Map & Demographics
Saltillo Map
Saltillo Overview
$34,947
PER CAPITA INCOME
$91,250
AVG FAMILY INCOME
$78,922
AVG HOUSEHOLD INCOME
46.1%
WAGE / INCOME GAP [ % ]
53.9¢/ $1
WAGE / INCOME GAP [ $ ]
$6,261
FAMILY INCOME DEFICIT
0.33
INEQUALITY / GINI INDEX
4,910
TOTAL POPULATION
2,526
MALE POPULATION
2,384
FEMALE POPULATION
105.96
MALES / 100 FEMALES
94.38
FEMALES / 100 MALES
34.1
MEDIAN AGE
2.8
AVG FAMILY SIZE
2.5
AVG HOUSEHOLD SIZE
2,756
LABOR FORCE [ PEOPLE ]
70.8%
PERCENT IN LABOR FORCE
3.8%
UNEMPLOYMENT RATE
Saltillo Zip Codes
Saltillo Area Codes
Income in Saltillo
Income Overview in Saltillo
Per Capita Income in Saltillo is $34,947, while median incomes of families and households are $91,250 and $78,922 respectively.
| Characteristic | Number | Measure |
| Per Capita Income | 4,910 | $34,947 |
| Median Family Income | 1,567 | $91,250 |
| Mean Family Income | 1,567 | $93,175 |
| Median Household Income | 1,969 | $78,922 |
| Mean Household Income | 1,969 | $86,470 |
| Income Deficit | 1,567 | $6,261 |
| Wage / Income Gap (%) | 4,910 | 46.08% |
| Wage / Income Gap ($) | 4,910 | 53.92¢ per $1 |
| Gini / Inequality Index | 4,910 | 0.33 |
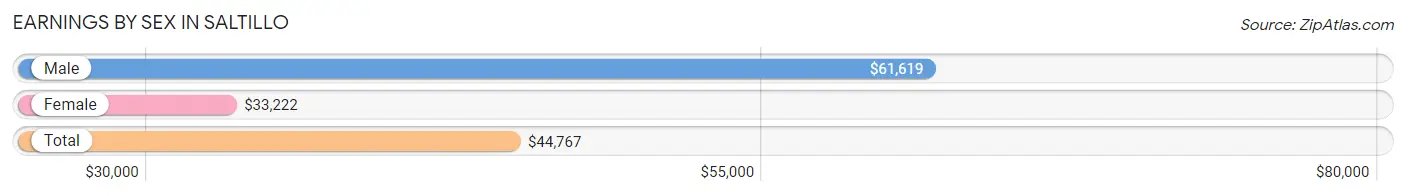
Earnings by Sex in Saltillo
Average Earnings in Saltillo are $44,767, $61,619 for men and $33,222 for women, a difference of 46.1%.
| Sex | Number | Average Earnings |
| Male | 1,655 (57.4%) | $61,619 |
| Female | 1,231 (42.6%) | $33,222 |
| Total | 2,886 (100.0%) | $44,767 |
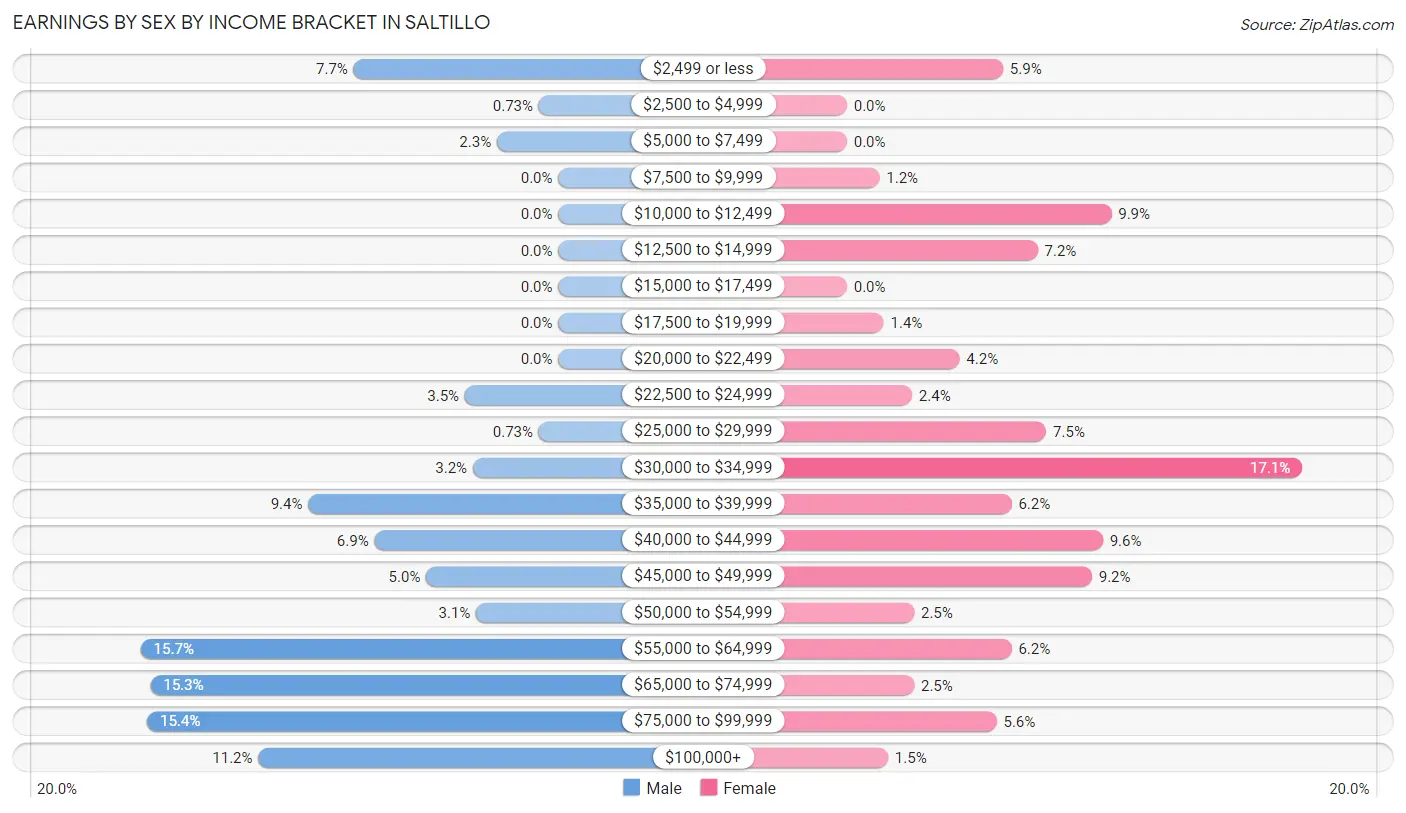
Earnings by Sex by Income Bracket in Saltillo
The most common earnings brackets in Saltillo are $55,000 to $64,999 for men (259 | 15.7%) and $30,000 to $34,999 for women (210 | 17.1%).
| Income | Male | Female |
| $2,499 or less | 127 (7.7%) | 72 (5.9%) |
| $2,500 to $4,999 | 12 (0.7%) | 0 (0.0%) |
| $5,000 to $7,499 | 38 (2.3%) | 0 (0.0%) |
| $7,500 to $9,999 | 0 (0.0%) | 15 (1.2%) |
| $10,000 to $12,499 | 0 (0.0%) | 122 (9.9%) |
| $12,500 to $14,999 | 0 (0.0%) | 88 (7.1%) |
| $15,000 to $17,499 | 0 (0.0%) | 0 (0.0%) |
| $17,500 to $19,999 | 0 (0.0%) | 17 (1.4%) |
| $20,000 to $22,499 | 0 (0.0%) | 52 (4.2%) |
| $22,500 to $24,999 | 58 (3.5%) | 30 (2.4%) |
| $25,000 to $29,999 | 12 (0.7%) | 92 (7.5%) |
| $30,000 to $34,999 | 53 (3.2%) | 210 (17.1%) |
| $35,000 to $39,999 | 155 (9.4%) | 76 (6.2%) |
| $40,000 to $44,999 | 114 (6.9%) | 118 (9.6%) |
| $45,000 to $49,999 | 82 (5.0%) | 113 (9.2%) |
| $50,000 to $54,999 | 51 (3.1%) | 31 (2.5%) |
| $55,000 to $64,999 | 259 (15.7%) | 76 (6.2%) |
| $65,000 to $74,999 | 253 (15.3%) | 31 (2.5%) |
| $75,000 to $99,999 | 255 (15.4%) | 69 (5.6%) |
| $100,000+ | 186 (11.2%) | 19 (1.5%) |
| Total | 1,655 (100.0%) | 1,231 (100.0%) |
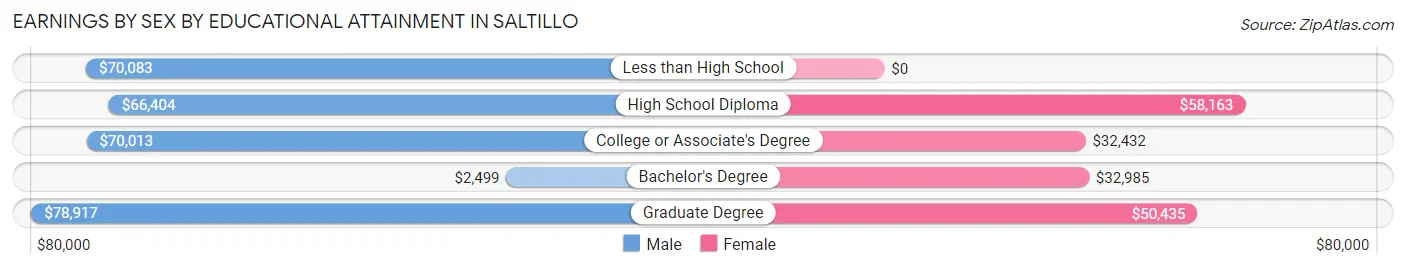
Earnings by Sex by Educational Attainment in Saltillo
Average earnings in Saltillo are $64,705 for men and $34,592 for women, a difference of 46.5%. Men with an educational attainment of graduate degree enjoy the highest average annual earnings of $78,917, while those with bachelor's degree education earn the least with $2,499. Women with an educational attainment of high school diploma earn the most with the average annual earnings of $58,163, while those with college or associate's degree education have the smallest earnings of $32,432.
| Educational Attainment | Male Income | Female Income |
| Less than High School | $70,083 | $0 |
| High School Diploma | $66,404 | $58,163 |
| College or Associate's Degree | $70,013 | $32,432 |
| Bachelor's Degree | $2,499 | $32,985 |
| Graduate Degree | $78,917 | $50,435 |
| Total | $64,705 | $34,592 |
Family Income in Saltillo
Family Income Brackets in Saltillo
According to the Saltillo family income data, there are 382 families falling into the $100,000 to $149,999 income range, which is the most common income bracket and makes up 24.4% of all families.
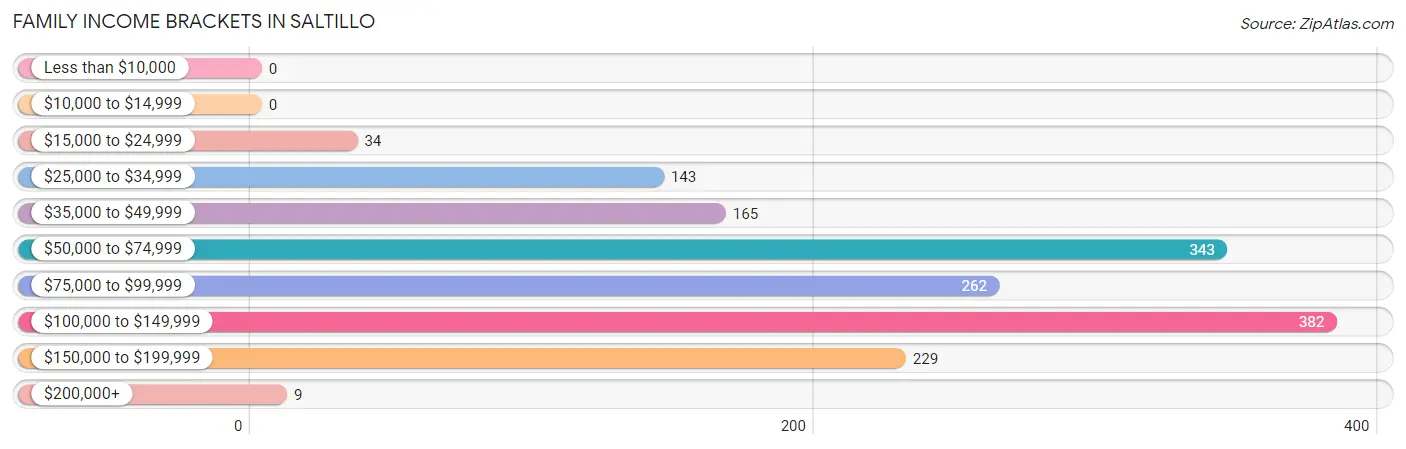
| Income Bracket | # Families | % Families |
| Less than $10,000 | 0 | 0.0% |
| $10,000 to $14,999 | 0 | 0.0% |
| $15,000 to $24,999 | 34 | 2.2% |
| $25,000 to $34,999 | 143 | 9.1% |
| $35,000 to $49,999 | 165 | 10.5% |
| $50,000 to $74,999 | 343 | 21.9% |
| $75,000 to $99,999 | 262 | 16.7% |
| $100,000 to $149,999 | 382 | 24.4% |
| $150,000 to $199,999 | 229 | 14.6% |
| $200,000+ | 9 | 0.6% |
Family Income by Famaliy Size in Saltillo
4-person families (253 | 16.2%) account for the highest median family income in Saltillo with $111,969 per family, while 2-person families (864 | 55.1%) have the highest median income of $47,875 per family member.
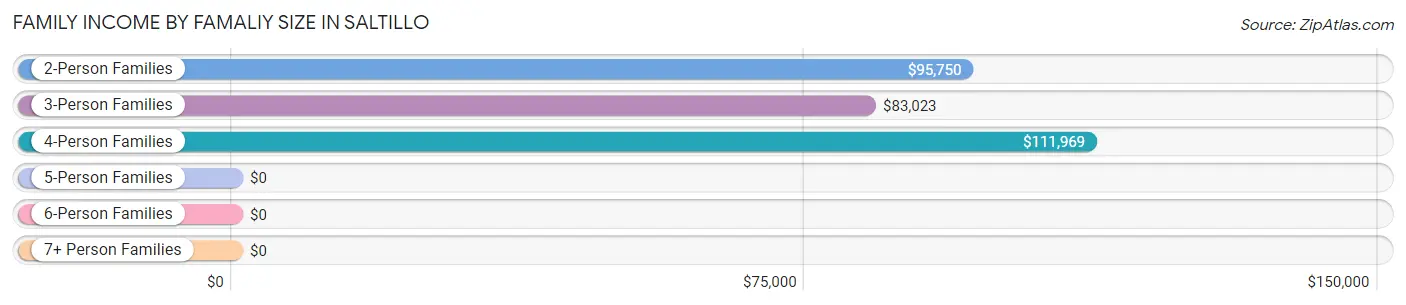
| Income Bracket | # Families | Median Income |
| 2-Person Families | 864 (55.1%) | $95,750 |
| 3-Person Families | 356 (22.7%) | $83,023 |
| 4-Person Families | 253 (16.2%) | $111,969 |
| 5-Person Families | 79 (5.0%) | $0 |
| 6-Person Families | 15 (1.0%) | $0 |
| 7+ Person Families | 0 (0.0%) | $0 |
| Total | 1,567 (100.0%) | $91,250 |
Family Income by Number of Earners in Saltillo
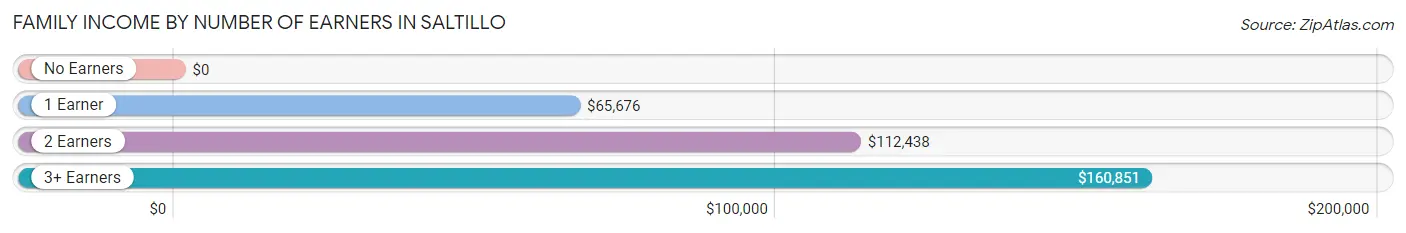
| Number of Earners | # Families | Median Income |
| No Earners | 131 (8.4%) | $0 |
| 1 Earner | 721 (46.0%) | $65,676 |
| 2 Earners | 558 (35.6%) | $112,438 |
| 3+ Earners | 157 (10.0%) | $160,851 |
| Total | 1,567 (100.0%) | $91,250 |
Household Income in Saltillo
Household Income Brackets in Saltillo
With 415 households falling in the category, the $100,000 to $149,999 income range is the most frequent in Saltillo, accounting for 21.1% of all households. In contrast, only 32 households (1.6%) fall into the less than $10,000 income bracket, making it the least populous group.
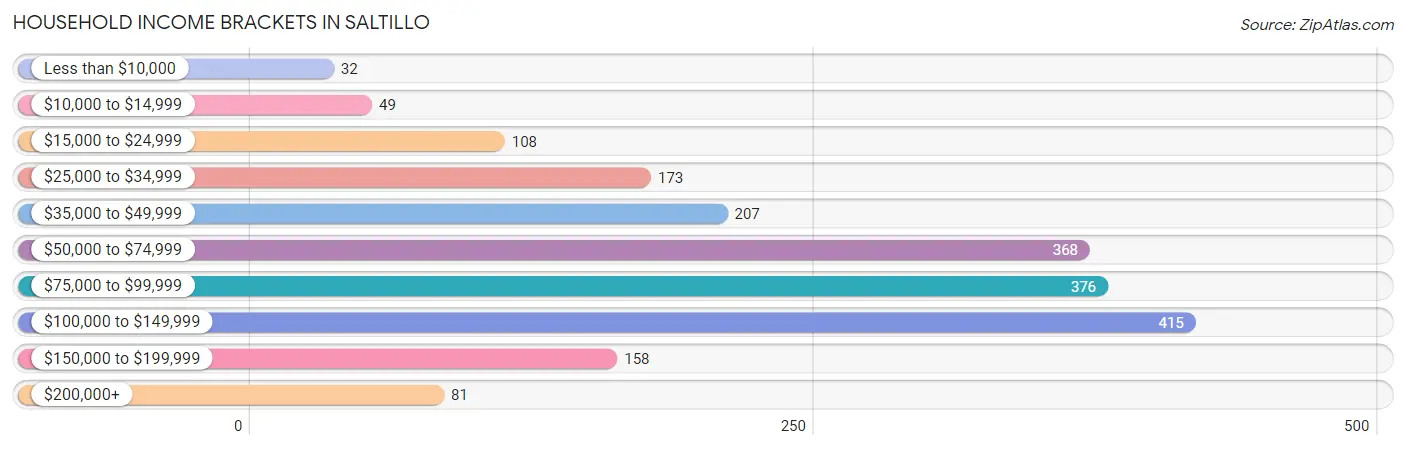
| Income Bracket | # Households | % Households |
| Less than $10,000 | 32 | 1.6% |
| $10,000 to $14,999 | 49 | 2.5% |
| $15,000 to $24,999 | 108 | 5.5% |
| $25,000 to $34,999 | 173 | 8.8% |
| $35,000 to $49,999 | 207 | 10.5% |
| $50,000 to $74,999 | 368 | 18.7% |
| $75,000 to $99,999 | 376 | 19.1% |
| $100,000 to $149,999 | 415 | 21.1% |
| $150,000 to $199,999 | 158 | 8.0% |
| $200,000+ | 81 | 4.1% |
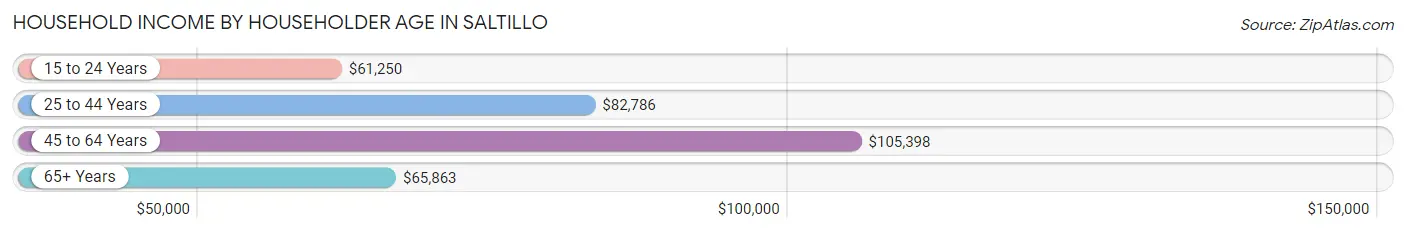
Household Income by Householder Age in Saltillo
The median household income in Saltillo is $78,922, with the highest median household income of $105,398 found in the 45 to 64 years age bracket for the primary householder. A total of 625 households (31.7%) fall into this category. Meanwhile, the 15 to 24 years age bracket for the primary householder has the lowest median household income of $61,250, with 83 households (4.2%) in this group.
| Income Bracket | # Households | Median Income |
| 15 to 24 Years | 83 (4.2%) | $61,250 |
| 25 to 44 Years | 851 (43.2%) | $82,786 |
| 45 to 64 Years | 625 (31.7%) | $105,398 |
| 65+ Years | 410 (20.8%) | $65,863 |
| Total | 1,969 (100.0%) | $78,922 |
Poverty in Saltillo
Income Below Poverty by Sex and Age in Saltillo
With 7.0% poverty level for males and 7.8% for females among the residents of Saltillo, 16 and 17 year old males and 12 to 14 year old females are the most vulnerable to poverty, with 21 males (61.8%) and 44 females (100.0%) in their respective age groups living below the poverty level.

| Age Bracket | Male | Female |
| Under 5 Years | 0 (0.0%) | 0 (0.0%) |
| 5 Years | 0 (0.0%) | 0 (0.0%) |
| 6 to 11 Years | 33 (14.5%) | 26 (20.8%) |
| 12 to 14 Years | 49 (27.7%) | 44 (100.0%) |
| 15 Years | 0 (0.0%) | 14 (100.0%) |
| 16 and 17 Years | 21 (61.8%) | 0 (0.0%) |
| 18 to 24 Years | 0 (0.0%) | 33 (19.0%) |
| 25 to 34 Years | 31 (6.4%) | 0 (0.0%) |
| 35 to 44 Years | 0 (0.0%) | 49 (16.7%) |
| 45 to 54 Years | 0 (0.0%) | 0 (0.0%) |
| 55 to 64 Years | 31 (18.8%) | 0 (0.0%) |
| 65 to 74 Years | 12 (5.7%) | 0 (0.0%) |
| 75 Years and over | 0 (0.0%) | 19 (16.1%) |
| Total | 177 (7.0%) | 185 (7.8%) |
Income Above Poverty by Sex and Age in Saltillo
According to the poverty statistics in Saltillo, males aged under 5 years and females aged under 5 years are the age groups that are most secure financially, with 100.0% of males and 100.0% of females in these age groups living above the poverty line.
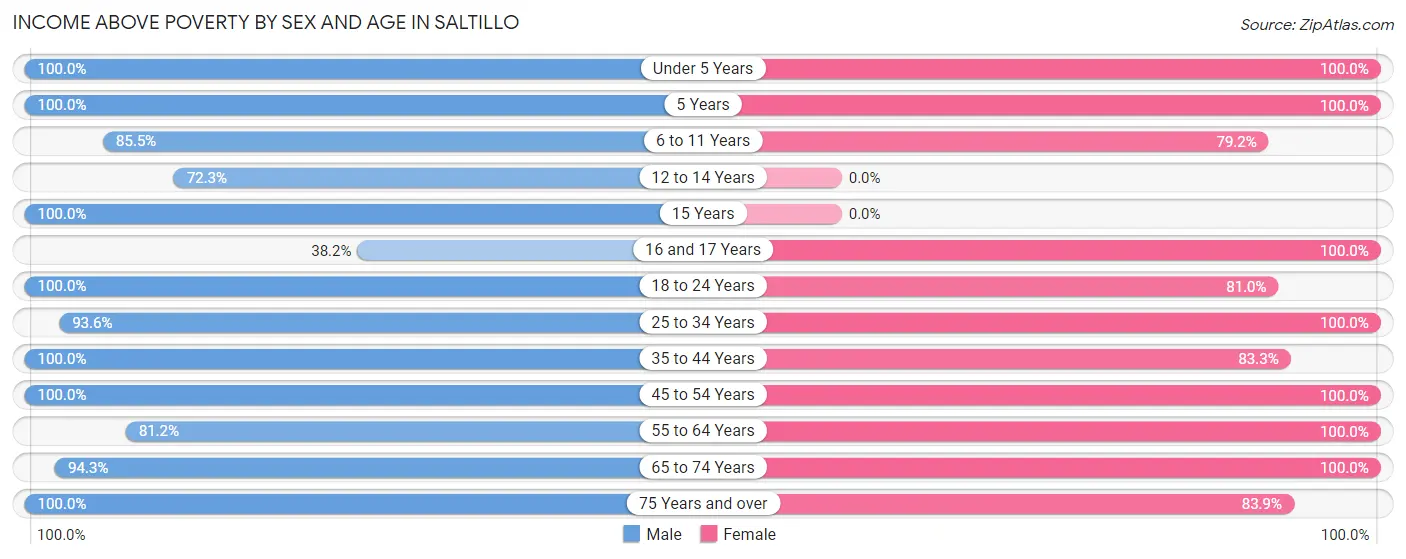
| Age Bracket | Male | Female |
| Under 5 Years | 143 (100.0%) | 130 (100.0%) |
| 5 Years | 13 (100.0%) | 89 (100.0%) |
| 6 to 11 Years | 194 (85.5%) | 99 (79.2%) |
| 12 to 14 Years | 128 (72.3%) | 0 (0.0%) |
| 15 Years | 44 (100.0%) | 0 (0.0%) |
| 16 and 17 Years | 13 (38.2%) | 24 (100.0%) |
| 18 to 24 Years | 208 (100.0%) | 141 (81.0%) |
| 25 to 34 Years | 451 (93.6%) | 569 (100.0%) |
| 35 to 44 Years | 380 (100.0%) | 244 (83.3%) |
| 45 to 54 Years | 383 (100.0%) | 386 (100.0%) |
| 55 to 64 Years | 134 (81.2%) | 125 (100.0%) |
| 65 to 74 Years | 200 (94.3%) | 281 (100.0%) |
| 75 Years and over | 58 (100.0%) | 99 (83.9%) |
| Total | 2,349 (93.0%) | 2,187 (92.2%) |
Income Below Poverty Among Married-Couple Families in Saltillo
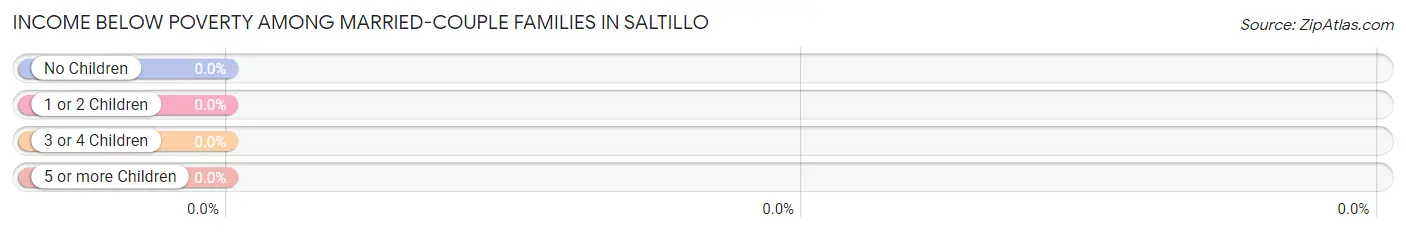
| Children | Above Poverty | Below Poverty |
| No Children | 783 (100.0%) | 0 (0.0%) |
| 1 or 2 Children | 243 (100.0%) | 0 (0.0%) |
| 3 or 4 Children | 39 (100.0%) | 0 (0.0%) |
| 5 or more Children | 0 (0.0%) | 0 (0.0%) |
| Total | 1,065 (100.0%) | 0 (0.0%) |
Income Below Poverty Among Single-Parent Households in Saltillo
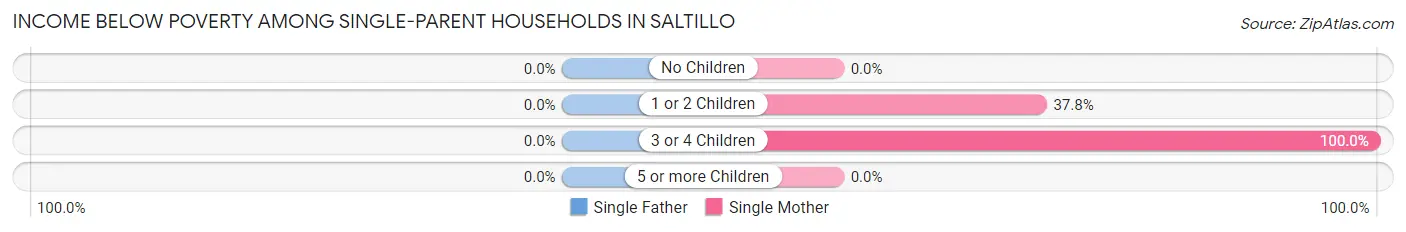
| Children | Single Father | Single Mother |
| No Children | 0 (0.0%) | 0 (0.0%) |
| 1 or 2 Children | 0 (0.0%) | 34 (37.8%) |
| 3 or 4 Children | 0 (0.0%) | 15 (100.0%) |
| 5 or more Children | 0 (0.0%) | 0 (0.0%) |
| Total | 0 (0.0%) | 49 (21.7%) |
Income Below Poverty Among Married-Couple vs Single-Parent Households in Saltillo
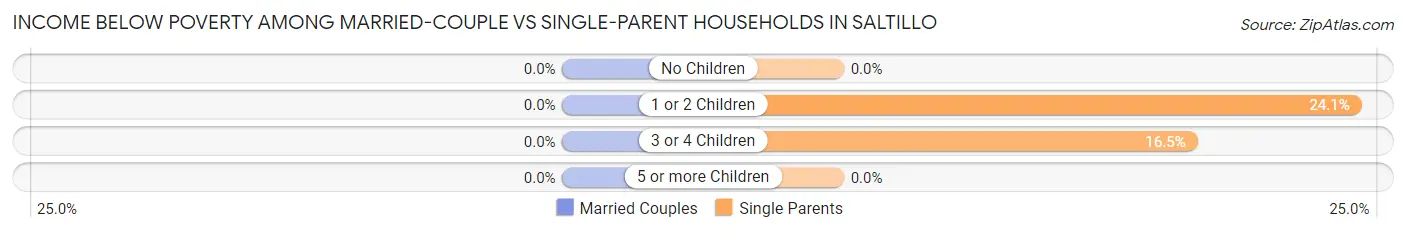
| Children | Married-Couple Families | Single-Parent Households |
| No Children | 0 (0.0%) | 0 (0.0%) |
| 1 or 2 Children | 0 (0.0%) | 34 (24.1%) |
| 3 or 4 Children | 0 (0.0%) | 15 (16.5%) |
| 5 or more Children | 0 (0.0%) | 0 (0.0%) |
| Total | 0 (0.0%) | 49 (9.8%) |
Race in Saltillo
The most populous races in Saltillo are White / Caucasian (4,269 | 87.0%), Black / African American (521 | 10.6%), and Hispanic or Latino (118 | 2.4%).
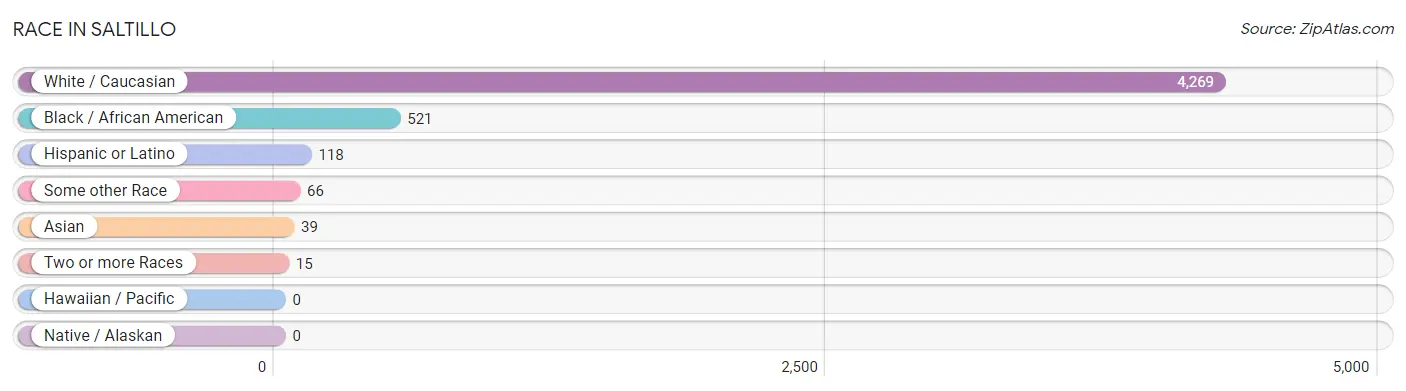
| Race | # Population | % Population |
| Asian | 39 | 0.8% |
| Black / African American | 521 | 10.6% |
| Hawaiian / Pacific | 0 | 0.0% |
| Hispanic or Latino | 118 | 2.4% |
| Native / Alaskan | 0 | 0.0% |
| White / Caucasian | 4,269 | 87.0% |
| Two or more Races | 15 | 0.3% |
| Some other Race | 66 | 1.3% |
| Total | 4,910 | 100.0% |
Ancestry in Saltillo
The most populous ancestries reported in Saltillo are Irish (985 | 20.1%), English (721 | 14.7%), American (563 | 11.5%), German (351 | 7.1%), and French (333 | 6.8%), together accounting for 60.1% of all Saltillo residents.
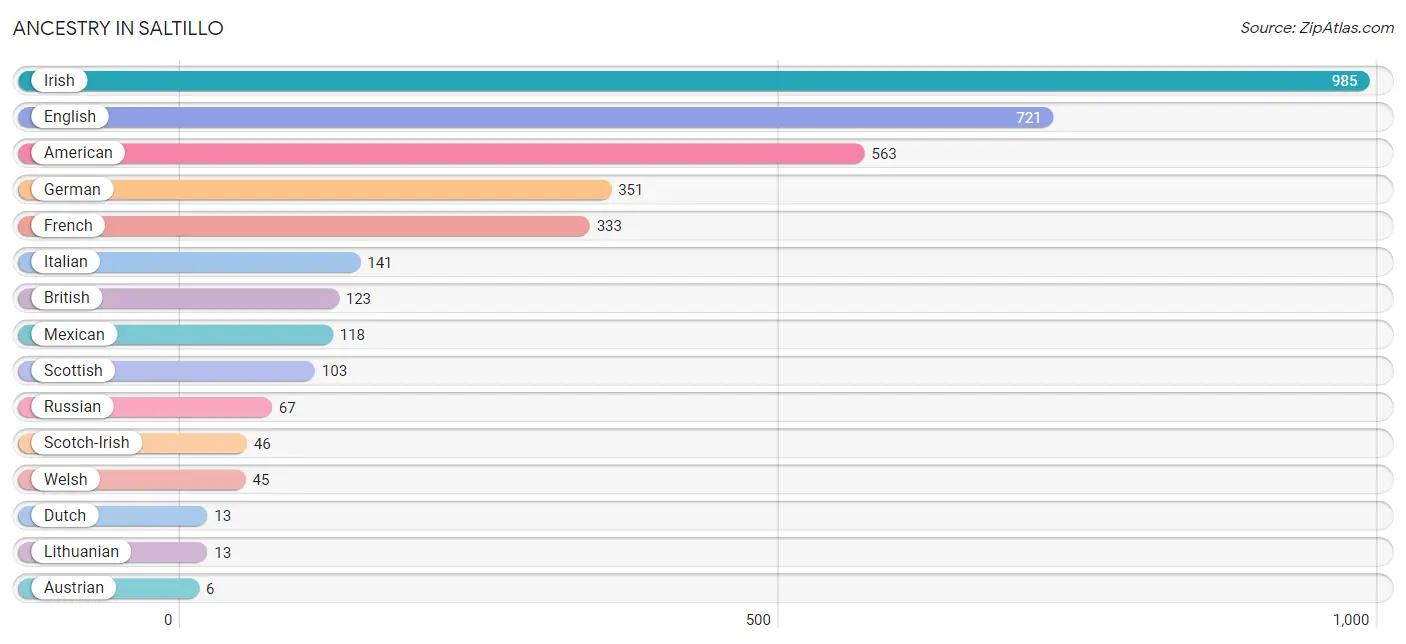
| Ancestry | # Population | % Population |
| American | 563 | 11.5% |
| Austrian | 6 | 0.1% |
| British | 123 | 2.5% |
| Dutch | 13 | 0.3% |
| English | 721 | 14.7% |
| French | 333 | 6.8% |
| German | 351 | 7.1% |
| Hungarian | 6 | 0.1% |
| Irish | 985 | 20.1% |
| Italian | 141 | 2.9% |
| Lithuanian | 13 | 0.3% |
| Mexican | 118 | 2.4% |
| Russian | 67 | 1.4% |
| Scotch-Irish | 46 | 0.9% |
| Scottish | 103 | 2.1% |
| Welsh | 45 | 0.9% | View All 16 Rows |
Immigrants in Saltillo
The most numerous immigrant groups reported in Saltillo came from Europe (77 | 1.6%), Eastern Europe (67 | 1.4%), Russia (67 | 1.4%), and Northern Europe (10 | 0.2%), together accounting for 4.5% of all Saltillo residents.
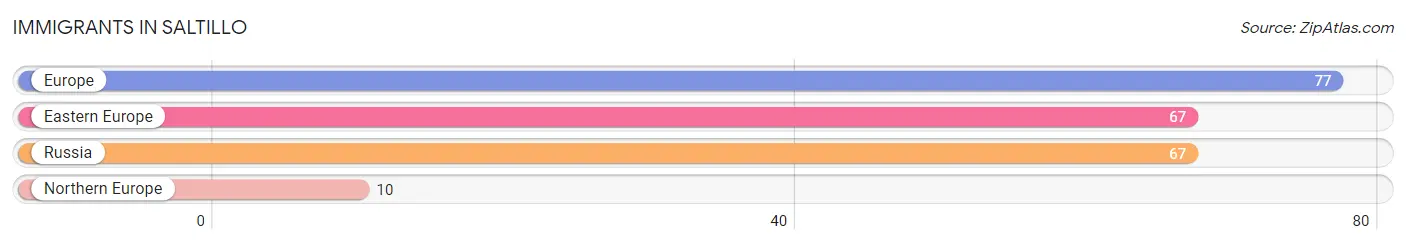
| Immigration Origin | # Population | % Population |
| Eastern Europe | 67 | 1.4% |
| Europe | 77 | 1.6% |
| Northern Europe | 10 | 0.2% |
| Russia | 67 | 1.4% | View All 4 Rows |
Sex and Age in Saltillo
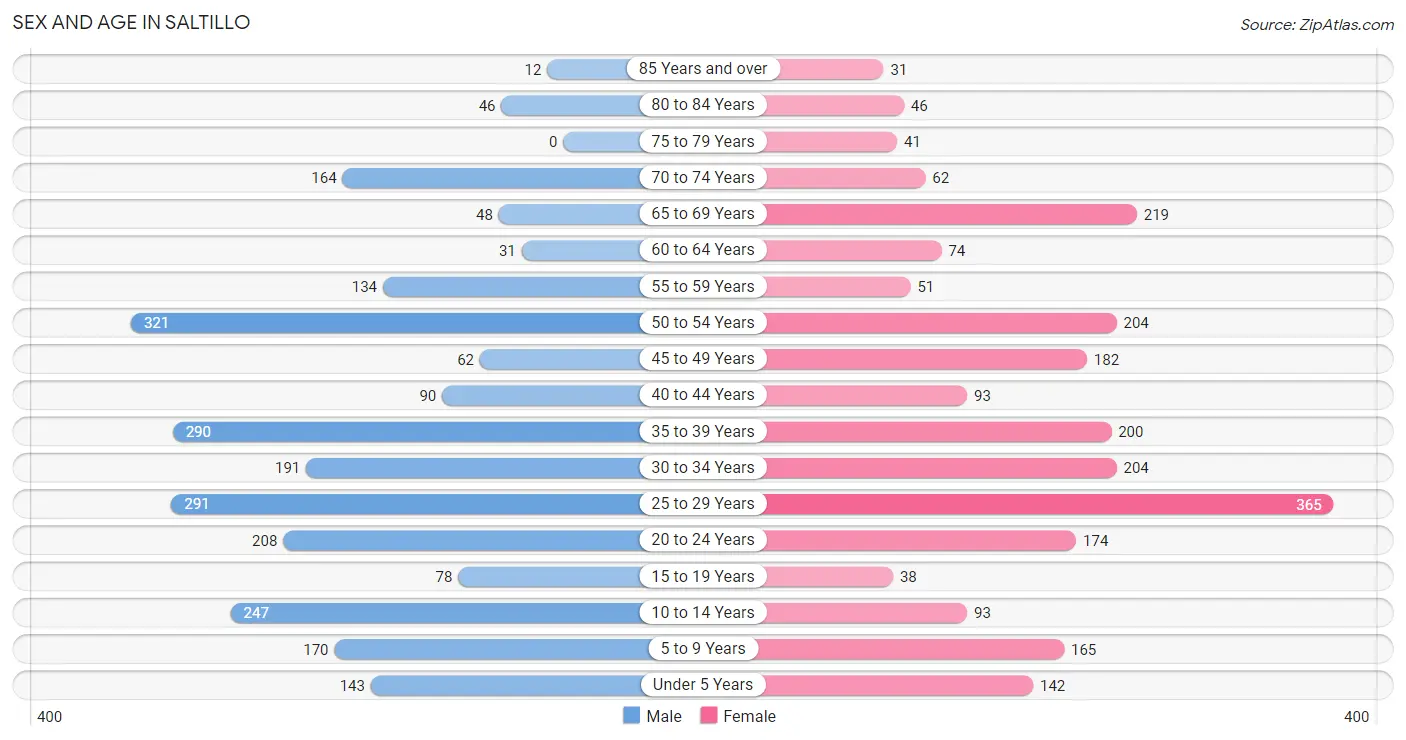
Sex and Age in Saltillo
The most populous age groups in Saltillo are 50 to 54 Years (321 | 12.7%) for men and 25 to 29 Years (365 | 15.3%) for women.
| Age Bracket | Male | Female |
| Under 5 Years | 143 (5.7%) | 142 (6.0%) |
| 5 to 9 Years | 170 (6.7%) | 165 (6.9%) |
| 10 to 14 Years | 247 (9.8%) | 93 (3.9%) |
| 15 to 19 Years | 78 (3.1%) | 38 (1.6%) |
| 20 to 24 Years | 208 (8.2%) | 174 (7.3%) |
| 25 to 29 Years | 291 (11.5%) | 365 (15.3%) |
| 30 to 34 Years | 191 (7.6%) | 204 (8.6%) |
| 35 to 39 Years | 290 (11.5%) | 200 (8.4%) |
| 40 to 44 Years | 90 (3.6%) | 93 (3.9%) |
| 45 to 49 Years | 62 (2.5%) | 182 (7.6%) |
| 50 to 54 Years | 321 (12.7%) | 204 (8.6%) |
| 55 to 59 Years | 134 (5.3%) | 51 (2.1%) |
| 60 to 64 Years | 31 (1.2%) | 74 (3.1%) |
| 65 to 69 Years | 48 (1.9%) | 219 (9.2%) |
| 70 to 74 Years | 164 (6.5%) | 62 (2.6%) |
| 75 to 79 Years | 0 (0.0%) | 41 (1.7%) |
| 80 to 84 Years | 46 (1.8%) | 46 (1.9%) |
| 85 Years and over | 12 (0.5%) | 31 (1.3%) |
| Total | 2,526 (100.0%) | 2,384 (100.0%) |
Families and Households in Saltillo
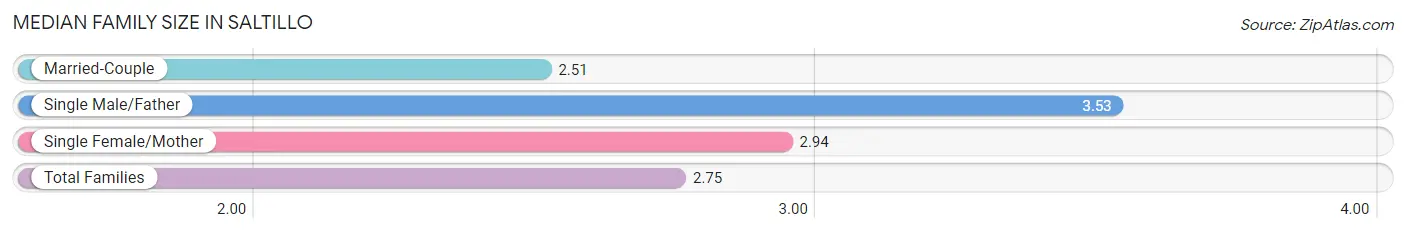
Median Family Size in Saltillo
The median family size in Saltillo is 2.75 persons per family, with single male/father families (276 | 17.6%) accounting for the largest median family size of 3.53 persons per family. On the other hand, married-couple families (1,065 | 68.0%) represent the smallest median family size with 2.51 persons per family.
| Family Type | # Families | Family Size |
| Married-Couple | 1,065 (68.0%) | 2.51 |
| Single Male/Father | 276 (17.6%) | 3.53 |
| Single Female/Mother | 226 (14.4%) | 2.94 |
| Total Families | 1,567 (100.0%) | 2.75 |
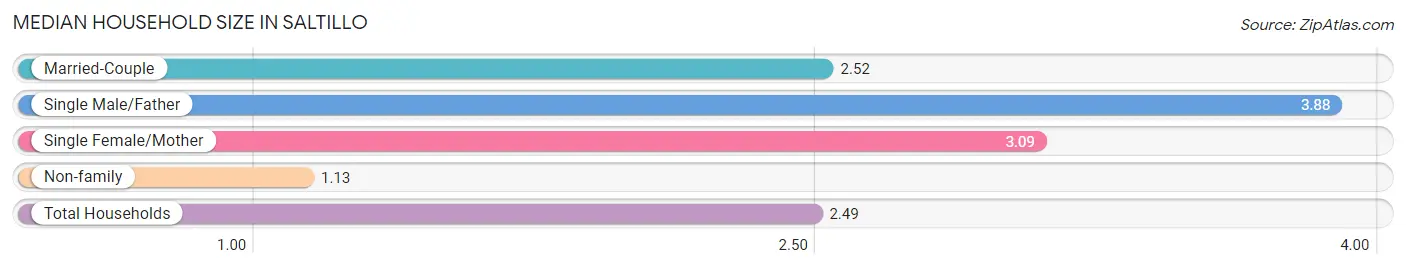
Median Household Size in Saltillo
The median household size in Saltillo is 2.49 persons per household, with single male/father households (276 | 14.0%) accounting for the largest median household size of 3.88 persons per household. non-family households (402 | 20.4%) represent the smallest median household size with 1.13 persons per household.
| Household Type | # Households | Household Size |
| Married-Couple | 1,065 (54.1%) | 2.52 |
| Single Male/Father | 276 (14.0%) | 3.88 |
| Single Female/Mother | 226 (11.5%) | 3.09 |
| Non-family | 402 (20.4%) | 1.13 |
| Total Households | 1,969 (100.0%) | 2.49 |
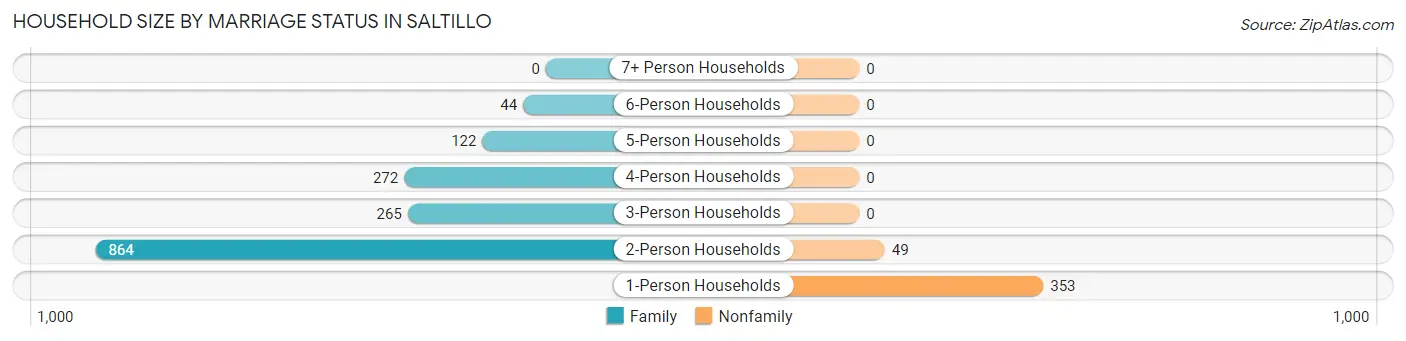
Household Size by Marriage Status in Saltillo
Out of a total of 1,969 households in Saltillo, 1,567 (79.6%) are family households, while 402 (20.4%) are nonfamily households. The most numerous type of family households are 2-person households, comprising 864, and the most common type of nonfamily households are 1-person households, comprising 353.
| Household Size | Family Households | Nonfamily Households |
| 1-Person Households | - | 353 (17.9%) |
| 2-Person Households | 864 (43.9%) | 49 (2.5%) |
| 3-Person Households | 265 (13.5%) | 0 (0.0%) |
| 4-Person Households | 272 (13.8%) | 0 (0.0%) |
| 5-Person Households | 122 (6.2%) | 0 (0.0%) |
| 6-Person Households | 44 (2.2%) | 0 (0.0%) |
| 7+ Person Households | 0 (0.0%) | 0 (0.0%) |
| Total | 1,567 (79.6%) | 402 (20.4%) |
Female Fertility in Saltillo
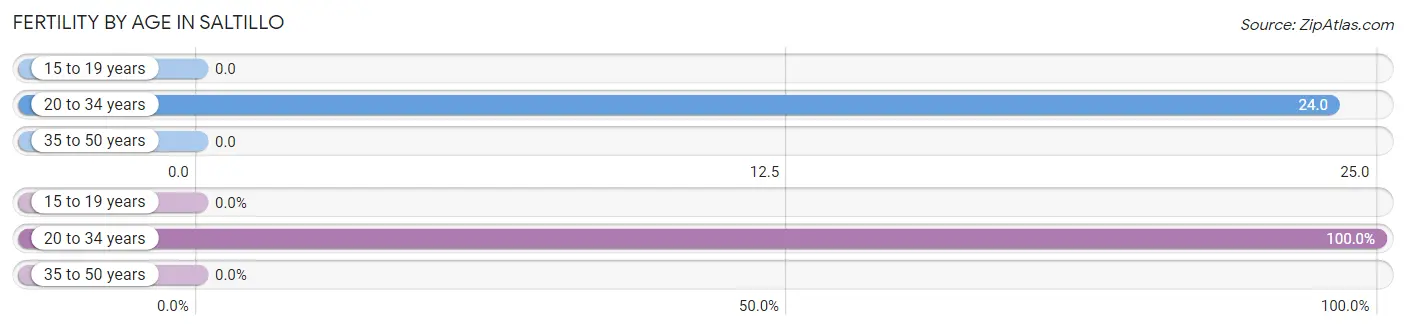
Fertility by Age in Saltillo
Average fertility rate in Saltillo is 14.0 births per 1,000 women. Women in the age bracket of 20 to 34 years have the highest fertility rate with 24.0 births per 1,000 women. Women in the age bracket of 20 to 34 years acount for 100.0% of all women with births.
| Age Bracket | Women with Births | Births / 1,000 Women |
| 15 to 19 years | 0 (0.0%) | 0.0 |
| 20 to 34 years | 18 (100.0%) | 24.0 |
| 35 to 50 years | 0 (0.0%) | 0.0 |
| Total | 18 (100.0%) | 14.0 |
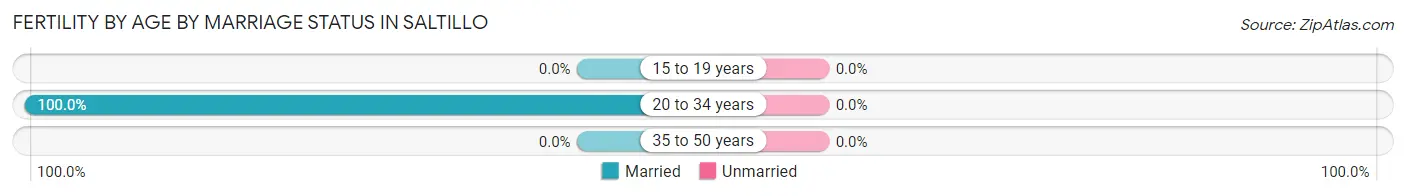
Fertility by Age by Marriage Status in Saltillo
| Age Bracket | Married | Unmarried |
| 15 to 19 years | 0 (0.0%) | 0 (0.0%) |
| 20 to 34 years | 18 (100.0%) | 0 (0.0%) |
| 35 to 50 years | 0 (0.0%) | 0 (0.0%) |
| Total | 18 (100.0%) | 0 (0.0%) |
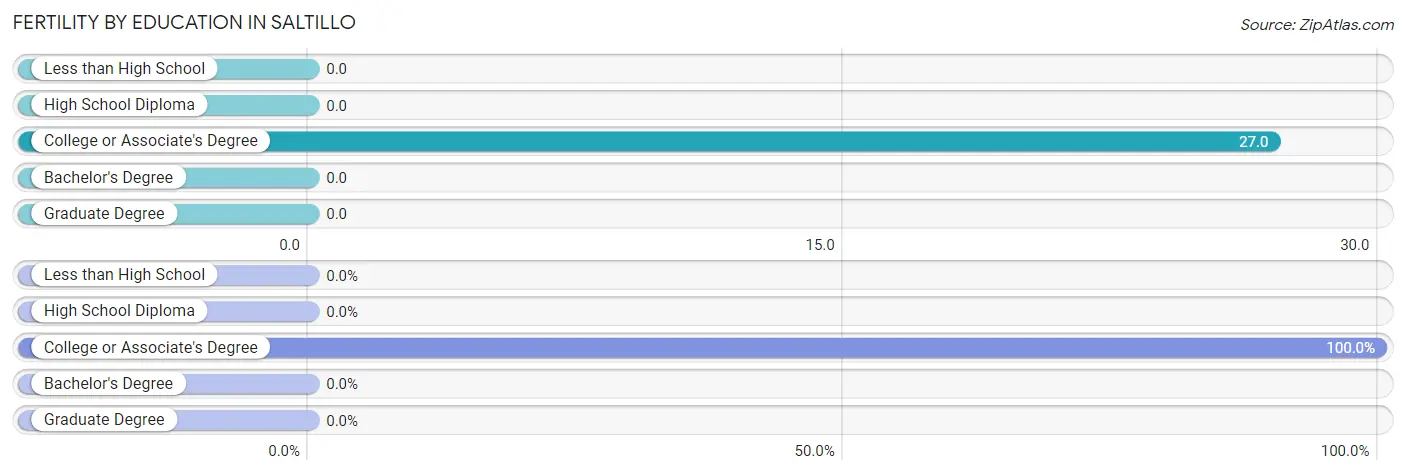
Fertility by Education in Saltillo
| Educational Attainment | Women with Births | Births / 1,000 Women |
| Less than High School | 0 (0.0%) | 0.0 |
| High School Diploma | 0 (0.0%) | 0.0 |
| College or Associate's Degree | 18 (100.0%) | 27.0 |
| Bachelor's Degree | 0 (0.0%) | 0.0 |
| Graduate Degree | 0 (0.0%) | 0.0 |
| Total | 18 (100.0%) | 14.0 |
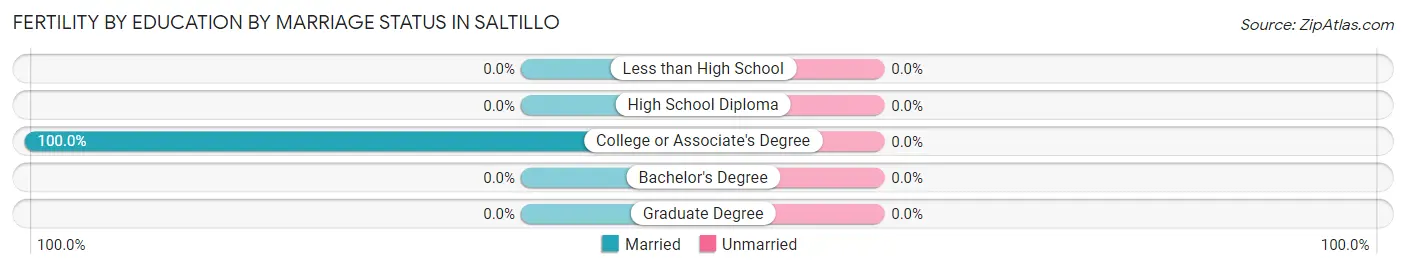
Fertility by Education by Marriage Status in Saltillo
| Educational Attainment | Married | Unmarried |
| Less than High School | 0 (0.0%) | 0 (0.0%) |
| High School Diploma | 0 (0.0%) | 0 (0.0%) |
| College or Associate's Degree | 18 (100.0%) | 0 (0.0%) |
| Bachelor's Degree | 0 (0.0%) | 0 (0.0%) |
| Graduate Degree | 0 (0.0%) | 0 (0.0%) |
| Total | 18 (100.0%) | 0 (0.0%) |
Employment Characteristics in Saltillo
Employment by Class of Employer in Saltillo
Among the 2,653 employed individuals in Saltillo, private company employees (1,983 | 74.8%), state government employees (261 | 9.8%), and self-employed (not incorporated) (151 | 5.7%) make up the most common classes of employment.
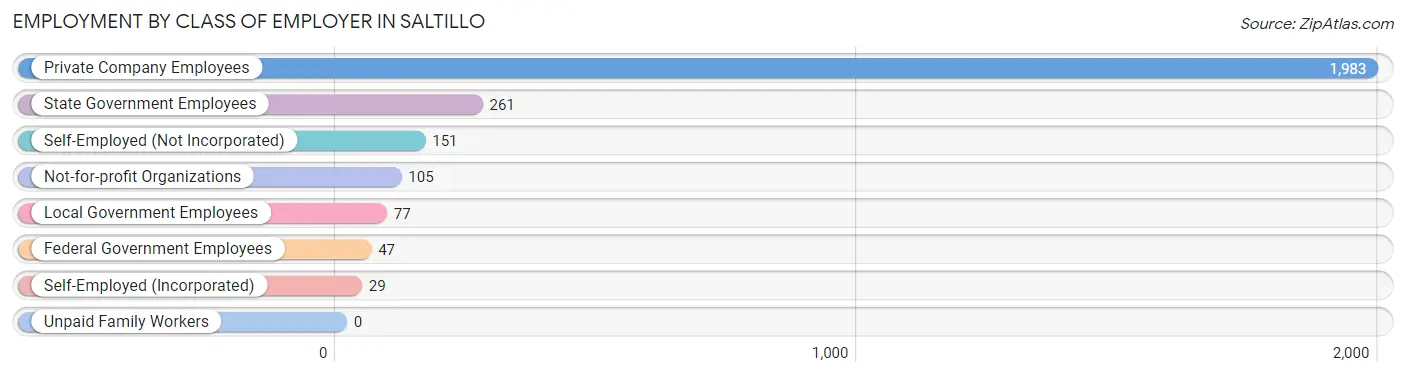
| Employer Class | # Employees | % Employees |
| Private Company Employees | 1,983 | 74.8% |
| Self-Employed (Incorporated) | 29 | 1.1% |
| Self-Employed (Not Incorporated) | 151 | 5.7% |
| Not-for-profit Organizations | 105 | 4.0% |
| Local Government Employees | 77 | 2.9% |
| State Government Employees | 261 | 9.8% |
| Federal Government Employees | 47 | 1.8% |
| Unpaid Family Workers | 0 | 0.0% |
| Total | 2,653 | 100.0% |
Employment Status by Age in Saltillo
According to the labor force statistics for Saltillo, out of the total population over 16 years of age (3,892), 70.8% or 2,756 individuals are in the labor force, with 3.8% or 105 of them unemployed. The age group with the highest labor force participation rate is 25 to 29 years, with 100.0% or 656 individuals in the labor force. Within the labor force, the 20 to 24 years age range has the highest percentage of unemployed individuals, with 24.8% or 85 of them being unemployed.
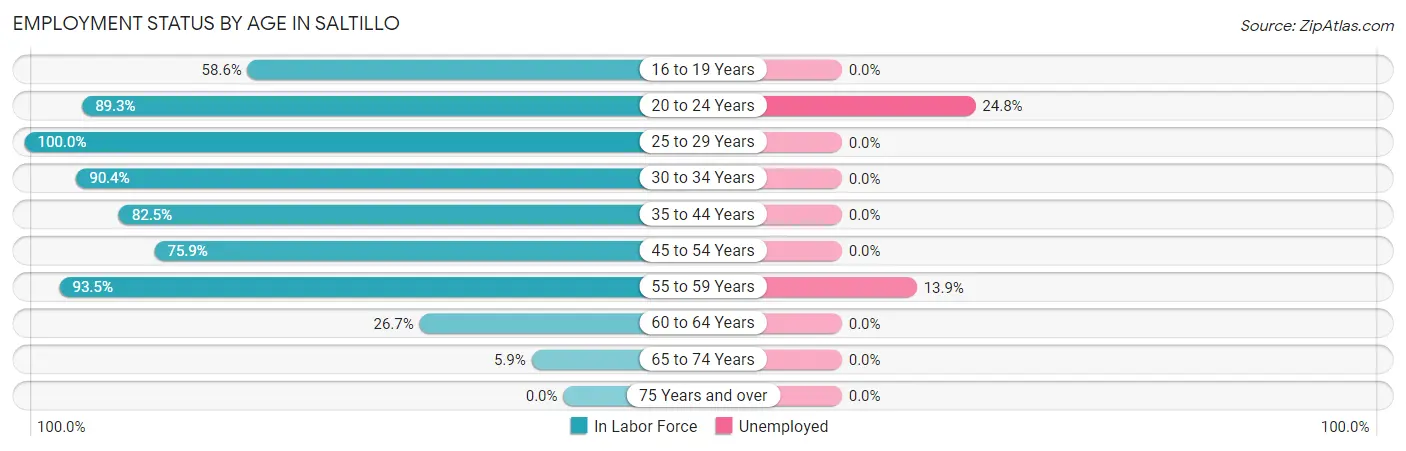
| Age Bracket | In Labor Force | Unemployed |
| 16 to 19 Years | 34 (58.6%) | 0 (0.0%) |
| 20 to 24 Years | 341 (89.3%) | 85 (24.8%) |
| 25 to 29 Years | 656 (100.0%) | 0 (0.0%) |
| 30 to 34 Years | 357 (90.4%) | 0 (0.0%) |
| 35 to 44 Years | 555 (82.5%) | 0 (0.0%) |
| 45 to 54 Years | 584 (75.9%) | 0 (0.0%) |
| 55 to 59 Years | 173 (93.5%) | 24 (13.9%) |
| 60 to 64 Years | 28 (26.7%) | 0 (0.0%) |
| 65 to 74 Years | 29 (5.9%) | 0 (0.0%) |
| 75 Years and over | 0 (0.0%) | 0 (0.0%) |
| Total | 2,756 (70.8%) | 105 (3.8%) |
Employment Status by Educational Attainment in Saltillo
According to labor force statistics for Saltillo, 84.5% of individuals (2,352) out of the total population between 25 and 64 years of age (2,783) are in the labor force, with 1.0% or 24 of them being unemployed. The group with the highest labor force participation rate are those with the educational attainment of bachelor's degree or higher, with 100.0% or 685 individuals in the labor force. Within the labor force, individuals with less than high school education have the highest percentage of unemployment, with 24.7% or 24 of them being unemployed.
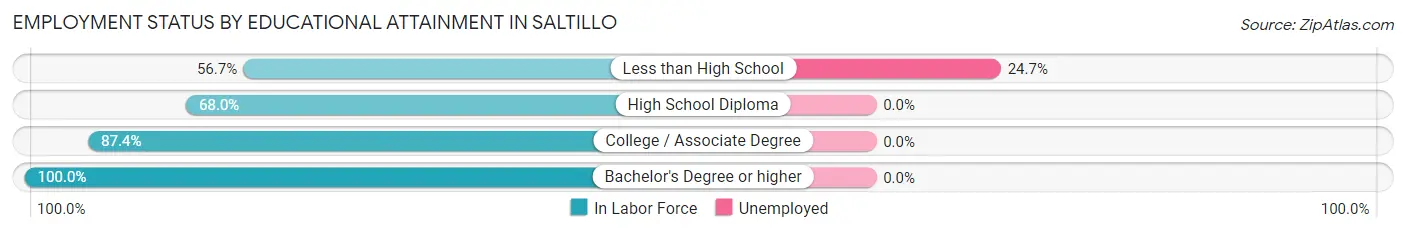
| Educational Attainment | In Labor Force | Unemployed |
| Less than High School | 97 (56.7%) | 42 (24.7%) |
| High School Diploma | 396 (68.0%) | 0 (0.0%) |
| College / Associate Degree | 1,176 (87.4%) | 0 (0.0%) |
| Bachelor's Degree or higher | 685 (100.0%) | 0 (0.0%) |
| Total | 2,352 (84.5%) | 28 (1.0%) |
Employment Occupations by Sex in Saltillo
Management, Business, Science and Arts Occupations
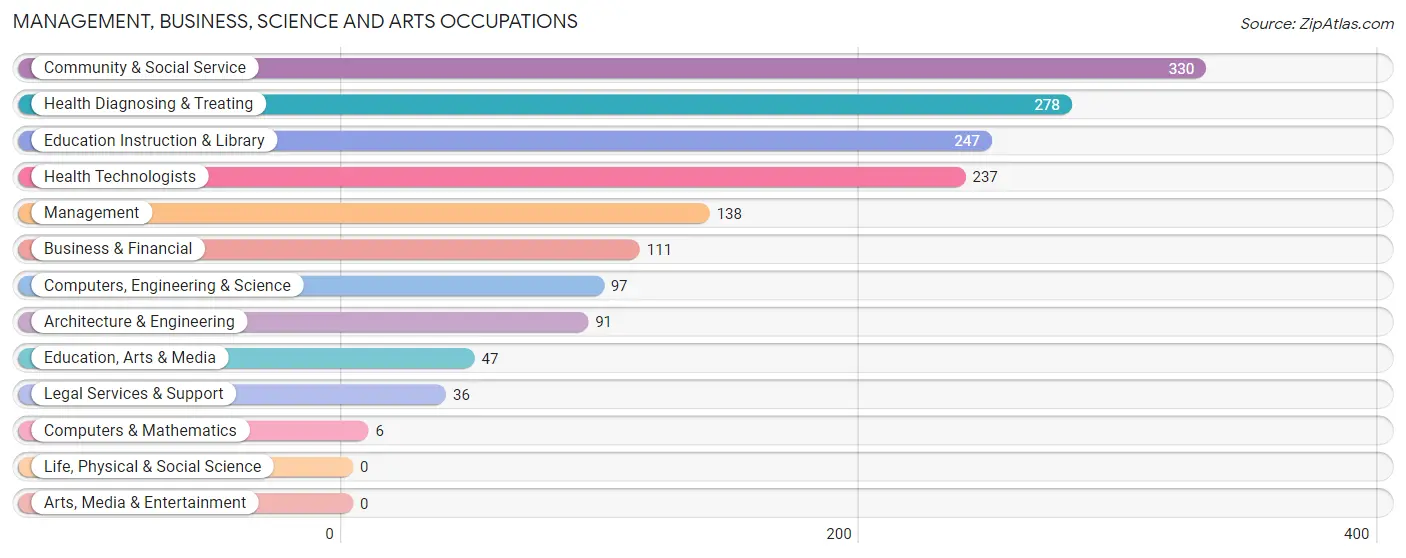
The most common Management, Business, Science and Arts occupations in Saltillo are Community & Social Service (330 | 12.5%), Health Diagnosing & Treating (278 | 10.5%), Education Instruction & Library (247 | 9.4%), Health Technologists (237 | 9.0%), and Management (138 | 5.2%).
Management, Business, Science and Arts Occupations by Sex
Within the Management, Business, Science and Arts occupations in Saltillo, the most male-oriented occupations are Computers, Engineering & Science (100.0%), Computers & Mathematics (100.0%), and Architecture & Engineering (100.0%), while the most female-oriented occupations are Education, Arts & Media (100.0%), Legal Services & Support (100.0%), and Community & Social Service (85.8%).
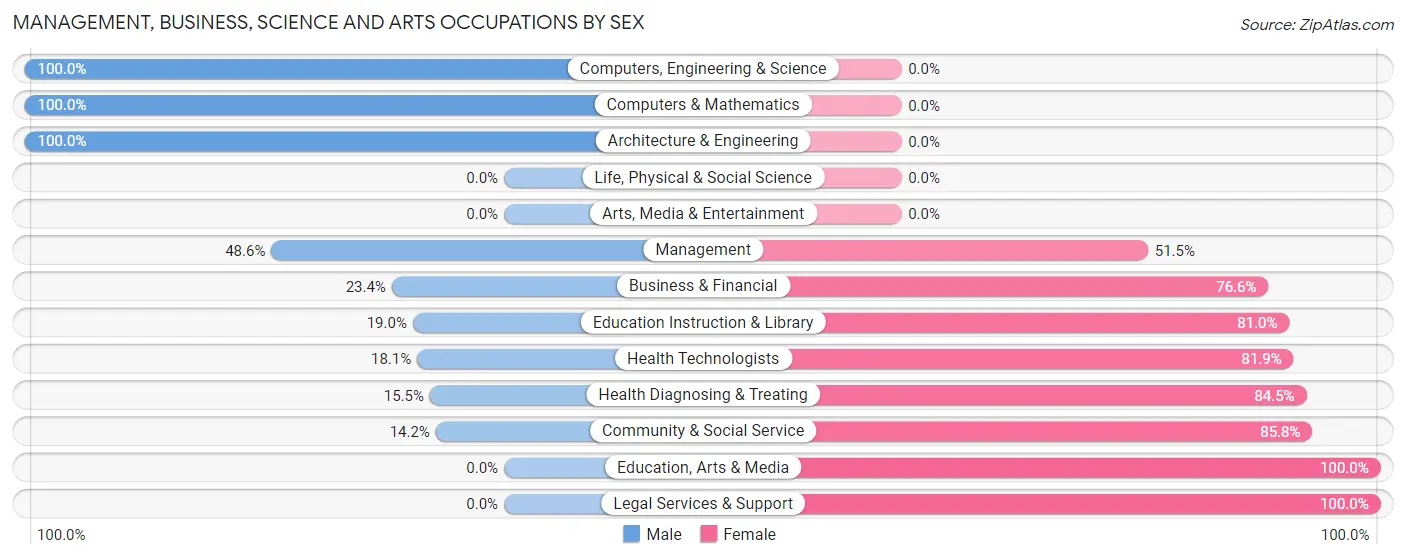
| Occupation | Male | Female |
| Management | 67 (48.5%) | 71 (51.4%) |
| Business & Financial | 26 (23.4%) | 85 (76.6%) |
| Computers, Engineering & Science | 97 (100.0%) | 0 (0.0%) |
| Computers & Mathematics | 6 (100.0%) | 0 (0.0%) |
| Architecture & Engineering | 91 (100.0%) | 0 (0.0%) |
| Life, Physical & Social Science | 0 (0.0%) | 0 (0.0%) |
| Community & Social Service | 47 (14.2%) | 283 (85.8%) |
| Education, Arts & Media | 0 (0.0%) | 47 (100.0%) |
| Legal Services & Support | 0 (0.0%) | 36 (100.0%) |
| Education Instruction & Library | 47 (19.0%) | 200 (81.0%) |
| Arts, Media & Entertainment | 0 (0.0%) | 0 (0.0%) |
| Health Diagnosing & Treating | 43 (15.5%) | 235 (84.5%) |
| Health Technologists | 43 (18.1%) | 194 (81.9%) |
| Total (Category) | 280 (29.3%) | 674 (70.7%) |
| Total (Overall) | 1,454 (55.2%) | 1,181 (44.8%) |
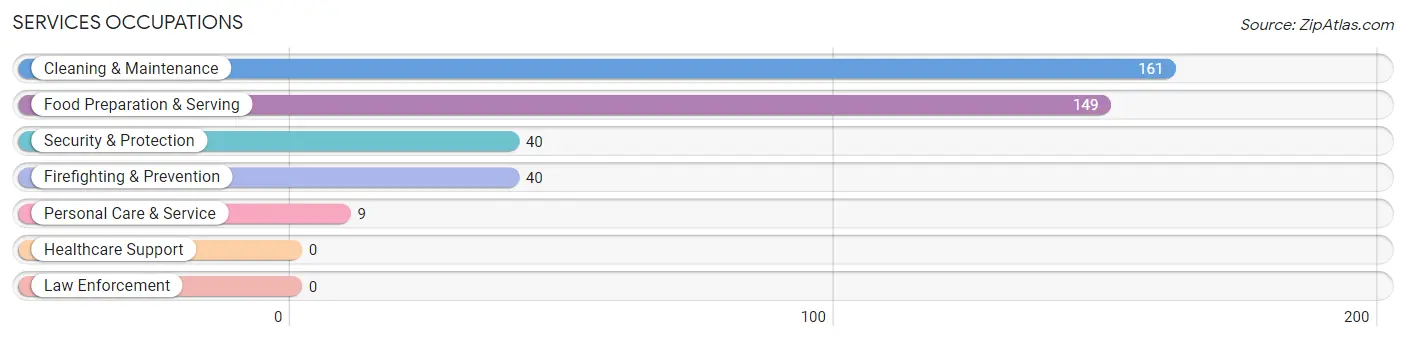
Services Occupations
The most common Services occupations in Saltillo are Cleaning & Maintenance (161 | 6.1%), Food Preparation & Serving (149 | 5.7%), Security & Protection (40 | 1.5%), Firefighting & Prevention (40 | 1.5%), and Personal Care & Service (9 | 0.3%).
Services Occupations by Sex
Within the Services occupations in Saltillo, the most male-oriented occupations are Security & Protection (100.0%), Firefighting & Prevention (100.0%), and Food Preparation & Serving (72.5%), while the most female-oriented occupations are Personal Care & Service (100.0%), Cleaning & Maintenance (49.1%), and Food Preparation & Serving (27.5%).
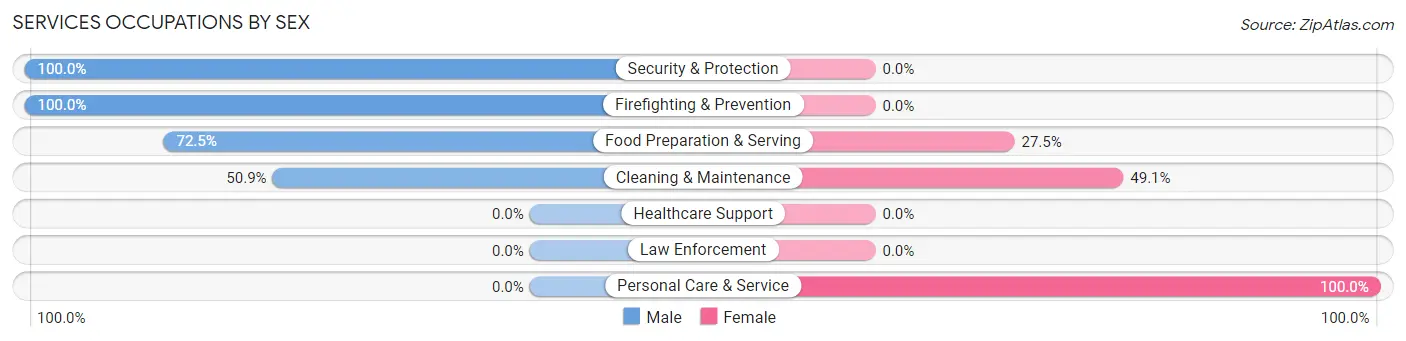
| Occupation | Male | Female |
| Healthcare Support | 0 (0.0%) | 0 (0.0%) |
| Security & Protection | 40 (100.0%) | 0 (0.0%) |
| Firefighting & Prevention | 40 (100.0%) | 0 (0.0%) |
| Law Enforcement | 0 (0.0%) | 0 (0.0%) |
| Food Preparation & Serving | 108 (72.5%) | 41 (27.5%) |
| Cleaning & Maintenance | 82 (50.9%) | 79 (49.1%) |
| Personal Care & Service | 0 (0.0%) | 9 (100.0%) |
| Total (Category) | 230 (64.1%) | 129 (35.9%) |
| Total (Overall) | 1,454 (55.2%) | 1,181 (44.8%) |
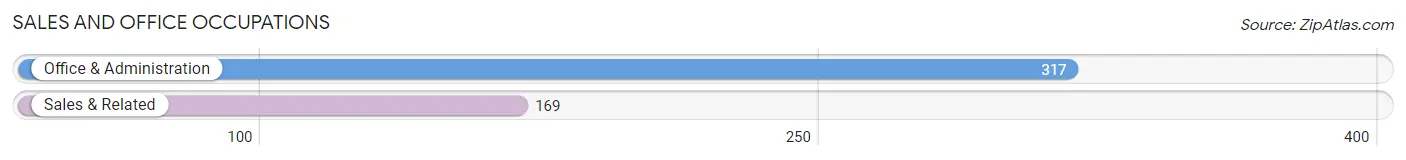
Sales and Office Occupations
The most common Sales and Office occupations in Saltillo are Office & Administration (317 | 12.0%), and Sales & Related (169 | 6.4%).
Sales and Office Occupations by Sex
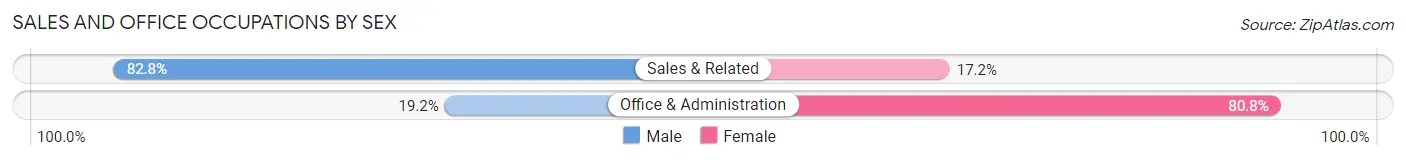
| Occupation | Male | Female |
| Sales & Related | 140 (82.8%) | 29 (17.2%) |
| Office & Administration | 61 (19.2%) | 256 (80.8%) |
| Total (Category) | 201 (41.4%) | 285 (58.6%) |
| Total (Overall) | 1,454 (55.2%) | 1,181 (44.8%) |
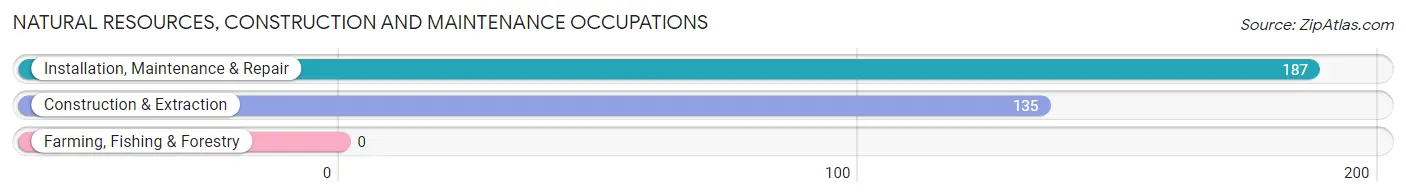
Natural Resources, Construction and Maintenance Occupations
The most common Natural Resources, Construction and Maintenance occupations in Saltillo are Installation, Maintenance & Repair (187 | 7.1%), and Construction & Extraction (135 | 5.1%).
Natural Resources, Construction and Maintenance Occupations by Sex
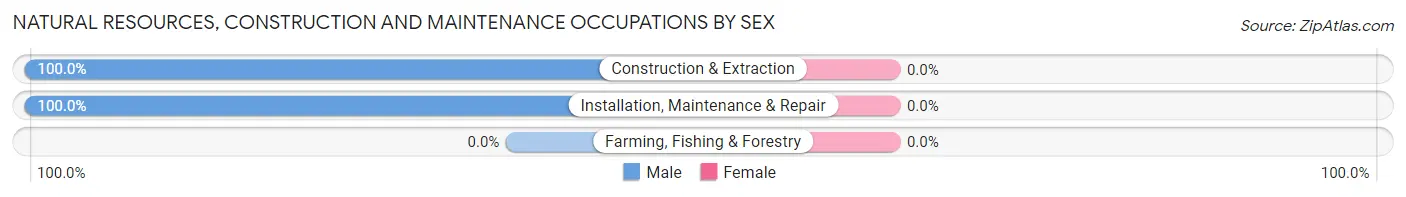
| Occupation | Male | Female |
| Farming, Fishing & Forestry | 0 (0.0%) | 0 (0.0%) |
| Construction & Extraction | 135 (100.0%) | 0 (0.0%) |
| Installation, Maintenance & Repair | 187 (100.0%) | 0 (0.0%) |
| Total (Category) | 322 (100.0%) | 0 (0.0%) |
| Total (Overall) | 1,454 (55.2%) | 1,181 (44.8%) |
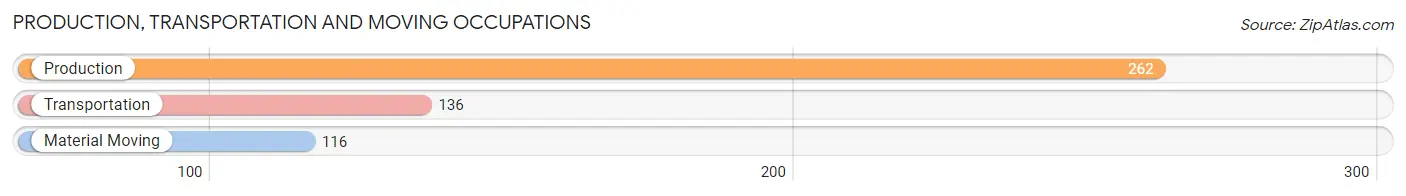
Production, Transportation and Moving Occupations
The most common Production, Transportation and Moving occupations in Saltillo are Production (262 | 9.9%), Transportation (136 | 5.2%), and Material Moving (116 | 4.4%).
Production, Transportation and Moving Occupations by Sex
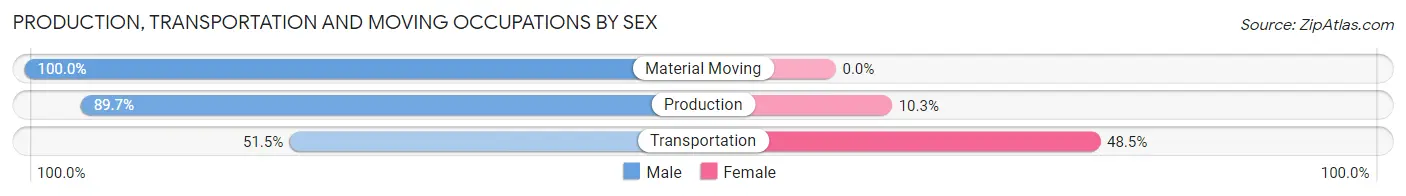
| Occupation | Male | Female |
| Production | 235 (89.7%) | 27 (10.3%) |
| Transportation | 70 (51.5%) | 66 (48.5%) |
| Material Moving | 116 (100.0%) | 0 (0.0%) |
| Total (Category) | 421 (81.9%) | 93 (18.1%) |
| Total (Overall) | 1,454 (55.2%) | 1,181 (44.8%) |
Employment Industries by Sex in Saltillo
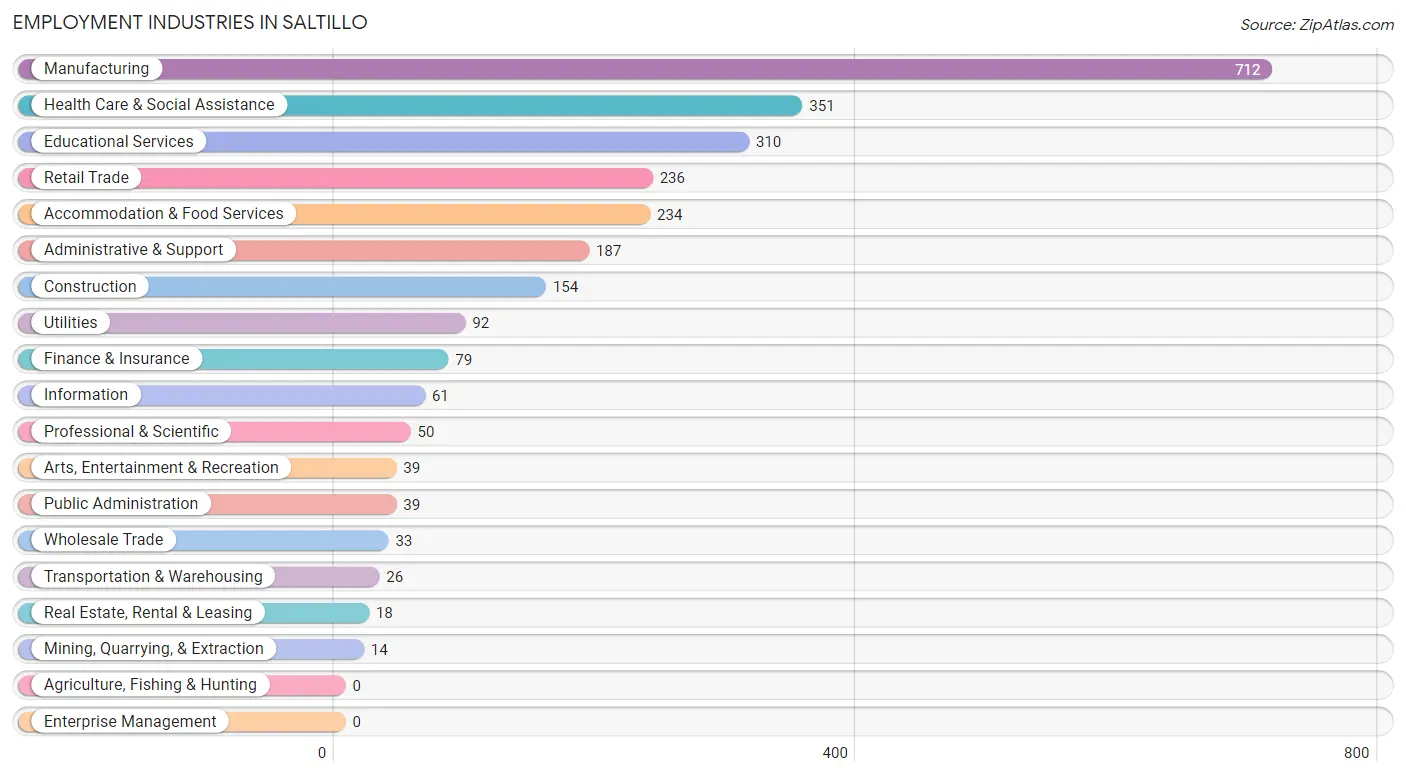
Employment Industries in Saltillo
The major employment industries in Saltillo include Manufacturing (712 | 27.0%), Health Care & Social Assistance (351 | 13.3%), Educational Services (310 | 11.8%), Retail Trade (236 | 9.0%), and Accommodation & Food Services (234 | 8.9%).
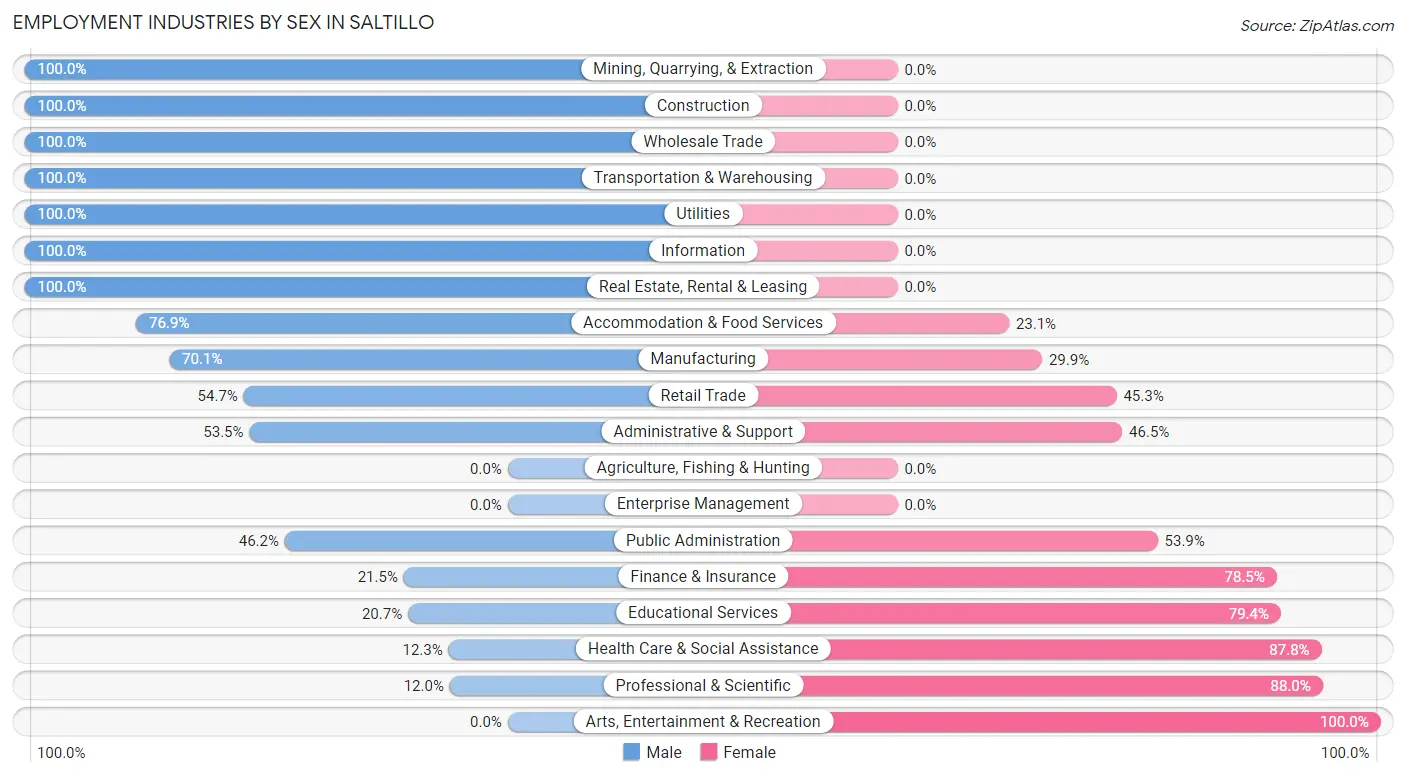
Employment Industries by Sex in Saltillo
The Saltillo industries that see more men than women are Mining, Quarrying, & Extraction (100.0%), Construction (100.0%), and Wholesale Trade (100.0%), whereas the industries that tend to have a higher number of women are Arts, Entertainment & Recreation (100.0%), Professional & Scientific (88.0%), and Health Care & Social Assistance (87.7%).
| Industry | Male | Female |
| Agriculture, Fishing & Hunting | 0 (0.0%) | 0 (0.0%) |
| Mining, Quarrying, & Extraction | 14 (100.0%) | 0 (0.0%) |
| Construction | 154 (100.0%) | 0 (0.0%) |
| Manufacturing | 499 (70.1%) | 213 (29.9%) |
| Wholesale Trade | 33 (100.0%) | 0 (0.0%) |
| Retail Trade | 129 (54.7%) | 107 (45.3%) |
| Transportation & Warehousing | 26 (100.0%) | 0 (0.0%) |
| Utilities | 92 (100.0%) | 0 (0.0%) |
| Information | 61 (100.0%) | 0 (0.0%) |
| Finance & Insurance | 17 (21.5%) | 62 (78.5%) |
| Real Estate, Rental & Leasing | 18 (100.0%) | 0 (0.0%) |
| Professional & Scientific | 6 (12.0%) | 44 (88.0%) |
| Enterprise Management | 0 (0.0%) | 0 (0.0%) |
| Administrative & Support | 100 (53.5%) | 87 (46.5%) |
| Educational Services | 64 (20.6%) | 246 (79.3%) |
| Health Care & Social Assistance | 43 (12.2%) | 308 (87.7%) |
| Arts, Entertainment & Recreation | 0 (0.0%) | 39 (100.0%) |
| Accommodation & Food Services | 180 (76.9%) | 54 (23.1%) |
| Public Administration | 18 (46.2%) | 21 (53.8%) |
| Total | 1,454 (55.2%) | 1,181 (44.8%) |
Education in Saltillo
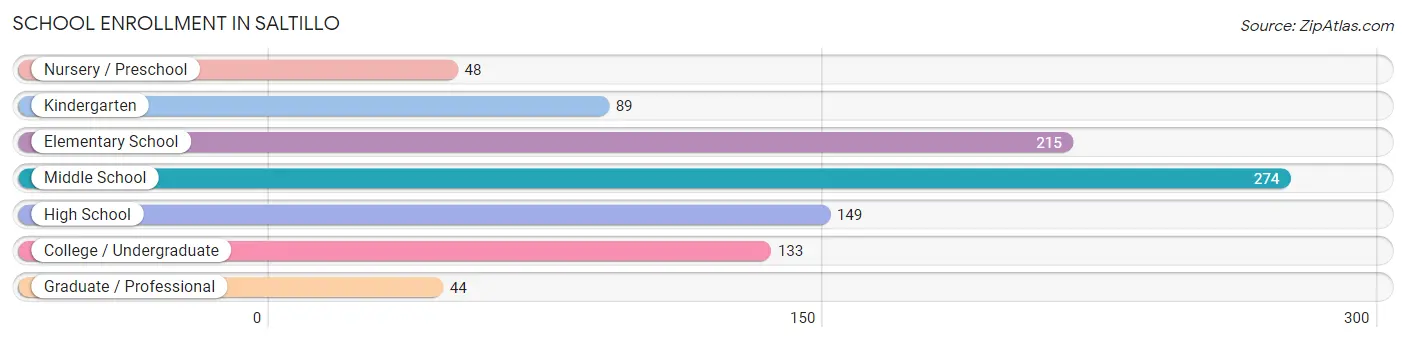
School Enrollment in Saltillo
The most common levels of schooling among the 952 students in Saltillo are middle school (274 | 28.8%), elementary school (215 | 22.6%), and high school (149 | 15.7%).
| School Level | # Students | % Students |
| Nursery / Preschool | 48 | 5.0% |
| Kindergarten | 89 | 9.3% |
| Elementary School | 215 | 22.6% |
| Middle School | 274 | 28.8% |
| High School | 149 | 15.7% |
| College / Undergraduate | 133 | 14.0% |
| Graduate / Professional | 44 | 4.6% |
| Total | 952 | 100.0% |
School Enrollment by Age by Funding Source in Saltillo
Out of a total of 952 students who are enrolled in schools in Saltillo, 143 (15.0%) attend a private institution, while the remaining 809 (85.0%) are enrolled in public schools. The age group of 25 to 34 year olds has the highest likelihood of being enrolled in private schools, with 60 (88.2% in the age bracket) enrolled. Conversely, the age group of 5 to 9 year old has the lowest likelihood of being enrolled in a private school, with 284 (100.0% in the age bracket) attending a public institution.
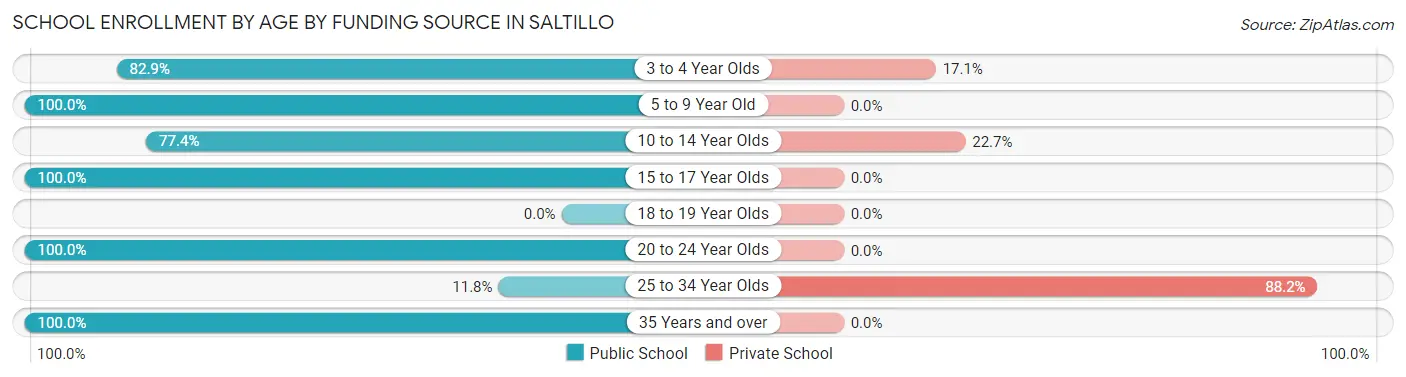
| Age Bracket | Public School | Private School |
| 3 to 4 Year Olds | 29 (82.9%) | 6 (17.1%) |
| 5 to 9 Year Old | 284 (100.0%) | 0 (0.0%) |
| 10 to 14 Year Olds | 263 (77.3%) | 77 (22.7%) |
| 15 to 17 Year Olds | 116 (100.0%) | 0 (0.0%) |
| 18 to 19 Year Olds | 0 (0.0%) | 0 (0.0%) |
| 20 to 24 Year Olds | 39 (100.0%) | 0 (0.0%) |
| 25 to 34 Year Olds | 8 (11.8%) | 60 (88.2%) |
| 35 Years and over | 70 (100.0%) | 0 (0.0%) |
| Total | 809 (85.0%) | 143 (15.0%) |
Educational Attainment by Field of Study in Saltillo
Arts & humanities (336 | 28.4%), education (264 | 22.3%), science & technology (180 | 15.2%), psychology (112 | 9.5%), and business (97 | 8.2%) are the most common fields of study among 1,182 individuals in Saltillo who have obtained a bachelor's degree or higher.
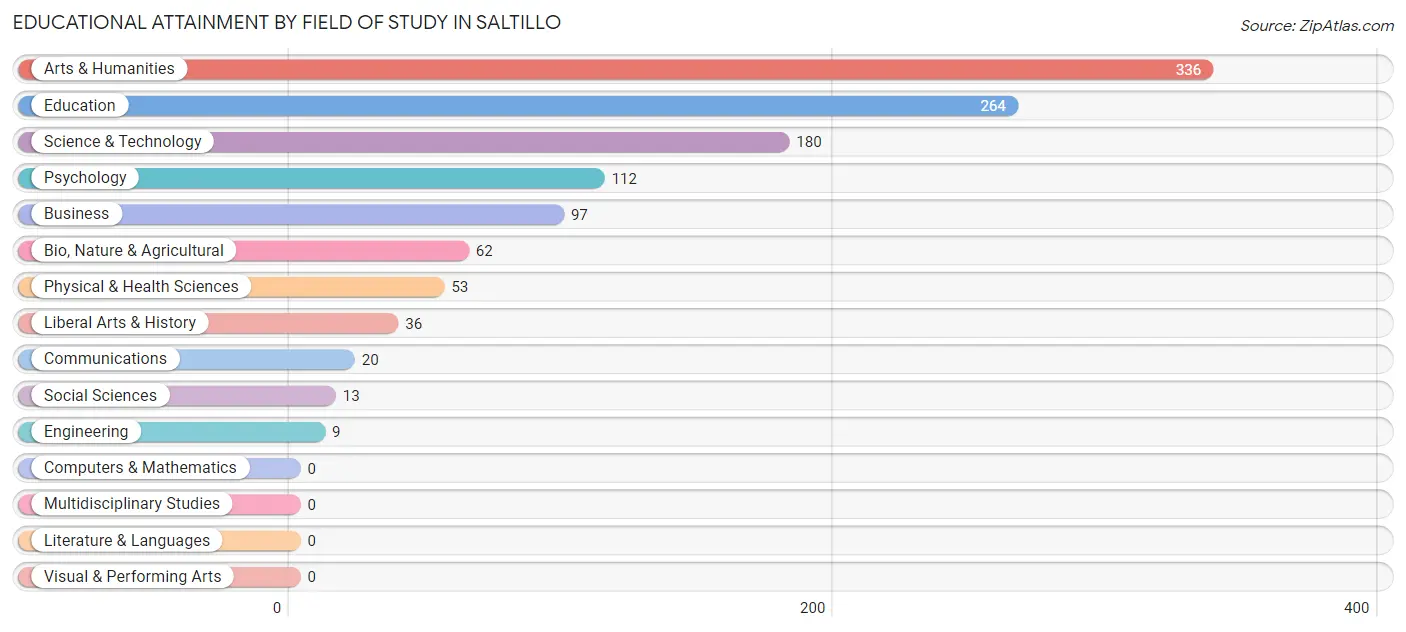
| Field of Study | # Graduates | % Graduates |
| Computers & Mathematics | 0 | 0.0% |
| Bio, Nature & Agricultural | 62 | 5.2% |
| Physical & Health Sciences | 53 | 4.5% |
| Psychology | 112 | 9.5% |
| Social Sciences | 13 | 1.1% |
| Engineering | 9 | 0.8% |
| Multidisciplinary Studies | 0 | 0.0% |
| Science & Technology | 180 | 15.2% |
| Business | 97 | 8.2% |
| Education | 264 | 22.3% |
| Literature & Languages | 0 | 0.0% |
| Liberal Arts & History | 36 | 3.0% |
| Visual & Performing Arts | 0 | 0.0% |
| Communications | 20 | 1.7% |
| Arts & Humanities | 336 | 28.4% |
| Total | 1,182 | 100.0% |
Transportation & Commute in Saltillo
Vehicle Availability by Sex in Saltillo
The most prevalent vehicle ownership categories in Saltillo are males with 2 vehicles (737, accounting for 50.1%) and females with 2 vehicles (434, making up 62.4%).
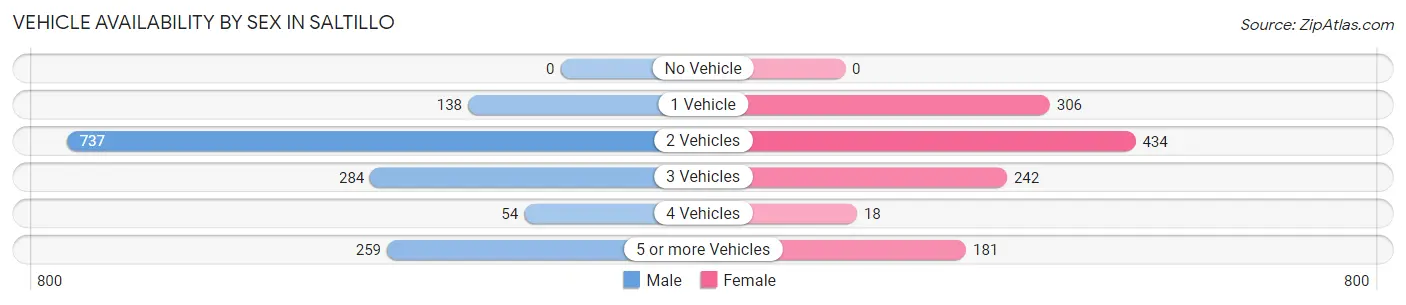
| Vehicles Available | Male | Female |
| No Vehicle | 0 (0.0%) | 0 (0.0%) |
| 1 Vehicle | 138 (9.4%) | 306 (25.9%) |
| 2 Vehicles | 737 (50.1%) | 434 (36.7%) |
| 3 Vehicles | 284 (19.3%) | 242 (20.5%) |
| 4 Vehicles | 54 (3.7%) | 18 (1.5%) |
| 5 or more Vehicles | 259 (17.6%) | 181 (15.3%) |
| Total | 1,472 (100.0%) | 1,181 (100.0%) |
Commute Time in Saltillo
The most frequently occuring commute durations in Saltillo are 20 to 24 minutes (764 commuters, 30.2%), 15 to 19 minutes (445 commuters, 17.6%), and 30 to 34 minutes (298 commuters, 11.8%).
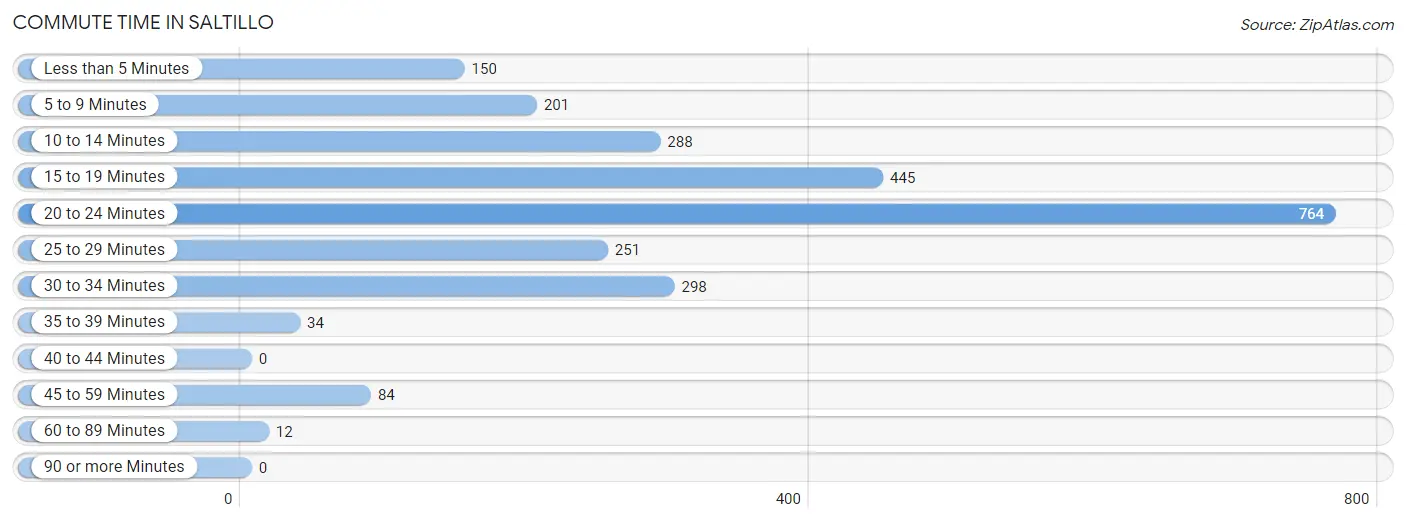
| Commute Time | # Commuters | % Commuters |
| Less than 5 Minutes | 150 | 5.9% |
| 5 to 9 Minutes | 201 | 8.0% |
| 10 to 14 Minutes | 288 | 11.4% |
| 15 to 19 Minutes | 445 | 17.6% |
| 20 to 24 Minutes | 764 | 30.2% |
| 25 to 29 Minutes | 251 | 9.9% |
| 30 to 34 Minutes | 298 | 11.8% |
| 35 to 39 Minutes | 34 | 1.3% |
| 40 to 44 Minutes | 0 | 0.0% |
| 45 to 59 Minutes | 84 | 3.3% |
| 60 to 89 Minutes | 12 | 0.5% |
| 90 or more Minutes | 0 | 0.0% |
Commute Time by Sex in Saltillo
The most common commute times in Saltillo are 20 to 24 minutes (480 commuters, 33.6%) for males and 20 to 24 minutes (284 commuters, 25.8%) for females.
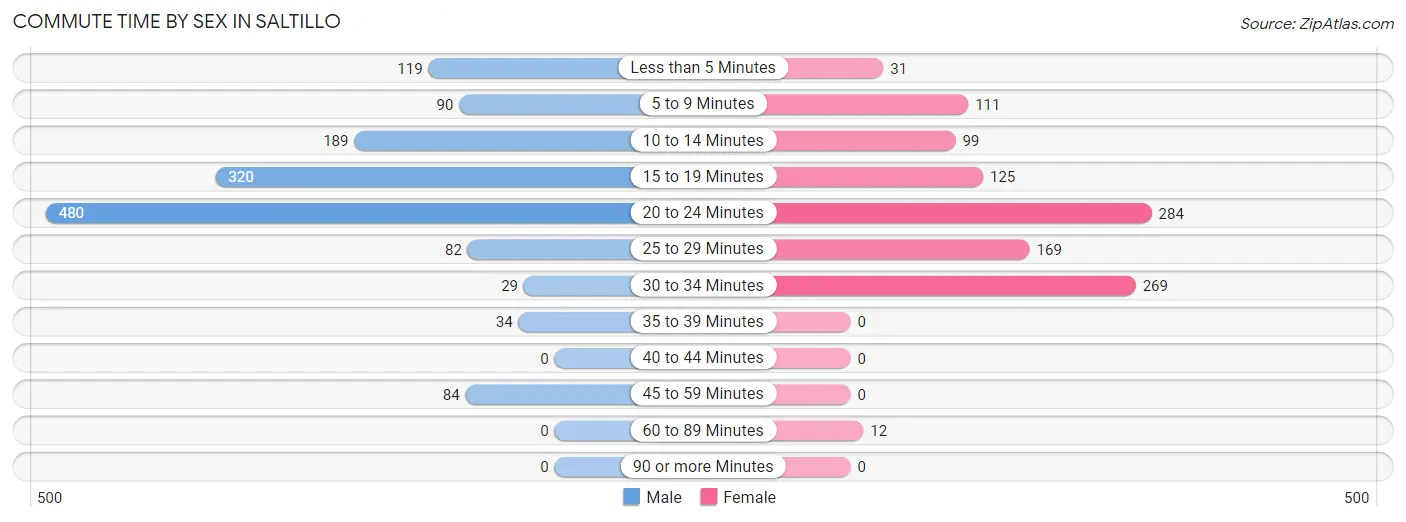
| Commute Time | Male | Female |
| Less than 5 Minutes | 119 (8.3%) | 31 (2.8%) |
| 5 to 9 Minutes | 90 (6.3%) | 111 (10.1%) |
| 10 to 14 Minutes | 189 (13.2%) | 99 (9.0%) |
| 15 to 19 Minutes | 320 (22.4%) | 125 (11.4%) |
| 20 to 24 Minutes | 480 (33.6%) | 284 (25.8%) |
| 25 to 29 Minutes | 82 (5.8%) | 169 (15.4%) |
| 30 to 34 Minutes | 29 (2.0%) | 269 (24.4%) |
| 35 to 39 Minutes | 34 (2.4%) | 0 (0.0%) |
| 40 to 44 Minutes | 0 (0.0%) | 0 (0.0%) |
| 45 to 59 Minutes | 84 (5.9%) | 0 (0.0%) |
| 60 to 89 Minutes | 0 (0.0%) | 12 (1.1%) |
| 90 or more Minutes | 0 (0.0%) | 0 (0.0%) |
Time of Departure to Work by Sex in Saltillo
The most frequent times of departure to work in Saltillo are 6:30 AM to 6:59 AM (311, 21.8%) for males and 6:30 AM to 6:59 AM (304, 27.6%) for females.
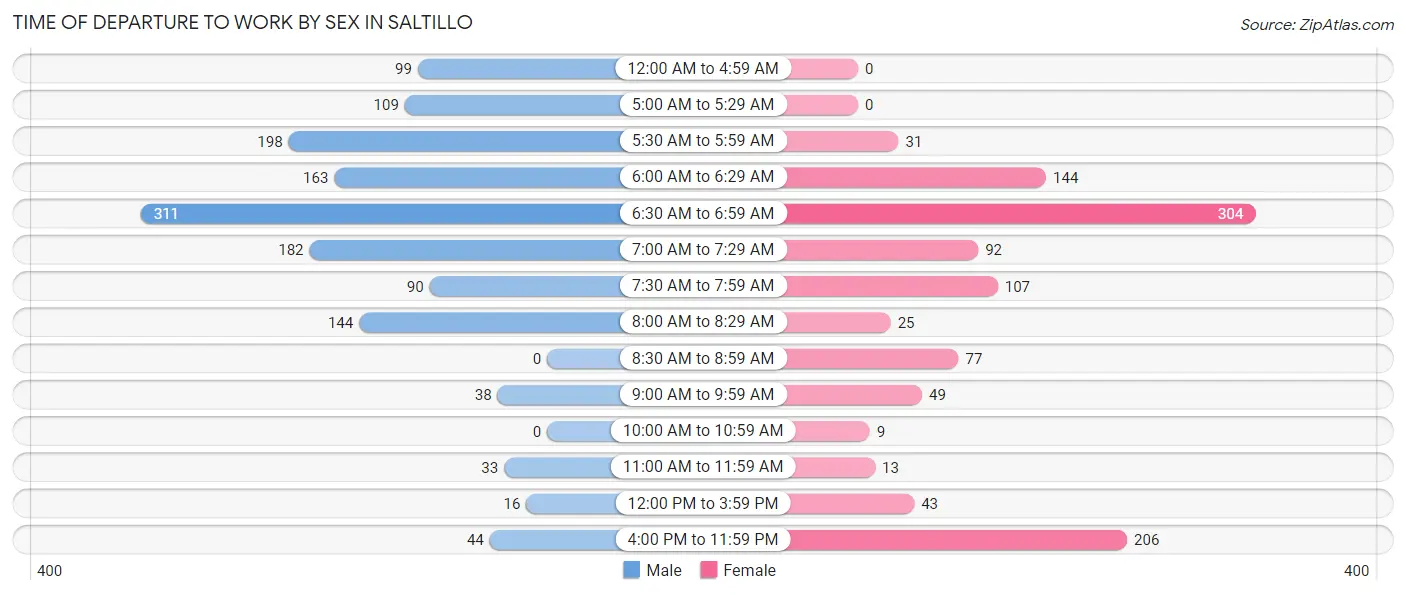
| Time of Departure | Male | Female |
| 12:00 AM to 4:59 AM | 99 (6.9%) | 0 (0.0%) |
| 5:00 AM to 5:29 AM | 109 (7.6%) | 0 (0.0%) |
| 5:30 AM to 5:59 AM | 198 (13.9%) | 31 (2.8%) |
| 6:00 AM to 6:29 AM | 163 (11.4%) | 144 (13.1%) |
| 6:30 AM to 6:59 AM | 311 (21.8%) | 304 (27.6%) |
| 7:00 AM to 7:29 AM | 182 (12.8%) | 92 (8.4%) |
| 7:30 AM to 7:59 AM | 90 (6.3%) | 107 (9.7%) |
| 8:00 AM to 8:29 AM | 144 (10.1%) | 25 (2.3%) |
| 8:30 AM to 8:59 AM | 0 (0.0%) | 77 (7.0%) |
| 9:00 AM to 9:59 AM | 38 (2.7%) | 49 (4.4%) |
| 10:00 AM to 10:59 AM | 0 (0.0%) | 9 (0.8%) |
| 11:00 AM to 11:59 AM | 33 (2.3%) | 13 (1.2%) |
| 12:00 PM to 3:59 PM | 16 (1.1%) | 43 (3.9%) |
| 4:00 PM to 11:59 PM | 44 (3.1%) | 206 (18.7%) |
| Total | 1,427 (100.0%) | 1,100 (100.0%) |
Housing Occupancy in Saltillo
Occupancy by Ownership in Saltillo
Of the total 1,969 dwellings in Saltillo, owner-occupied units account for 1,529 (77.6%), while renter-occupied units make up 440 (22.4%).
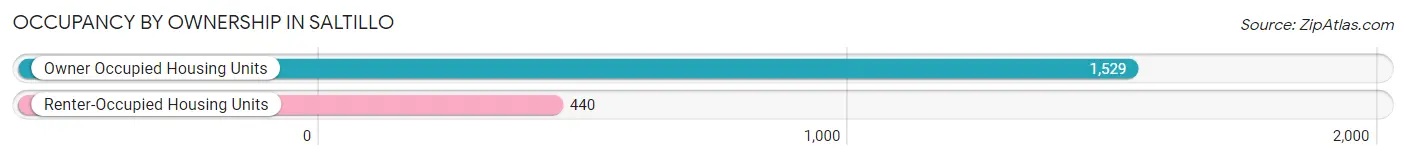
| Occupancy | # Housing Units | % Housing Units |
| Owner Occupied Housing Units | 1,529 | 77.6% |
| Renter-Occupied Housing Units | 440 | 22.4% |
| Total Occupied Housing Units | 1,969 | 100.0% |
Occupancy by Household Size in Saltillo
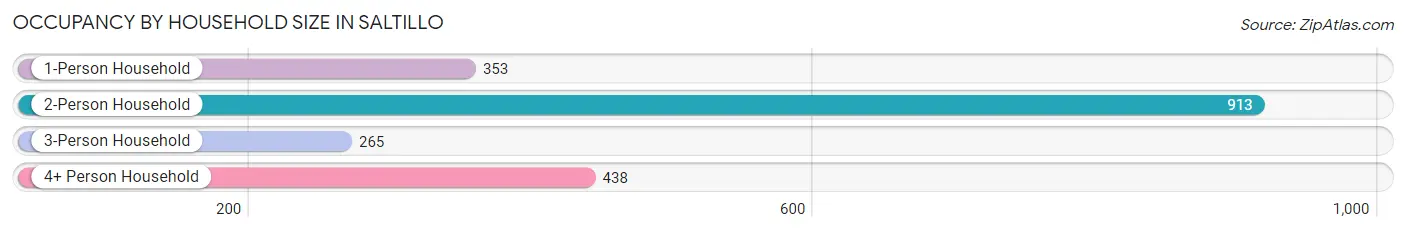
| Household Size | # Housing Units | % Housing Units |
| 1-Person Household | 353 | 17.9% |
| 2-Person Household | 913 | 46.4% |
| 3-Person Household | 265 | 13.5% |
| 4+ Person Household | 438 | 22.2% |
| Total Housing Units | 1,969 | 100.0% |
Occupancy by Ownership by Household Size in Saltillo
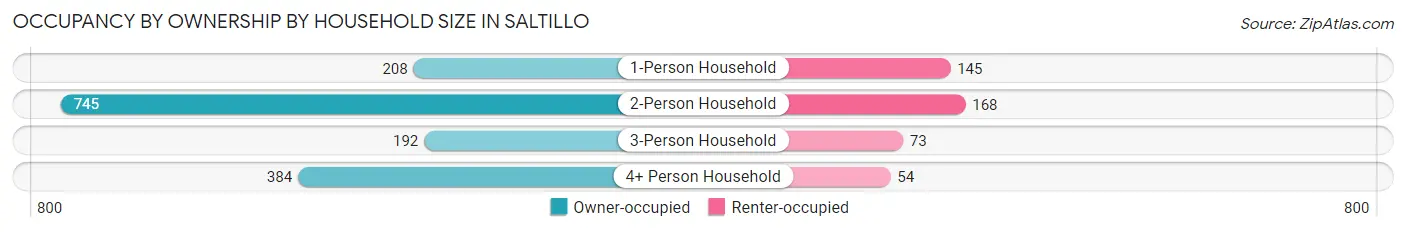
| Household Size | Owner-occupied | Renter-occupied |
| 1-Person Household | 208 (58.9%) | 145 (41.1%) |
| 2-Person Household | 745 (81.6%) | 168 (18.4%) |
| 3-Person Household | 192 (72.5%) | 73 (27.6%) |
| 4+ Person Household | 384 (87.7%) | 54 (12.3%) |
| Total Housing Units | 1,529 (77.6%) | 440 (22.4%) |
Occupancy by Educational Attainment in Saltillo
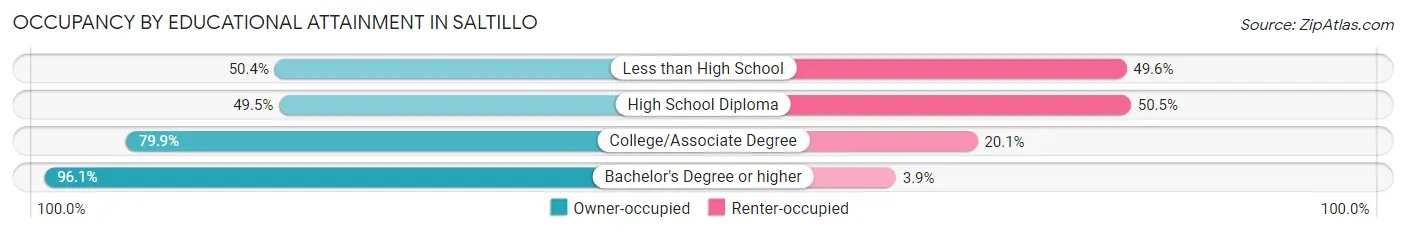
| Household Size | Owner-occupied | Renter-occupied |
| Less than High School | 62 (50.4%) | 61 (49.6%) |
| High School Diploma | 156 (49.5%) | 159 (50.5%) |
| College/Associate Degree | 792 (79.9%) | 199 (20.1%) |
| Bachelor's Degree or higher | 519 (96.1%) | 21 (3.9%) |
Occupancy by Age of Householder in Saltillo
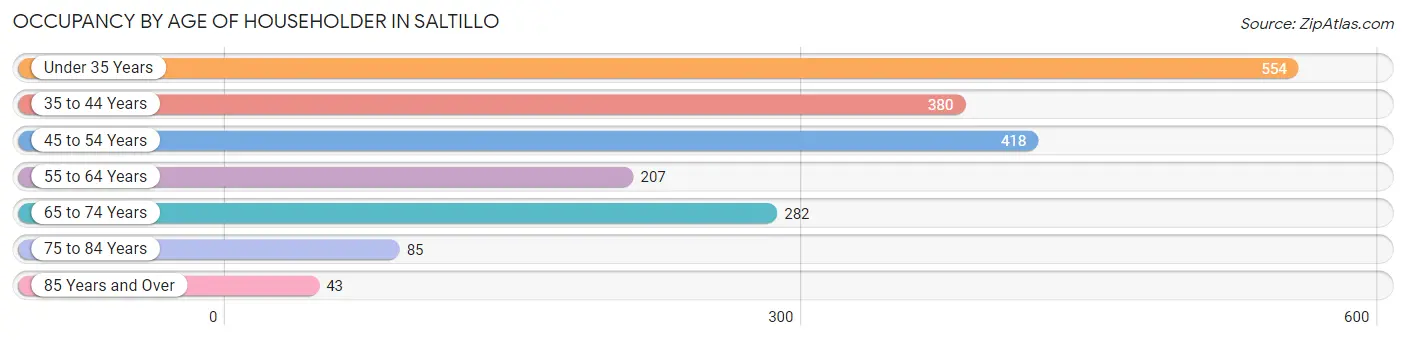
| Age Bracket | # Households | % Households |
| Under 35 Years | 554 | 28.1% |
| 35 to 44 Years | 380 | 19.3% |
| 45 to 54 Years | 418 | 21.2% |
| 55 to 64 Years | 207 | 10.5% |
| 65 to 74 Years | 282 | 14.3% |
| 75 to 84 Years | 85 | 4.3% |
| 85 Years and Over | 43 | 2.2% |
| Total | 1,969 | 100.0% |
Housing Finances in Saltillo
Median Income by Occupancy in Saltillo
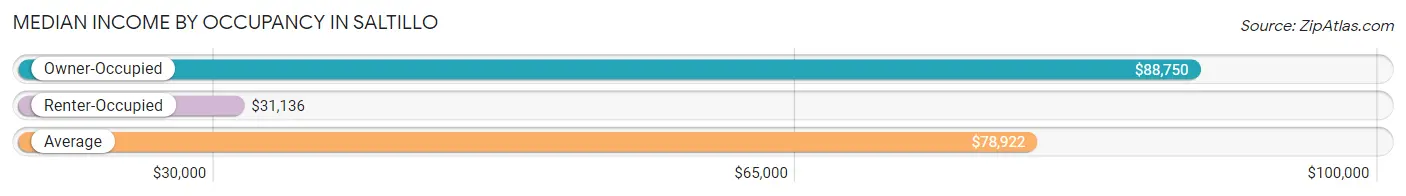
| Occupancy Type | # Households | Median Income |
| Owner-Occupied | 1,529 (77.6%) | $88,750 |
| Renter-Occupied | 440 (22.4%) | $31,136 |
| Average | 1,969 (100.0%) | $78,922 |
Occupancy by Householder Income Bracket in Saltillo
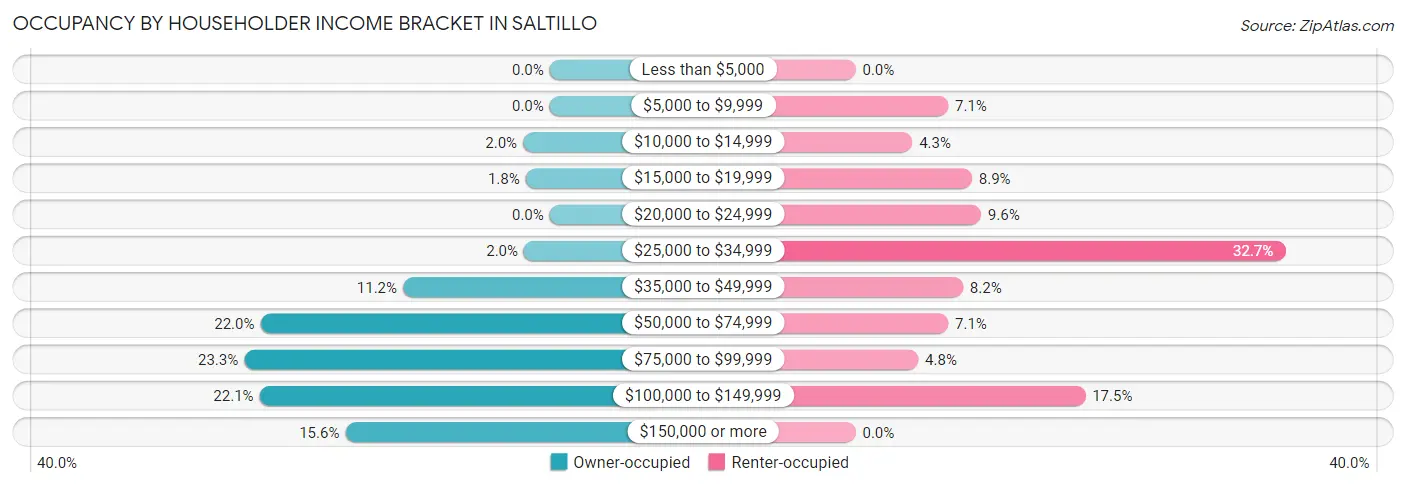
| Income Bracket | Owner-occupied | Renter-occupied |
| Less than $5,000 | 0 (0.0%) | 0 (0.0%) |
| $5,000 to $9,999 | 0 (0.0%) | 31 (7.0%) |
| $10,000 to $14,999 | 31 (2.0%) | 19 (4.3%) |
| $15,000 to $19,999 | 28 (1.8%) | 39 (8.9%) |
| $20,000 to $24,999 | 0 (0.0%) | 42 (9.6%) |
| $25,000 to $34,999 | 30 (2.0%) | 144 (32.7%) |
| $35,000 to $49,999 | 171 (11.2%) | 36 (8.2%) |
| $50,000 to $74,999 | 337 (22.0%) | 31 (7.0%) |
| $75,000 to $99,999 | 356 (23.3%) | 21 (4.8%) |
| $100,000 to $149,999 | 338 (22.1%) | 77 (17.5%) |
| $150,000 or more | 238 (15.6%) | 0 (0.0%) |
| Total | 1,529 (100.0%) | 440 (100.0%) |
Monthly Housing Cost Tiers in Saltillo
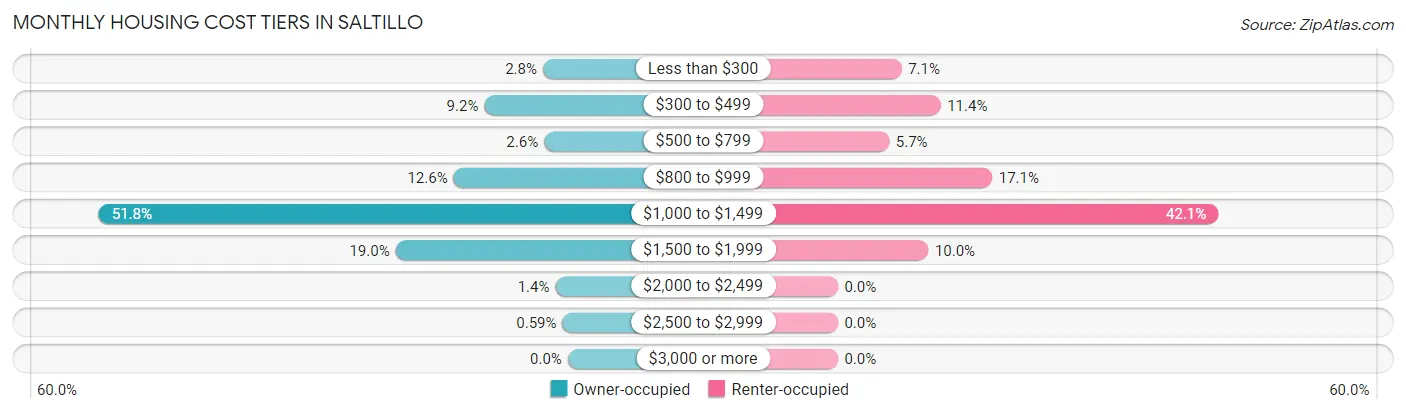
| Monthly Cost | Owner-occupied | Renter-occupied |
| Less than $300 | 42 (2.8%) | 31 (7.0%) |
| $300 to $499 | 141 (9.2%) | 50 (11.4%) |
| $500 to $799 | 40 (2.6%) | 25 (5.7%) |
| $800 to $999 | 193 (12.6%) | 75 (17.1%) |
| $1,000 to $1,499 | 792 (51.8%) | 185 (42.0%) |
| $1,500 to $1,999 | 291 (19.0%) | 44 (10.0%) |
| $2,000 to $2,499 | 21 (1.4%) | 0 (0.0%) |
| $2,500 to $2,999 | 9 (0.6%) | 0 (0.0%) |
| $3,000 or more | 0 (0.0%) | 0 (0.0%) |
| Total | 1,529 (100.0%) | 440 (100.0%) |
Physical Housing Characteristics in Saltillo
Housing Structures in Saltillo
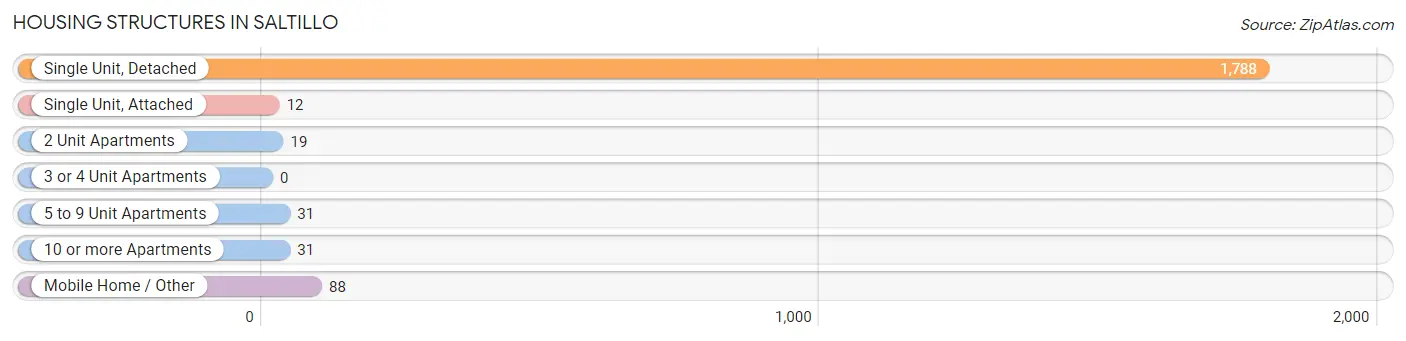
| Structure Type | # Housing Units | % Housing Units |
| Single Unit, Detached | 1,788 | 90.8% |
| Single Unit, Attached | 12 | 0.6% |
| 2 Unit Apartments | 19 | 1.0% |
| 3 or 4 Unit Apartments | 0 | 0.0% |
| 5 to 9 Unit Apartments | 31 | 1.6% |
| 10 or more Apartments | 31 | 1.6% |
| Mobile Home / Other | 88 | 4.5% |
| Total | 1,969 | 100.0% |
Housing Structures by Occupancy in Saltillo
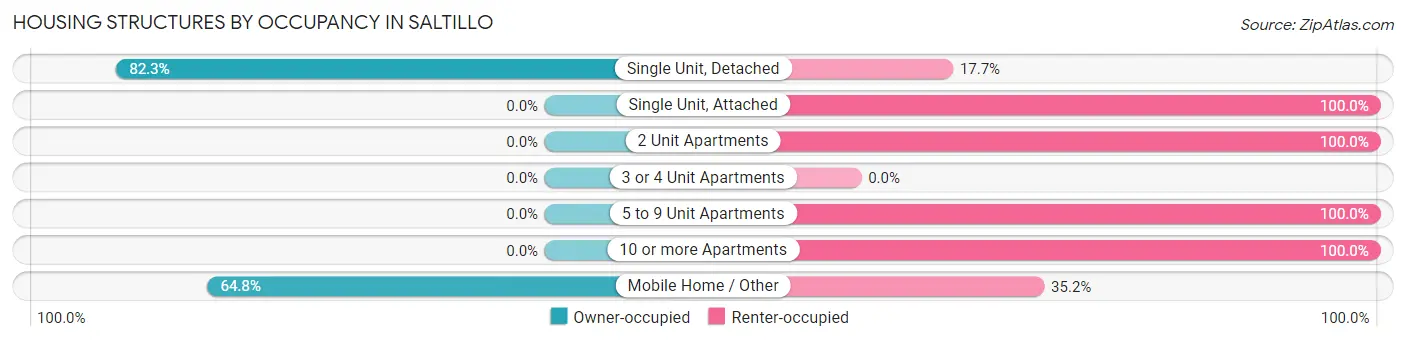
| Structure Type | Owner-occupied | Renter-occupied |
| Single Unit, Detached | 1,472 (82.3%) | 316 (17.7%) |
| Single Unit, Attached | 0 (0.0%) | 12 (100.0%) |
| 2 Unit Apartments | 0 (0.0%) | 19 (100.0%) |
| 3 or 4 Unit Apartments | 0 (0.0%) | 0 (0.0%) |
| 5 to 9 Unit Apartments | 0 (0.0%) | 31 (100.0%) |
| 10 or more Apartments | 0 (0.0%) | 31 (100.0%) |
| Mobile Home / Other | 57 (64.8%) | 31 (35.2%) |
| Total | 1,529 (77.6%) | 440 (22.4%) |
Housing Structures by Number of Rooms in Saltillo
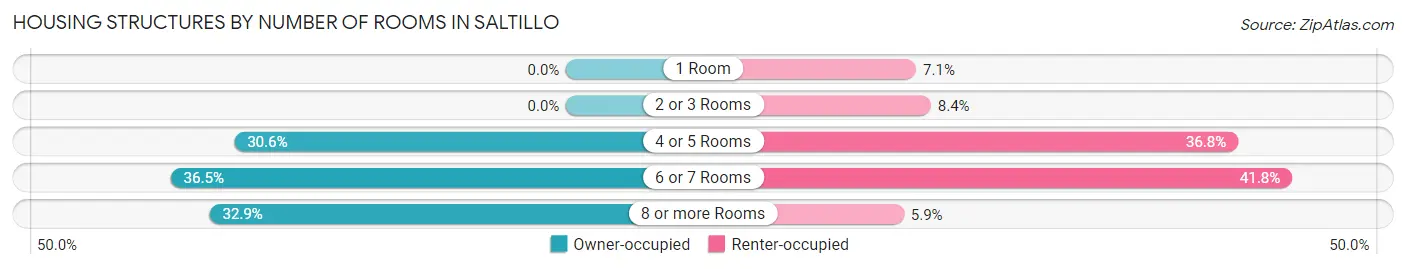
| Number of Rooms | Owner-occupied | Renter-occupied |
| 1 Room | 0 (0.0%) | 31 (7.0%) |
| 2 or 3 Rooms | 0 (0.0%) | 37 (8.4%) |
| 4 or 5 Rooms | 468 (30.6%) | 162 (36.8%) |
| 6 or 7 Rooms | 558 (36.5%) | 184 (41.8%) |
| 8 or more Rooms | 503 (32.9%) | 26 (5.9%) |
| Total | 1,529 (100.0%) | 440 (100.0%) |
Housing Structure by Heating Type in Saltillo
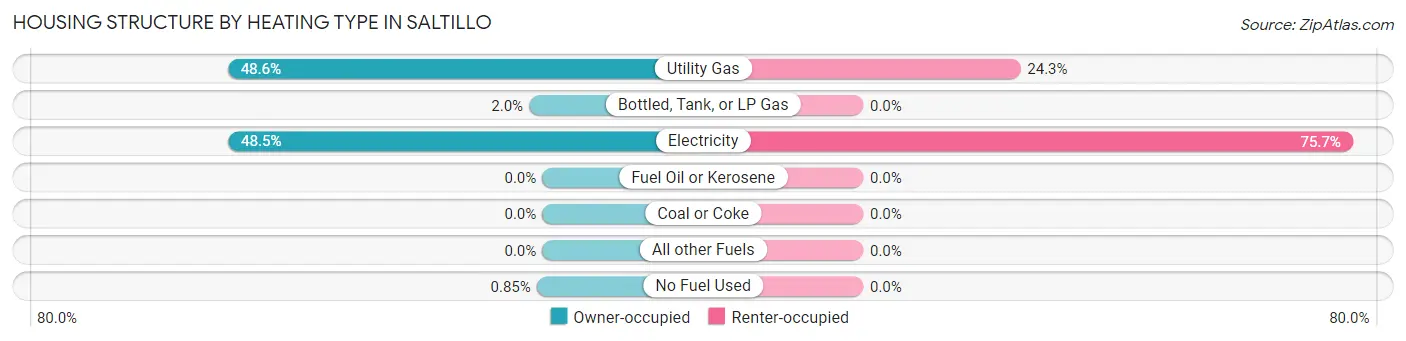
| Heating Type | Owner-occupied | Renter-occupied |
| Utility Gas | 743 (48.6%) | 107 (24.3%) |
| Bottled, Tank, or LP Gas | 31 (2.0%) | 0 (0.0%) |
| Electricity | 742 (48.5%) | 333 (75.7%) |
| Fuel Oil or Kerosene | 0 (0.0%) | 0 (0.0%) |
| Coal or Coke | 0 (0.0%) | 0 (0.0%) |
| All other Fuels | 0 (0.0%) | 0 (0.0%) |
| No Fuel Used | 13 (0.9%) | 0 (0.0%) |
| Total | 1,529 (100.0%) | 440 (100.0%) |
Household Vehicle Usage in Saltillo
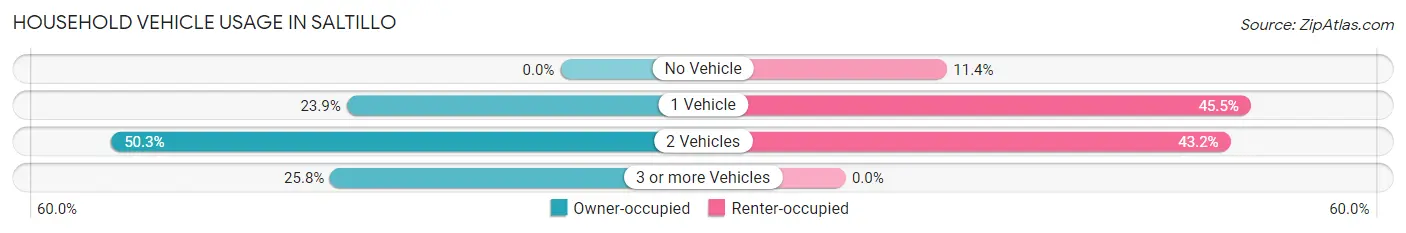
| Vehicles per Household | Owner-occupied | Renter-occupied |
| No Vehicle | 0 (0.0%) | 50 (11.4%) |
| 1 Vehicle | 366 (23.9%) | 200 (45.5%) |
| 2 Vehicles | 769 (50.3%) | 190 (43.2%) |
| 3 or more Vehicles | 394 (25.8%) | 0 (0.0%) |
| Total | 1,529 (100.0%) | 440 (100.0%) |
Real Estate & Mortgages in Saltillo
Real Estate and Mortgage Overview in Saltillo
| Characteristic | Without Mortgage | With Mortgage |
| Housing Units | 215 | 1,314 |
| Median Property Value | $129,400 | $185,300 |
| Median Household Income | $65,542 | $197 |
| Monthly Housing Costs | $391 | $0 |
| Real Estate Taxes | - | - |
Property Value by Mortgage Status in Saltillo
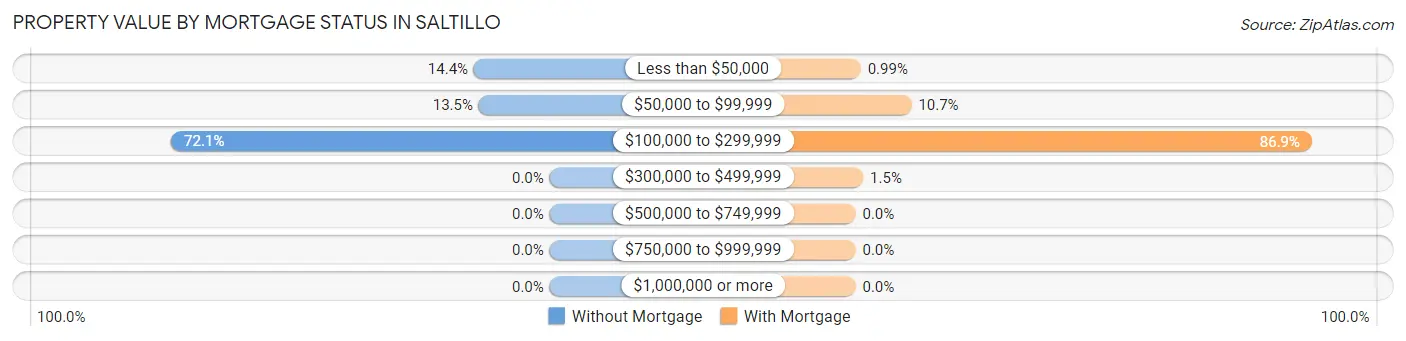
| Property Value | Without Mortgage | With Mortgage |
| Less than $50,000 | 31 (14.4%) | 13 (1.0%) |
| $50,000 to $99,999 | 29 (13.5%) | 140 (10.6%) |
| $100,000 to $299,999 | 155 (72.1%) | 1,142 (86.9%) |
| $300,000 to $499,999 | 0 (0.0%) | 19 (1.5%) |
| $500,000 to $749,999 | 0 (0.0%) | 0 (0.0%) |
| $750,000 to $999,999 | 0 (0.0%) | 0 (0.0%) |
| $1,000,000 or more | 0 (0.0%) | 0 (0.0%) |
| Total | 215 (100.0%) | 1,314 (100.0%) |
Household Income by Mortgage Status in Saltillo
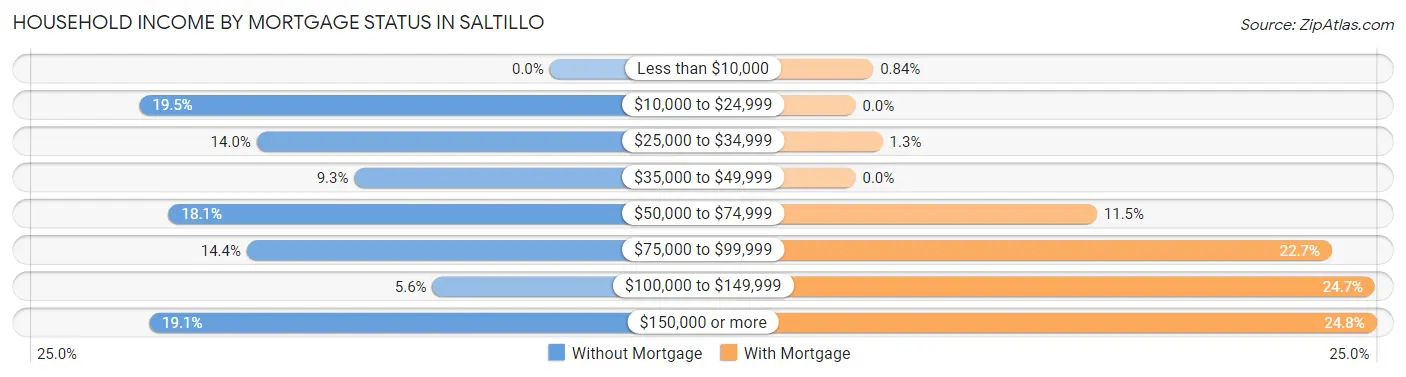
| Household Income | Without Mortgage | With Mortgage |
| Less than $10,000 | 0 (0.0%) | 11 (0.8%) |
| $10,000 to $24,999 | 42 (19.5%) | 0 (0.0%) |
| $25,000 to $34,999 | 30 (14.0%) | 17 (1.3%) |
| $35,000 to $49,999 | 20 (9.3%) | 0 (0.0%) |
| $50,000 to $74,999 | 39 (18.1%) | 151 (11.5%) |
| $75,000 to $99,999 | 31 (14.4%) | 298 (22.7%) |
| $100,000 to $149,999 | 12 (5.6%) | 325 (24.7%) |
| $150,000 or more | 41 (19.1%) | 326 (24.8%) |
| Total | 215 (100.0%) | 1,314 (100.0%) |
Property Value to Household Income Ratio in Saltillo
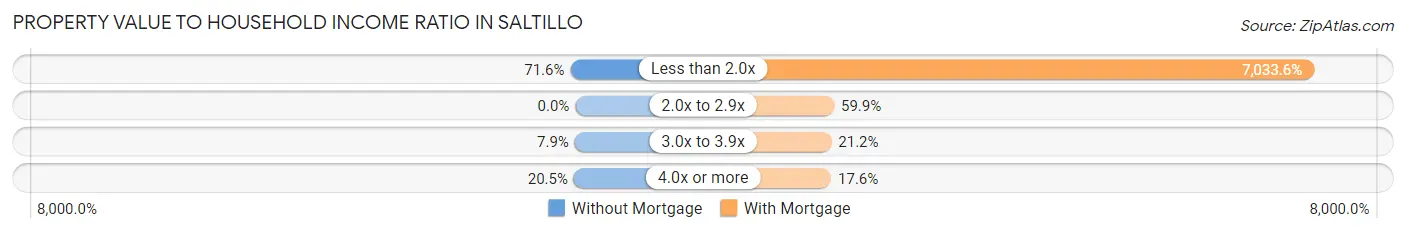
| Value-to-Income Ratio | Without Mortgage | With Mortgage |
| Less than 2.0x | 154 (71.6%) | 92,422 (7,033.6%) |
| 2.0x to 2.9x | 0 (0.0%) | 787 (59.9%) |
| 3.0x to 3.9x | 17 (7.9%) | 279 (21.2%) |
| 4.0x or more | 44 (20.5%) | 231 (17.6%) |
| Total | 215 (100.0%) | 1,314 (100.0%) |
Real Estate Taxes by Mortgage Status in Saltillo
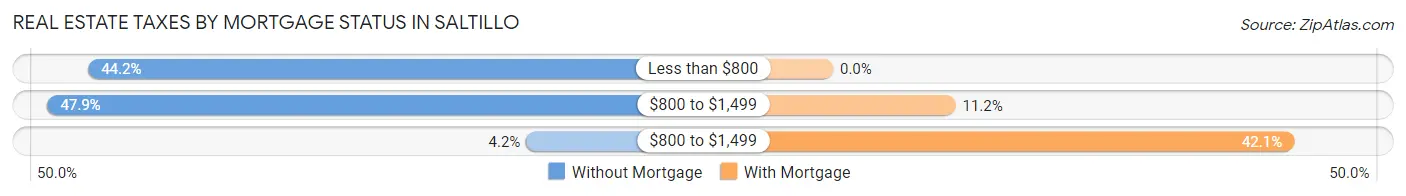
| Property Taxes | Without Mortgage | With Mortgage |
| Less than $800 | 95 (44.2%) | 0 (0.0%) |
| $800 to $1,499 | 103 (47.9%) | 147 (11.2%) |
| $800 to $1,499 | 9 (4.2%) | 553 (42.1%) |
| Total | 215 (100.0%) | 1,314 (100.0%) |
Health & Disability in Saltillo
Health Insurance Coverage by Age in Saltillo
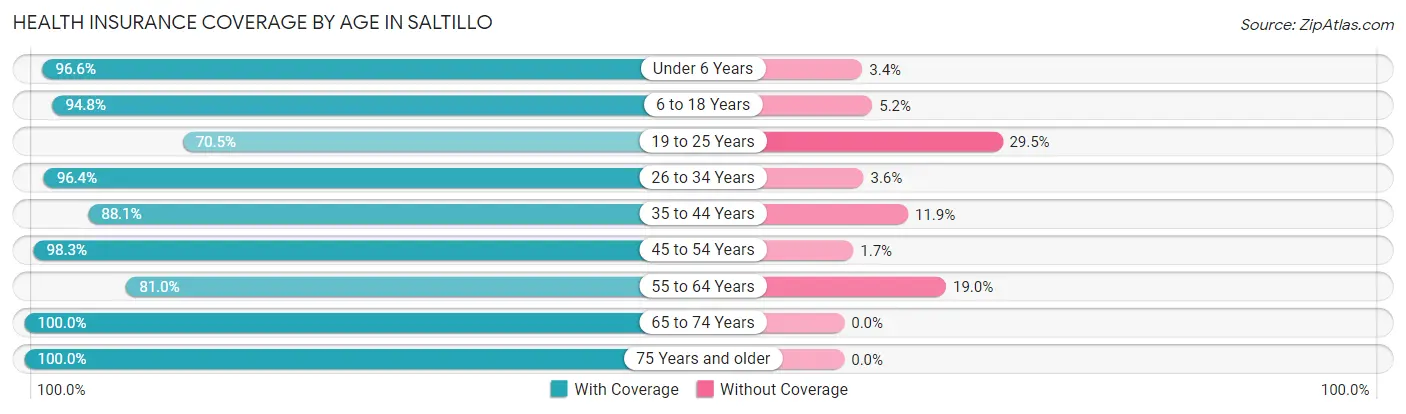
| Age Bracket | With Coverage | Without Coverage |
| Under 6 Years | 374 (96.6%) | 13 (3.4%) |
| 6 to 18 Years | 653 (94.8%) | 36 (5.2%) |
| 19 to 25 Years | 526 (70.5%) | 220 (29.5%) |
| 26 to 34 Years | 645 (96.4%) | 24 (3.6%) |
| 35 to 44 Years | 593 (88.1%) | 80 (11.9%) |
| 45 to 54 Years | 756 (98.3%) | 13 (1.7%) |
| 55 to 64 Years | 235 (81.0%) | 55 (19.0%) |
| 65 to 74 Years | 493 (100.0%) | 0 (0.0%) |
| 75 Years and older | 176 (100.0%) | 0 (0.0%) |
| Total | 4,451 (91.0%) | 441 (9.0%) |
Health Insurance Coverage by Citizenship Status in Saltillo
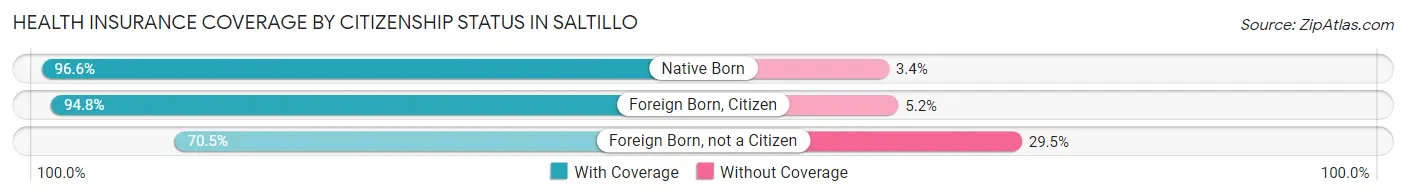
| Citizenship Status | With Coverage | Without Coverage |
| Native Born | 374 (96.6%) | 13 (3.4%) |
| Foreign Born, Citizen | 653 (94.8%) | 36 (5.2%) |
| Foreign Born, not a Citizen | 526 (70.5%) | 220 (29.5%) |
Health Insurance Coverage by Household Income in Saltillo
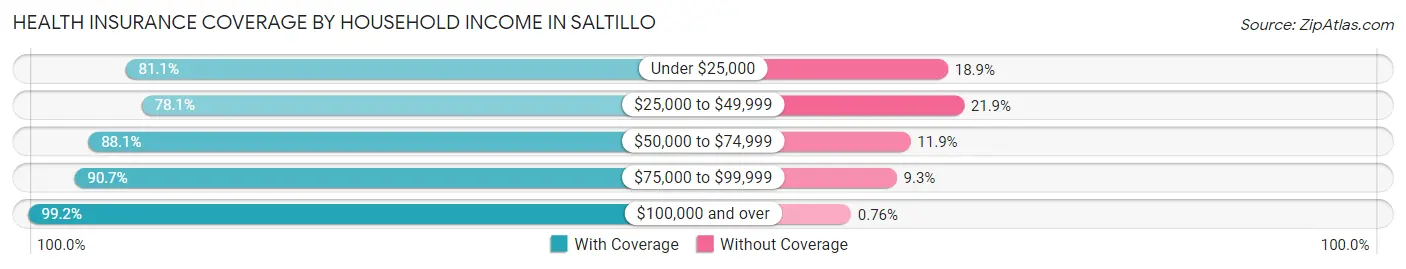
| Household Income | With Coverage | Without Coverage |
| Under $25,000 | 210 (81.1%) | 49 (18.9%) |
| $25,000 to $49,999 | 680 (78.1%) | 191 (21.9%) |
| $50,000 to $74,999 | 665 (88.1%) | 90 (11.9%) |
| $75,000 to $99,999 | 933 (90.7%) | 96 (9.3%) |
| $100,000 and over | 1,963 (99.2%) | 15 (0.8%) |
Public vs Private Health Insurance Coverage by Age in Saltillo
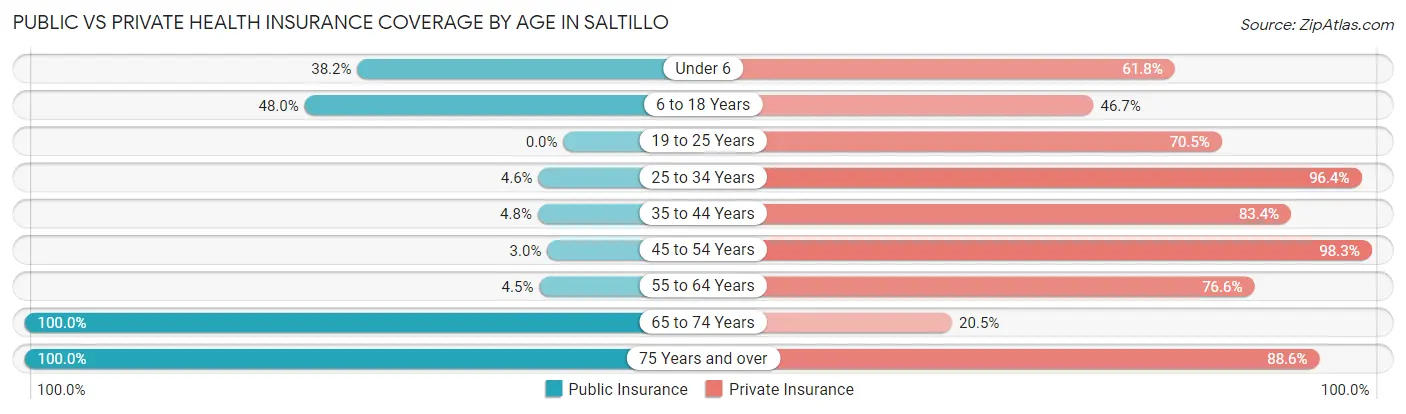
| Age Bracket | Public Insurance | Private Insurance |
| Under 6 | 148 (38.2%) | 239 (61.8%) |
| 6 to 18 Years | 331 (48.0%) | 322 (46.7%) |
| 19 to 25 Years | 0 (0.0%) | 526 (70.5%) |
| 25 to 34 Years | 31 (4.6%) | 645 (96.4%) |
| 35 to 44 Years | 32 (4.8%) | 561 (83.4%) |
| 45 to 54 Years | 23 (3.0%) | 756 (98.3%) |
| 55 to 64 Years | 13 (4.5%) | 222 (76.5%) |
| 65 to 74 Years | 493 (100.0%) | 101 (20.5%) |
| 75 Years and over | 176 (100.0%) | 156 (88.6%) |
| Total | 1,247 (25.5%) | 3,528 (72.1%) |
Disability Status by Sex by Age in Saltillo
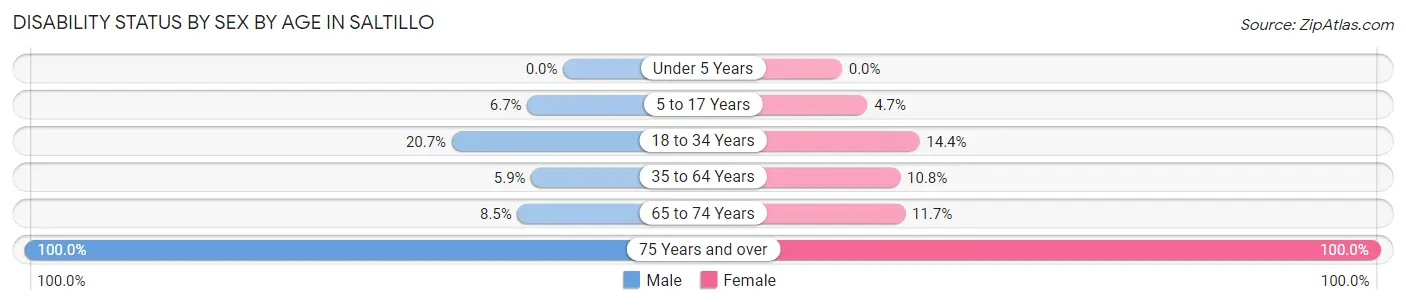
| Age Bracket | Male | Female |
| Under 5 Years | 0 (0.0%) | 0 (0.0%) |
| 5 to 17 Years | 33 (6.7%) | 14 (4.7%) |
| 18 to 34 Years | 139 (20.7%) | 107 (14.4%) |
| 35 to 64 Years | 55 (5.9%) | 87 (10.8%) |
| 65 to 74 Years | 18 (8.5%) | 33 (11.7%) |
| 75 Years and over | 58 (100.0%) | 118 (100.0%) |
Disability Class by Sex by Age in Saltillo
Disability Class: Hearing Difficulty
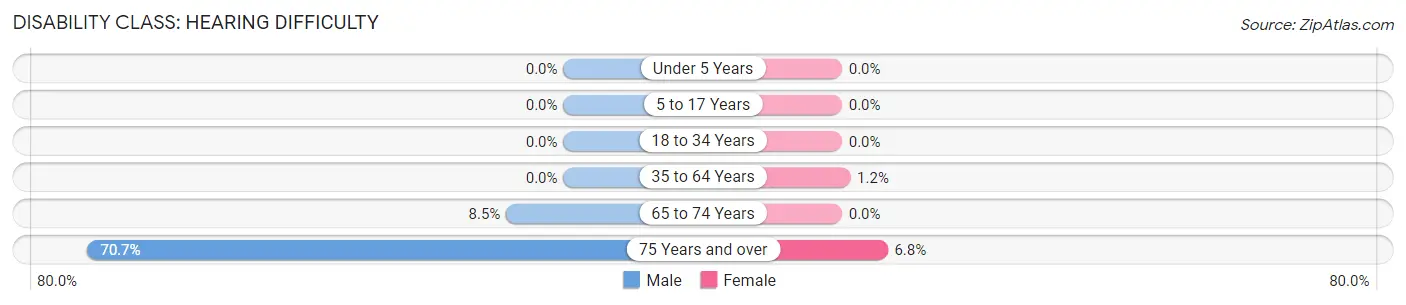
| Age Bracket | Male | Female |
| Under 5 Years | 0 (0.0%) | 0 (0.0%) |
| 5 to 17 Years | 0 (0.0%) | 0 (0.0%) |
| 18 to 34 Years | 0 (0.0%) | 0 (0.0%) |
| 35 to 64 Years | 0 (0.0%) | 10 (1.2%) |
| 65 to 74 Years | 18 (8.5%) | 0 (0.0%) |
| 75 Years and over | 41 (70.7%) | 8 (6.8%) |
Disability Class: Vision Difficulty
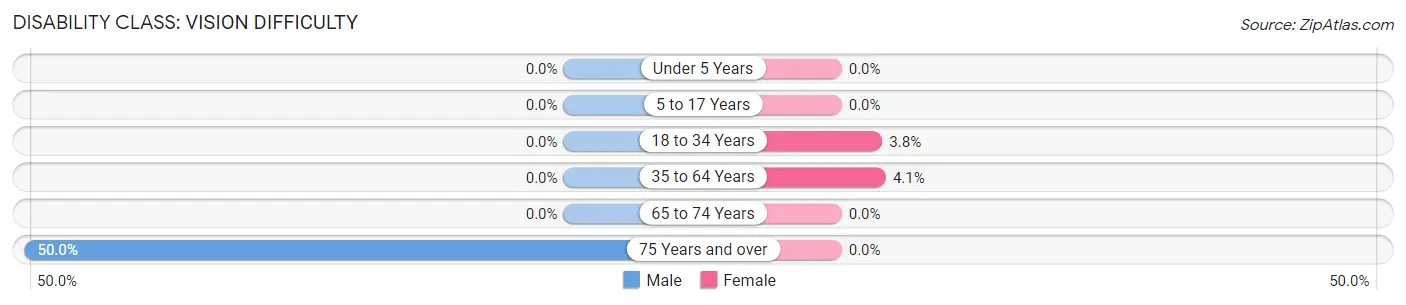
| Age Bracket | Male | Female |
| Under 5 Years | 0 (0.0%) | 0 (0.0%) |
| 5 to 17 Years | 0 (0.0%) | 0 (0.0%) |
| 18 to 34 Years | 0 (0.0%) | 28 (3.8%) |
| 35 to 64 Years | 0 (0.0%) | 33 (4.1%) |
| 65 to 74 Years | 0 (0.0%) | 0 (0.0%) |
| 75 Years and over | 29 (50.0%) | 0 (0.0%) |
Disability Class: Cognitive Difficulty
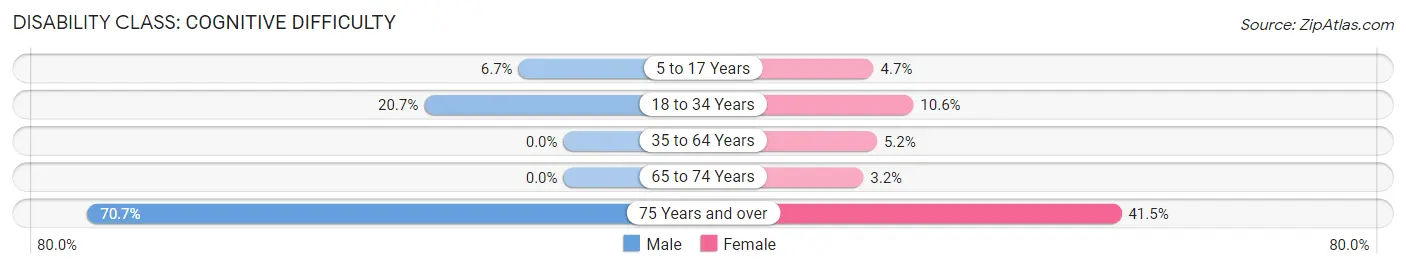
| Age Bracket | Male | Female |
| 5 to 17 Years | 33 (6.7%) | 14 (4.7%) |
| 18 to 34 Years | 139 (20.7%) | 79 (10.6%) |
| 35 to 64 Years | 0 (0.0%) | 42 (5.2%) |
| 65 to 74 Years | 0 (0.0%) | 9 (3.2%) |
| 75 Years and over | 41 (70.7%) | 49 (41.5%) |
Disability Class: Ambulatory Difficulty
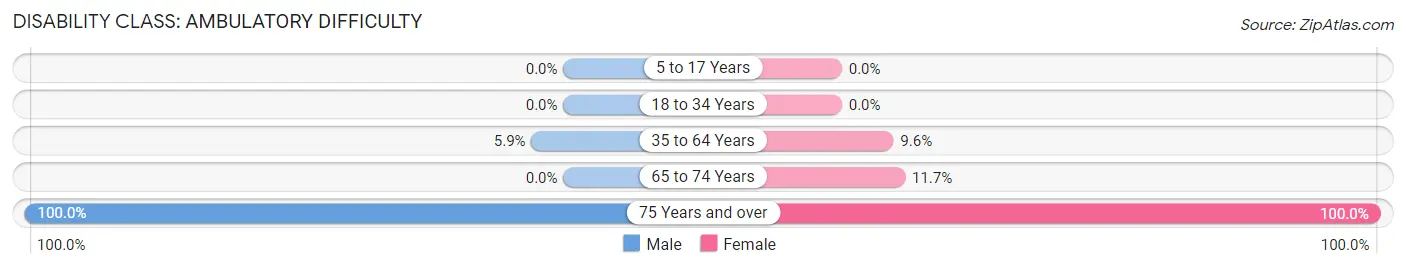
| Age Bracket | Male | Female |
| 5 to 17 Years | 0 (0.0%) | 0 (0.0%) |
| 18 to 34 Years | 0 (0.0%) | 0 (0.0%) |
| 35 to 64 Years | 55 (5.9%) | 77 (9.6%) |
| 65 to 74 Years | 0 (0.0%) | 33 (11.7%) |
| 75 Years and over | 58 (100.0%) | 118 (100.0%) |
Disability Class: Self-Care Difficulty
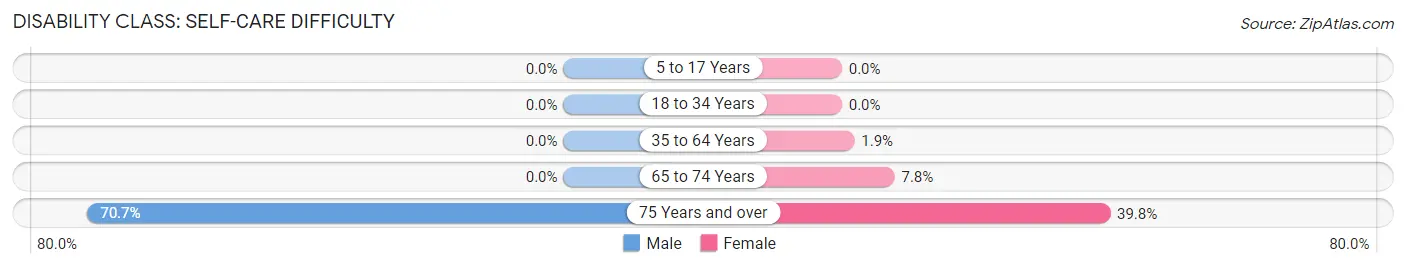
| Age Bracket | Male | Female |
| 5 to 17 Years | 0 (0.0%) | 0 (0.0%) |
| 18 to 34 Years | 0 (0.0%) | 0 (0.0%) |
| 35 to 64 Years | 0 (0.0%) | 15 (1.9%) |
| 65 to 74 Years | 0 (0.0%) | 22 (7.8%) |
| 75 Years and over | 41 (70.7%) | 47 (39.8%) |
Technology Access in Saltillo
Computing Device Access in Saltillo
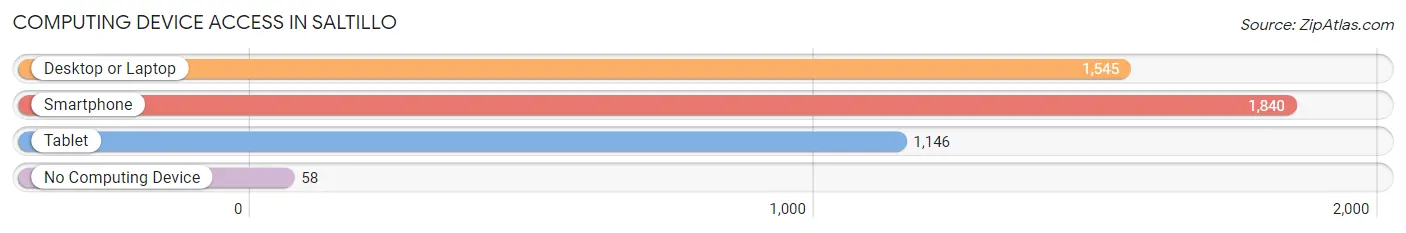
| Device Type | # Households | % Households |
| Desktop or Laptop | 1,545 | 78.5% |
| Smartphone | 1,840 | 93.4% |
| Tablet | 1,146 | 58.2% |
| No Computing Device | 58 | 2.9% |
| Total | 1,969 | 100.0% |
Internet Access in Saltillo
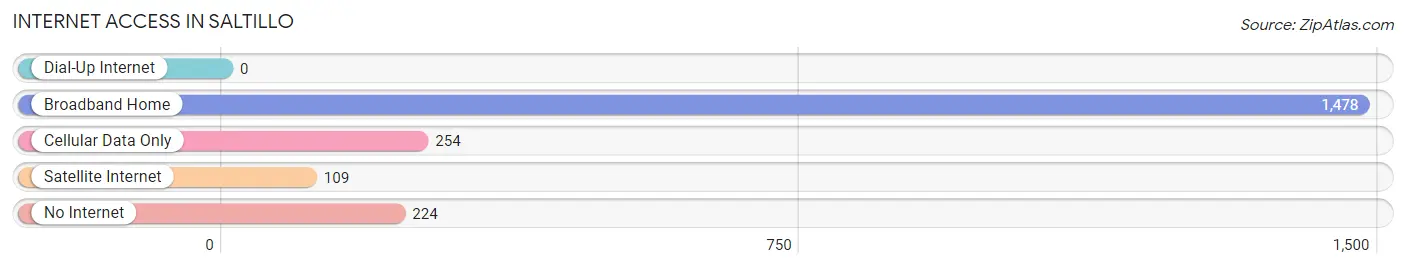
| Internet Type | # Households | % Households |
| Dial-Up Internet | 0 | 0.0% |
| Broadband Home | 1,478 | 75.1% |
| Cellular Data Only | 254 | 12.9% |
| Satellite Internet | 109 | 5.5% |
| No Internet | 224 | 11.4% |
| Total | 1,969 | 100.0% |
Saltillo Summary
SITUATED IN NORTHEAST MISSISSIPPI, THE CITY OF SALTILLO IS A SMALL TOWN WITH A RICH HISTORY, A VIBRANT ECONOMY, AND A DIVERSE DEMOGRAPHIC MAKEUP.
History
Saltillo, Mississippi was founded in 1837 and is located in Lee County. The town was named after the Mexican city of Saltillo, which was the birthplace of the town’s first settler, William H. Moore. Moore was a veteran of the War of 1812 and a prominent landowner in the area. He was also a member of the Mississippi Legislature and served as a judge in the county court.
The town was originally known as Moore’s Crossroads, but the name was changed to Saltillo in 1845. The town was incorporated in 1848 and was the first town in Lee County to be incorporated.
Saltillo was an important stop on the Mobile and Ohio Railroad, which was completed in 1858. The railroad brought economic growth to the town and helped to make it a center of commerce in the region.
The town was also an important stop on the Underground Railroad, which was used by slaves escaping to freedom in the North. The town was home to several prominent abolitionists, including William H. Moore and his son, William H. Moore Jr.
The town was also the site of a major Civil War battle in 1863. The Battle of Saltillo was fought between Union and Confederate forces and resulted in a Confederate victory.
Geography
Saltillo is located in northeast Mississippi, approximately 20 miles south of Tupelo and 40 miles east of Oxford. The town is situated in the foothills of the Appalachian Mountains and is surrounded by rolling hills and forests.
The town is located at the intersection of two major highways, U.S. Route 45 and Mississippi Highway 6. The town is also served by the Tupelo Regional Airport, which is located approximately 20 miles away.
The town has a total area of 4.2 square miles, all of which is land. The town is located at an elevation of 545 feet above sea level.
Economy
Saltillo’s economy is largely based on agriculture and manufacturing. The town is home to several large manufacturing plants, including a furniture factory, a plastics factory, and a paper mill.
The town is also home to several small businesses, including restaurants, retail stores, and service providers. The town is also home to several large employers, including the Lee County School District, the Lee County Sheriff’s Office, and the Tupelo Regional Airport.
Demographics
As of the 2010 census, the population of Saltillo was 2,741. The town has a population density of 645 people per square mile.
The racial makeup of the town is 79.3% White, 18.2% African American, 0.3% Native American, 0.3% Asian, 0.1% Pacific Islander, 0.7% from other races, and 1.2% from two or more races. Hispanic or Latino of any race were 1.7% of the population.
The median income for a household in the town was $35,938, and the median income for a family was $41,250. The per capita income for the town was $17,845. About 17.2% of families and 20.2% of the population were below the poverty line, including 28.3% of those under age 18 and 15.2% of those age 65 or over.
Common Questions
What is Per Capita Income in Saltillo?
Per Capita income in Saltillo is $34,947.
What is the Median Family Income in Saltillo?
Median Family Income in Saltillo is $91,250.
What is the Median Household income in Saltillo?
Median Household Income in Saltillo is $78,922.
What is Income or Wage Gap in Saltillo?
Income or Wage Gap in Saltillo is 46.1%.
Women in Saltillo earn 53.9 cents for every dollar earned by a man.
What is Family Income Deficit in Saltillo?
Family Income Deficit in Saltillo is $6,261.
Families that are below poverty line in Saltillo earn $6,261 less on average than the poverty threshold level.
What is Inequality or Gini Index in Saltillo?
Inequality or Gini Index in Saltillo is 0.33.
What is the Total Population of Saltillo?
Total Population of Saltillo is 4,910.
What is the Total Male Population of Saltillo?
Total Male Population of Saltillo is 2,526.
What is the Total Female Population of Saltillo?
Total Female Population of Saltillo is 2,384.
What is the Ratio of Males per 100 Females in Saltillo?
There are 105.96 Males per 100 Females in Saltillo.
What is the Ratio of Females per 100 Males in Saltillo?
There are 94.38 Females per 100 Males in Saltillo.
What is the Median Population Age in Saltillo?
Median Population Age in Saltillo is 34.1 Years.
What is the Average Family Size in Saltillo
Average Family Size in Saltillo is 2.8 People.
What is the Average Household Size in Saltillo
Average Household Size in Saltillo is 2.5 People.
How Large is the Labor Force in Saltillo?
There are 2,756 People in the Labor Forcein in Saltillo.
What is the Percentage of People in the Labor Force in Saltillo?
70.8% of People are in the Labor Force in Saltillo.
What is the Unemployment Rate in Saltillo?
Unemployment Rate in Saltillo is 3.8%.