Crystal Springs, MS Map & Demographics
Crystal Springs Map
Crystal Springs Overview
$24,207
PER CAPITA INCOME
$54,144
AVG FAMILY INCOME
$44,653
AVG HOUSEHOLD INCOME
13.6%
WAGE / INCOME GAP [ % ]
86.4¢/ $1
WAGE / INCOME GAP [ $ ]
0.50
INEQUALITY / GINI INDEX
4,820
TOTAL POPULATION
2,422
MALE POPULATION
2,398
FEMALE POPULATION
101.00
MALES / 100 FEMALES
99.01
FEMALES / 100 MALES
45.3
MEDIAN AGE
3.7
AVG FAMILY SIZE
2.7
AVG HOUSEHOLD SIZE
1,874
LABOR FORCE [ PEOPLE ]
49.4%
PERCENT IN LABOR FORCE
4.9%
UNEMPLOYMENT RATE
Crystal Springs Zip Codes
Crystal Springs Area Codes
Income in Crystal Springs
Income Overview in Crystal Springs
Per Capita Income in Crystal Springs is $24,207, while median incomes of families and households are $54,144 and $44,653 respectively.
| Characteristic | Number | Measure |
| Per Capita Income | 4,820 | $24,207 |
| Median Family Income | 1,057 | $54,144 |
| Mean Family Income | 1,057 | $74,262 |
| Median Household Income | 1,737 | $44,653 |
| Mean Household Income | 1,737 | $61,778 |
| Income Deficit | 1,057 | $0 |
| Wage / Income Gap (%) | 4,820 | 13.65% |
| Wage / Income Gap ($) | 4,820 | 86.35¢ per $1 |
| Gini / Inequality Index | 4,820 | 0.50 |
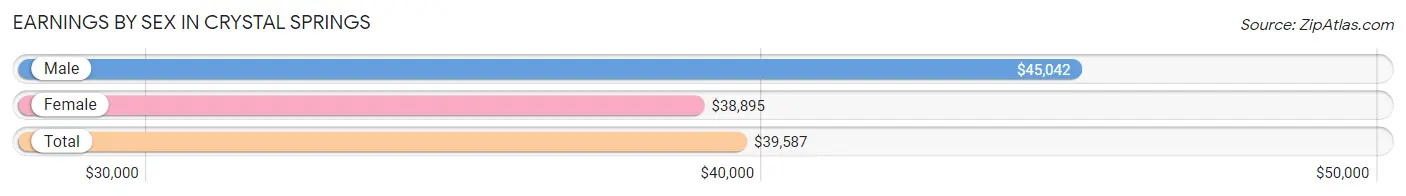
Earnings by Sex in Crystal Springs
Average Earnings in Crystal Springs are $39,587, $45,042 for men and $38,895 for women, a difference of 13.7%.
| Sex | Number | Average Earnings |
| Male | 1,041 (54.4%) | $45,042 |
| Female | 873 (45.6%) | $38,895 |
| Total | 1,914 (100.0%) | $39,587 |
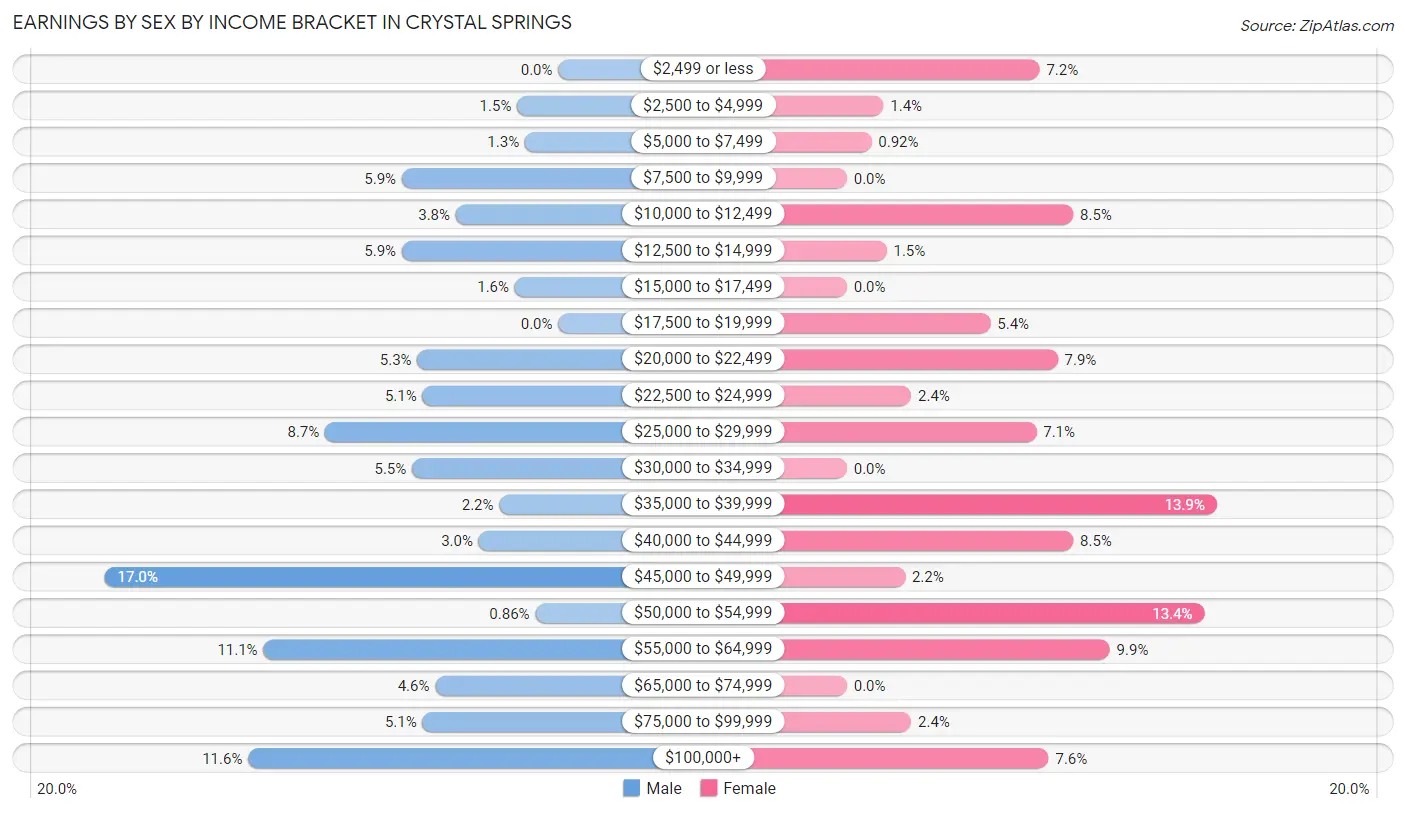
Earnings by Sex by Income Bracket in Crystal Springs
The most common earnings brackets in Crystal Springs are $45,000 to $49,999 for men (177 | 17.0%) and $35,000 to $39,999 for women (121 | 13.9%).
| Income | Male | Female |
| $2,499 or less | 0 (0.0%) | 63 (7.2%) |
| $2,500 to $4,999 | 16 (1.5%) | 12 (1.4%) |
| $5,000 to $7,499 | 13 (1.3%) | 8 (0.9%) |
| $7,500 to $9,999 | 61 (5.9%) | 0 (0.0%) |
| $10,000 to $12,499 | 40 (3.8%) | 74 (8.5%) |
| $12,500 to $14,999 | 61 (5.9%) | 13 (1.5%) |
| $15,000 to $17,499 | 17 (1.6%) | 0 (0.0%) |
| $17,500 to $19,999 | 0 (0.0%) | 47 (5.4%) |
| $20,000 to $22,499 | 55 (5.3%) | 69 (7.9%) |
| $22,500 to $24,999 | 53 (5.1%) | 21 (2.4%) |
| $25,000 to $29,999 | 91 (8.7%) | 62 (7.1%) |
| $30,000 to $34,999 | 57 (5.5%) | 0 (0.0%) |
| $35,000 to $39,999 | 23 (2.2%) | 121 (13.9%) |
| $40,000 to $44,999 | 31 (3.0%) | 74 (8.5%) |
| $45,000 to $49,999 | 177 (17.0%) | 19 (2.2%) |
| $50,000 to $54,999 | 9 (0.9%) | 117 (13.4%) |
| $55,000 to $64,999 | 115 (11.1%) | 86 (9.9%) |
| $65,000 to $74,999 | 48 (4.6%) | 0 (0.0%) |
| $75,000 to $99,999 | 53 (5.1%) | 21 (2.4%) |
| $100,000+ | 121 (11.6%) | 66 (7.6%) |
| Total | 1,041 (100.0%) | 873 (100.0%) |
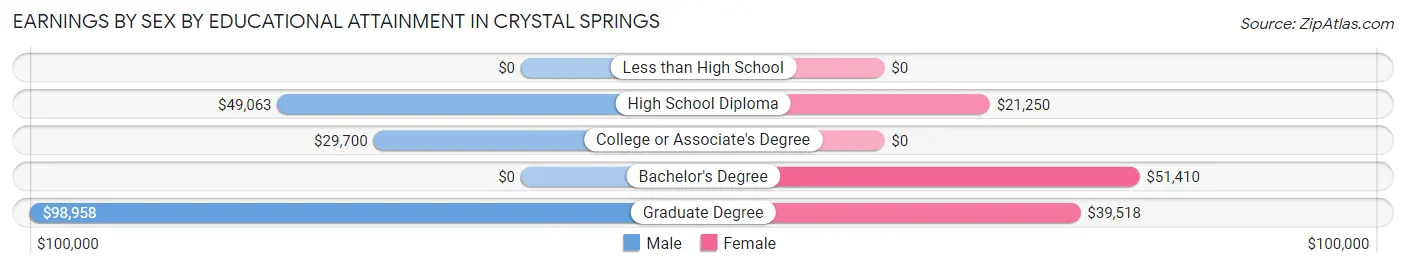
Earnings by Sex by Educational Attainment in Crystal Springs
Average earnings in Crystal Springs are $45,667 for men and $40,068 for women, a difference of 12.3%. Men with an educational attainment of graduate degree enjoy the highest average annual earnings of $98,958, while those with college or associate's degree education earn the least with $29,700. Women with an educational attainment of bachelor's degree earn the most with the average annual earnings of $51,410, while those with high school diploma education have the smallest earnings of $21,250.
| Educational Attainment | Male Income | Female Income |
| Less than High School | - | - |
| High School Diploma | $49,063 | $21,250 |
| College or Associate's Degree | $29,700 | $0 |
| Bachelor's Degree | - | - |
| Graduate Degree | $98,958 | $39,518 |
| Total | $45,667 | $40,068 |
Family Income in Crystal Springs
Family Income Brackets in Crystal Springs
According to the Crystal Springs family income data, there are 307 families falling into the $100,000 to $149,999 income range, which is the most common income bracket and makes up 29.0% of all families.
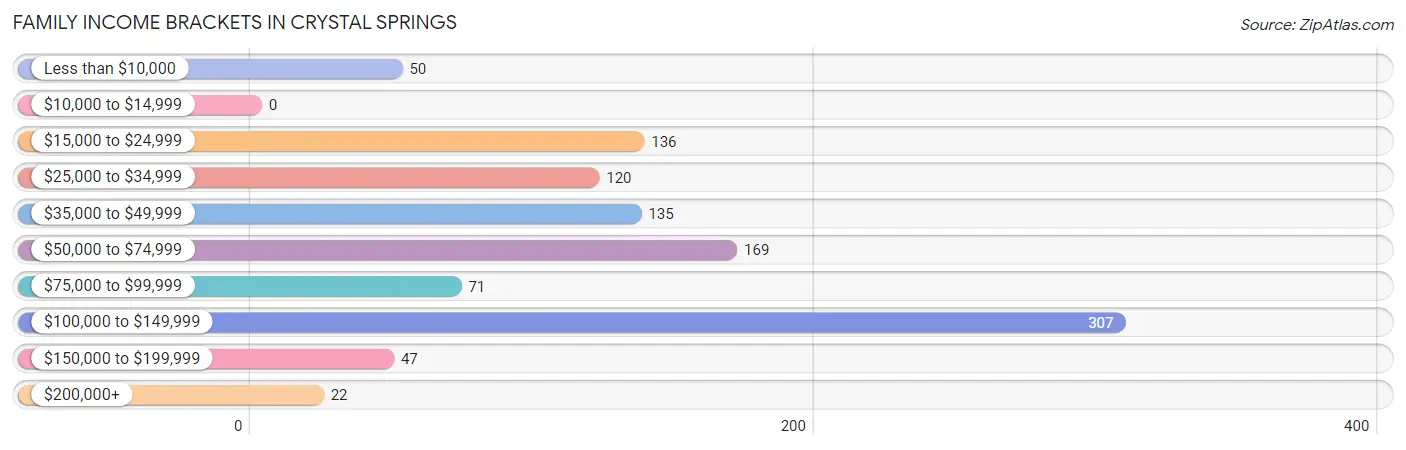
| Income Bracket | # Families | % Families |
| Less than $10,000 | 50 | 4.7% |
| $10,000 to $14,999 | 0 | 0.0% |
| $15,000 to $24,999 | 136 | 12.9% |
| $25,000 to $34,999 | 120 | 11.4% |
| $35,000 to $49,999 | 135 | 12.8% |
| $50,000 to $74,999 | 169 | 16.0% |
| $75,000 to $99,999 | 71 | 6.7% |
| $100,000 to $149,999 | 307 | 29.0% |
| $150,000 to $199,999 | 47 | 4.4% |
| $200,000+ | 22 | 2.1% |
Family Income by Famaliy Size in Crystal Springs
4-person families (247 | 23.4%) account for the highest median family income in Crystal Springs with $107,852 per family, while 4-person families (247 | 23.4%) have the highest median income of $26,963 per family member.
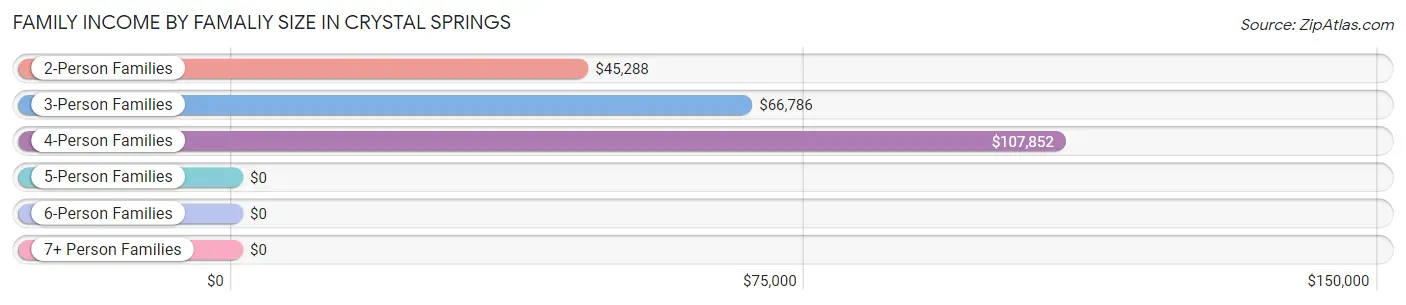
| Income Bracket | # Families | Median Income |
| 2-Person Families | 378 (35.8%) | $45,288 |
| 3-Person Families | 352 (33.3%) | $66,786 |
| 4-Person Families | 247 (23.4%) | $107,852 |
| 5-Person Families | 80 (7.6%) | $0 |
| 6-Person Families | 0 (0.0%) | $0 |
| 7+ Person Families | 0 (0.0%) | $0 |
| Total | 1,057 (100.0%) | $54,144 |
Family Income by Number of Earners in Crystal Springs
The median family income in Crystal Springs is $54,144, with families comprising 2 earners (315) having the highest median family income of $109,805, while families with no earners (198) have the lowest median family income of $26,000, accounting for 29.8% and 18.7% of families, respectively.
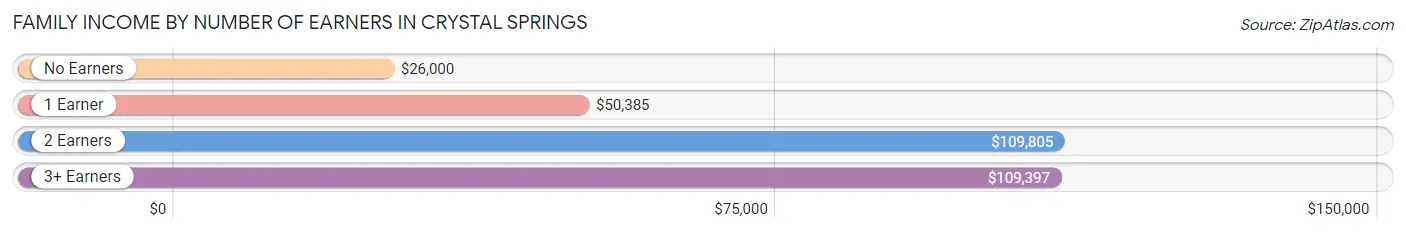
| Number of Earners | # Families | Median Income |
| No Earners | 198 (18.7%) | $26,000 |
| 1 Earner | 478 (45.2%) | $50,385 |
| 2 Earners | 315 (29.8%) | $109,805 |
| 3+ Earners | 66 (6.2%) | $109,397 |
| Total | 1,057 (100.0%) | $54,144 |
Household Income in Crystal Springs
Household Income Brackets in Crystal Springs
With 294 households falling in the category, the $100,000 to $149,999 income range is the most frequent in Crystal Springs, accounting for 16.9% of all households. In contrast, only 42 households (2.4%) fall into the $200,000+ income bracket, making it the least populous group.
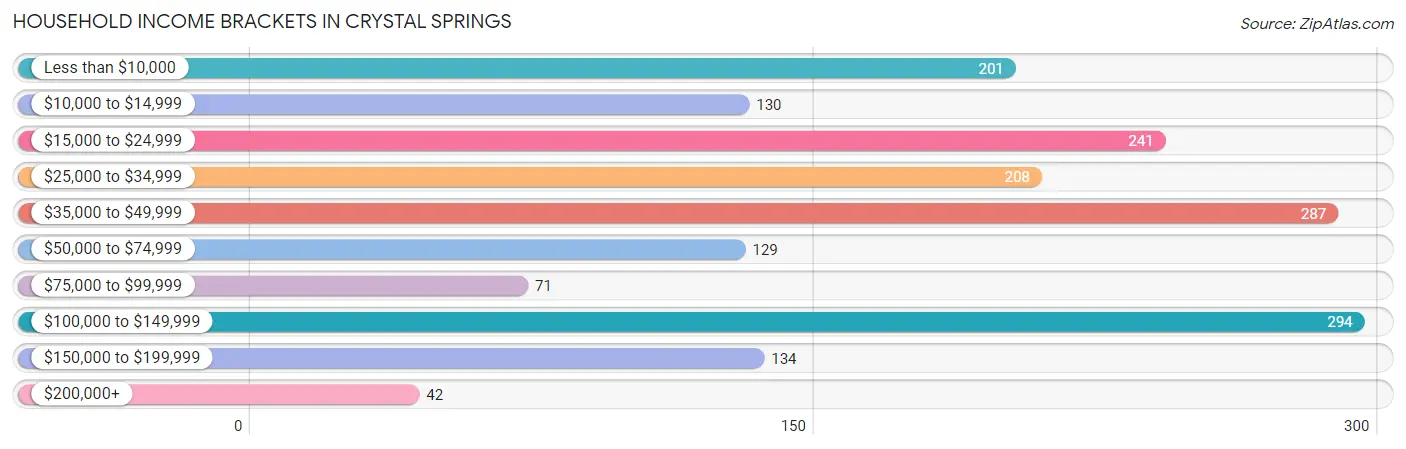
| Income Bracket | # Households | % Households |
| Less than $10,000 | 201 | 11.6% |
| $10,000 to $14,999 | 130 | 7.5% |
| $15,000 to $24,999 | 241 | 13.9% |
| $25,000 to $34,999 | 208 | 12.0% |
| $35,000 to $49,999 | 287 | 16.5% |
| $50,000 to $74,999 | 129 | 7.4% |
| $75,000 to $99,999 | 71 | 4.1% |
| $100,000 to $149,999 | 294 | 16.9% |
| $150,000 to $199,999 | 134 | 7.7% |
| $200,000+ | 42 | 2.4% |
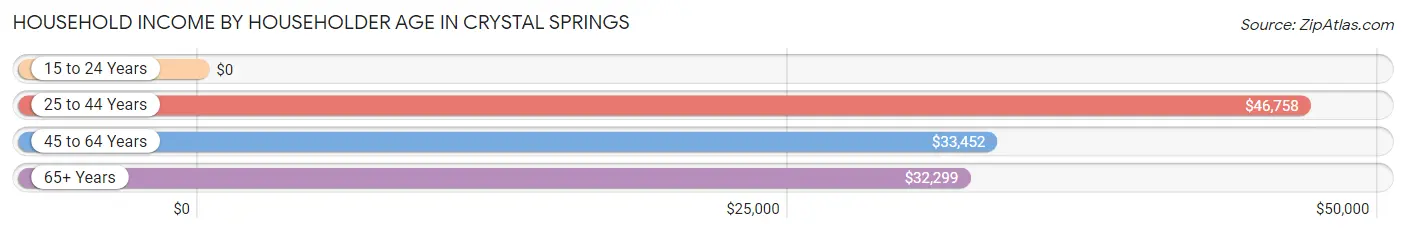
Household Income by Householder Age in Crystal Springs
The median household income in Crystal Springs is $44,653, with the highest median household income of $46,758 found in the 25 to 44 years age bracket for the primary householder. A total of 518 households (29.8%) fall into this category. Meanwhile, the 15 to 24 years age bracket for the primary householder has the lowest median household income of $0, with 64 households (3.7%) in this group.
| Income Bracket | # Households | Median Income |
| 15 to 24 Years | 64 (3.7%) | $0 |
| 25 to 44 Years | 518 (29.8%) | $46,758 |
| 45 to 64 Years | 632 (36.4%) | $33,452 |
| 65+ Years | 523 (30.1%) | $32,299 |
| Total | 1,737 (100.0%) | $44,653 |
Poverty in Crystal Springs
Income Below Poverty by Sex and Age in Crystal Springs
With 28.2% poverty level for males and 24.6% for females among the residents of Crystal Springs, under 5 year old males and under 5 year old females are the most vulnerable to poverty, with 149 males (100.0%) and 153 females (63.2%) in their respective age groups living below the poverty level.
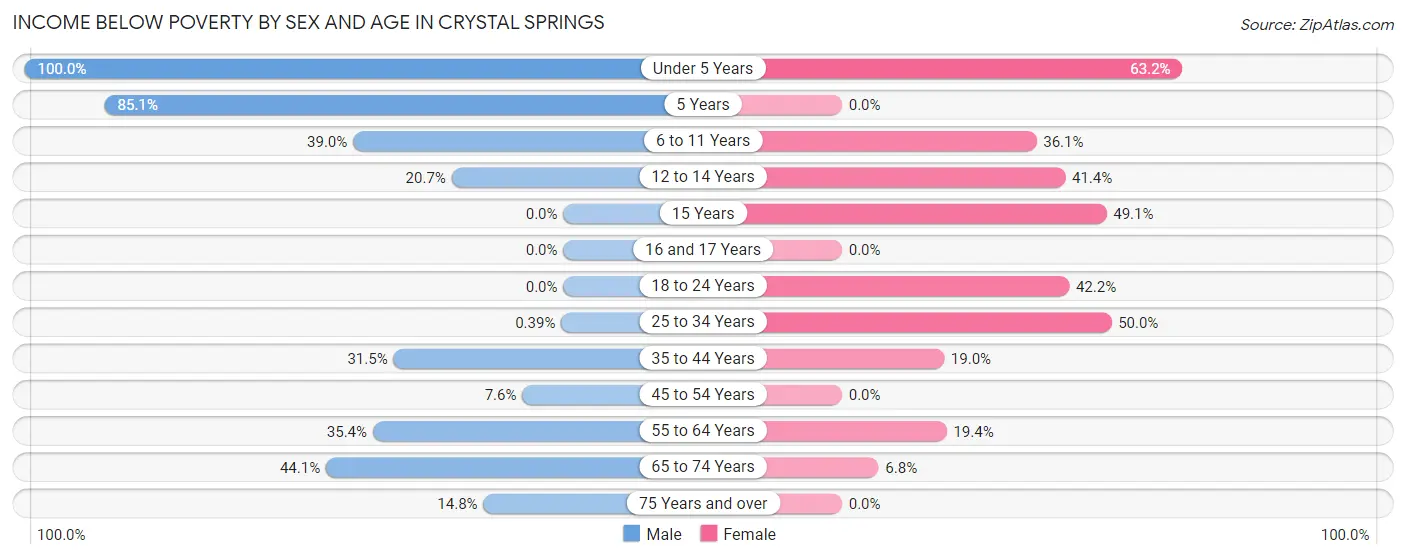
| Age Bracket | Male | Female |
| Under 5 Years | 149 (100.0%) | 153 (63.2%) |
| 5 Years | 63 (85.1%) | 0 (0.0%) |
| 6 to 11 Years | 32 (39.0%) | 74 (36.1%) |
| 12 to 14 Years | 17 (20.7%) | 46 (41.4%) |
| 15 Years | 0 (0.0%) | 27 (49.1%) |
| 16 and 17 Years | 0 (0.0%) | 0 (0.0%) |
| 18 to 24 Years | 0 (0.0%) | 70 (42.2%) |
| 25 to 34 Years | 1 (0.4%) | 89 (50.0%) |
| 35 to 44 Years | 111 (31.5%) | 47 (19.0%) |
| 45 to 54 Years | 34 (7.6%) | 0 (0.0%) |
| 55 to 64 Years | 122 (35.4%) | 61 (19.4%) |
| 65 to 74 Years | 115 (44.1%) | 17 (6.8%) |
| 75 Years and over | 27 (14.8%) | 0 (0.0%) |
| Total | 671 (28.2%) | 584 (24.6%) |
Income Above Poverty by Sex and Age in Crystal Springs
According to the poverty statistics in Crystal Springs, males aged 15 years and females aged 16 and 17 years are the age groups that are most secure financially, with 100.0% of males and 100.0% of females in these age groups living above the poverty line.
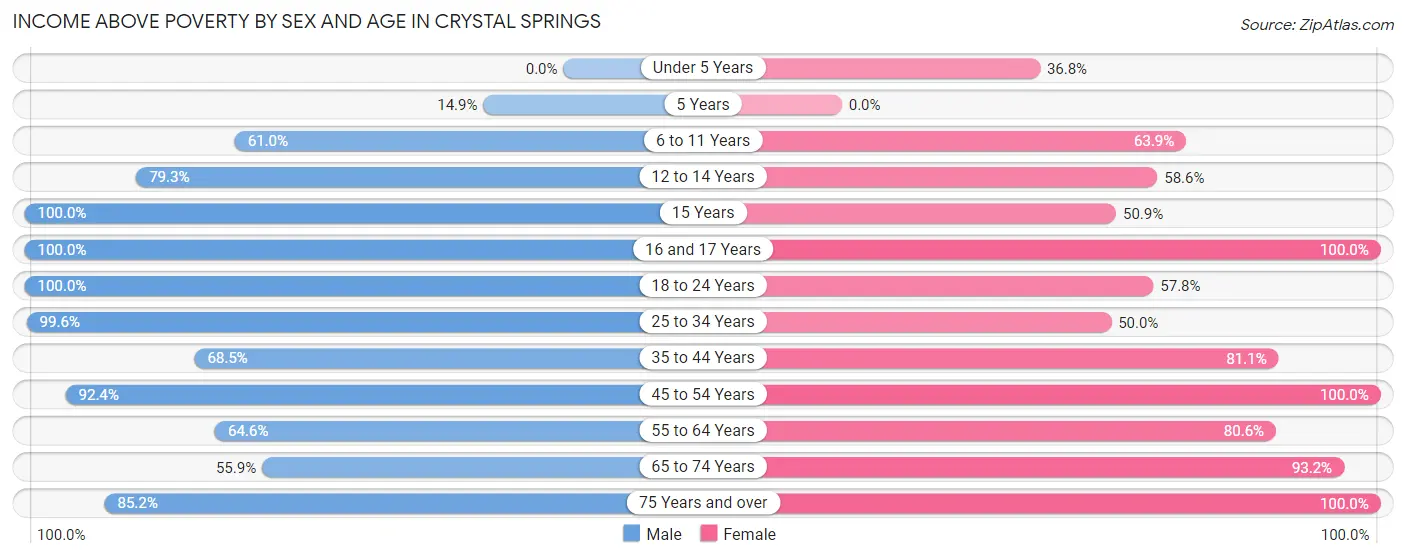
| Age Bracket | Male | Female |
| Under 5 Years | 0 (0.0%) | 89 (36.8%) |
| 5 Years | 11 (14.9%) | 0 (0.0%) |
| 6 to 11 Years | 50 (61.0%) | 131 (63.9%) |
| 12 to 14 Years | 65 (79.3%) | 65 (58.6%) |
| 15 Years | 26 (100.0%) | 28 (50.9%) |
| 16 and 17 Years | 43 (100.0%) | 27 (100.0%) |
| 18 to 24 Years | 83 (100.0%) | 96 (57.8%) |
| 25 to 34 Years | 254 (99.6%) | 89 (50.0%) |
| 35 to 44 Years | 241 (68.5%) | 201 (81.0%) |
| 45 to 54 Years | 412 (92.4%) | 371 (100.0%) |
| 55 to 64 Years | 223 (64.6%) | 253 (80.6%) |
| 65 to 74 Years | 146 (55.9%) | 233 (93.2%) |
| 75 Years and over | 155 (85.2%) | 203 (100.0%) |
| Total | 1,709 (71.8%) | 1,786 (75.4%) |
Income Below Poverty Among Married-Couple Families in Crystal Springs
The poverty statistics for married-couple families in Crystal Springs show that 9.8% or 55 of the total 561 families live below the poverty line. Families with 1 or 2 children have the highest poverty rate of 25.7%, comprising of 38 families. On the other hand, families with 3 or 4 children have the lowest poverty rate of 0.0%, which includes 0 families.
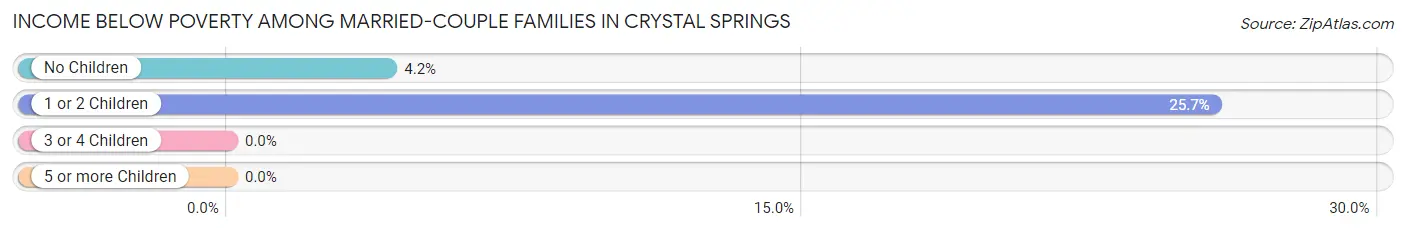
| Children | Above Poverty | Below Poverty |
| No Children | 392 (95.8%) | 17 (4.2%) |
| 1 or 2 Children | 110 (74.3%) | 38 (25.7%) |
| 3 or 4 Children | 4 (100.0%) | 0 (0.0%) |
| 5 or more Children | 0 (0.0%) | 0 (0.0%) |
| Total | 506 (90.2%) | 55 (9.8%) |
Income Below Poverty Among Single-Parent Households in Crystal Springs
According to the poverty data in Crystal Springs, 44.9% or 40 single-father households and 22.4% or 91 single-mother households are living below the poverty line. Among single-father households, those with no children have the highest poverty rate, with 40 households (100.0%) experiencing poverty. Likewise, among single-mother households, those with 3 or 4 children have the highest poverty rate, with 71 households (78.9%) falling below the poverty line.
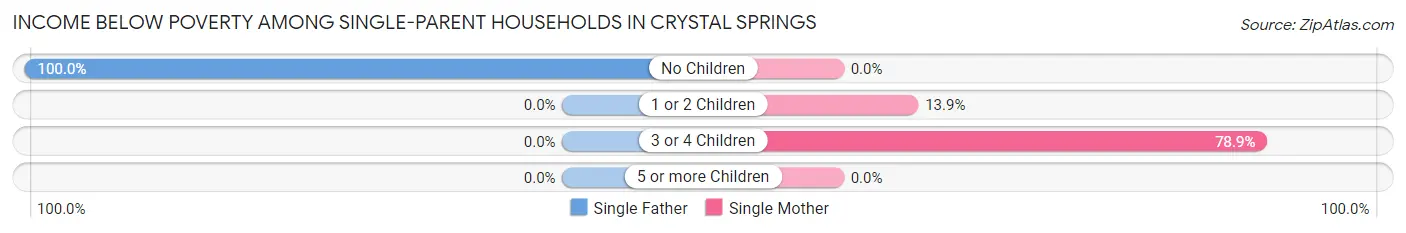
| Children | Single Father | Single Mother |
| No Children | 40 (100.0%) | 0 (0.0%) |
| 1 or 2 Children | 0 (0.0%) | 20 (13.9%) |
| 3 or 4 Children | 0 (0.0%) | 71 (78.9%) |
| 5 or more Children | 0 (0.0%) | 0 (0.0%) |
| Total | 40 (44.9%) | 91 (22.4%) |
Income Below Poverty Among Married-Couple vs Single-Parent Households in Crystal Springs
The poverty data for Crystal Springs shows that 55 of the married-couple family households (9.8%) and 131 of the single-parent households (26.4%) are living below the poverty level. Within the married-couple family households, those with 1 or 2 children have the highest poverty rate, with 38 households (25.7%) falling below the poverty line. Among the single-parent households, those with 3 or 4 children have the highest poverty rate, with 71 household (78.9%) living below poverty.
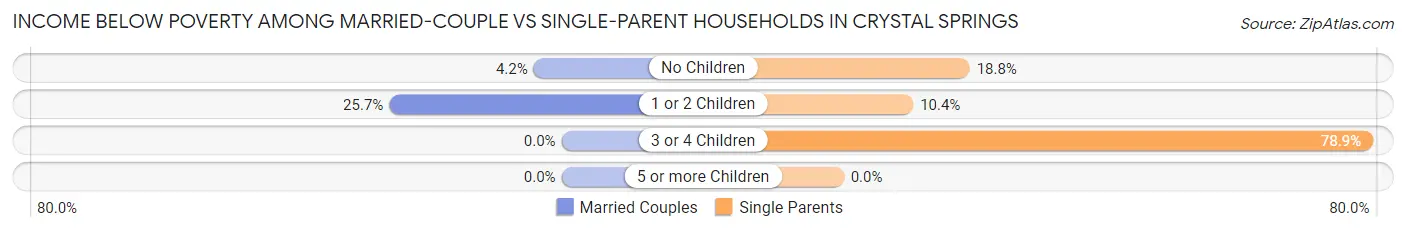
| Children | Married-Couple Families | Single-Parent Households |
| No Children | 17 (4.2%) | 40 (18.8%) |
| 1 or 2 Children | 38 (25.7%) | 20 (10.4%) |
| 3 or 4 Children | 0 (0.0%) | 71 (78.9%) |
| 5 or more Children | 0 (0.0%) | 0 (0.0%) |
| Total | 55 (9.8%) | 131 (26.4%) |
Race in Crystal Springs
The most populous races in Crystal Springs are Black / African American (3,090 | 64.1%), White / Caucasian (1,348 | 28.0%), and Hispanic or Latino (286 | 5.9%).
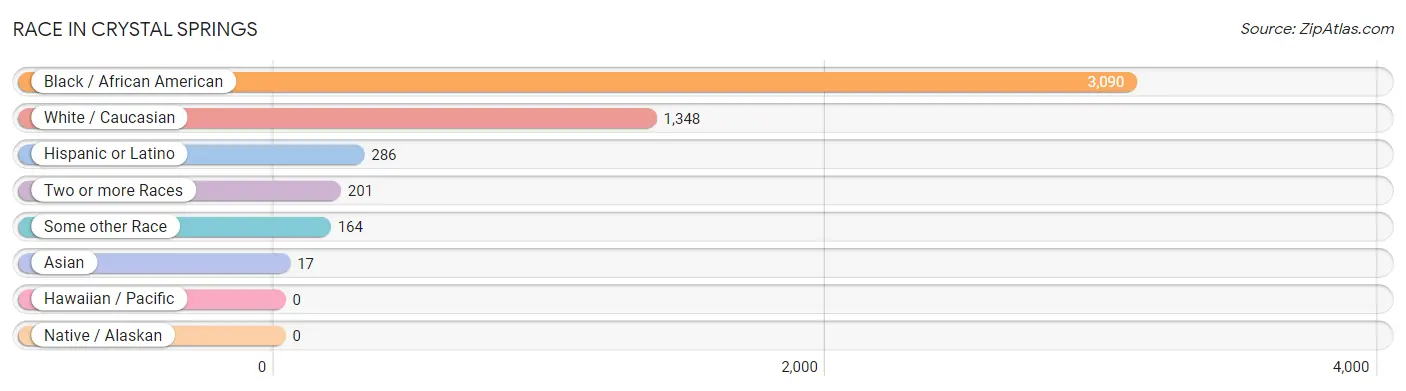
| Race | # Population | % Population |
| Asian | 17 | 0.4% |
| Black / African American | 3,090 | 64.1% |
| Hawaiian / Pacific | 0 | 0.0% |
| Hispanic or Latino | 286 | 5.9% |
| Native / Alaskan | 0 | 0.0% |
| White / Caucasian | 1,348 | 28.0% |
| Two or more Races | 201 | 4.2% |
| Some other Race | 164 | 3.4% |
| Total | 4,820 | 100.0% |
Ancestry in Crystal Springs
The most populous ancestries reported in Crystal Springs are Irish (426 | 8.8%), German (283 | 5.9%), English (261 | 5.4%), Mexican (183 | 3.8%), and American (172 | 3.6%), together accounting for 27.5% of all Crystal Springs residents.
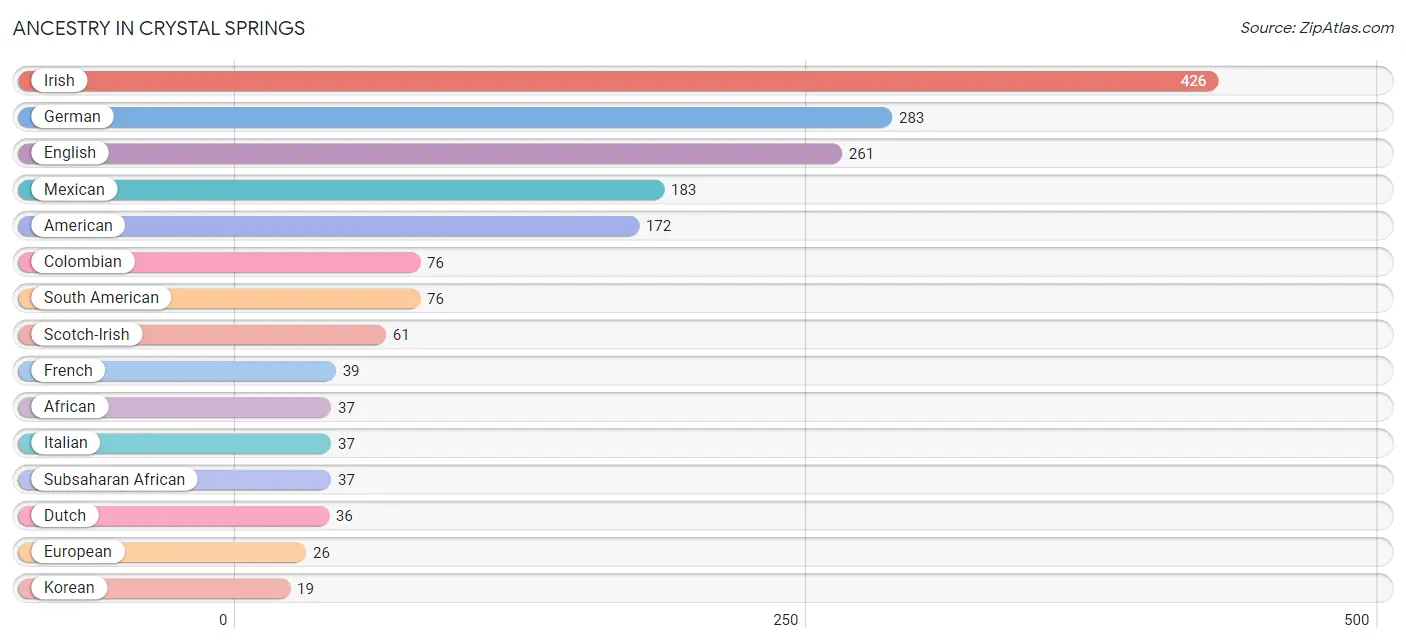
| Ancestry | # Population | % Population |
| African | 37 | 0.8% |
| American | 172 | 3.6% |
| Central American | 17 | 0.4% |
| Choctaw | 5 | 0.1% |
| Colombian | 76 | 1.6% |
| Dutch | 36 | 0.7% |
| English | 261 | 5.4% |
| European | 26 | 0.5% |
| French | 39 | 0.8% |
| German | 283 | 5.9% |
| Guatemalan | 17 | 0.4% |
| Indian (Asian) | 17 | 0.4% |
| Irish | 426 | 8.8% |
| Italian | 37 | 0.8% |
| Korean | 19 | 0.4% |
| Mexican | 183 | 3.8% |
| Puerto Rican | 10 | 0.2% |
| Scotch-Irish | 61 | 1.3% |
| Scottish | 17 | 0.4% |
| South American | 76 | 1.6% |
| Subsaharan African | 37 | 0.8% |
| Welsh | 8 | 0.2% | View All 22 Rows |
Immigrants in Crystal Springs
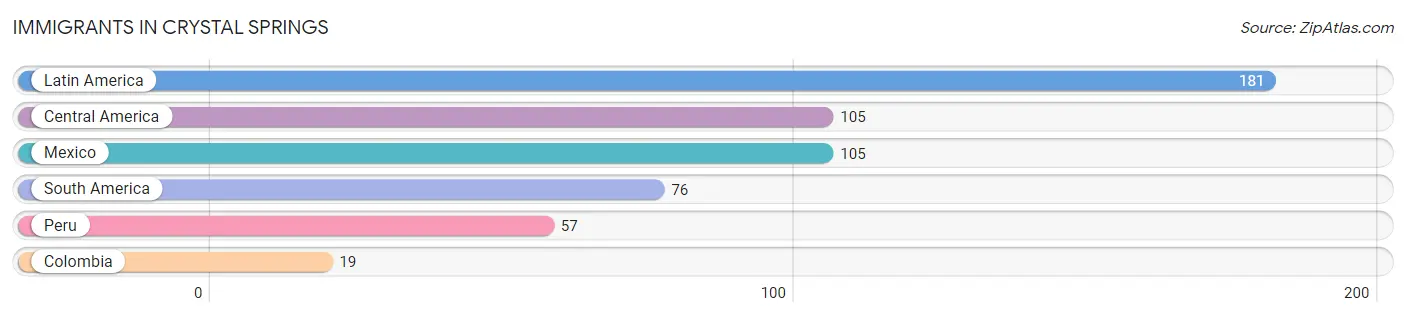
The most numerous immigrant groups reported in Crystal Springs came from Latin America (181 | 3.8%), Central America (105 | 2.2%), Mexico (105 | 2.2%), South America (76 | 1.6%), and Peru (57 | 1.2%), together accounting for 10.9% of all Crystal Springs residents.
| Immigration Origin | # Population | % Population |
| Central America | 105 | 2.2% |
| Colombia | 19 | 0.4% |
| Latin America | 181 | 3.8% |
| Mexico | 105 | 2.2% |
| Peru | 57 | 1.2% |
| South America | 76 | 1.6% | View All 6 Rows |
Sex and Age in Crystal Springs
Sex and Age in Crystal Springs
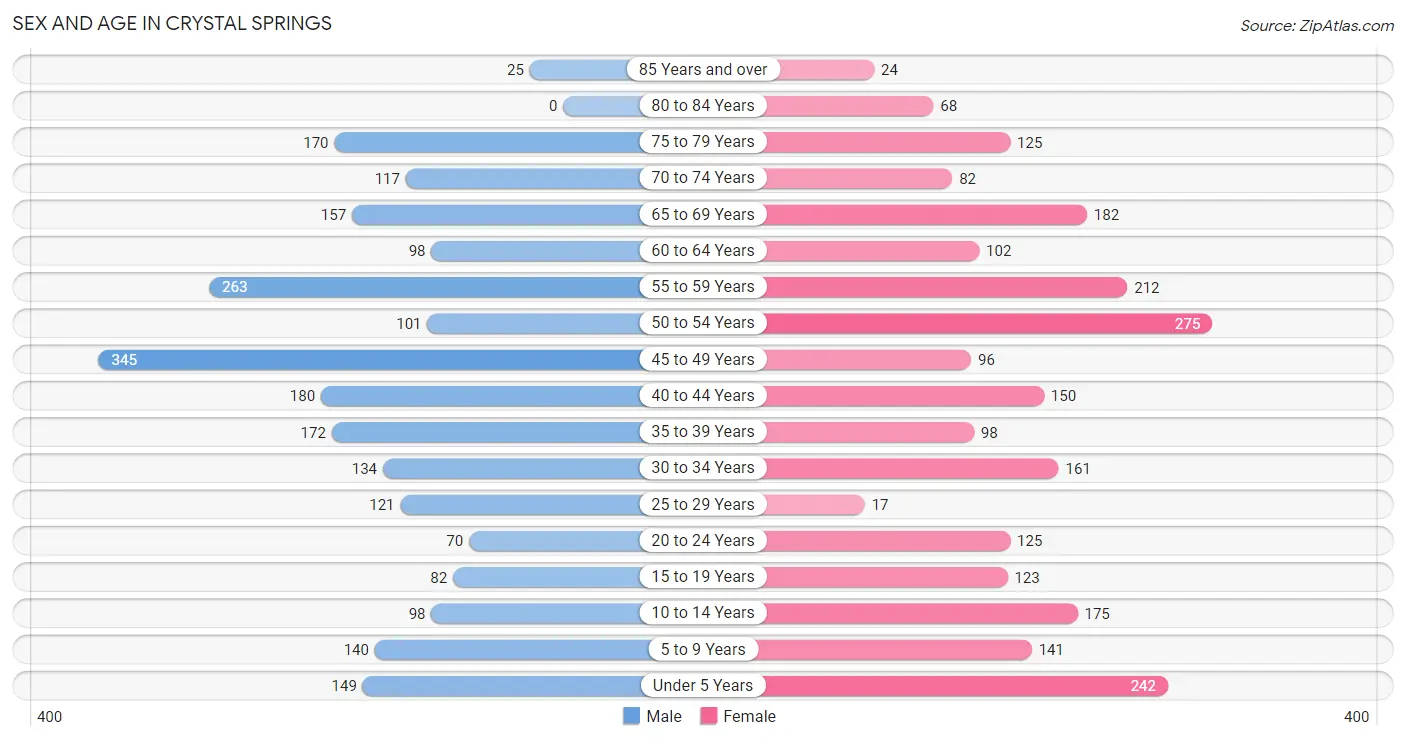
The most populous age groups in Crystal Springs are 45 to 49 Years (345 | 14.2%) for men and 50 to 54 Years (275 | 11.5%) for women.
| Age Bracket | Male | Female |
| Under 5 Years | 149 (6.1%) | 242 (10.1%) |
| 5 to 9 Years | 140 (5.8%) | 141 (5.9%) |
| 10 to 14 Years | 98 (4.1%) | 175 (7.3%) |
| 15 to 19 Years | 82 (3.4%) | 123 (5.1%) |
| 20 to 24 Years | 70 (2.9%) | 125 (5.2%) |
| 25 to 29 Years | 121 (5.0%) | 17 (0.7%) |
| 30 to 34 Years | 134 (5.5%) | 161 (6.7%) |
| 35 to 39 Years | 172 (7.1%) | 98 (4.1%) |
| 40 to 44 Years | 180 (7.4%) | 150 (6.3%) |
| 45 to 49 Years | 345 (14.2%) | 96 (4.0%) |
| 50 to 54 Years | 101 (4.2%) | 275 (11.5%) |
| 55 to 59 Years | 263 (10.9%) | 212 (8.8%) |
| 60 to 64 Years | 98 (4.1%) | 102 (4.3%) |
| 65 to 69 Years | 157 (6.5%) | 182 (7.6%) |
| 70 to 74 Years | 117 (4.8%) | 82 (3.4%) |
| 75 to 79 Years | 170 (7.0%) | 125 (5.2%) |
| 80 to 84 Years | 0 (0.0%) | 68 (2.8%) |
| 85 Years and over | 25 (1.0%) | 24 (1.0%) |
| Total | 2,422 (100.0%) | 2,398 (100.0%) |
Families and Households in Crystal Springs
Median Family Size in Crystal Springs
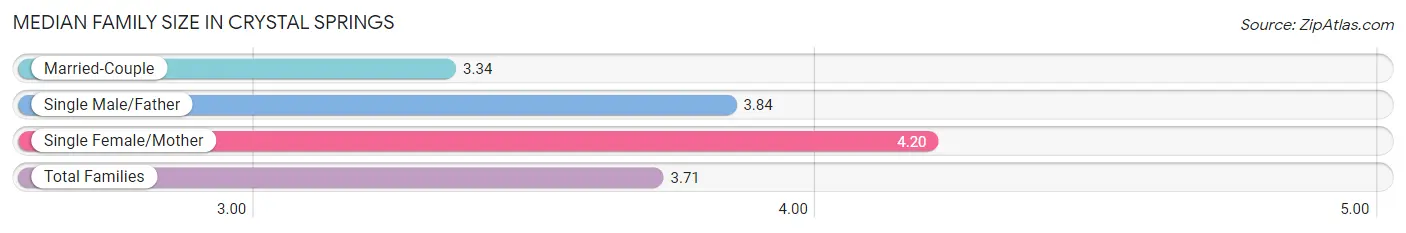
The median family size in Crystal Springs is 3.71 persons per family, with single female/mother families (407 | 38.5%) accounting for the largest median family size of 4.2 persons per family. On the other hand, married-couple families (561 | 53.1%) represent the smallest median family size with 3.34 persons per family.
| Family Type | # Families | Family Size |
| Married-Couple | 561 (53.1%) | 3.34 |
| Single Male/Father | 89 (8.4%) | 3.84 |
| Single Female/Mother | 407 (38.5%) | 4.20 |
| Total Families | 1,057 (100.0%) | 3.71 |
Median Household Size in Crystal Springs
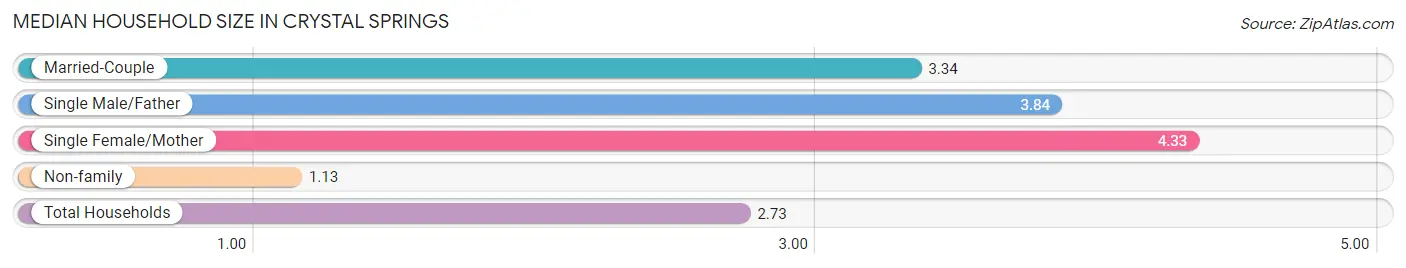
The median household size in Crystal Springs is 2.73 persons per household, with single female/mother households (407 | 23.4%) accounting for the largest median household size of 4.33 persons per household. non-family households (680 | 39.2%) represent the smallest median household size with 1.13 persons per household.
| Household Type | # Households | Household Size |
| Married-Couple | 561 (32.3%) | 3.34 |
| Single Male/Father | 89 (5.1%) | 3.84 |
| Single Female/Mother | 407 (23.4%) | 4.33 |
| Non-family | 680 (39.2%) | 1.13 |
| Total Households | 1,737 (100.0%) | 2.73 |
Household Size by Marriage Status in Crystal Springs
Out of a total of 1,737 households in Crystal Springs, 1,057 (60.9%) are family households, while 680 (39.2%) are nonfamily households. The most numerous type of family households are 3-person households, comprising 404, and the most common type of nonfamily households are 1-person households, comprising 597.
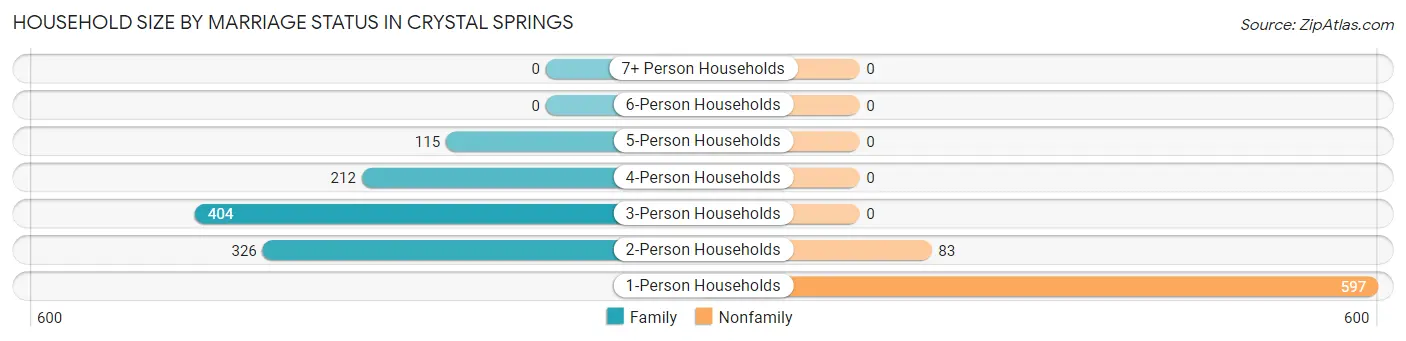
| Household Size | Family Households | Nonfamily Households |
| 1-Person Households | - | 597 (34.4%) |
| 2-Person Households | 326 (18.8%) | 83 (4.8%) |
| 3-Person Households | 404 (23.3%) | 0 (0.0%) |
| 4-Person Households | 212 (12.2%) | 0 (0.0%) |
| 5-Person Households | 115 (6.6%) | 0 (0.0%) |
| 6-Person Households | 0 (0.0%) | 0 (0.0%) |
| 7+ Person Households | 0 (0.0%) | 0 (0.0%) |
| Total | 1,057 (60.9%) | 680 (39.2%) |
Female Fertility in Crystal Springs
Fertility by Age in Crystal Springs
| Age Bracket | Women with Births | Births / 1,000 Women |
| 15 to 19 years | 0 (0.0%) | 0.0 |
| 20 to 34 years | 0 (0.0%) | 0.0 |
| 35 to 50 years | 0 (0.0%) | 0.0 |
| Total | 0 (0.0%) | 0.0 |
Fertility by Age by Marriage Status in Crystal Springs
| Age Bracket | Married | Unmarried |
| 15 to 19 years | 0 (0.0%) | 0 (0.0%) |
| 20 to 34 years | 0 (0.0%) | 0 (0.0%) |
| 35 to 50 years | 0 (0.0%) | 0 (0.0%) |
| Total | 0 (0.0%) | 0 (0.0%) |
Fertility by Education in Crystal Springs
| Educational Attainment | Women with Births | Births / 1,000 Women |
| Less than High School | 0 (0.0%) | 0.0 |
| High School Diploma | 0 (0.0%) | 0.0 |
| College or Associate's Degree | 0 (0.0%) | 0.0 |
| Bachelor's Degree | 0 (0.0%) | 0.0 |
| Graduate Degree | 0 (0.0%) | 0.0 |
| Total | 0 (0.0%) | 0.0 |
Fertility by Education by Marriage Status in Crystal Springs
| Educational Attainment | Married | Unmarried |
| Less than High School | 0 (0.0%) | 0 (0.0%) |
| High School Diploma | 0 (0.0%) | 0 (0.0%) |
| College or Associate's Degree | 0 (0.0%) | 0 (0.0%) |
| Bachelor's Degree | 0 (0.0%) | 0 (0.0%) |
| Graduate Degree | 0 (0.0%) | 0 (0.0%) |
| Total | 0 (0.0%) | 0 (0.0%) |
Employment Characteristics in Crystal Springs
Employment by Class of Employer in Crystal Springs
Among the 1,739 employed individuals in Crystal Springs, private company employees (1,266 | 72.8%), not-for-profit organizations (145 | 8.3%), and local government employees (141 | 8.1%) make up the most common classes of employment.
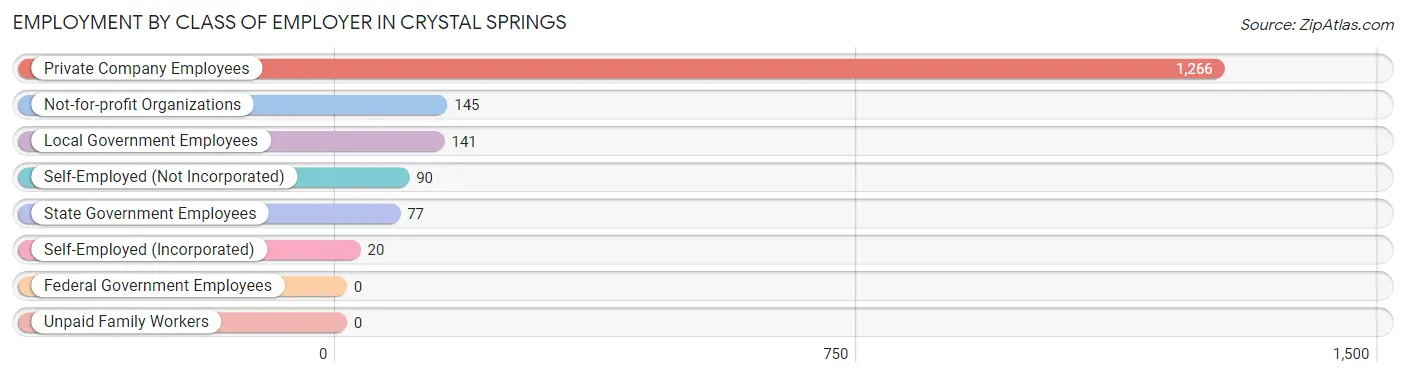
| Employer Class | # Employees | % Employees |
| Private Company Employees | 1,266 | 72.8% |
| Self-Employed (Incorporated) | 20 | 1.1% |
| Self-Employed (Not Incorporated) | 90 | 5.2% |
| Not-for-profit Organizations | 145 | 8.3% |
| Local Government Employees | 141 | 8.1% |
| State Government Employees | 77 | 4.4% |
| Federal Government Employees | 0 | 0.0% |
| Unpaid Family Workers | 0 | 0.0% |
| Total | 1,739 | 100.0% |
Employment Status by Age in Crystal Springs
According to the labor force statistics for Crystal Springs, out of the total population over 16 years of age (3,794), 49.4% or 1,874 individuals are in the labor force, with 4.9% or 92 of them unemployed. The age group with the highest labor force participation rate is 25 to 29 years, with 99.3% or 137 individuals in the labor force. Within the labor force, the 25 to 29 years age range has the highest percentage of unemployed individuals, with 49.6% or 68 of them being unemployed.
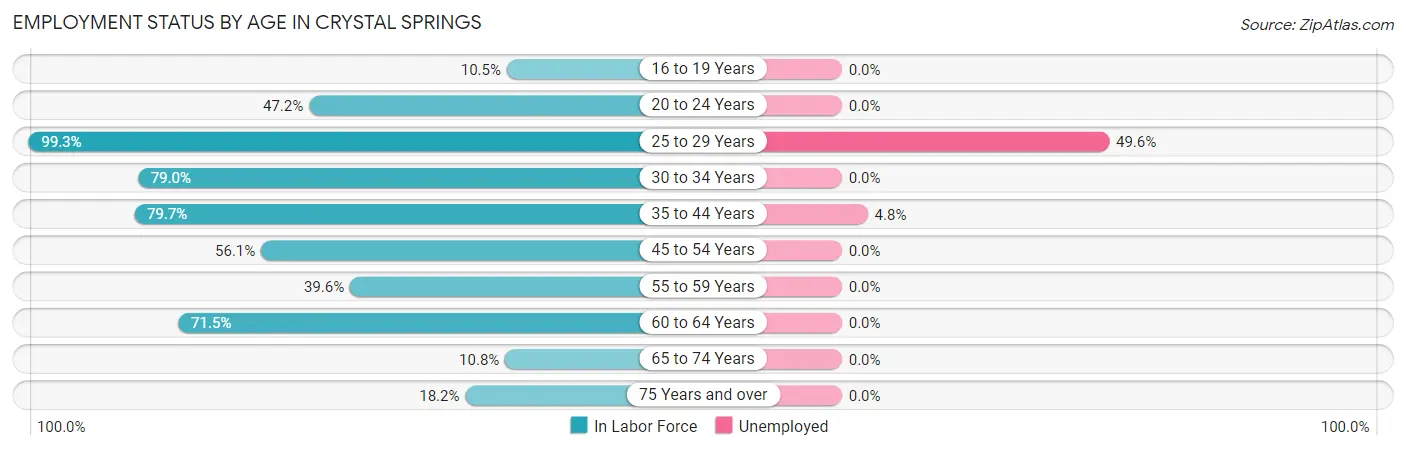
| Age Bracket | In Labor Force | Unemployed |
| 16 to 19 Years | 13 (10.5%) | 0 (0.0%) |
| 20 to 24 Years | 92 (47.2%) | 0 (0.0%) |
| 25 to 29 Years | 137 (99.3%) | 68 (49.6%) |
| 30 to 34 Years | 233 (79.0%) | 0 (0.0%) |
| 35 to 44 Years | 478 (79.7%) | 23 (4.8%) |
| 45 to 54 Years | 458 (56.1%) | 0 (0.0%) |
| 55 to 59 Years | 188 (39.6%) | 0 (0.0%) |
| 60 to 64 Years | 143 (71.5%) | 0 (0.0%) |
| 65 to 74 Years | 58 (10.8%) | 0 (0.0%) |
| 75 Years and over | 75 (18.2%) | 0 (0.0%) |
| Total | 1,874 (49.4%) | 92 (4.9%) |
Employment Status by Educational Attainment in Crystal Springs
According to labor force statistics for Crystal Springs, 64.8% of individuals (1,636) out of the total population between 25 and 64 years of age (2,525) are in the labor force, with 5.6% or 92 of them being unemployed. The group with the highest labor force participation rate are those with the educational attainment of college / associate degree, with 78.1% or 574 individuals in the labor force. Within the labor force, individuals with bachelor's degree or higher education have the highest percentage of unemployment, with 9.7% or 51 of them being unemployed.
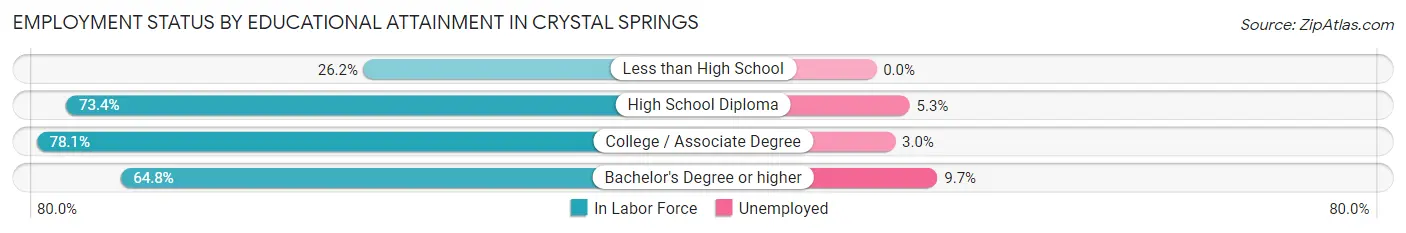
| Educational Attainment | In Labor Force | Unemployed |
| Less than High School | 101 (26.2%) | 0 (0.0%) |
| High School Diploma | 437 (73.4%) | 32 (5.3%) |
| College / Associate Degree | 574 (78.1%) | 22 (3.0%) |
| Bachelor's Degree or higher | 525 (64.8%) | 79 (9.7%) |
| Total | 1,636 (64.8%) | 141 (5.6%) |
Employment Occupations by Sex in Crystal Springs
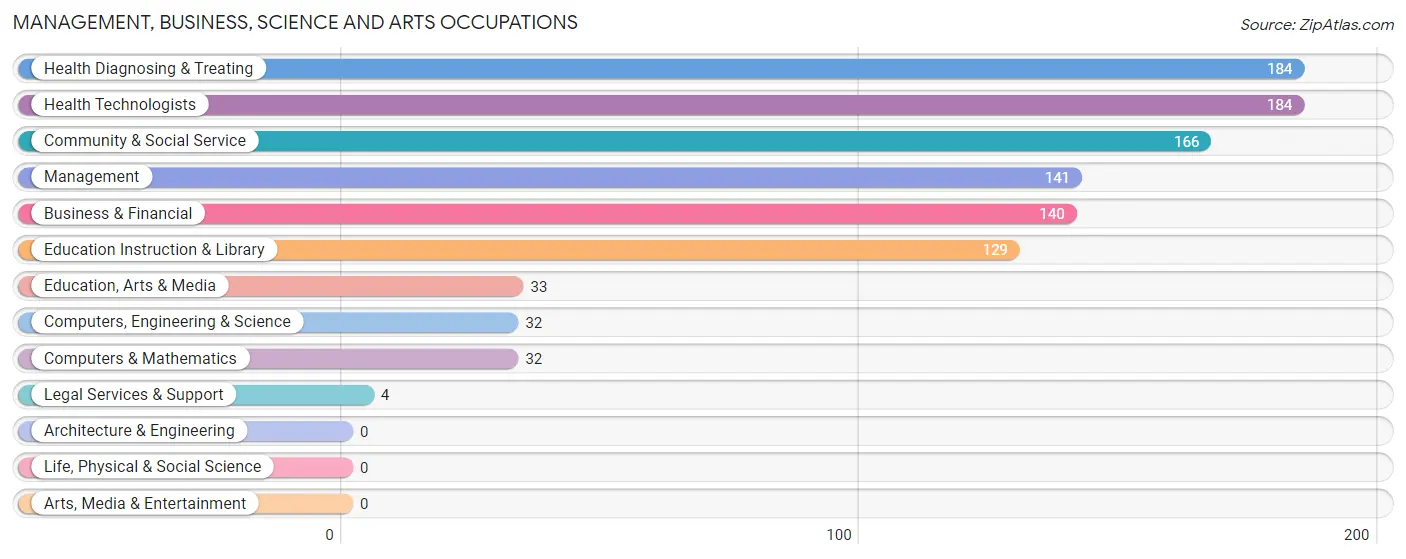
Management, Business, Science and Arts Occupations
The most common Management, Business, Science and Arts occupations in Crystal Springs are Health Diagnosing & Treating (184 | 10.3%), Health Technologists (184 | 10.3%), Community & Social Service (166 | 9.3%), Management (141 | 7.9%), and Business & Financial (140 | 7.9%).
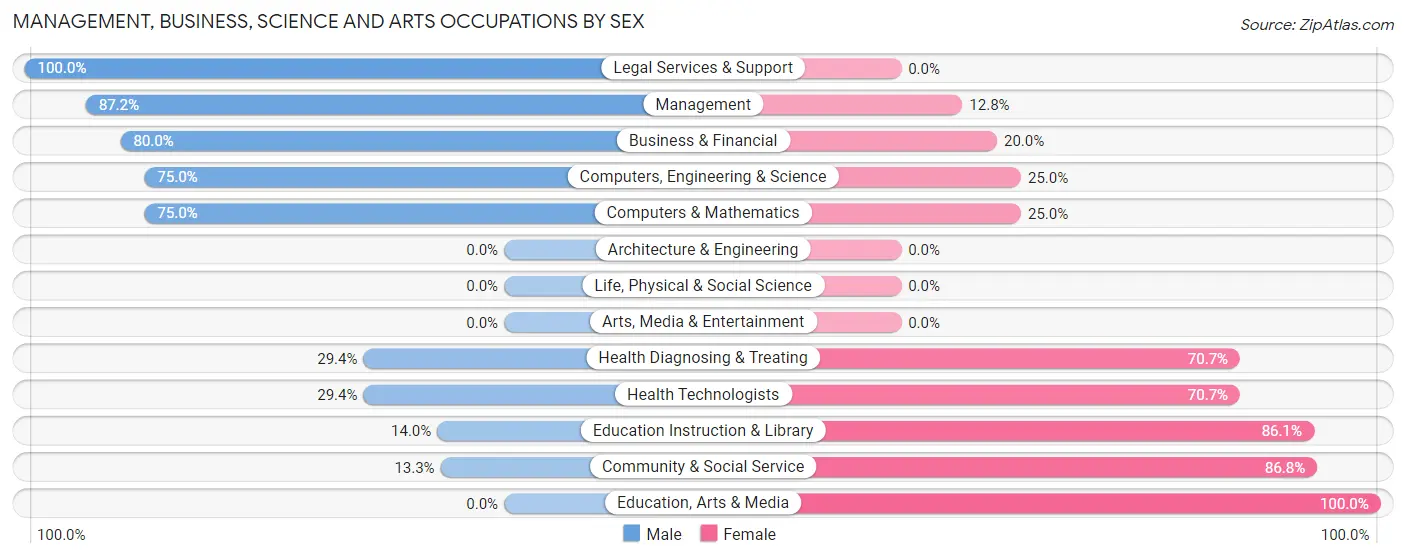
Management, Business, Science and Arts Occupations by Sex
Within the Management, Business, Science and Arts occupations in Crystal Springs, the most male-oriented occupations are Legal Services & Support (100.0%), Management (87.2%), and Business & Financial (80.0%), while the most female-oriented occupations are Education, Arts & Media (100.0%), Community & Social Service (86.8%), and Education Instruction & Library (86.1%).
| Occupation | Male | Female |
| Management | 123 (87.2%) | 18 (12.8%) |
| Business & Financial | 112 (80.0%) | 28 (20.0%) |
| Computers, Engineering & Science | 24 (75.0%) | 8 (25.0%) |
| Computers & Mathematics | 24 (75.0%) | 8 (25.0%) |
| Architecture & Engineering | 0 (0.0%) | 0 (0.0%) |
| Life, Physical & Social Science | 0 (0.0%) | 0 (0.0%) |
| Community & Social Service | 22 (13.3%) | 144 (86.8%) |
| Education, Arts & Media | 0 (0.0%) | 33 (100.0%) |
| Legal Services & Support | 4 (100.0%) | 0 (0.0%) |
| Education Instruction & Library | 18 (14.0%) | 111 (86.1%) |
| Arts, Media & Entertainment | 0 (0.0%) | 0 (0.0%) |
| Health Diagnosing & Treating | 54 (29.3%) | 130 (70.7%) |
| Health Technologists | 54 (29.3%) | 130 (70.7%) |
| Total (Category) | 335 (50.5%) | 328 (49.5%) |
| Total (Overall) | 956 (53.6%) | 828 (46.4%) |
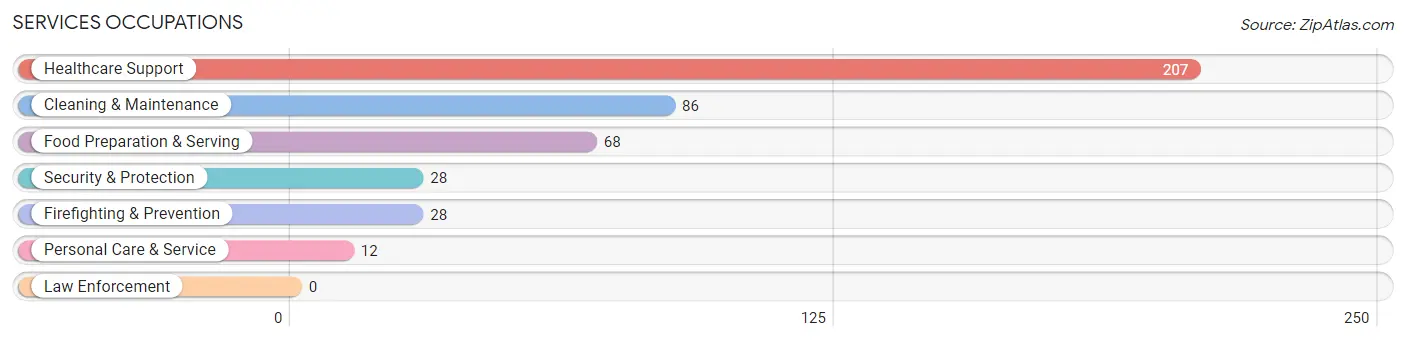
Services Occupations
The most common Services occupations in Crystal Springs are Healthcare Support (207 | 11.6%), Cleaning & Maintenance (86 | 4.8%), Food Preparation & Serving (68 | 3.8%), Security & Protection (28 | 1.6%), and Firefighting & Prevention (28 | 1.6%).
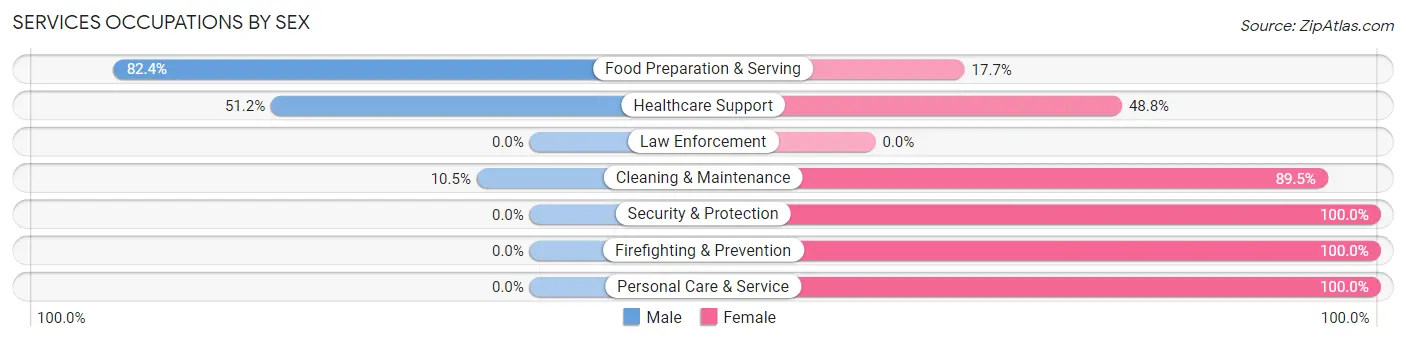
Services Occupations by Sex
Within the Services occupations in Crystal Springs, the most male-oriented occupations are Food Preparation & Serving (82.4%), Healthcare Support (51.2%), and Cleaning & Maintenance (10.5%), while the most female-oriented occupations are Security & Protection (100.0%), Firefighting & Prevention (100.0%), and Personal Care & Service (100.0%).
| Occupation | Male | Female |
| Healthcare Support | 106 (51.2%) | 101 (48.8%) |
| Security & Protection | 0 (0.0%) | 28 (100.0%) |
| Firefighting & Prevention | 0 (0.0%) | 28 (100.0%) |
| Law Enforcement | 0 (0.0%) | 0 (0.0%) |
| Food Preparation & Serving | 56 (82.4%) | 12 (17.6%) |
| Cleaning & Maintenance | 9 (10.5%) | 77 (89.5%) |
| Personal Care & Service | 0 (0.0%) | 12 (100.0%) |
| Total (Category) | 171 (42.6%) | 230 (57.4%) |
| Total (Overall) | 956 (53.6%) | 828 (46.4%) |
Sales and Office Occupations
The most common Sales and Office occupations in Crystal Springs are Sales & Related (149 | 8.4%), and Office & Administration (70 | 3.9%).
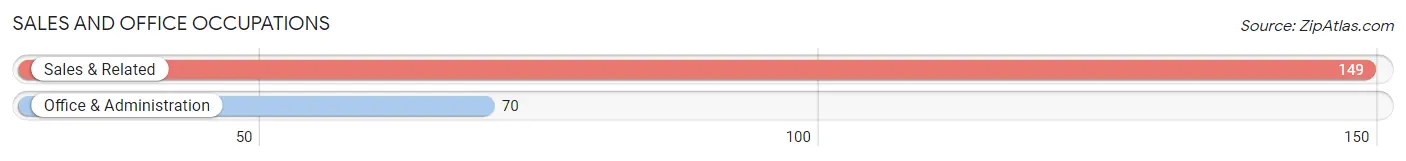
Sales and Office Occupations by Sex
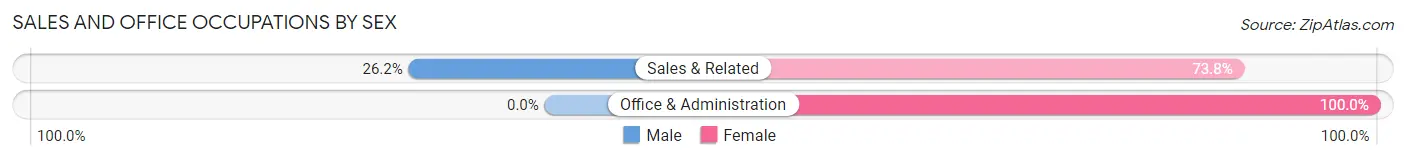
| Occupation | Male | Female |
| Sales & Related | 39 (26.2%) | 110 (73.8%) |
| Office & Administration | 0 (0.0%) | 70 (100.0%) |
| Total (Category) | 39 (17.8%) | 180 (82.2%) |
| Total (Overall) | 956 (53.6%) | 828 (46.4%) |
Natural Resources, Construction and Maintenance Occupations
The most common Natural Resources, Construction and Maintenance occupations in Crystal Springs are Installation, Maintenance & Repair (108 | 6.0%), and Construction & Extraction (20 | 1.1%).
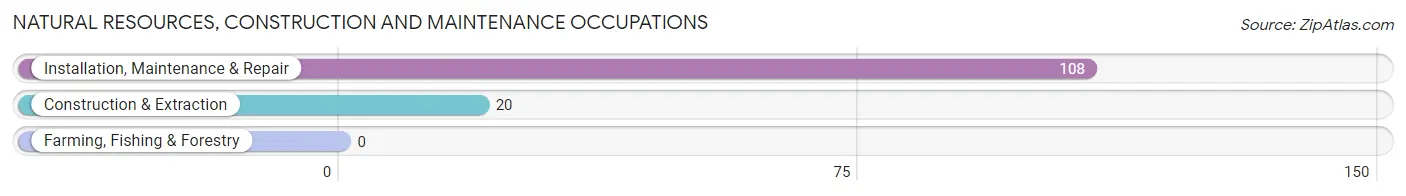
Natural Resources, Construction and Maintenance Occupations by Sex
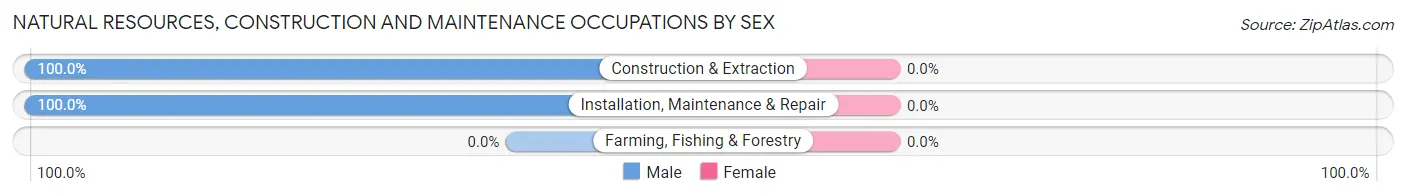
| Occupation | Male | Female |
| Farming, Fishing & Forestry | 0 (0.0%) | 0 (0.0%) |
| Construction & Extraction | 20 (100.0%) | 0 (0.0%) |
| Installation, Maintenance & Repair | 108 (100.0%) | 0 (0.0%) |
| Total (Category) | 128 (100.0%) | 0 (0.0%) |
| Total (Overall) | 956 (53.6%) | 828 (46.4%) |
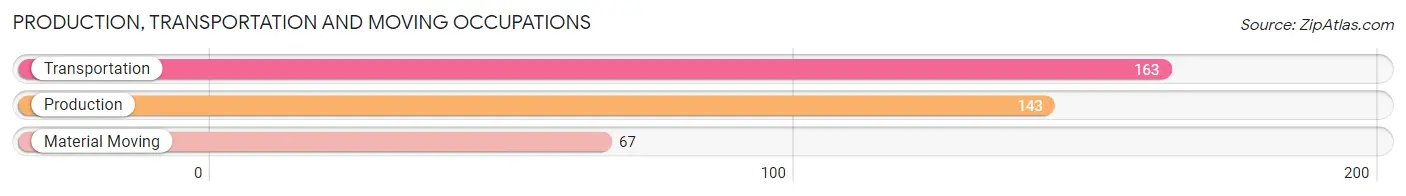
Production, Transportation and Moving Occupations
The most common Production, Transportation and Moving occupations in Crystal Springs are Transportation (163 | 9.1%), Production (143 | 8.0%), and Material Moving (67 | 3.8%).
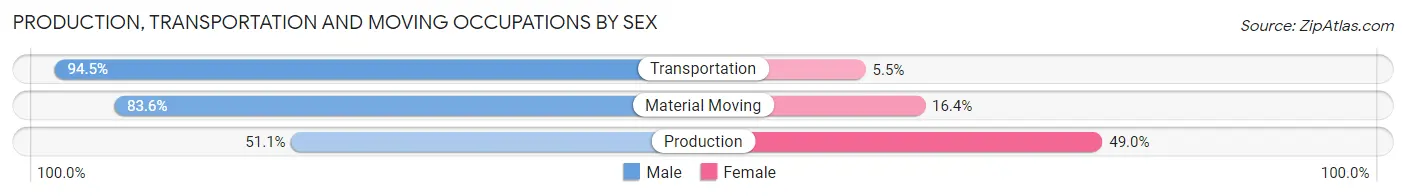
Production, Transportation and Moving Occupations by Sex
| Occupation | Male | Female |
| Production | 73 (51.0%) | 70 (48.9%) |
| Transportation | 154 (94.5%) | 9 (5.5%) |
| Material Moving | 56 (83.6%) | 11 (16.4%) |
| Total (Category) | 283 (75.9%) | 90 (24.1%) |
| Total (Overall) | 956 (53.6%) | 828 (46.4%) |
Employment Industries by Sex in Crystal Springs
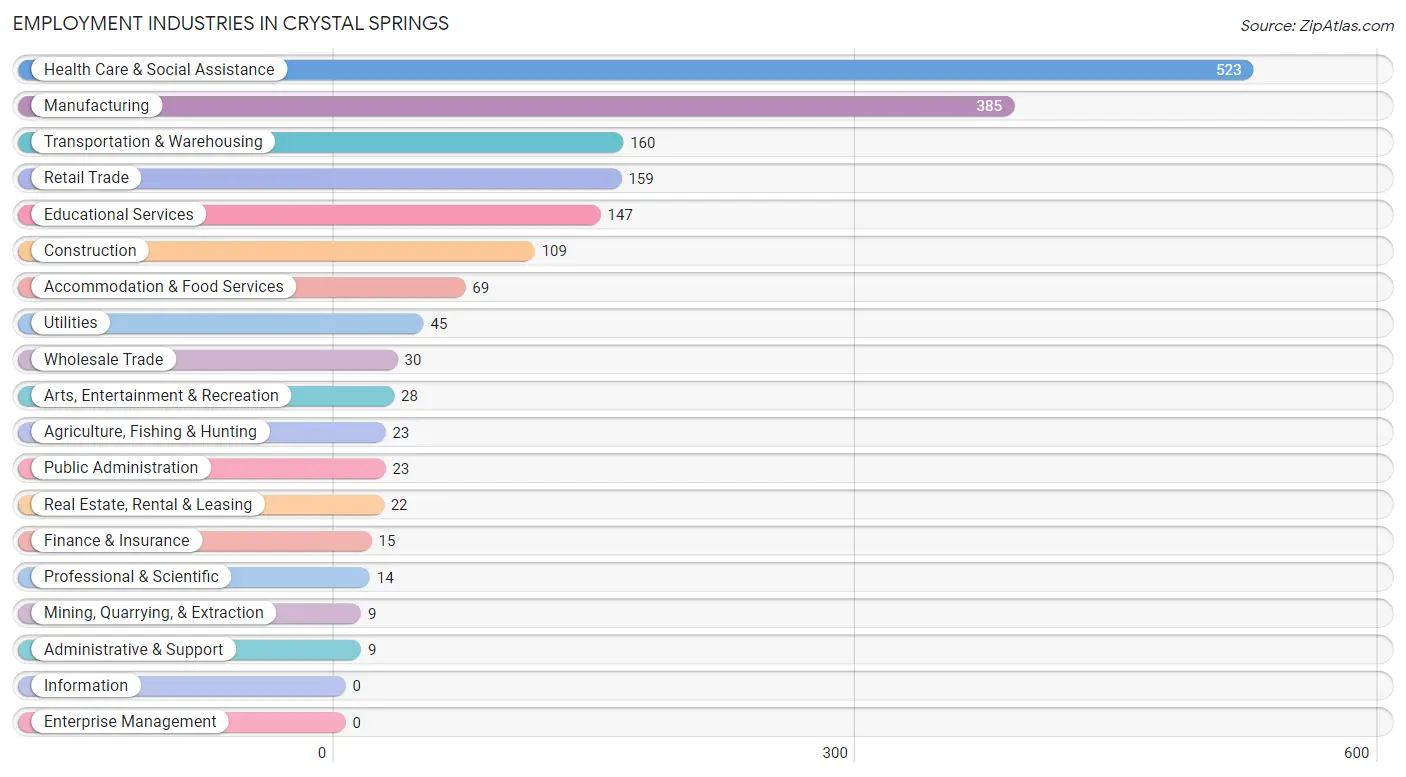
Employment Industries in Crystal Springs
The major employment industries in Crystal Springs include Health Care & Social Assistance (523 | 29.3%), Manufacturing (385 | 21.6%), Transportation & Warehousing (160 | 9.0%), Retail Trade (159 | 8.9%), and Educational Services (147 | 8.2%).
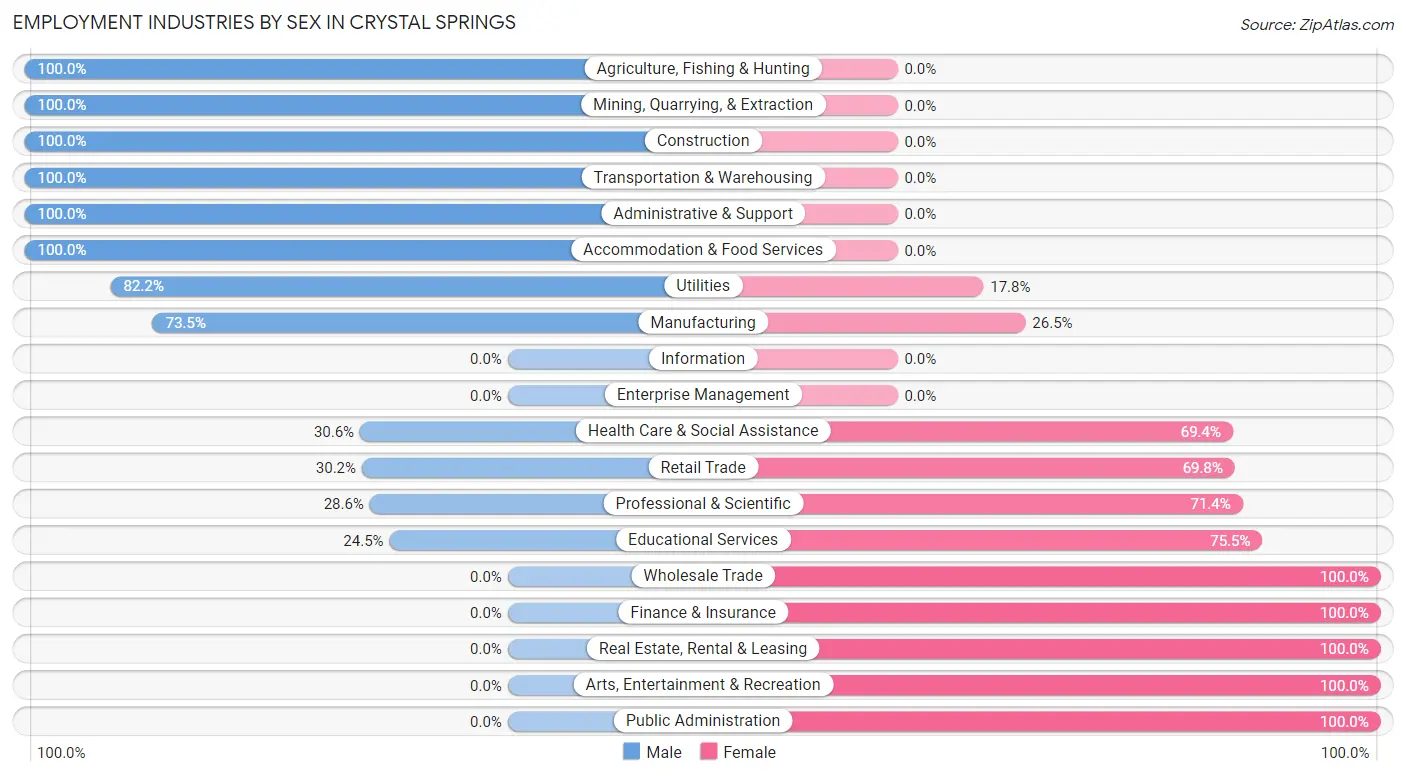
Employment Industries by Sex in Crystal Springs
The Crystal Springs industries that see more men than women are Agriculture, Fishing & Hunting (100.0%), Mining, Quarrying, & Extraction (100.0%), and Construction (100.0%), whereas the industries that tend to have a higher number of women are Wholesale Trade (100.0%), Finance & Insurance (100.0%), and Real Estate, Rental & Leasing (100.0%).
| Industry | Male | Female |
| Agriculture, Fishing & Hunting | 23 (100.0%) | 0 (0.0%) |
| Mining, Quarrying, & Extraction | 9 (100.0%) | 0 (0.0%) |
| Construction | 109 (100.0%) | 0 (0.0%) |
| Manufacturing | 283 (73.5%) | 102 (26.5%) |
| Wholesale Trade | 0 (0.0%) | 30 (100.0%) |
| Retail Trade | 48 (30.2%) | 111 (69.8%) |
| Transportation & Warehousing | 160 (100.0%) | 0 (0.0%) |
| Utilities | 37 (82.2%) | 8 (17.8%) |
| Information | 0 (0.0%) | 0 (0.0%) |
| Finance & Insurance | 0 (0.0%) | 15 (100.0%) |
| Real Estate, Rental & Leasing | 0 (0.0%) | 22 (100.0%) |
| Professional & Scientific | 4 (28.6%) | 10 (71.4%) |
| Enterprise Management | 0 (0.0%) | 0 (0.0%) |
| Administrative & Support | 9 (100.0%) | 0 (0.0%) |
| Educational Services | 36 (24.5%) | 111 (75.5%) |
| Health Care & Social Assistance | 160 (30.6%) | 363 (69.4%) |
| Arts, Entertainment & Recreation | 0 (0.0%) | 28 (100.0%) |
| Accommodation & Food Services | 69 (100.0%) | 0 (0.0%) |
| Public Administration | 0 (0.0%) | 23 (100.0%) |
| Total | 956 (53.6%) | 828 (46.4%) |
Education in Crystal Springs
School Enrollment in Crystal Springs
The most common levels of schooling among the 961 students in Crystal Springs are middle school (278 | 28.9%), elementary school (198 | 20.6%), and high school (167 | 17.4%).
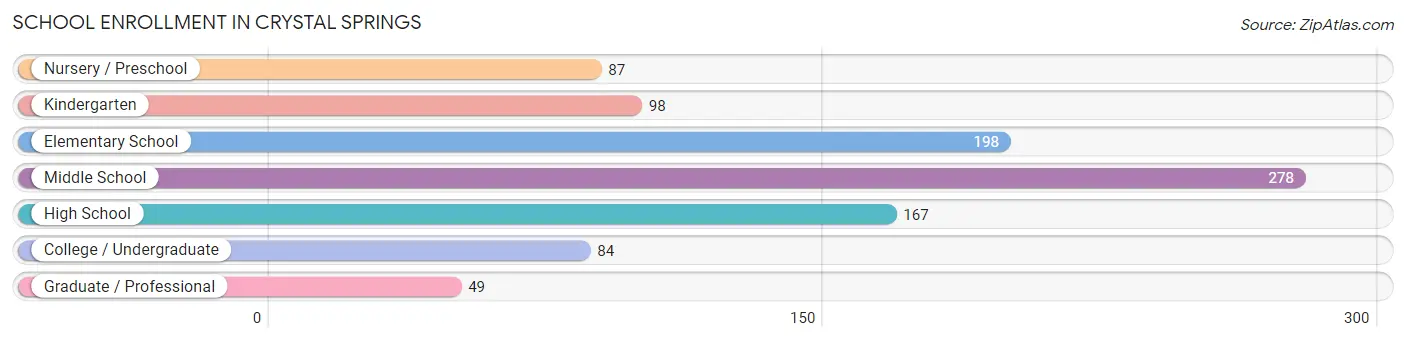
| School Level | # Students | % Students |
| Nursery / Preschool | 87 | 9.0% |
| Kindergarten | 98 | 10.2% |
| Elementary School | 198 | 20.6% |
| Middle School | 278 | 28.9% |
| High School | 167 | 17.4% |
| College / Undergraduate | 84 | 8.7% |
| Graduate / Professional | 49 | 5.1% |
| Total | 961 | 100.0% |
School Enrollment by Age by Funding Source in Crystal Springs
Out of a total of 961 students who are enrolled in schools in Crystal Springs, 210 (21.9%) attend a private institution, while the remaining 751 (78.1%) are enrolled in public schools. The age group of 15 to 17 year olds has the highest likelihood of being enrolled in private schools, with 79 (52.3% in the age bracket) enrolled. Conversely, the age group of 18 to 19 year olds has the lowest likelihood of being enrolled in a private school, with 54 (100.0% in the age bracket) attending a public institution.
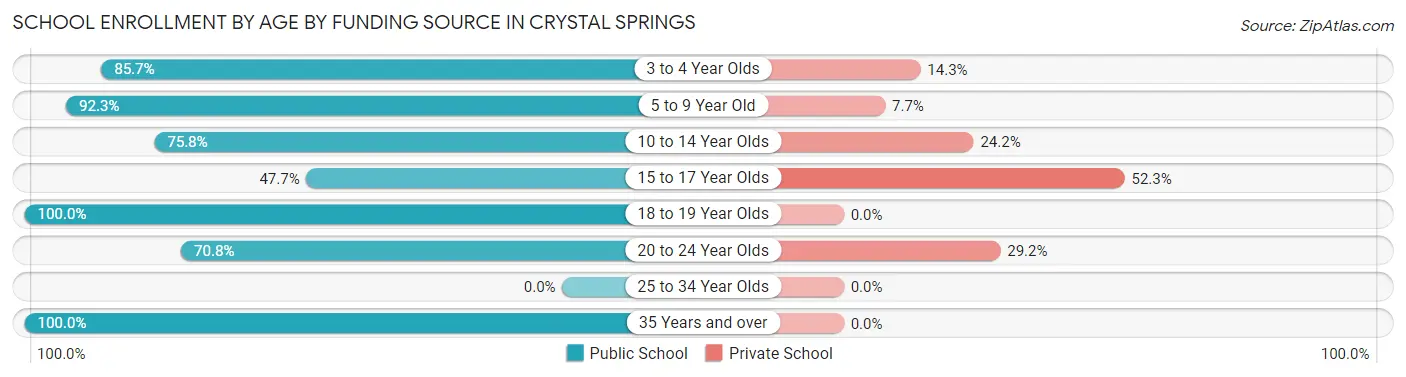
| Age Bracket | Public School | Private School |
| 3 to 4 Year Olds | 102 (85.7%) | 17 (14.3%) |
| 5 to 9 Year Old | 239 (92.3%) | 20 (7.7%) |
| 10 to 14 Year Olds | 207 (75.8%) | 66 (24.2%) |
| 15 to 17 Year Olds | 72 (47.7%) | 79 (52.3%) |
| 18 to 19 Year Olds | 54 (100.0%) | 0 (0.0%) |
| 20 to 24 Year Olds | 68 (70.8%) | 28 (29.2%) |
| 25 to 34 Year Olds | 0 (0.0%) | 0 (0.0%) |
| 35 Years and over | 9 (100.0%) | 0 (0.0%) |
| Total | 751 (78.1%) | 210 (21.9%) |
Educational Attainment by Field of Study in Crystal Springs
Science & technology (254 | 27.6%), liberal arts & history (164 | 17.8%), bio, nature & agricultural (126 | 13.7%), education (103 | 11.2%), and computers & mathematics (94 | 10.2%) are the most common fields of study among 922 individuals in Crystal Springs who have obtained a bachelor's degree or higher.
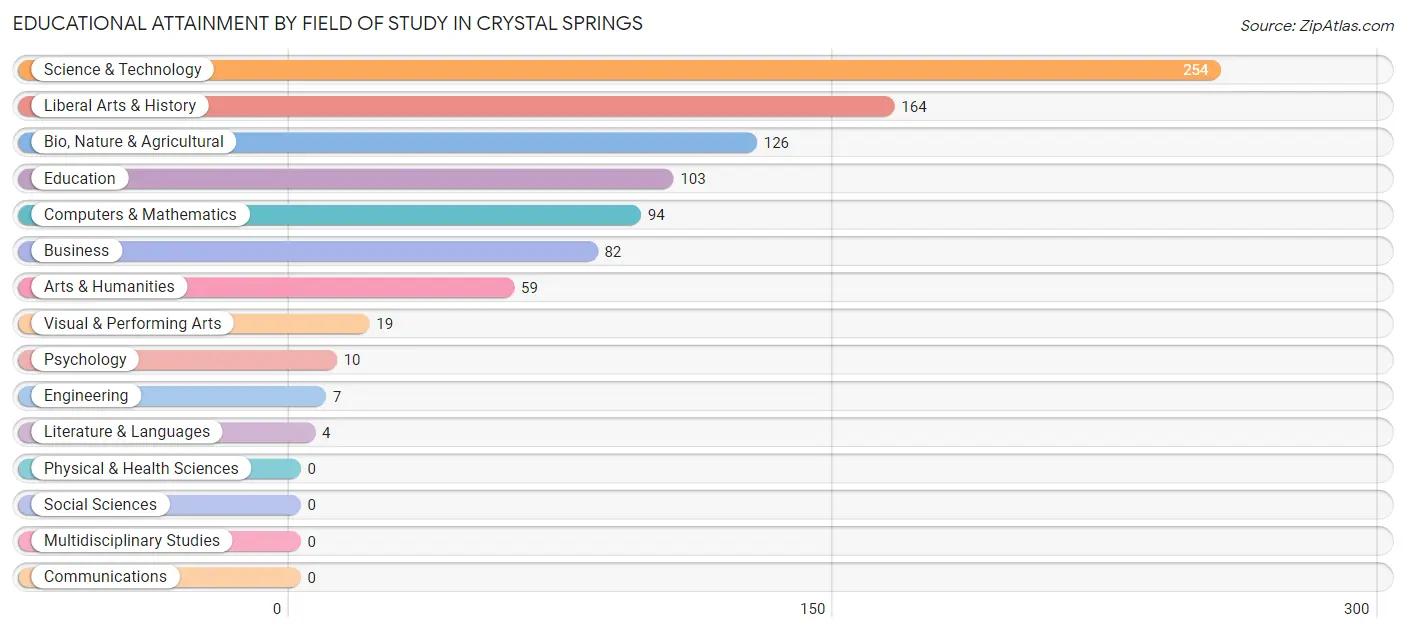
| Field of Study | # Graduates | % Graduates |
| Computers & Mathematics | 94 | 10.2% |
| Bio, Nature & Agricultural | 126 | 13.7% |
| Physical & Health Sciences | 0 | 0.0% |
| Psychology | 10 | 1.1% |
| Social Sciences | 0 | 0.0% |
| Engineering | 7 | 0.8% |
| Multidisciplinary Studies | 0 | 0.0% |
| Science & Technology | 254 | 27.6% |
| Business | 82 | 8.9% |
| Education | 103 | 11.2% |
| Literature & Languages | 4 | 0.4% |
| Liberal Arts & History | 164 | 17.8% |
| Visual & Performing Arts | 19 | 2.1% |
| Communications | 0 | 0.0% |
| Arts & Humanities | 59 | 6.4% |
| Total | 922 | 100.0% |
Transportation & Commute in Crystal Springs
Vehicle Availability by Sex in Crystal Springs
The most prevalent vehicle ownership categories in Crystal Springs are males with 2 vehicles (410, accounting for 44.4%) and females with 2 vehicles (412, making up 50.3%).
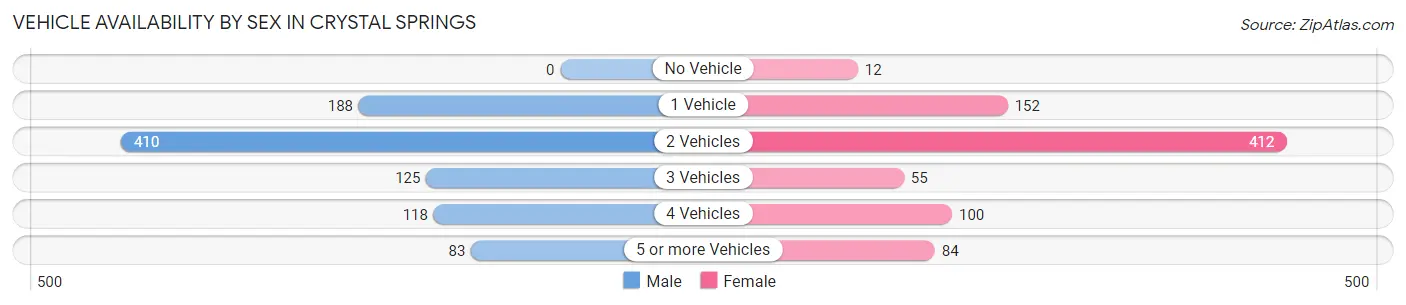
| Vehicles Available | Male | Female |
| No Vehicle | 0 (0.0%) | 12 (1.5%) |
| 1 Vehicle | 188 (20.3%) | 152 (18.6%) |
| 2 Vehicles | 410 (44.4%) | 412 (50.5%) |
| 3 Vehicles | 125 (13.5%) | 55 (6.8%) |
| 4 Vehicles | 118 (12.8%) | 100 (12.3%) |
| 5 or more Vehicles | 83 (9.0%) | 84 (10.3%) |
| Total | 924 (100.0%) | 815 (100.0%) |
Commute Time in Crystal Springs
The most frequently occuring commute durations in Crystal Springs are 15 to 19 minutes (312 commuters, 18.3%), 45 to 59 minutes (312 commuters, 18.3%), and 40 to 44 minutes (263 commuters, 15.4%).
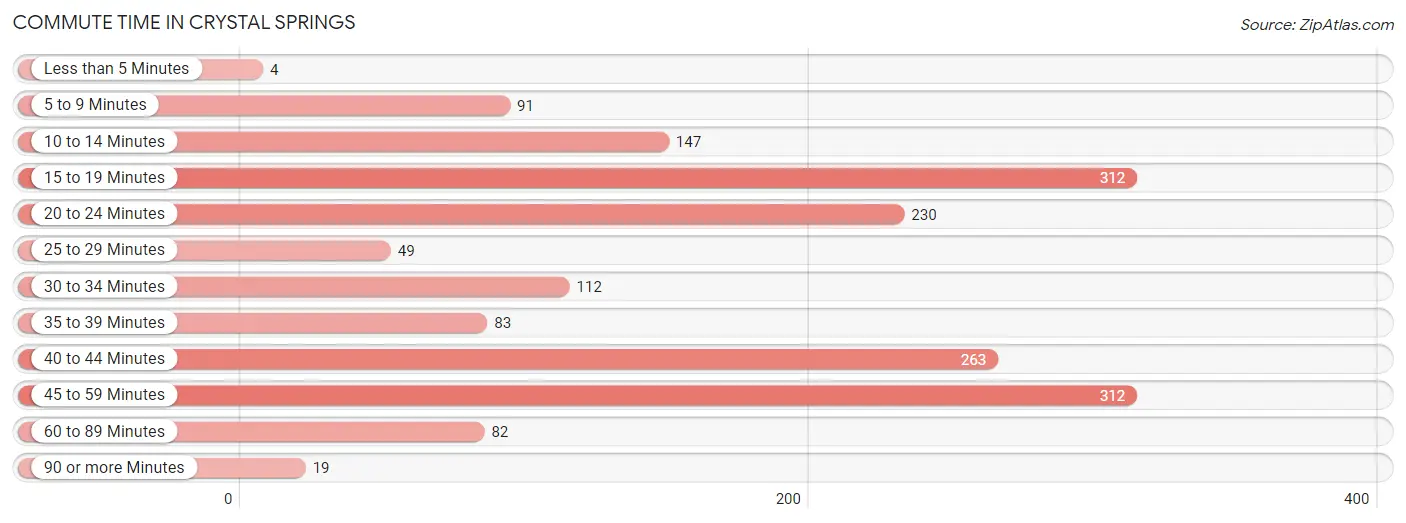
| Commute Time | # Commuters | % Commuters |
| Less than 5 Minutes | 4 | 0.2% |
| 5 to 9 Minutes | 91 | 5.3% |
| 10 to 14 Minutes | 147 | 8.6% |
| 15 to 19 Minutes | 312 | 18.3% |
| 20 to 24 Minutes | 230 | 13.5% |
| 25 to 29 Minutes | 49 | 2.9% |
| 30 to 34 Minutes | 112 | 6.6% |
| 35 to 39 Minutes | 83 | 4.9% |
| 40 to 44 Minutes | 263 | 15.4% |
| 45 to 59 Minutes | 312 | 18.3% |
| 60 to 89 Minutes | 82 | 4.8% |
| 90 or more Minutes | 19 | 1.1% |
Commute Time by Sex in Crystal Springs
The most common commute times in Crystal Springs are 40 to 44 minutes (178 commuters, 19.6%) for males and 15 to 19 minutes (224 commuters, 28.1%) for females.
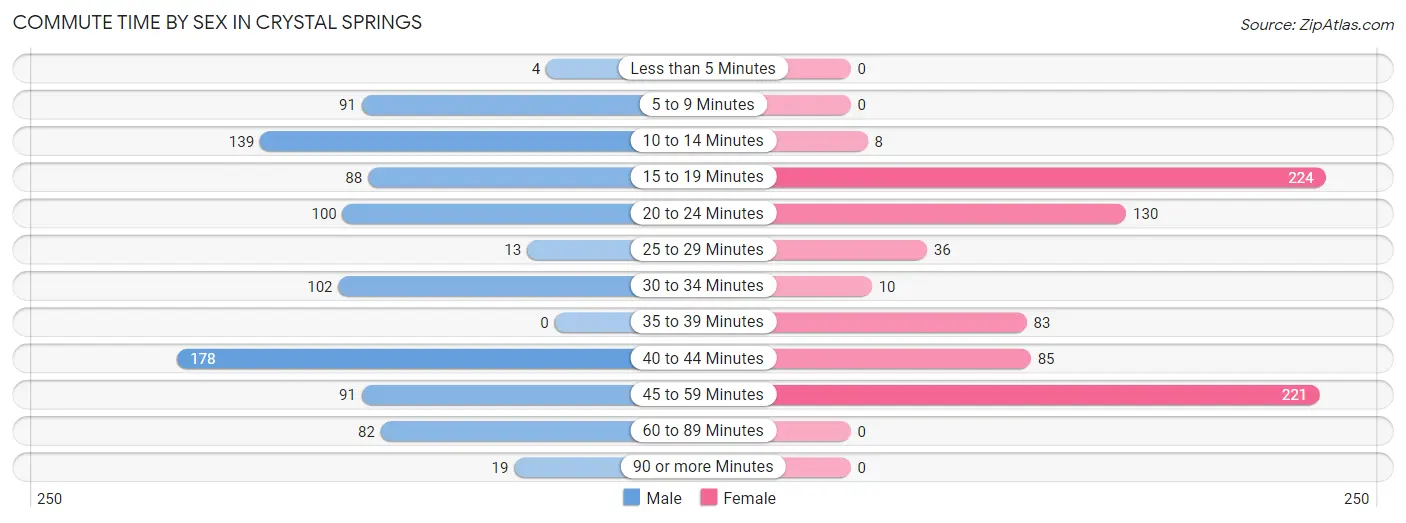
| Commute Time | Male | Female |
| Less than 5 Minutes | 4 (0.4%) | 0 (0.0%) |
| 5 to 9 Minutes | 91 (10.0%) | 0 (0.0%) |
| 10 to 14 Minutes | 139 (15.3%) | 8 (1.0%) |
| 15 to 19 Minutes | 88 (9.7%) | 224 (28.1%) |
| 20 to 24 Minutes | 100 (11.0%) | 130 (16.3%) |
| 25 to 29 Minutes | 13 (1.4%) | 36 (4.5%) |
| 30 to 34 Minutes | 102 (11.3%) | 10 (1.3%) |
| 35 to 39 Minutes | 0 (0.0%) | 83 (10.4%) |
| 40 to 44 Minutes | 178 (19.6%) | 85 (10.7%) |
| 45 to 59 Minutes | 91 (10.0%) | 221 (27.7%) |
| 60 to 89 Minutes | 82 (9.0%) | 0 (0.0%) |
| 90 or more Minutes | 19 (2.1%) | 0 (0.0%) |
Time of Departure to Work by Sex in Crystal Springs
The most frequent times of departure to work in Crystal Springs are 7:00 AM to 7:29 AM (292, 32.2%) for males and 6:30 AM to 6:59 AM (193, 24.2%) for females.
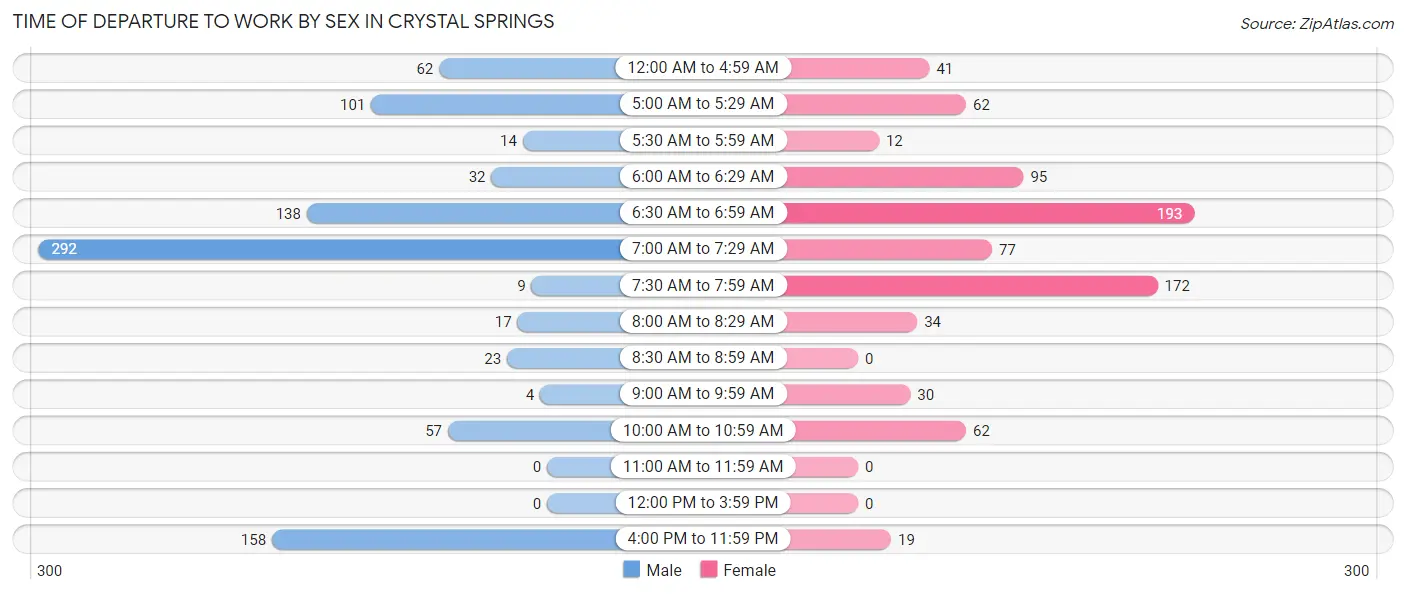
| Time of Departure | Male | Female |
| 12:00 AM to 4:59 AM | 62 (6.8%) | 41 (5.1%) |
| 5:00 AM to 5:29 AM | 101 (11.1%) | 62 (7.8%) |
| 5:30 AM to 5:59 AM | 14 (1.5%) | 12 (1.5%) |
| 6:00 AM to 6:29 AM | 32 (3.5%) | 95 (11.9%) |
| 6:30 AM to 6:59 AM | 138 (15.2%) | 193 (24.2%) |
| 7:00 AM to 7:29 AM | 292 (32.2%) | 77 (9.7%) |
| 7:30 AM to 7:59 AM | 9 (1.0%) | 172 (21.6%) |
| 8:00 AM to 8:29 AM | 17 (1.9%) | 34 (4.3%) |
| 8:30 AM to 8:59 AM | 23 (2.5%) | 0 (0.0%) |
| 9:00 AM to 9:59 AM | 4 (0.4%) | 30 (3.8%) |
| 10:00 AM to 10:59 AM | 57 (6.3%) | 62 (7.8%) |
| 11:00 AM to 11:59 AM | 0 (0.0%) | 0 (0.0%) |
| 12:00 PM to 3:59 PM | 0 (0.0%) | 0 (0.0%) |
| 4:00 PM to 11:59 PM | 158 (17.4%) | 19 (2.4%) |
| Total | 907 (100.0%) | 797 (100.0%) |
Housing Occupancy in Crystal Springs
Occupancy by Ownership in Crystal Springs
Of the total 1,737 dwellings in Crystal Springs, owner-occupied units account for 1,217 (70.1%), while renter-occupied units make up 520 (29.9%).
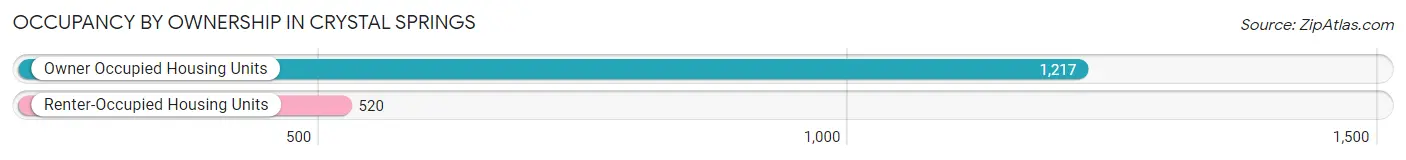
| Occupancy | # Housing Units | % Housing Units |
| Owner Occupied Housing Units | 1,217 | 70.1% |
| Renter-Occupied Housing Units | 520 | 29.9% |
| Total Occupied Housing Units | 1,737 | 100.0% |
Occupancy by Household Size in Crystal Springs
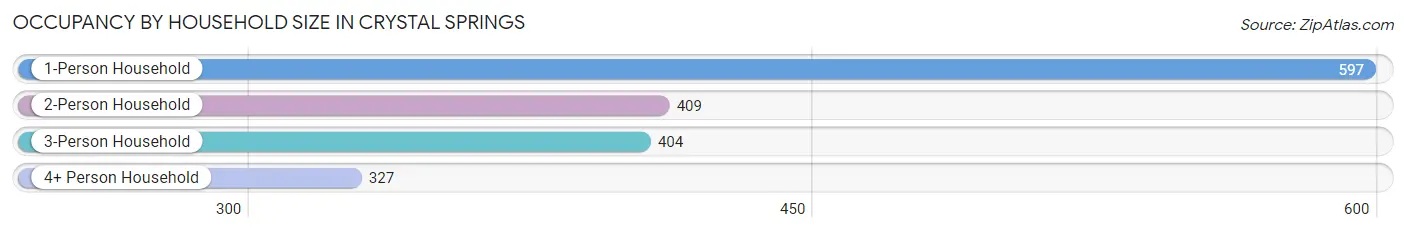
| Household Size | # Housing Units | % Housing Units |
| 1-Person Household | 597 | 34.4% |
| 2-Person Household | 409 | 23.5% |
| 3-Person Household | 404 | 23.3% |
| 4+ Person Household | 327 | 18.8% |
| Total Housing Units | 1,737 | 100.0% |
Occupancy by Ownership by Household Size in Crystal Springs
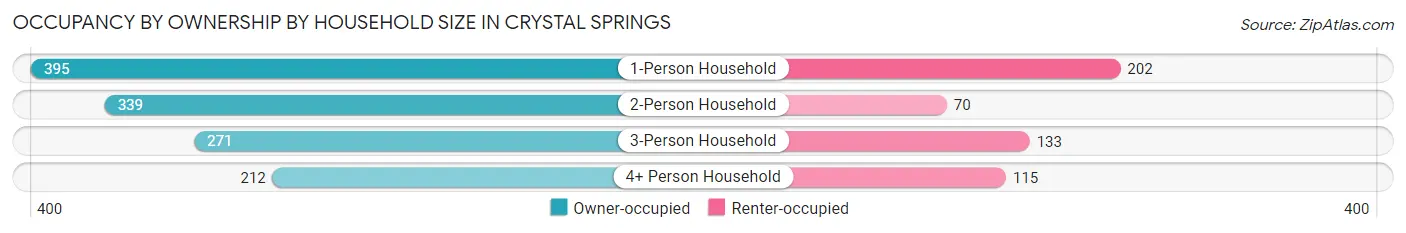
| Household Size | Owner-occupied | Renter-occupied |
| 1-Person Household | 395 (66.2%) | 202 (33.8%) |
| 2-Person Household | 339 (82.9%) | 70 (17.1%) |
| 3-Person Household | 271 (67.1%) | 133 (32.9%) |
| 4+ Person Household | 212 (64.8%) | 115 (35.2%) |
| Total Housing Units | 1,217 (70.1%) | 520 (29.9%) |
Occupancy by Educational Attainment in Crystal Springs
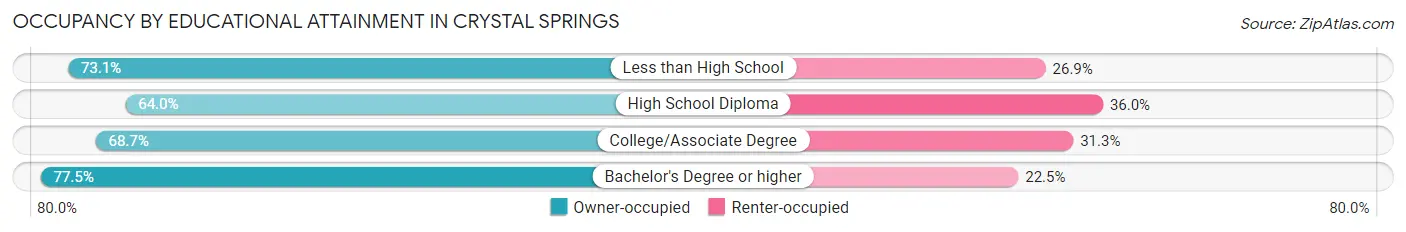
| Household Size | Owner-occupied | Renter-occupied |
| Less than High School | 253 (73.1%) | 93 (26.9%) |
| High School Diploma | 267 (64.0%) | 150 (36.0%) |
| College/Associate Degree | 453 (68.7%) | 206 (31.3%) |
| Bachelor's Degree or higher | 244 (77.5%) | 71 (22.5%) |
Occupancy by Age of Householder in Crystal Springs
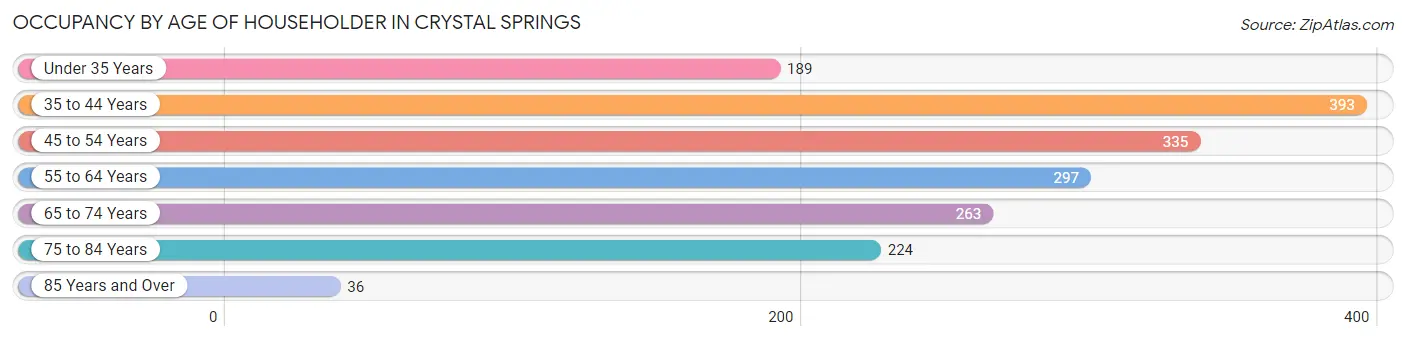
| Age Bracket | # Households | % Households |
| Under 35 Years | 189 | 10.9% |
| 35 to 44 Years | 393 | 22.6% |
| 45 to 54 Years | 335 | 19.3% |
| 55 to 64 Years | 297 | 17.1% |
| 65 to 74 Years | 263 | 15.1% |
| 75 to 84 Years | 224 | 12.9% |
| 85 Years and Over | 36 | 2.1% |
| Total | 1,737 | 100.0% |
Housing Finances in Crystal Springs
Median Income by Occupancy in Crystal Springs
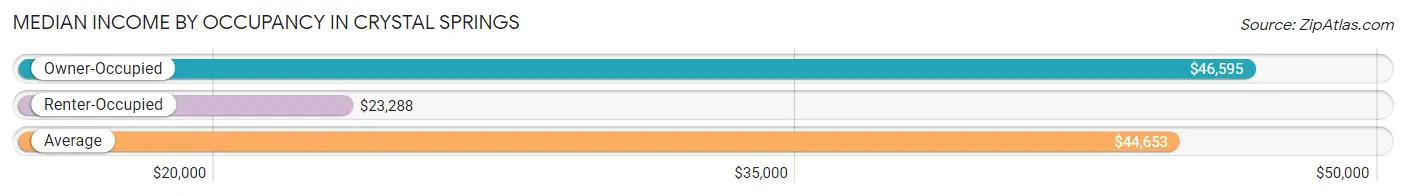
| Occupancy Type | # Households | Median Income |
| Owner-Occupied | 1,217 (70.1%) | $46,595 |
| Renter-Occupied | 520 (29.9%) | $23,288 |
| Average | 1,737 (100.0%) | $44,653 |
Occupancy by Householder Income Bracket in Crystal Springs
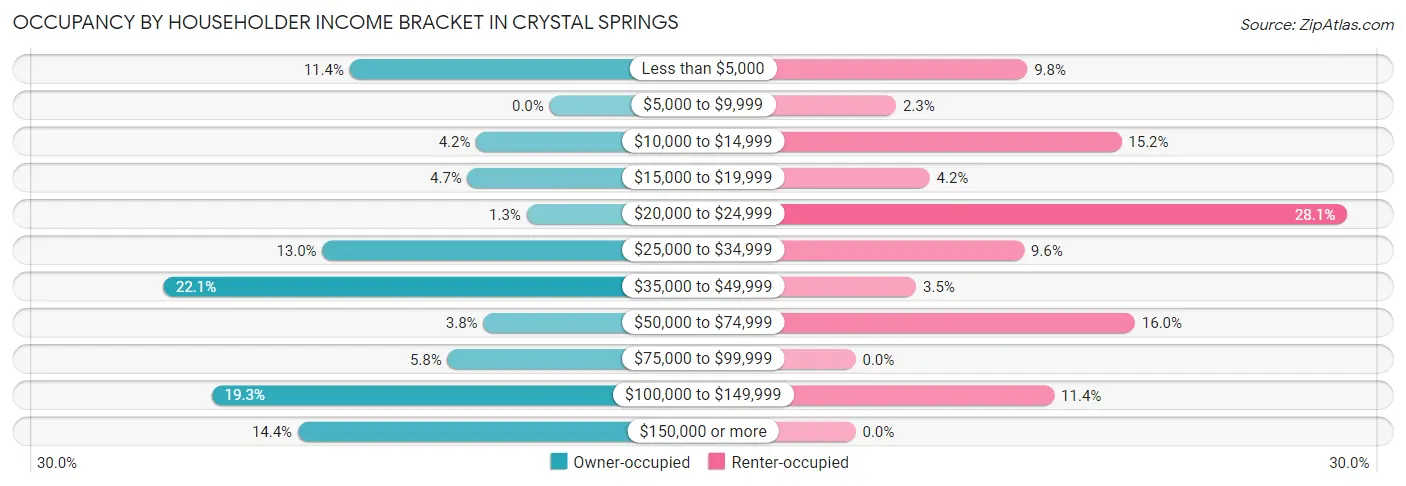
| Income Bracket | Owner-occupied | Renter-occupied |
| Less than $5,000 | 139 (11.4%) | 51 (9.8%) |
| $5,000 to $9,999 | 0 (0.0%) | 12 (2.3%) |
| $10,000 to $14,999 | 51 (4.2%) | 79 (15.2%) |
| $15,000 to $19,999 | 57 (4.7%) | 22 (4.2%) |
| $20,000 to $24,999 | 16 (1.3%) | 146 (28.1%) |
| $25,000 to $34,999 | 158 (13.0%) | 50 (9.6%) |
| $35,000 to $49,999 | 269 (22.1%) | 18 (3.5%) |
| $50,000 to $74,999 | 46 (3.8%) | 83 (16.0%) |
| $75,000 to $99,999 | 71 (5.8%) | 0 (0.0%) |
| $100,000 to $149,999 | 235 (19.3%) | 59 (11.4%) |
| $150,000 or more | 175 (14.4%) | 0 (0.0%) |
| Total | 1,217 (100.0%) | 520 (100.0%) |
Monthly Housing Cost Tiers in Crystal Springs
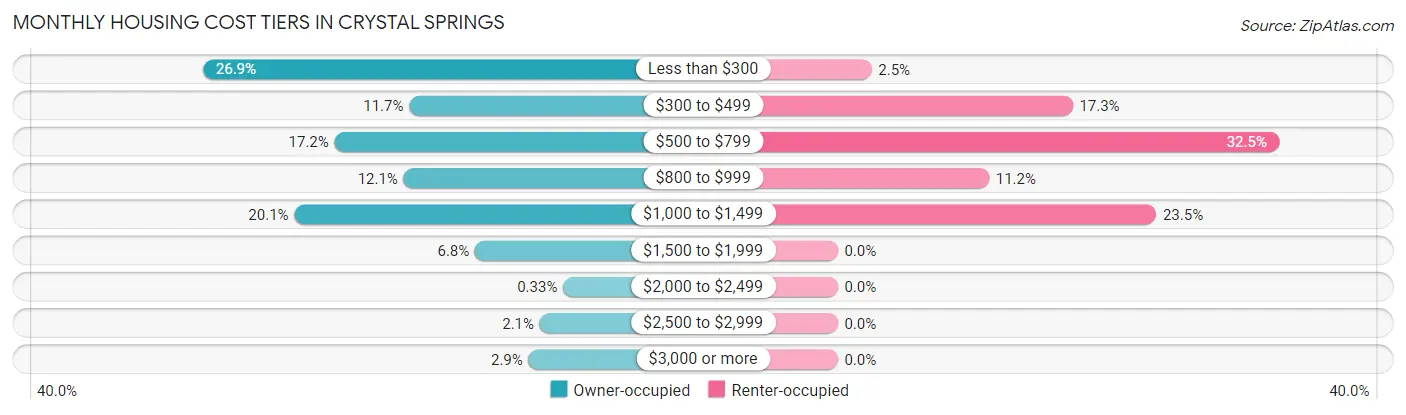
| Monthly Cost | Owner-occupied | Renter-occupied |
| Less than $300 | 327 (26.9%) | 13 (2.5%) |
| $300 to $499 | 142 (11.7%) | 90 (17.3%) |
| $500 to $799 | 209 (17.2%) | 169 (32.5%) |
| $800 to $999 | 147 (12.1%) | 58 (11.2%) |
| $1,000 to $1,499 | 245 (20.1%) | 122 (23.5%) |
| $1,500 to $1,999 | 83 (6.8%) | 0 (0.0%) |
| $2,000 to $2,499 | 4 (0.3%) | 0 (0.0%) |
| $2,500 to $2,999 | 25 (2.1%) | 0 (0.0%) |
| $3,000 or more | 35 (2.9%) | 0 (0.0%) |
| Total | 1,217 (100.0%) | 520 (100.0%) |
Physical Housing Characteristics in Crystal Springs
Housing Structures in Crystal Springs
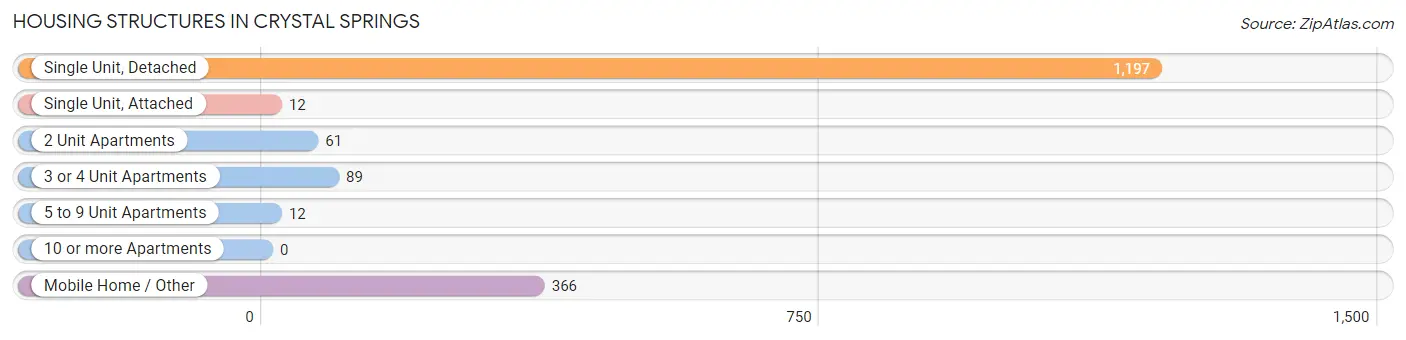
| Structure Type | # Housing Units | % Housing Units |
| Single Unit, Detached | 1,197 | 68.9% |
| Single Unit, Attached | 12 | 0.7% |
| 2 Unit Apartments | 61 | 3.5% |
| 3 or 4 Unit Apartments | 89 | 5.1% |
| 5 to 9 Unit Apartments | 12 | 0.7% |
| 10 or more Apartments | 0 | 0.0% |
| Mobile Home / Other | 366 | 21.1% |
| Total | 1,737 | 100.0% |
Housing Structures by Occupancy in Crystal Springs
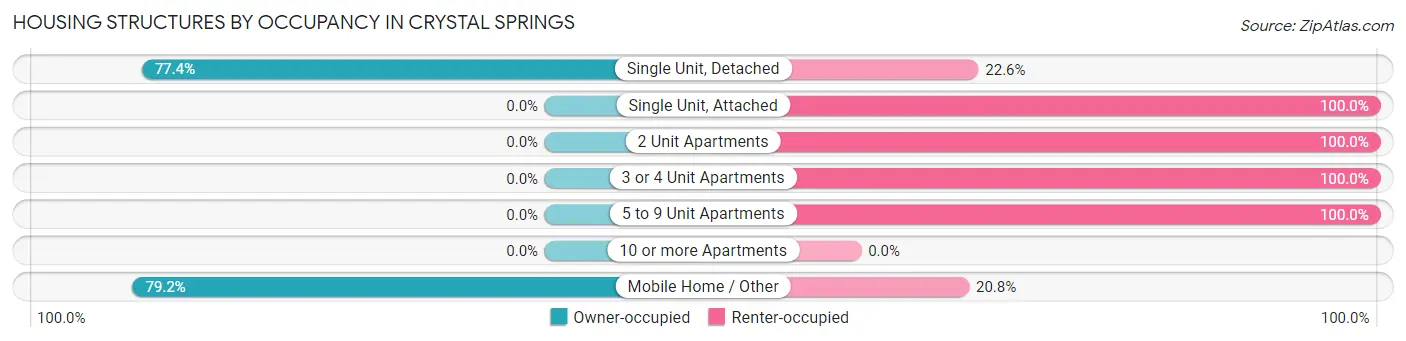
| Structure Type | Owner-occupied | Renter-occupied |
| Single Unit, Detached | 927 (77.4%) | 270 (22.6%) |
| Single Unit, Attached | 0 (0.0%) | 12 (100.0%) |
| 2 Unit Apartments | 0 (0.0%) | 61 (100.0%) |
| 3 or 4 Unit Apartments | 0 (0.0%) | 89 (100.0%) |
| 5 to 9 Unit Apartments | 0 (0.0%) | 12 (100.0%) |
| 10 or more Apartments | 0 (0.0%) | 0 (0.0%) |
| Mobile Home / Other | 290 (79.2%) | 76 (20.8%) |
| Total | 1,217 (70.1%) | 520 (29.9%) |
Housing Structures by Number of Rooms in Crystal Springs
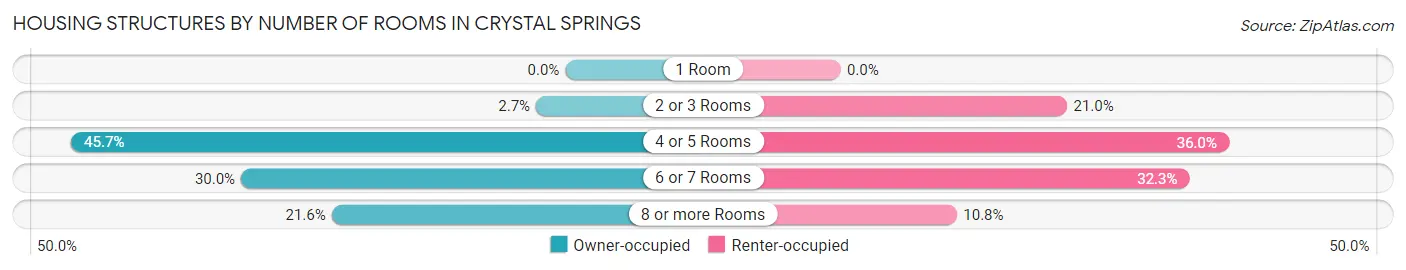
| Number of Rooms | Owner-occupied | Renter-occupied |
| 1 Room | 0 (0.0%) | 0 (0.0%) |
| 2 or 3 Rooms | 33 (2.7%) | 109 (21.0%) |
| 4 or 5 Rooms | 556 (45.7%) | 187 (36.0%) |
| 6 or 7 Rooms | 365 (30.0%) | 168 (32.3%) |
| 8 or more Rooms | 263 (21.6%) | 56 (10.8%) |
| Total | 1,217 (100.0%) | 520 (100.0%) |
Housing Structure by Heating Type in Crystal Springs
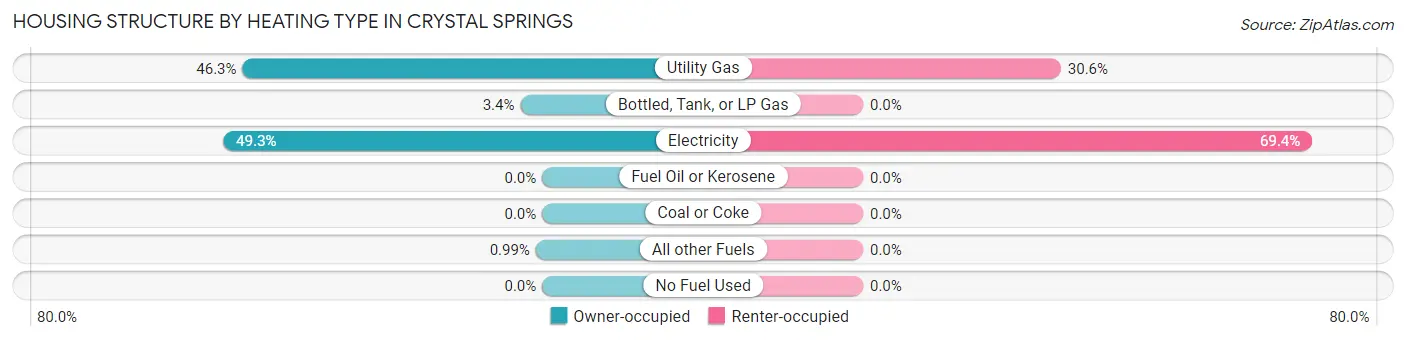
| Heating Type | Owner-occupied | Renter-occupied |
| Utility Gas | 564 (46.3%) | 159 (30.6%) |
| Bottled, Tank, or LP Gas | 41 (3.4%) | 0 (0.0%) |
| Electricity | 600 (49.3%) | 361 (69.4%) |
| Fuel Oil or Kerosene | 0 (0.0%) | 0 (0.0%) |
| Coal or Coke | 0 (0.0%) | 0 (0.0%) |
| All other Fuels | 12 (1.0%) | 0 (0.0%) |
| No Fuel Used | 0 (0.0%) | 0 (0.0%) |
| Total | 1,217 (100.0%) | 520 (100.0%) |
Household Vehicle Usage in Crystal Springs
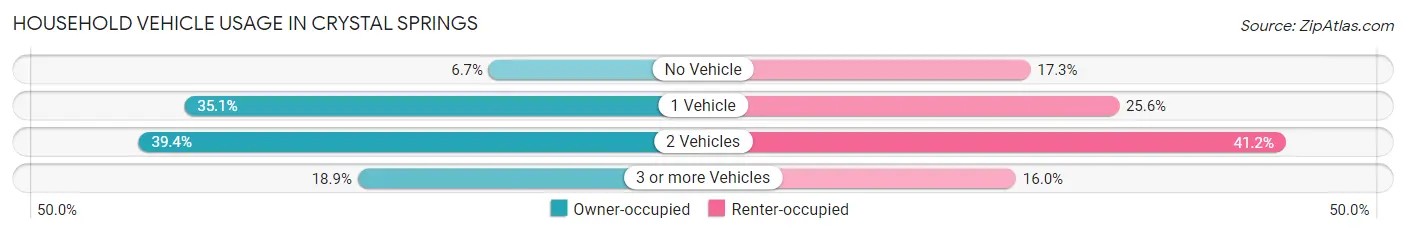
| Vehicles per Household | Owner-occupied | Renter-occupied |
| No Vehicle | 81 (6.7%) | 90 (17.3%) |
| 1 Vehicle | 427 (35.1%) | 133 (25.6%) |
| 2 Vehicles | 479 (39.4%) | 214 (41.1%) |
| 3 or more Vehicles | 230 (18.9%) | 83 (16.0%) |
| Total | 1,217 (100.0%) | 520 (100.0%) |
Real Estate & Mortgages in Crystal Springs
Real Estate and Mortgage Overview in Crystal Springs
| Characteristic | Without Mortgage | With Mortgage |
| Housing Units | 583 | 634 |
| Median Property Value | $57,600 | $94,300 |
| Median Household Income | $45,374 | $140 |
| Monthly Housing Costs | $290 | $35 |
| Real Estate Taxes | $389 | $127 |
Property Value by Mortgage Status in Crystal Springs
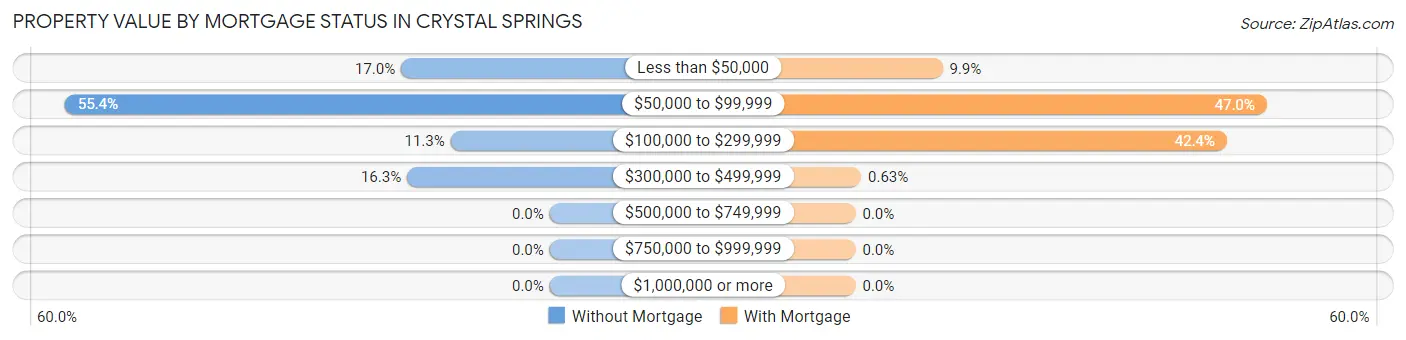
| Property Value | Without Mortgage | With Mortgage |
| Less than $50,000 | 99 (17.0%) | 63 (9.9%) |
| $50,000 to $99,999 | 323 (55.4%) | 298 (47.0%) |
| $100,000 to $299,999 | 66 (11.3%) | 269 (42.4%) |
| $300,000 to $499,999 | 95 (16.3%) | 4 (0.6%) |
| $500,000 to $749,999 | 0 (0.0%) | 0 (0.0%) |
| $750,000 to $999,999 | 0 (0.0%) | 0 (0.0%) |
| $1,000,000 or more | 0 (0.0%) | 0 (0.0%) |
| Total | 583 (100.0%) | 634 (100.0%) |
Household Income by Mortgage Status in Crystal Springs
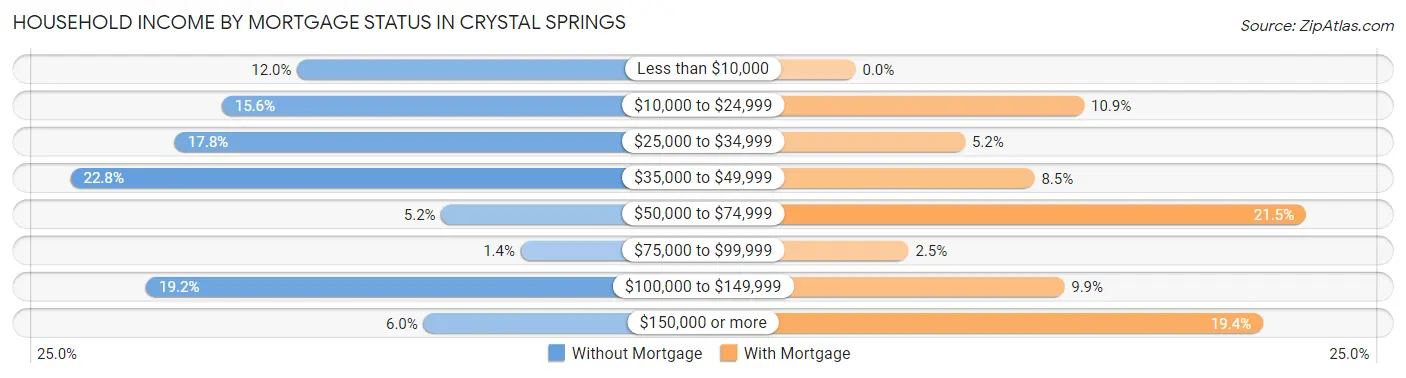
| Household Income | Without Mortgage | With Mortgage |
| Less than $10,000 | 70 (12.0%) | 0 (0.0%) |
| $10,000 to $24,999 | 91 (15.6%) | 69 (10.9%) |
| $25,000 to $34,999 | 104 (17.8%) | 33 (5.2%) |
| $35,000 to $49,999 | 133 (22.8%) | 54 (8.5%) |
| $50,000 to $74,999 | 30 (5.1%) | 136 (21.4%) |
| $75,000 to $99,999 | 8 (1.4%) | 16 (2.5%) |
| $100,000 to $149,999 | 112 (19.2%) | 63 (9.9%) |
| $150,000 or more | 35 (6.0%) | 123 (19.4%) |
| Total | 583 (100.0%) | 634 (100.0%) |
Property Value to Household Income Ratio in Crystal Springs
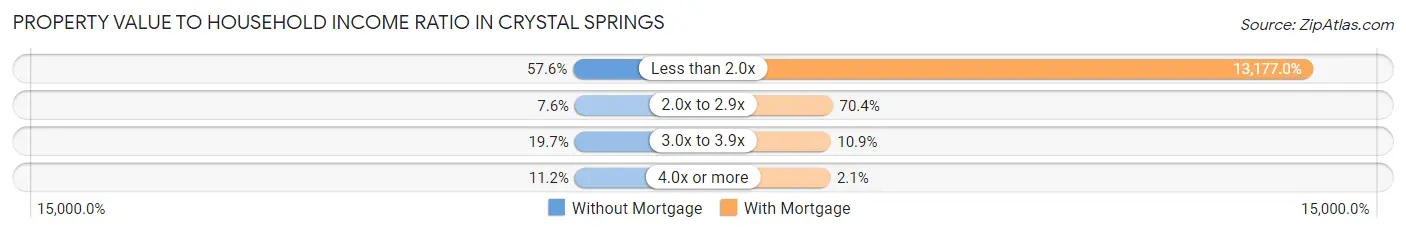
| Value-to-Income Ratio | Without Mortgage | With Mortgage |
| Less than 2.0x | 336 (57.6%) | 83,542 (13,177.0%) |
| 2.0x to 2.9x | 44 (7.5%) | 446 (70.4%) |
| 3.0x to 3.9x | 115 (19.7%) | 69 (10.9%) |
| 4.0x or more | 65 (11.2%) | 13 (2.1%) |
| Total | 583 (100.0%) | 634 (100.0%) |
Real Estate Taxes by Mortgage Status in Crystal Springs
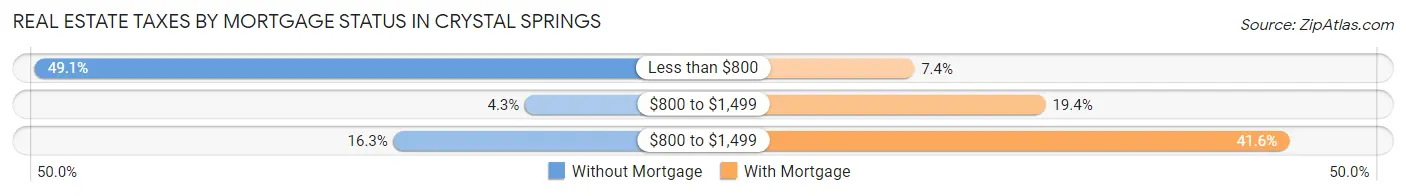
| Property Taxes | Without Mortgage | With Mortgage |
| Less than $800 | 286 (49.1%) | 47 (7.4%) |
| $800 to $1,499 | 25 (4.3%) | 123 (19.4%) |
| $800 to $1,499 | 95 (16.3%) | 264 (41.6%) |
| Total | 583 (100.0%) | 634 (100.0%) |
Health & Disability in Crystal Springs
Health Insurance Coverage by Age in Crystal Springs
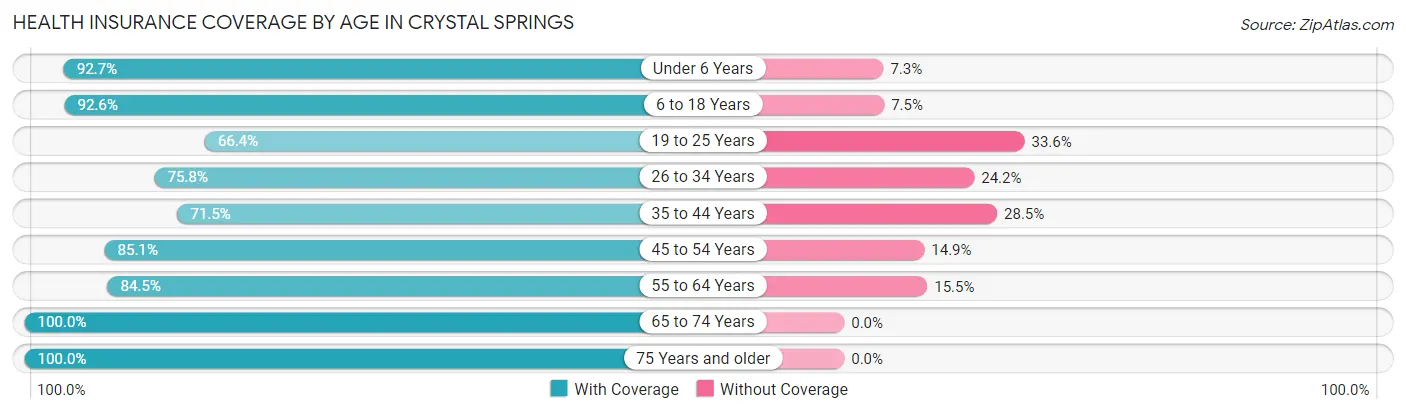
| Age Bracket | With Coverage | Without Coverage |
| Under 6 Years | 431 (92.7%) | 34 (7.3%) |
| 6 to 18 Years | 634 (92.5%) | 51 (7.4%) |
| 19 to 25 Years | 154 (66.4%) | 78 (33.6%) |
| 26 to 34 Years | 300 (75.8%) | 96 (24.2%) |
| 35 to 44 Years | 429 (71.5%) | 171 (28.5%) |
| 45 to 54 Years | 695 (85.1%) | 122 (14.9%) |
| 55 to 64 Years | 557 (84.5%) | 102 (15.5%) |
| 65 to 74 Years | 511 (100.0%) | 0 (0.0%) |
| 75 Years and older | 385 (100.0%) | 0 (0.0%) |
| Total | 4,096 (86.2%) | 654 (13.8%) |
Health Insurance Coverage by Citizenship Status in Crystal Springs
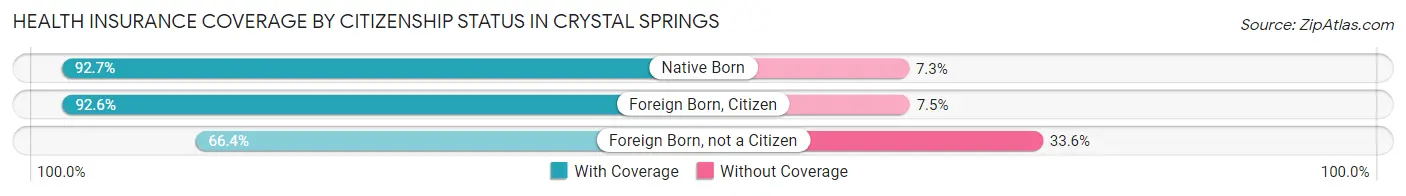
| Citizenship Status | With Coverage | Without Coverage |
| Native Born | 431 (92.7%) | 34 (7.3%) |
| Foreign Born, Citizen | 634 (92.5%) | 51 (7.4%) |
| Foreign Born, not a Citizen | 154 (66.4%) | 78 (33.6%) |
Health Insurance Coverage by Household Income in Crystal Springs
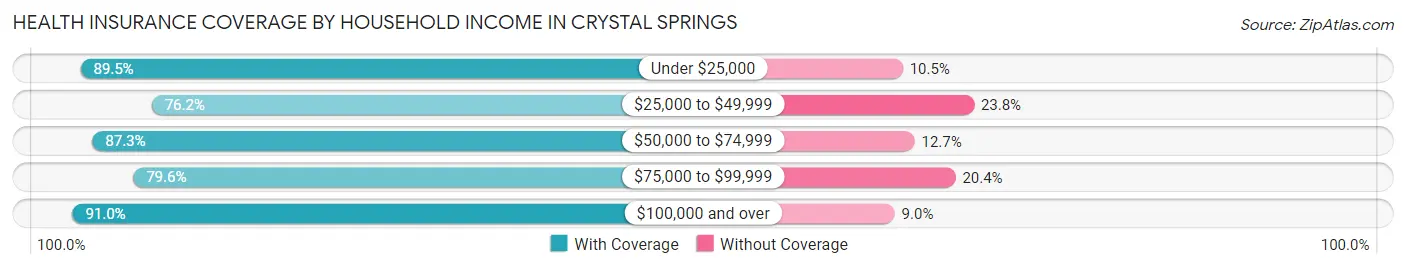
| Household Income | With Coverage | Without Coverage |
| Under $25,000 | 1,154 (89.5%) | 135 (10.5%) |
| $25,000 to $49,999 | 838 (76.2%) | 262 (23.8%) |
| $50,000 to $74,999 | 330 (87.3%) | 48 (12.7%) |
| $75,000 to $99,999 | 219 (79.6%) | 56 (20.4%) |
| $100,000 and over | 1,553 (91.0%) | 153 (9.0%) |
Public vs Private Health Insurance Coverage by Age in Crystal Springs
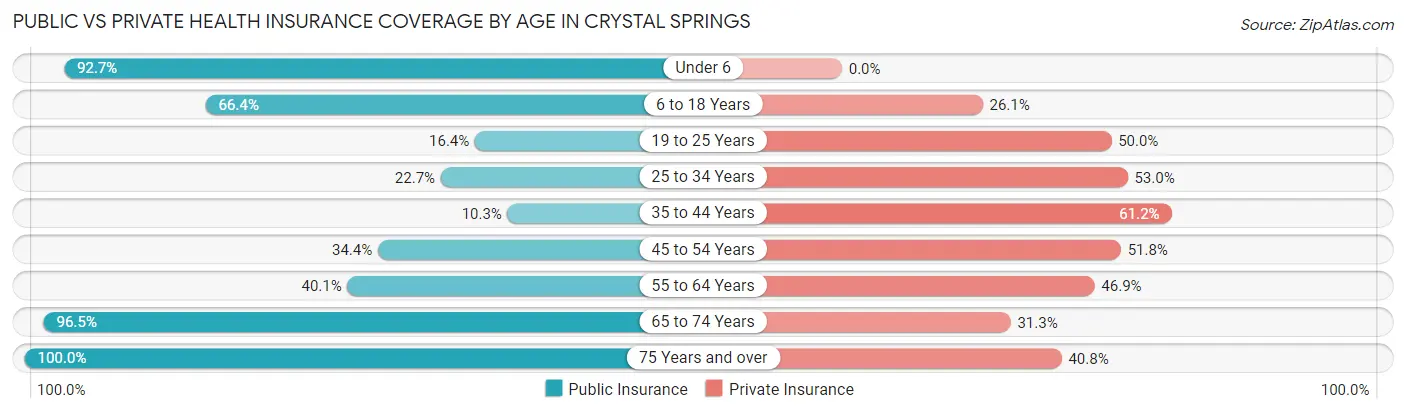
| Age Bracket | Public Insurance | Private Insurance |
| Under 6 | 431 (92.7%) | 0 (0.0%) |
| 6 to 18 Years | 455 (66.4%) | 179 (26.1%) |
| 19 to 25 Years | 38 (16.4%) | 116 (50.0%) |
| 25 to 34 Years | 90 (22.7%) | 210 (53.0%) |
| 35 to 44 Years | 62 (10.3%) | 367 (61.2%) |
| 45 to 54 Years | 281 (34.4%) | 423 (51.8%) |
| 55 to 64 Years | 264 (40.1%) | 309 (46.9%) |
| 65 to 74 Years | 493 (96.5%) | 160 (31.3%) |
| 75 Years and over | 385 (100.0%) | 157 (40.8%) |
| Total | 2,499 (52.6%) | 1,921 (40.4%) |
Disability Status by Sex by Age in Crystal Springs
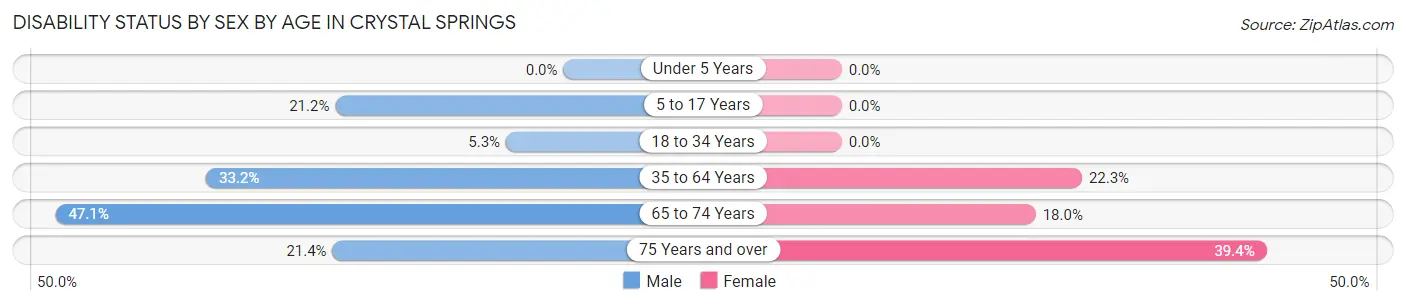
| Age Bracket | Male | Female |
| Under 5 Years | 0 (0.0%) | 0 (0.0%) |
| 5 to 17 Years | 65 (21.2%) | 0 (0.0%) |
| 18 to 34 Years | 18 (5.3%) | 0 (0.0%) |
| 35 to 64 Years | 379 (33.2%) | 208 (22.3%) |
| 65 to 74 Years | 123 (47.1%) | 45 (18.0%) |
| 75 Years and over | 39 (21.4%) | 80 (39.4%) |
Disability Class by Sex by Age in Crystal Springs
Disability Class: Hearing Difficulty
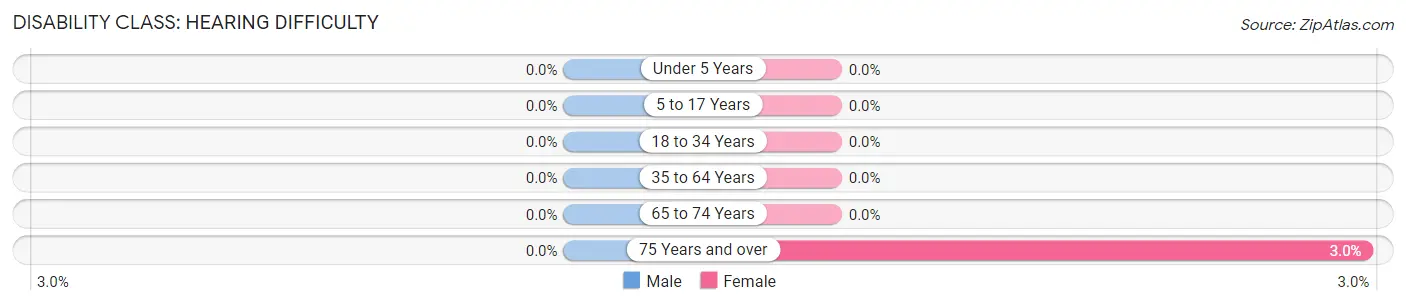
| Age Bracket | Male | Female |
| Under 5 Years | 0 (0.0%) | 0 (0.0%) |
| 5 to 17 Years | 0 (0.0%) | 0 (0.0%) |
| 18 to 34 Years | 0 (0.0%) | 0 (0.0%) |
| 35 to 64 Years | 0 (0.0%) | 0 (0.0%) |
| 65 to 74 Years | 0 (0.0%) | 0 (0.0%) |
| 75 Years and over | 0 (0.0%) | 6 (3.0%) |
Disability Class: Vision Difficulty
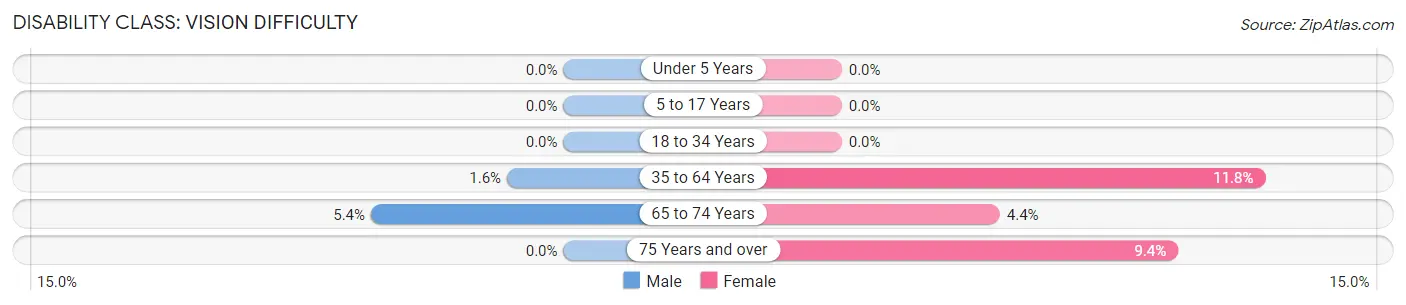
| Age Bracket | Male | Female |
| Under 5 Years | 0 (0.0%) | 0 (0.0%) |
| 5 to 17 Years | 0 (0.0%) | 0 (0.0%) |
| 18 to 34 Years | 0 (0.0%) | 0 (0.0%) |
| 35 to 64 Years | 18 (1.6%) | 110 (11.8%) |
| 65 to 74 Years | 14 (5.4%) | 11 (4.4%) |
| 75 Years and over | 0 (0.0%) | 19 (9.4%) |
Disability Class: Cognitive Difficulty
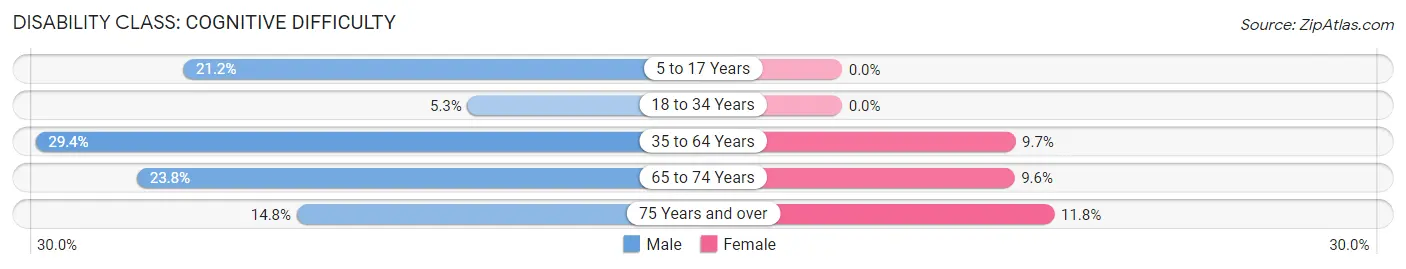
| Age Bracket | Male | Female |
| 5 to 17 Years | 65 (21.2%) | 0 (0.0%) |
| 18 to 34 Years | 18 (5.3%) | 0 (0.0%) |
| 35 to 64 Years | 336 (29.4%) | 90 (9.7%) |
| 65 to 74 Years | 62 (23.7%) | 24 (9.6%) |
| 75 Years and over | 27 (14.8%) | 24 (11.8%) |
Disability Class: Ambulatory Difficulty
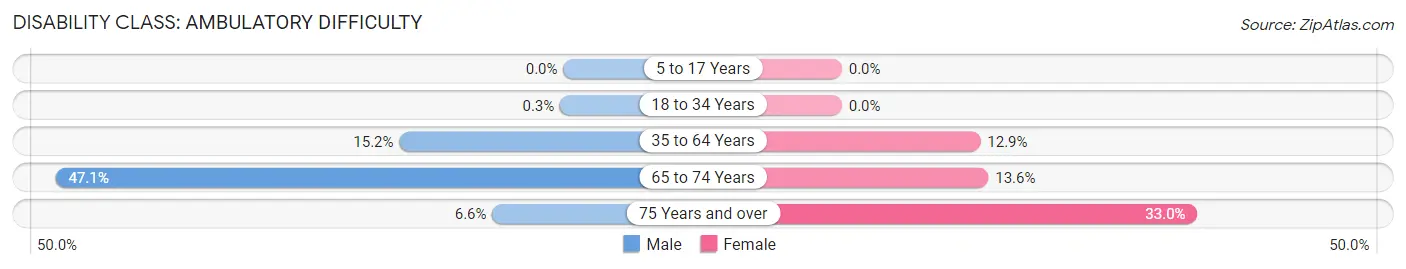
| Age Bracket | Male | Female |
| 5 to 17 Years | 0 (0.0%) | 0 (0.0%) |
| 18 to 34 Years | 1 (0.3%) | 0 (0.0%) |
| 35 to 64 Years | 174 (15.2%) | 120 (12.9%) |
| 65 to 74 Years | 123 (47.1%) | 34 (13.6%) |
| 75 Years and over | 12 (6.6%) | 67 (33.0%) |
Disability Class: Self-Care Difficulty
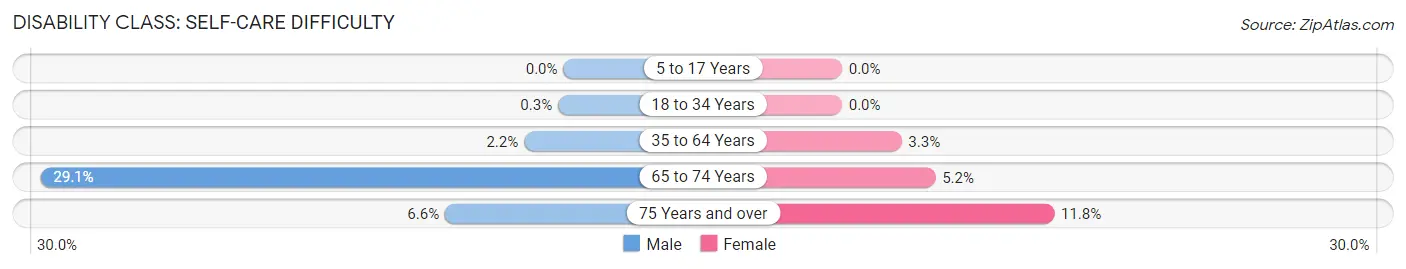
| Age Bracket | Male | Female |
| 5 to 17 Years | 0 (0.0%) | 0 (0.0%) |
| 18 to 34 Years | 1 (0.3%) | 0 (0.0%) |
| 35 to 64 Years | 25 (2.2%) | 31 (3.3%) |
| 65 to 74 Years | 76 (29.1%) | 13 (5.2%) |
| 75 Years and over | 12 (6.6%) | 24 (11.8%) |
Technology Access in Crystal Springs
Computing Device Access in Crystal Springs
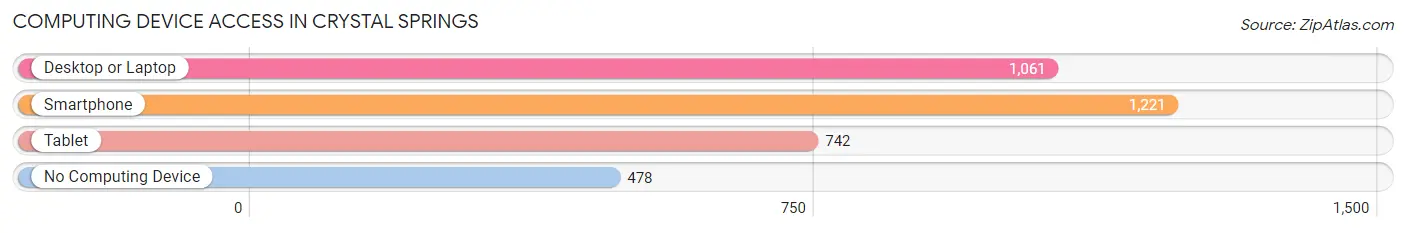
| Device Type | # Households | % Households |
| Desktop or Laptop | 1,061 | 61.1% |
| Smartphone | 1,221 | 70.3% |
| Tablet | 742 | 42.7% |
| No Computing Device | 478 | 27.5% |
| Total | 1,737 | 100.0% |
Internet Access in Crystal Springs
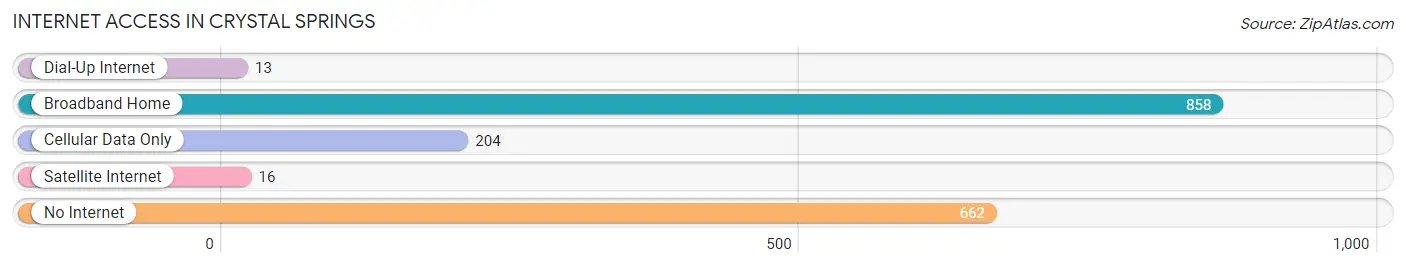
| Internet Type | # Households | % Households |
| Dial-Up Internet | 13 | 0.7% |
| Broadband Home | 858 | 49.4% |
| Cellular Data Only | 204 | 11.7% |
| Satellite Internet | 16 | 0.9% |
| No Internet | 662 | 38.1% |
| Total | 1,737 | 100.0% |
Crystal Springs Summary
Introduction
Crystal Springs is a small town located in Copiah County, Mississippi. It is situated in the southwestern part of the state, about 40 miles south of Jackson, the state capital. The town has a population of approximately 4,000 people and is known for its rich history, diverse geography, and vibrant economy. This paper will provide an overview of the history, geography, economy, and demographics of Crystal Springs in 2000 words.
History
Crystal Springs was founded in 1854 by a group of settlers from Georgia. The town was named after the nearby Crystal Springs, which was a popular destination for travelers and settlers. The town quickly grew and became a center of commerce and industry. In the late 19th century, the town was home to several cotton mills, a railroad, and a variety of other businesses.
The town was also home to a number of prominent citizens, including former Mississippi Governor William F. Winter, who was born in Crystal Springs in 1906. In the early 20th century, the town was a popular destination for tourists, who came to enjoy the natural beauty of the area.
Geography
Crystal Springs is located in the southwestern part of Mississippi, about 40 miles south of Jackson, the state capital. The town is situated in the rolling hills of the Mississippi Delta, and is surrounded by lush forests and farmland. The town is located near the Pearl River, which provides a source of recreation for the residents of Crystal Springs.
The town is also located near several other towns and cities, including Hazlehurst, Brookhaven, and McComb. The town is also close to the Natchez Trace Parkway, which is a scenic route that runs through the state of Mississippi.
Economy
Crystal Springs is a small town with a vibrant economy. The town is home to several businesses, including a variety of retail stores, restaurants, and other services. The town is also home to several manufacturing companies, including a furniture factory and a paper mill.
The town is also home to a number of agricultural businesses, including a dairy farm and a poultry farm. The town is also home to a number of small businesses, including a variety of shops and restaurants.
Demographics
As of the 2010 census, the population of Crystal Springs was 4,039. The town is predominantly white, with a population that is approximately 75% white and 25% African American. The town is also home to a small Hispanic population, which makes up approximately 2% of the population.
The median household income in Crystal Springs is $35,000, which is slightly lower than the state average. The town also has a higher than average poverty rate, with approximately 20% of the population living below the poverty line.
Conclusion
Crystal Springs is a small town located in Copiah County, Mississippi. The town has a rich history, diverse geography, and vibrant economy. The town is predominantly white, with a population that is approximately 75% white and 25% African American. The town is also home to a number of businesses, including a variety of retail stores, restaurants, and other services. The town is also home to several manufacturing companies, including a furniture factory and a paper mill. The median household income in Crystal Springs is $35,000, which is slightly lower than the state average.
Common Questions
What is Per Capita Income in Crystal Springs?
Per Capita income in Crystal Springs is $24,207.
What is the Median Family Income in Crystal Springs?
Median Family Income in Crystal Springs is $54,144.
What is the Median Household income in Crystal Springs?
Median Household Income in Crystal Springs is $44,653.
What is Income or Wage Gap in Crystal Springs?
Income or Wage Gap in Crystal Springs is 13.6%.
Women in Crystal Springs earn 86.4 cents for every dollar earned by a man.
What is Inequality or Gini Index in Crystal Springs?
Inequality or Gini Index in Crystal Springs is 0.50.
What is the Total Population of Crystal Springs?
Total Population of Crystal Springs is 4,820.
What is the Total Male Population of Crystal Springs?
Total Male Population of Crystal Springs is 2,422.
What is the Total Female Population of Crystal Springs?
Total Female Population of Crystal Springs is 2,398.
What is the Ratio of Males per 100 Females in Crystal Springs?
There are 101.00 Males per 100 Females in Crystal Springs.
What is the Ratio of Females per 100 Males in Crystal Springs?
There are 99.01 Females per 100 Males in Crystal Springs.
What is the Median Population Age in Crystal Springs?
Median Population Age in Crystal Springs is 45.3 Years.
What is the Average Family Size in Crystal Springs
Average Family Size in Crystal Springs is 3.7 People.
What is the Average Household Size in Crystal Springs
Average Household Size in Crystal Springs is 2.7 People.
How Large is the Labor Force in Crystal Springs?
There are 1,874 People in the Labor Forcein in Crystal Springs.
What is the Percentage of People in the Labor Force in Crystal Springs?
49.4% of People are in the Labor Force in Crystal Springs.
What is the Unemployment Rate in Crystal Springs?
Unemployment Rate in Crystal Springs is 4.9%.