Raymond, MS Map & Demographics
Raymond Map
Raymond Overview
$13,632
PER CAPITA INCOME
$69,844
AVG FAMILY INCOME
$55,583
AVG HOUSEHOLD INCOME
0.41
INEQUALITY / GINI INDEX
1,974
TOTAL POPULATION
1,059
MALE POPULATION
915
FEMALE POPULATION
115.74
MALES / 100 FEMALES
86.40
FEMALES / 100 MALES
21.1
MEDIAN AGE
2.6
AVG FAMILY SIZE
1.9
AVG HOUSEHOLD SIZE
624
LABOR FORCE [ PEOPLE ]
32.1%
PERCENT IN LABOR FORCE
6.7%
UNEMPLOYMENT RATE
Raymond Zip Codes
Raymond Area Codes
Income in Raymond
Income Overview in Raymond
Per Capita Income in Raymond is $13,632, while median incomes of families and households are $69,844 and $55,583 respectively.
| Characteristic | Number | Measure |
| Per Capita Income | 1,974 | $13,632 |
| Median Family Income | 194 | $69,844 |
| Mean Family Income | 194 | $81,711 |
| Median Household Income | 343 | $55,583 |
| Mean Household Income | 343 | $63,953 |
| Income Deficit | 194 | $0 |
| Wage / Income Gap (%) | 1,974 | 0.00% |
| Wage / Income Gap ($) | 1,974 | 100.00¢ per $1 |
| Gini / Inequality Index | 1,974 | 0.41 |
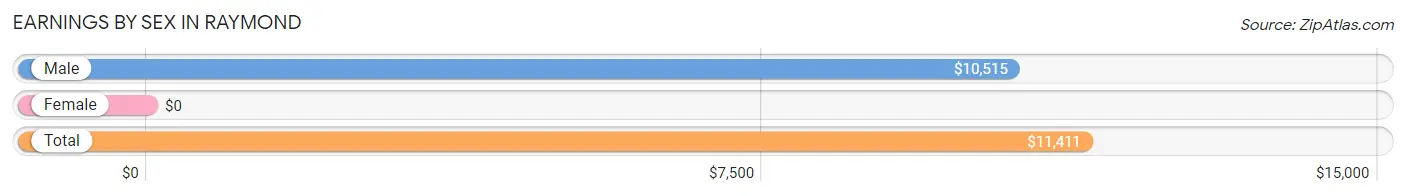
Earnings by Sex in Raymond
| Sex | Number | Average Earnings |
| Male | 433 (52.9%) | $10,515 |
| Female | 385 (47.1%) | $0 |
| Total | 818 (100.0%) | $11,411 |
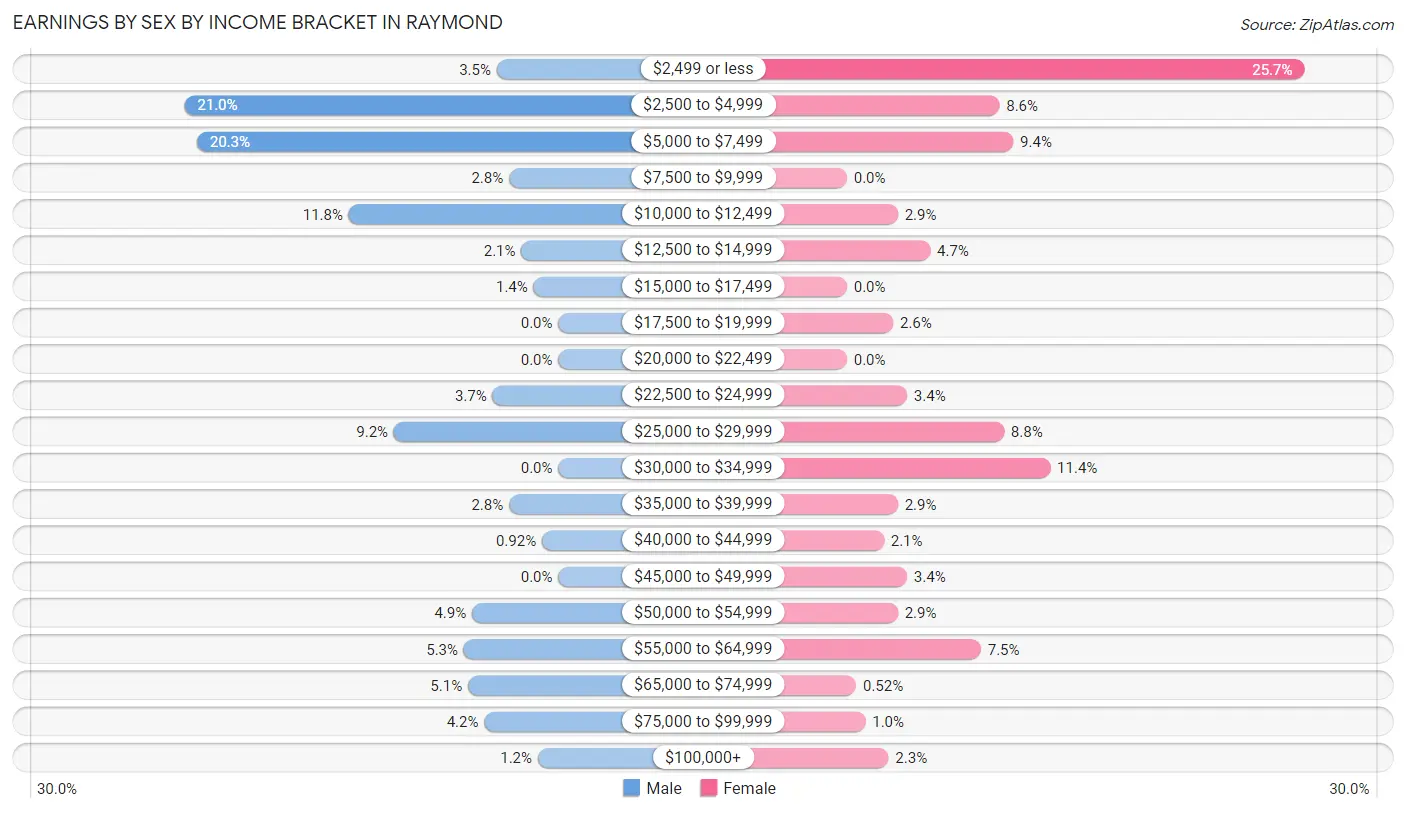
Earnings by Sex by Income Bracket in Raymond
The most common earnings brackets in Raymond are $2,500 to $4,999 for men (91 | 21.0%) and $2,499 or less for women (99 | 25.7%).
| Income | Male | Female |
| $2,499 or less | 15 (3.5%) | 99 (25.7%) |
| $2,500 to $4,999 | 91 (21.0%) | 33 (8.6%) |
| $5,000 to $7,499 | 88 (20.3%) | 36 (9.3%) |
| $7,500 to $9,999 | 12 (2.8%) | 0 (0.0%) |
| $10,000 to $12,499 | 51 (11.8%) | 11 (2.9%) |
| $12,500 to $14,999 | 9 (2.1%) | 18 (4.7%) |
| $15,000 to $17,499 | 6 (1.4%) | 0 (0.0%) |
| $17,500 to $19,999 | 0 (0.0%) | 10 (2.6%) |
| $20,000 to $22,499 | 0 (0.0%) | 0 (0.0%) |
| $22,500 to $24,999 | 16 (3.7%) | 13 (3.4%) |
| $25,000 to $29,999 | 40 (9.2%) | 34 (8.8%) |
| $30,000 to $34,999 | 0 (0.0%) | 44 (11.4%) |
| $35,000 to $39,999 | 12 (2.8%) | 11 (2.9%) |
| $40,000 to $44,999 | 4 (0.9%) | 8 (2.1%) |
| $45,000 to $49,999 | 0 (0.0%) | 13 (3.4%) |
| $50,000 to $54,999 | 21 (4.9%) | 11 (2.9%) |
| $55,000 to $64,999 | 23 (5.3%) | 29 (7.5%) |
| $65,000 to $74,999 | 22 (5.1%) | 2 (0.5%) |
| $75,000 to $99,999 | 18 (4.2%) | 4 (1.0%) |
| $100,000+ | 5 (1.1%) | 9 (2.3%) |
| Total | 433 (100.0%) | 385 (100.0%) |
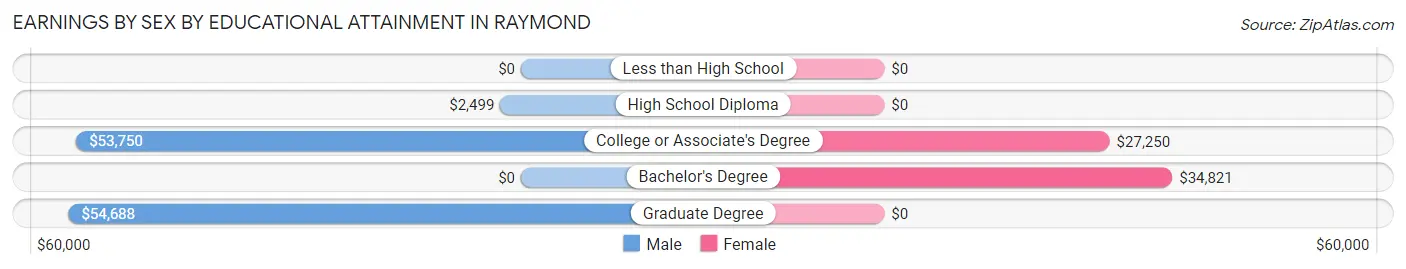
Earnings by Sex by Educational Attainment in Raymond
Average earnings in Raymond are $42,188 for men and $31,111 for women, a difference of 26.3%. Men with an educational attainment of graduate degree enjoy the highest average annual earnings of $54,688, while those with high school diploma education earn the least with $2,499. Women with an educational attainment of bachelor's degree earn the most with the average annual earnings of $34,821, while those with college or associate's degree education have the smallest earnings of $27,250.
| Educational Attainment | Male Income | Female Income |
| Less than High School | - | - |
| High School Diploma | $2,499 | $0 |
| College or Associate's Degree | $53,750 | $27,250 |
| Bachelor's Degree | - | - |
| Graduate Degree | $54,688 | $0 |
| Total | $42,188 | $31,111 |
Family Income in Raymond
Family Income Brackets in Raymond
According to the Raymond family income data, there are 71 families falling into the $100,000 to $149,999 income range, which is the most common income bracket and makes up 36.6% of all families.
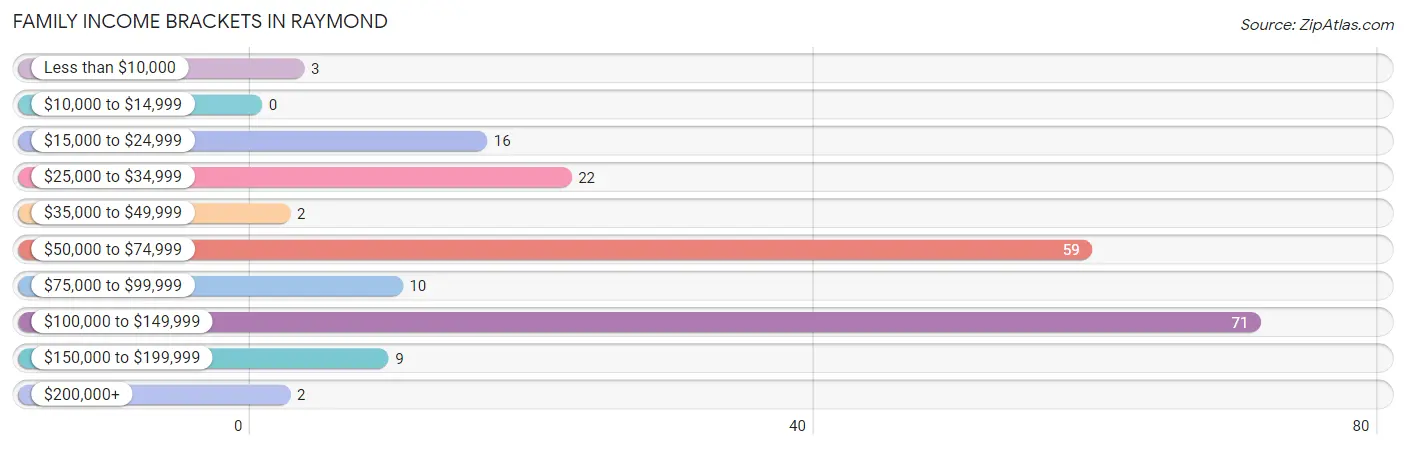
| Income Bracket | # Families | % Families |
| Less than $10,000 | 3 | 1.5% |
| $10,000 to $14,999 | 0 | 0.0% |
| $15,000 to $24,999 | 16 | 8.2% |
| $25,000 to $34,999 | 22 | 11.3% |
| $35,000 to $49,999 | 2 | 1.0% |
| $50,000 to $74,999 | 59 | 30.4% |
| $75,000 to $99,999 | 10 | 5.2% |
| $100,000 to $149,999 | 71 | 36.6% |
| $150,000 to $199,999 | 9 | 4.6% |
| $200,000+ | 2 | 1.0% |
Family Income by Famaliy Size in Raymond
4-person families (22 | 11.3%) account for the highest median family income in Raymond with $110,385 per family, while 2-person families (139 | 71.7%) have the highest median income of $33,958 per family member.
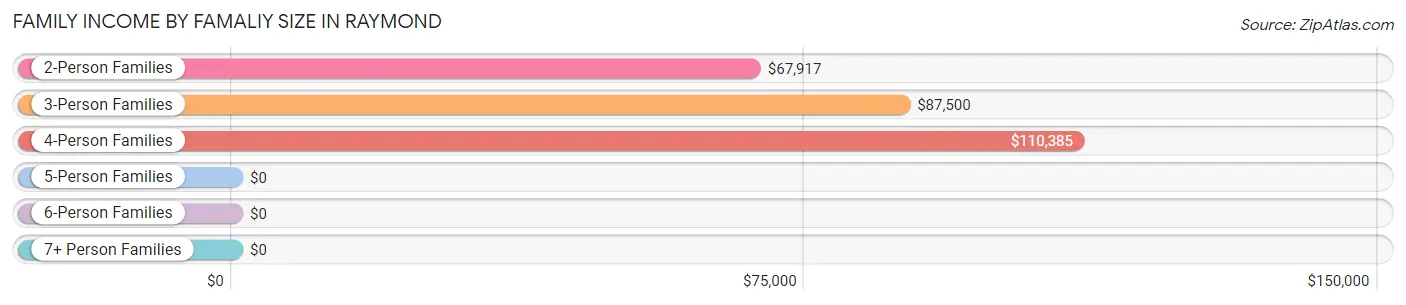
| Income Bracket | # Families | Median Income |
| 2-Person Families | 139 (71.7%) | $67,917 |
| 3-Person Families | 28 (14.4%) | $87,500 |
| 4-Person Families | 22 (11.3%) | $110,385 |
| 5-Person Families | 5 (2.6%) | $0 |
| 6-Person Families | 0 (0.0%) | $0 |
| 7+ Person Families | 0 (0.0%) | $0 |
| Total | 194 (100.0%) | $69,844 |
Family Income by Number of Earners in Raymond
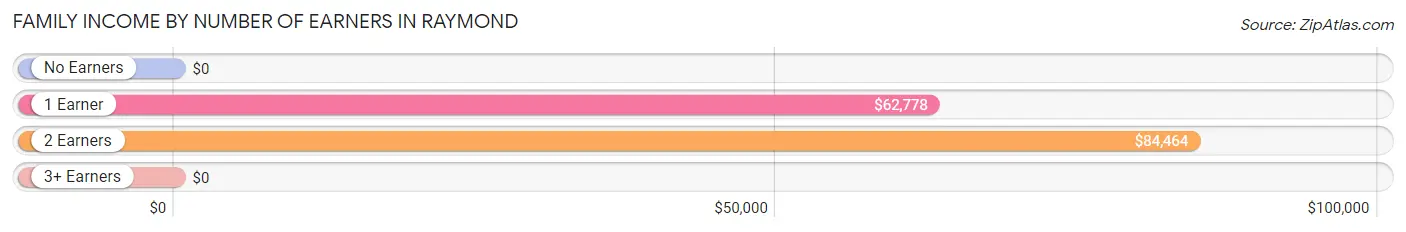
| Number of Earners | # Families | Median Income |
| No Earners | 41 (21.1%) | $0 |
| 1 Earner | 50 (25.8%) | $62,778 |
| 2 Earners | 87 (44.9%) | $84,464 |
| 3+ Earners | 16 (8.3%) | $0 |
| Total | 194 (100.0%) | $69,844 |
Household Income in Raymond
Household Income Brackets in Raymond
With 81 households falling in the category, the $100,000 to $149,999 income range is the most frequent in Raymond, accounting for 23.6% of all households.
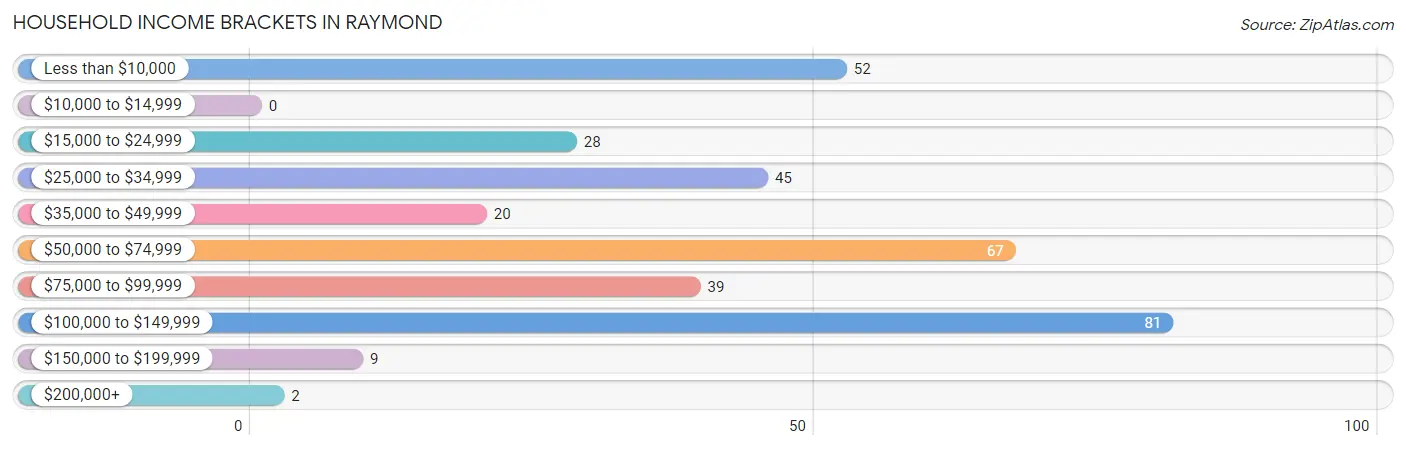
| Income Bracket | # Households | % Households |
| Less than $10,000 | 52 | 15.2% |
| $10,000 to $14,999 | 0 | 0.0% |
| $15,000 to $24,999 | 28 | 8.2% |
| $25,000 to $34,999 | 45 | 13.1% |
| $35,000 to $49,999 | 20 | 5.8% |
| $50,000 to $74,999 | 67 | 19.5% |
| $75,000 to $99,999 | 39 | 11.4% |
| $100,000 to $149,999 | 81 | 23.6% |
| $150,000 to $199,999 | 9 | 2.6% |
| $200,000+ | 2 | 0.6% |
Household Income by Householder Age in Raymond
The median household income in Raymond is $55,583, with the highest median household income of $69,712 found in the 45 to 64 years age bracket for the primary householder. A total of 133 households (38.8%) fall into this category. Meanwhile, the 15 to 24 years age bracket for the primary householder has the lowest median household income of $0, with 5 households (1.5%) in this group.
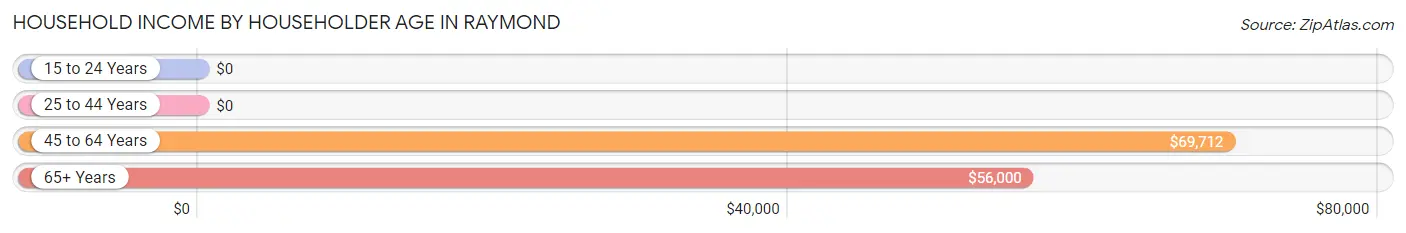
| Income Bracket | # Households | Median Income |
| 15 to 24 Years | 5 (1.5%) | $0 |
| 25 to 44 Years | 85 (24.8%) | $0 |
| 45 to 64 Years | 133 (38.8%) | $69,712 |
| 65+ Years | 120 (35.0%) | $56,000 |
| Total | 343 (100.0%) | $55,583 |
Poverty in Raymond
Income Below Poverty by Sex and Age in Raymond
With 13.5% poverty level for males and 10.4% for females among the residents of Raymond, 12 to 14 year old males and 25 to 34 year old females are the most vulnerable to poverty, with 7 males (87.5%) and 11 females (25.0%) in their respective age groups living below the poverty level.
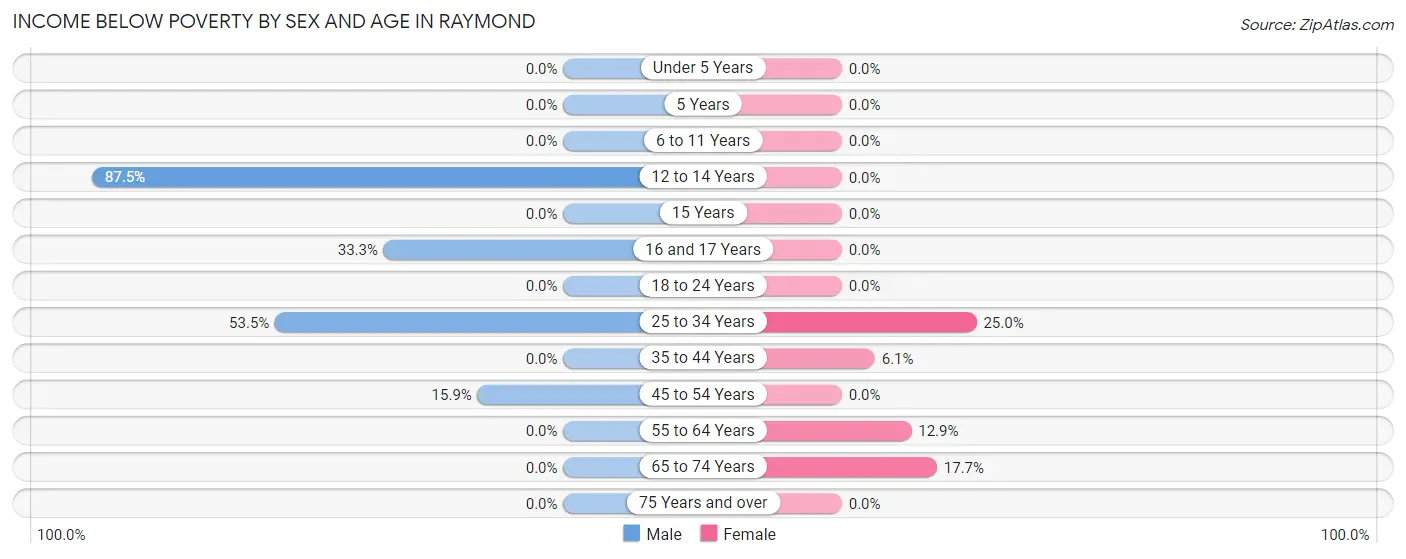
| Age Bracket | Male | Female |
| Under 5 Years | 0 (0.0%) | 0 (0.0%) |
| 5 Years | 0 (0.0%) | 0 (0.0%) |
| 6 to 11 Years | 0 (0.0%) | 0 (0.0%) |
| 12 to 14 Years | 7 (87.5%) | 0 (0.0%) |
| 15 Years | 0 (0.0%) | 0 (0.0%) |
| 16 and 17 Years | 3 (33.3%) | 0 (0.0%) |
| 18 to 24 Years | 0 (0.0%) | 0 (0.0%) |
| 25 to 34 Years | 23 (53.5%) | 11 (25.0%) |
| 35 to 44 Years | 0 (0.0%) | 3 (6.1%) |
| 45 to 54 Years | 7 (15.9%) | 0 (0.0%) |
| 55 to 64 Years | 0 (0.0%) | 8 (12.9%) |
| 65 to 74 Years | 0 (0.0%) | 15 (17.6%) |
| 75 Years and over | 0 (0.0%) | 0 (0.0%) |
| Total | 40 (13.5%) | 37 (10.4%) |
Income Above Poverty by Sex and Age in Raymond
According to the poverty statistics in Raymond, males aged 6 to 11 years and females aged 5 years are the age groups that are most secure financially, with 100.0% of males and 100.0% of females in these age groups living above the poverty line.
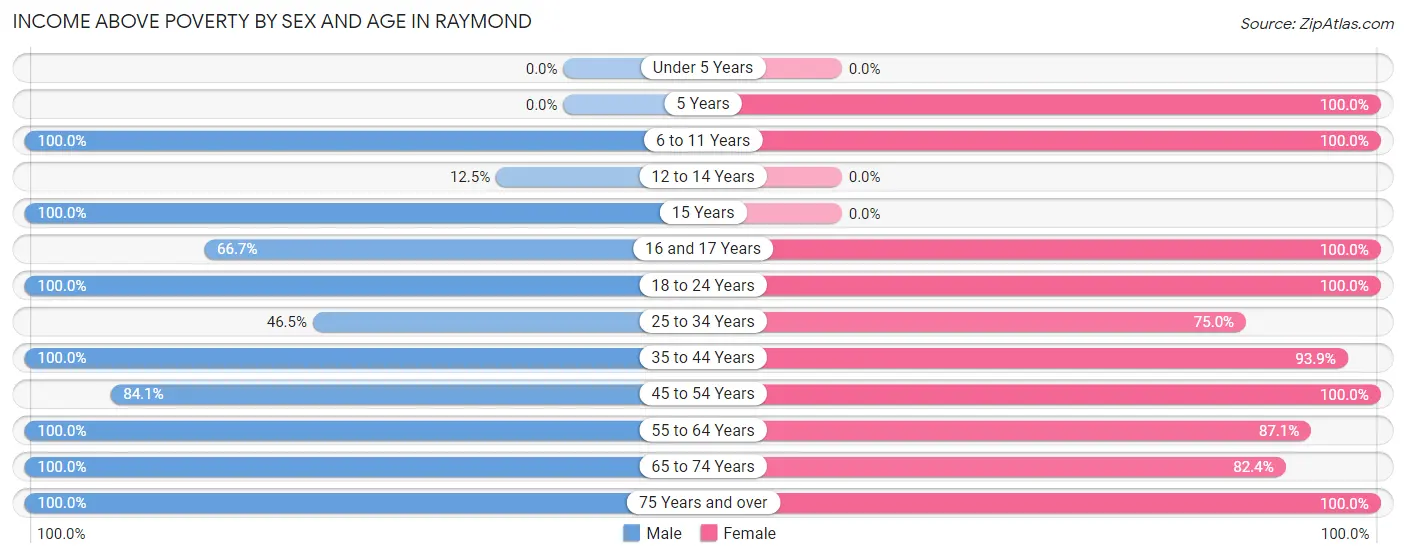
| Age Bracket | Male | Female |
| Under 5 Years | 0 (0.0%) | 0 (0.0%) |
| 5 Years | 0 (0.0%) | 5 (100.0%) |
| 6 to 11 Years | 5 (100.0%) | 2 (100.0%) |
| 12 to 14 Years | 1 (12.5%) | 0 (0.0%) |
| 15 Years | 11 (100.0%) | 0 (0.0%) |
| 16 and 17 Years | 6 (66.7%) | 25 (100.0%) |
| 18 to 24 Years | 39 (100.0%) | 5 (100.0%) |
| 25 to 34 Years | 20 (46.5%) | 33 (75.0%) |
| 35 to 44 Years | 9 (100.0%) | 46 (93.9%) |
| 45 to 54 Years | 37 (84.1%) | 66 (100.0%) |
| 55 to 64 Years | 61 (100.0%) | 54 (87.1%) |
| 65 to 74 Years | 48 (100.0%) | 70 (82.4%) |
| 75 Years and over | 19 (100.0%) | 12 (100.0%) |
| Total | 256 (86.5%) | 318 (89.6%) |
Income Below Poverty Among Married-Couple Families in Raymond
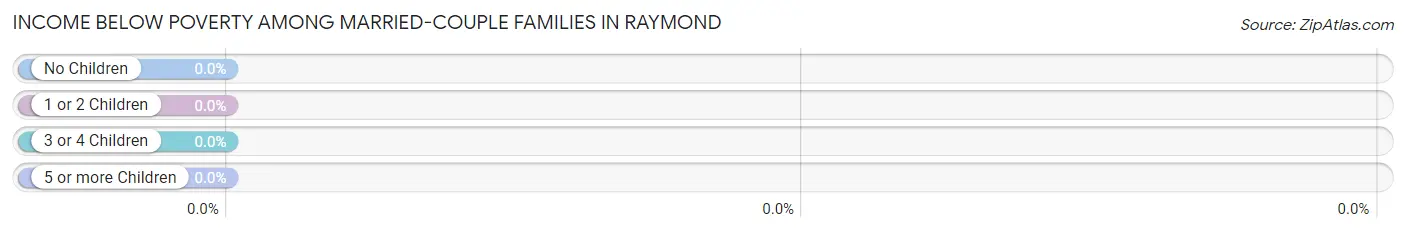
| Children | Above Poverty | Below Poverty |
| No Children | 135 (100.0%) | 0 (0.0%) |
| 1 or 2 Children | 15 (100.0%) | 0 (0.0%) |
| 3 or 4 Children | 5 (100.0%) | 0 (0.0%) |
| 5 or more Children | 0 (0.0%) | 0 (0.0%) |
| Total | 155 (100.0%) | 0 (0.0%) |
Income Below Poverty Among Single-Parent Households in Raymond
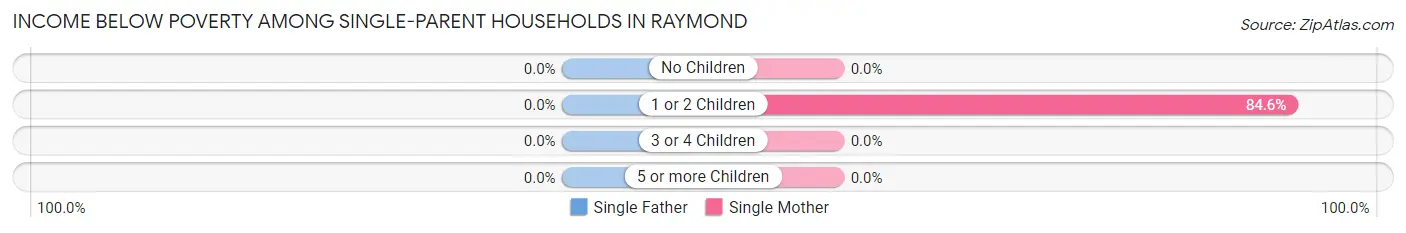
| Children | Single Father | Single Mother |
| No Children | 0 (0.0%) | 0 (0.0%) |
| 1 or 2 Children | 0 (0.0%) | 11 (84.6%) |
| 3 or 4 Children | 0 (0.0%) | 0 (0.0%) |
| 5 or more Children | 0 (0.0%) | 0 (0.0%) |
| Total | 0 (0.0%) | 11 (28.2%) |
Income Below Poverty Among Married-Couple vs Single-Parent Households in Raymond
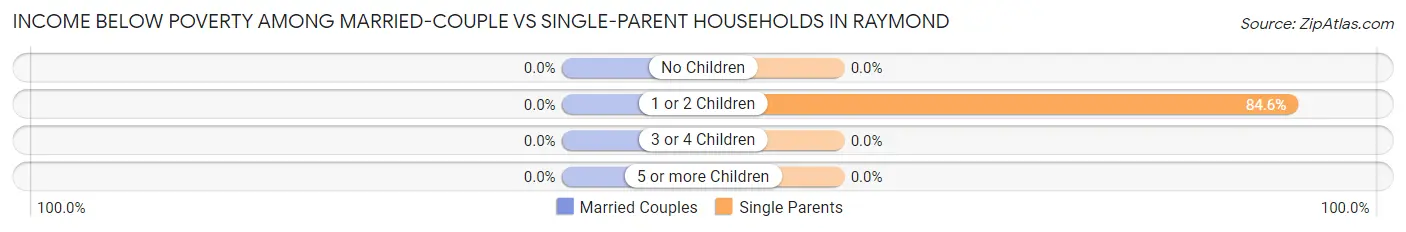
| Children | Married-Couple Families | Single-Parent Households |
| No Children | 0 (0.0%) | 0 (0.0%) |
| 1 or 2 Children | 0 (0.0%) | 11 (84.6%) |
| 3 or 4 Children | 0 (0.0%) | 0 (0.0%) |
| 5 or more Children | 0 (0.0%) | 0 (0.0%) |
| Total | 0 (0.0%) | 11 (28.2%) |
Race in Raymond
The most populous races in Raymond are Black / African American (1,154 | 58.5%), White / Caucasian (772 | 39.1%), and Hispanic or Latino (63 | 3.2%).
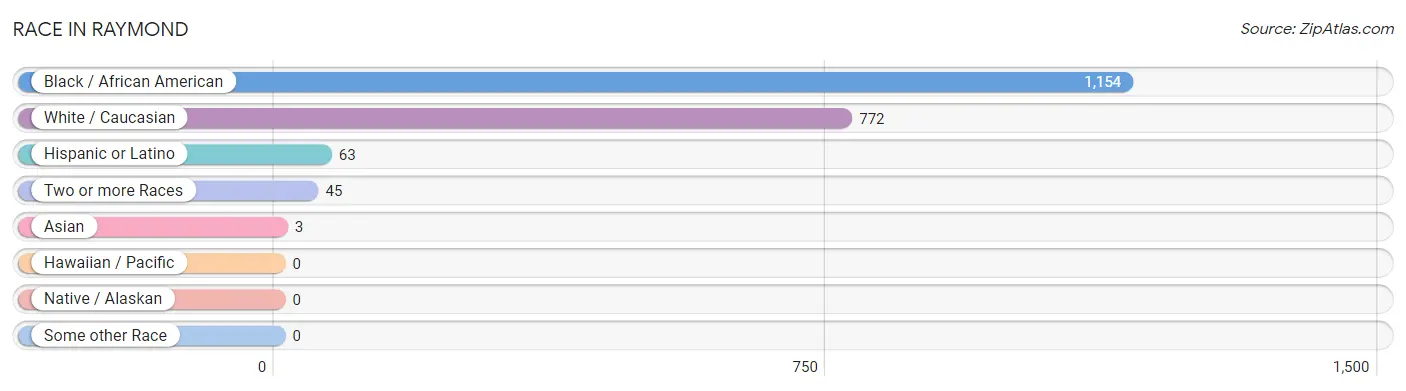
| Race | # Population | % Population |
| Asian | 3 | 0.2% |
| Black / African American | 1,154 | 58.5% |
| Hawaiian / Pacific | 0 | 0.0% |
| Hispanic or Latino | 63 | 3.2% |
| Native / Alaskan | 0 | 0.0% |
| White / Caucasian | 772 | 39.1% |
| Two or more Races | 45 | 2.3% |
| Some other Race | 0 | 0.0% |
| Total | 1,974 | 100.0% |
Ancestry in Raymond
The most populous ancestries reported in Raymond are American (114 | 5.8%), Irish (100 | 5.1%), Scotch-Irish (76 | 3.8%), English (74 | 3.7%), and Subsaharan African (65 | 3.3%), together accounting for 21.7% of all Raymond residents.
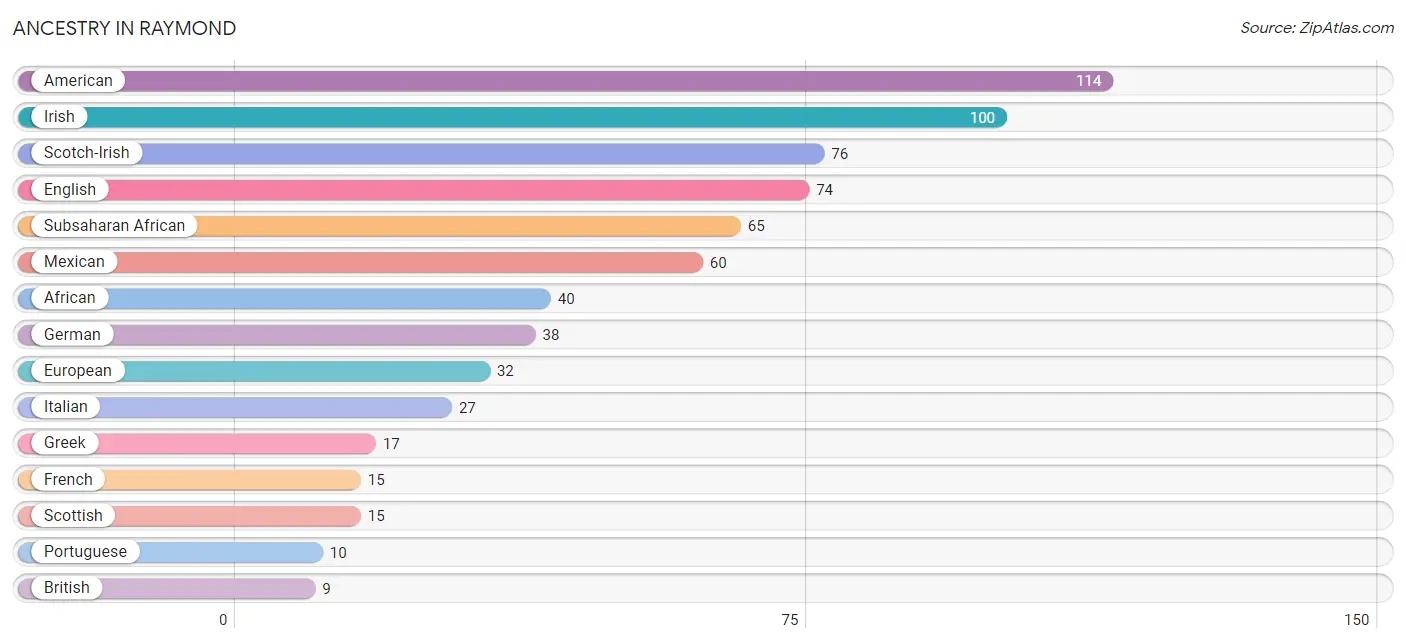
| Ancestry | # Population | % Population |
| African | 40 | 2.0% |
| American | 114 | 5.8% |
| British | 9 | 0.5% |
| Central American | 3 | 0.2% |
| Croatian | 3 | 0.2% |
| English | 74 | 3.7% |
| European | 32 | 1.6% |
| French | 15 | 0.8% |
| German | 38 | 1.9% |
| Greek | 17 | 0.9% |
| Honduran | 3 | 0.2% |
| Irish | 100 | 5.1% |
| Italian | 27 | 1.4% |
| Mexican | 60 | 3.0% |
| Norwegian | 2 | 0.1% |
| Polish | 9 | 0.5% |
| Portuguese | 10 | 0.5% |
| Scotch-Irish | 76 | 3.8% |
| Scottish | 15 | 0.8% |
| Subsaharan African | 65 | 3.3% |
| Thai | 3 | 0.2% | View All 21 Rows |
Immigrants in Raymond
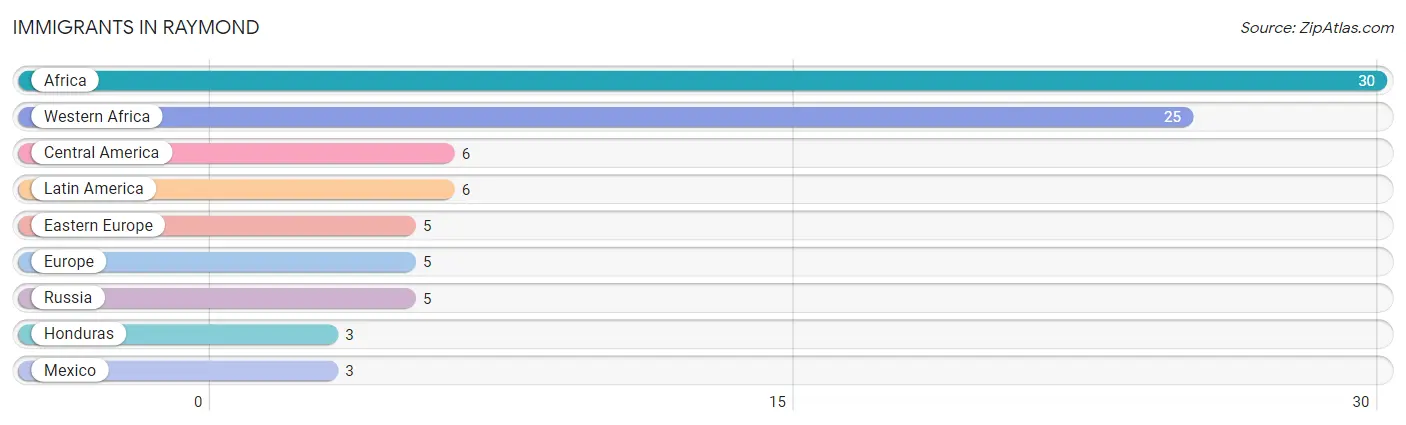
The most numerous immigrant groups reported in Raymond came from Africa (30 | 1.5%), Western Africa (25 | 1.3%), Central America (6 | 0.3%), Latin America (6 | 0.3%), and Eastern Europe (5 | 0.3%), together accounting for 3.6% of all Raymond residents.
| Immigration Origin | # Population | % Population |
| Africa | 30 | 1.5% |
| Central America | 6 | 0.3% |
| Eastern Europe | 5 | 0.3% |
| Europe | 5 | 0.3% |
| Honduras | 3 | 0.2% |
| Latin America | 6 | 0.3% |
| Mexico | 3 | 0.2% |
| Russia | 5 | 0.3% |
| Western Africa | 25 | 1.3% | View All 9 Rows |
Sex and Age in Raymond
Sex and Age in Raymond
The most populous age groups in Raymond are 20 to 24 Years (441 | 41.6%) for men and 15 to 19 Years (364 | 39.8%) for women.
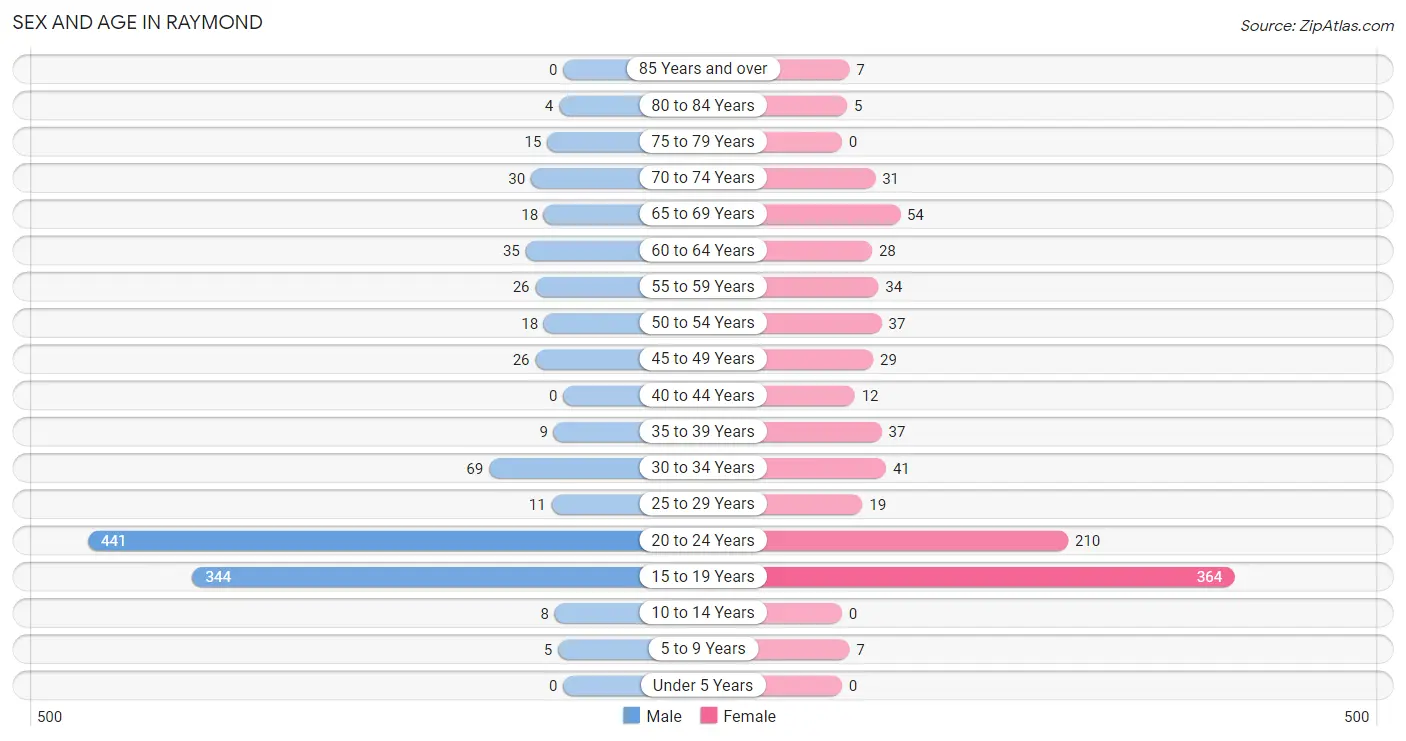
| Age Bracket | Male | Female |
| Under 5 Years | 0 (0.0%) | 0 (0.0%) |
| 5 to 9 Years | 5 (0.5%) | 7 (0.8%) |
| 10 to 14 Years | 8 (0.8%) | 0 (0.0%) |
| 15 to 19 Years | 344 (32.5%) | 364 (39.8%) |
| 20 to 24 Years | 441 (41.6%) | 210 (23.0%) |
| 25 to 29 Years | 11 (1.0%) | 19 (2.1%) |
| 30 to 34 Years | 69 (6.5%) | 41 (4.5%) |
| 35 to 39 Years | 9 (0.9%) | 37 (4.0%) |
| 40 to 44 Years | 0 (0.0%) | 12 (1.3%) |
| 45 to 49 Years | 26 (2.5%) | 29 (3.2%) |
| 50 to 54 Years | 18 (1.7%) | 37 (4.0%) |
| 55 to 59 Years | 26 (2.5%) | 34 (3.7%) |
| 60 to 64 Years | 35 (3.3%) | 28 (3.1%) |
| 65 to 69 Years | 18 (1.7%) | 54 (5.9%) |
| 70 to 74 Years | 30 (2.8%) | 31 (3.4%) |
| 75 to 79 Years | 15 (1.4%) | 0 (0.0%) |
| 80 to 84 Years | 4 (0.4%) | 5 (0.5%) |
| 85 Years and over | 0 (0.0%) | 7 (0.8%) |
| Total | 1,059 (100.0%) | 915 (100.0%) |
Families and Households in Raymond
Median Family Size in Raymond
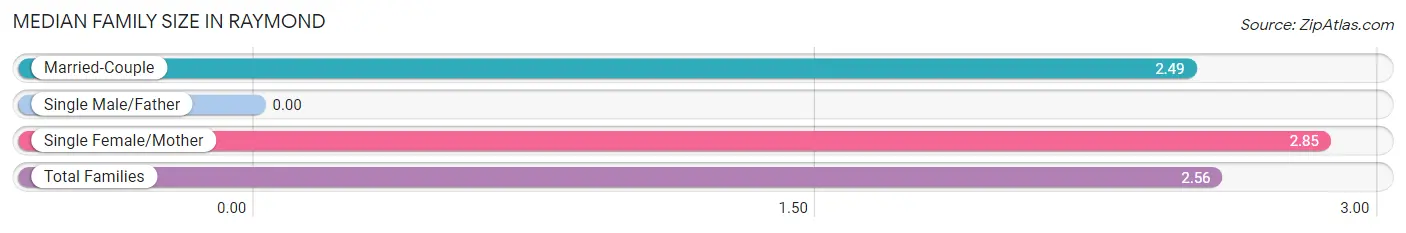
| Family Type | # Families | Family Size |
| Married-Couple | 155 (79.9%) | 2.49 |
| Single Male/Father | 0 (0.0%) | - |
| Single Female/Mother | 39 (20.1%) | 2.85 |
| Total Families | 194 (100.0%) | 2.56 |
Median Household Size in Raymond
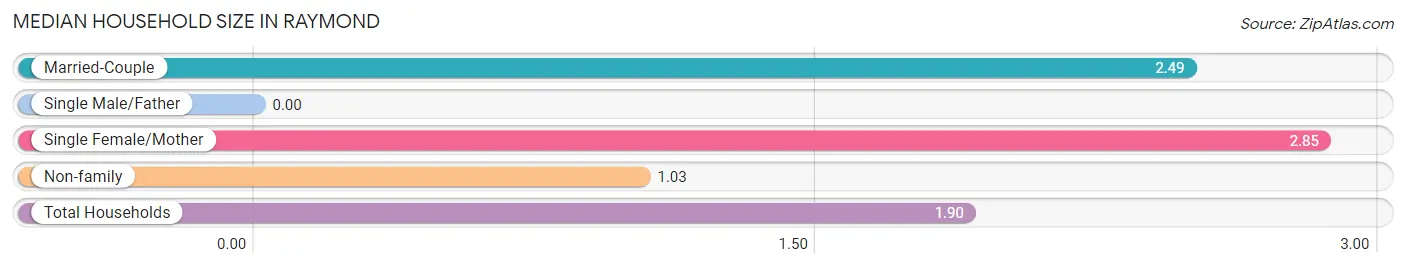
| Household Type | # Households | Household Size |
| Married-Couple | 155 (45.2%) | 2.49 |
| Single Male/Father | 0 (0.0%) | - |
| Single Female/Mother | 39 (11.4%) | 2.85 |
| Non-family | 149 (43.4%) | 1.03 |
| Total Households | 343 (100.0%) | 1.90 |
Household Size by Marriage Status in Raymond
Out of a total of 343 households in Raymond, 194 (56.6%) are family households, while 149 (43.4%) are nonfamily households. The most numerous type of family households are 2-person households, comprising 139, and the most common type of nonfamily households are 1-person households, comprising 144.
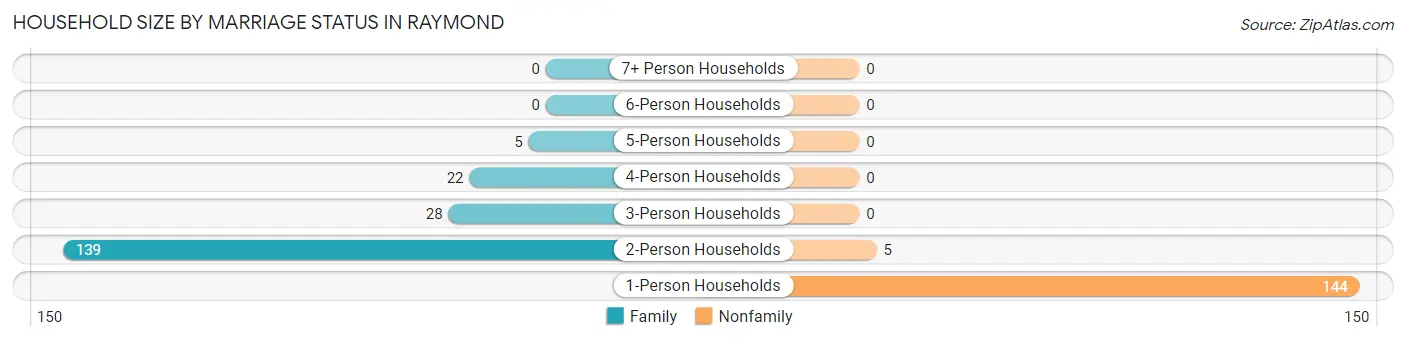
| Household Size | Family Households | Nonfamily Households |
| 1-Person Households | - | 144 (42.0%) |
| 2-Person Households | 139 (40.5%) | 5 (1.5%) |
| 3-Person Households | 28 (8.2%) | 0 (0.0%) |
| 4-Person Households | 22 (6.4%) | 0 (0.0%) |
| 5-Person Households | 5 (1.5%) | 0 (0.0%) |
| 6-Person Households | 0 (0.0%) | 0 (0.0%) |
| 7+ Person Households | 0 (0.0%) | 0 (0.0%) |
| Total | 194 (56.6%) | 149 (43.4%) |
Female Fertility in Raymond
Fertility by Age in Raymond
| Age Bracket | Women with Births | Births / 1,000 Women |
| 15 to 19 years | 0 (0.0%) | 0.0 |
| 20 to 34 years | 0 (0.0%) | 0.0 |
| 35 to 50 years | 0 (0.0%) | 0.0 |
| Total | 0 (0.0%) | 0.0 |
Fertility by Age by Marriage Status in Raymond
| Age Bracket | Married | Unmarried |
| 15 to 19 years | 0 (0.0%) | 0 (0.0%) |
| 20 to 34 years | 0 (0.0%) | 0 (0.0%) |
| 35 to 50 years | 0 (0.0%) | 0 (0.0%) |
| Total | 0 (0.0%) | 0 (0.0%) |
Fertility by Education in Raymond
| Educational Attainment | Women with Births | Births / 1,000 Women |
| Less than High School | 0 (0.0%) | 0.0 |
| High School Diploma | 0 (0.0%) | 0.0 |
| College or Associate's Degree | 0 (0.0%) | 0.0 |
| Bachelor's Degree | 0 (0.0%) | 0.0 |
| Graduate Degree | 0 (0.0%) | 0.0 |
| Total | 0 (0.0%) | 0.0 |
Fertility by Education by Marriage Status in Raymond
| Educational Attainment | Married | Unmarried |
| Less than High School | 0 (0.0%) | 0 (0.0%) |
| High School Diploma | 0 (0.0%) | 0 (0.0%) |
| College or Associate's Degree | 0 (0.0%) | 0 (0.0%) |
| Bachelor's Degree | 0 (0.0%) | 0 (0.0%) |
| Graduate Degree | 0 (0.0%) | 0 (0.0%) |
| Total | 0 (0.0%) | 0 (0.0%) |
Employment Characteristics in Raymond
Employment by Class of Employer in Raymond
Among the 581 employed individuals in Raymond, private company employees (335 | 57.7%), state government employees (120 | 20.6%), and federal government employees (36 | 6.2%) make up the most common classes of employment.
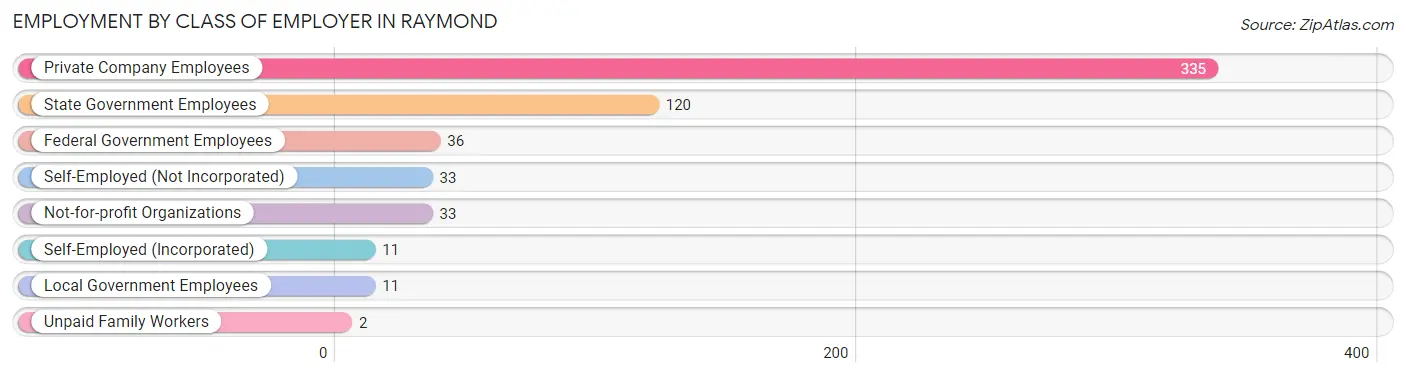
| Employer Class | # Employees | % Employees |
| Private Company Employees | 335 | 57.7% |
| Self-Employed (Incorporated) | 11 | 1.9% |
| Self-Employed (Not Incorporated) | 33 | 5.7% |
| Not-for-profit Organizations | 33 | 5.7% |
| Local Government Employees | 11 | 1.9% |
| State Government Employees | 120 | 20.6% |
| Federal Government Employees | 36 | 6.2% |
| Unpaid Family Workers | 2 | 0.3% |
| Total | 581 | 100.0% |
Employment Status by Age in Raymond
According to the labor force statistics for Raymond, out of the total population over 16 years of age (1,943), 32.1% or 624 individuals are in the labor force, with 6.7% or 42 of them unemployed. The age group with the highest labor force participation rate is 55 to 59 years, with 100.0% or 60 individuals in the labor force. Within the labor force, the 20 to 24 years age range has the highest percentage of unemployed individuals, with 33.0% or 36 of them being unemployed.
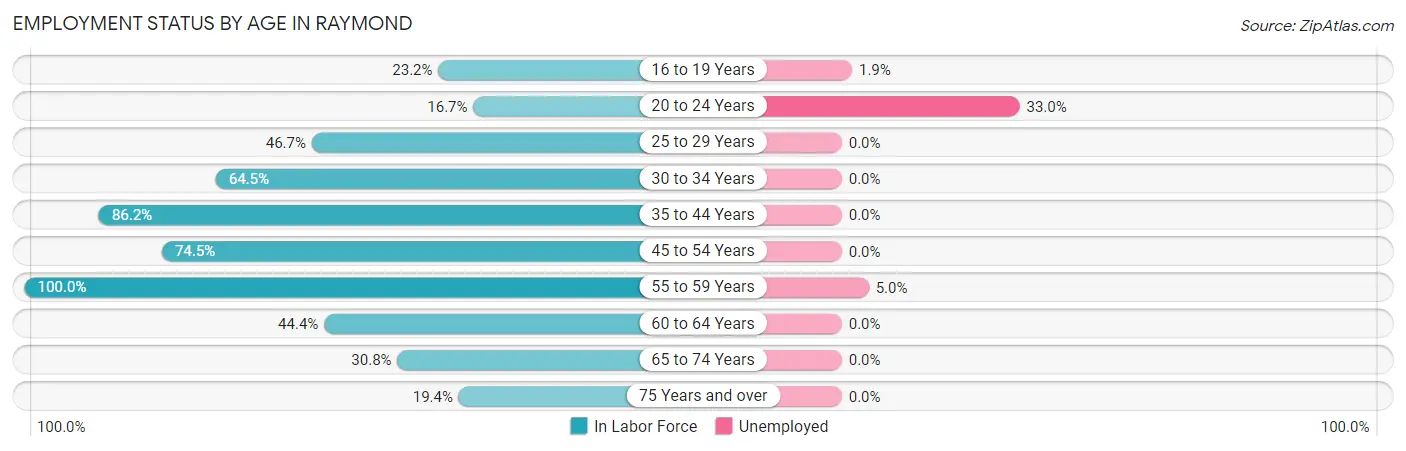
| Age Bracket | In Labor Force | Unemployed |
| 16 to 19 Years | 162 (23.2%) | 3 (1.9%) |
| 20 to 24 Years | 109 (16.7%) | 36 (33.0%) |
| 25 to 29 Years | 14 (46.7%) | 0 (0.0%) |
| 30 to 34 Years | 71 (64.5%) | 0 (0.0%) |
| 35 to 44 Years | 50 (86.2%) | 0 (0.0%) |
| 45 to 54 Years | 82 (74.5%) | 0 (0.0%) |
| 55 to 59 Years | 60 (100.0%) | 3 (5.0%) |
| 60 to 64 Years | 28 (44.4%) | 0 (0.0%) |
| 65 to 74 Years | 41 (30.8%) | 0 (0.0%) |
| 75 Years and over | 6 (19.4%) | 0 (0.0%) |
| Total | 624 (32.1%) | 42 (6.7%) |
Employment Status by Educational Attainment in Raymond
According to labor force statistics for Raymond, 70.8% of individuals (305) out of the total population between 25 and 64 years of age (431) are in the labor force, with 1.0% or 3 of them being unemployed. The group with the highest labor force participation rate are those with the educational attainment of bachelor's degree or higher, with 83.8% or 155 individuals in the labor force. Within the labor force, individuals with college / associate degree education have the highest percentage of unemployment, with 2.4% or 3 of them being unemployed.
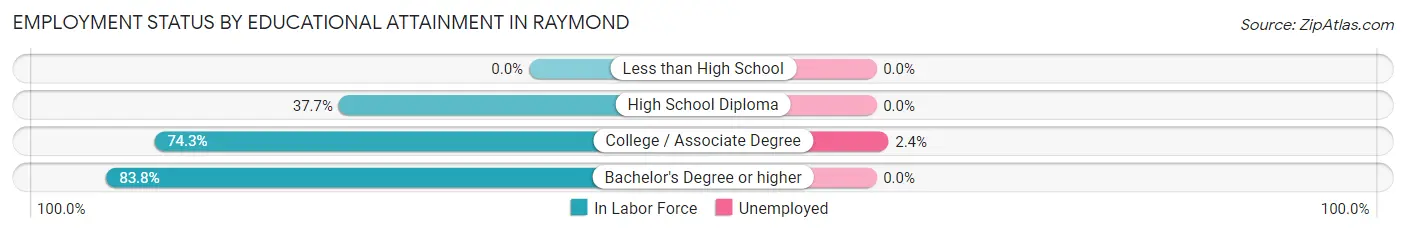
| Educational Attainment | In Labor Force | Unemployed |
| Less than High School | 0 (0.0%) | 0 (0.0%) |
| High School Diploma | 23 (37.7%) | 0 (0.0%) |
| College / Associate Degree | 127 (74.3%) | 4 (2.4%) |
| Bachelor's Degree or higher | 155 (83.8%) | 0 (0.0%) |
| Total | 305 (70.8%) | 4 (1.0%) |
Employment Occupations by Sex in Raymond
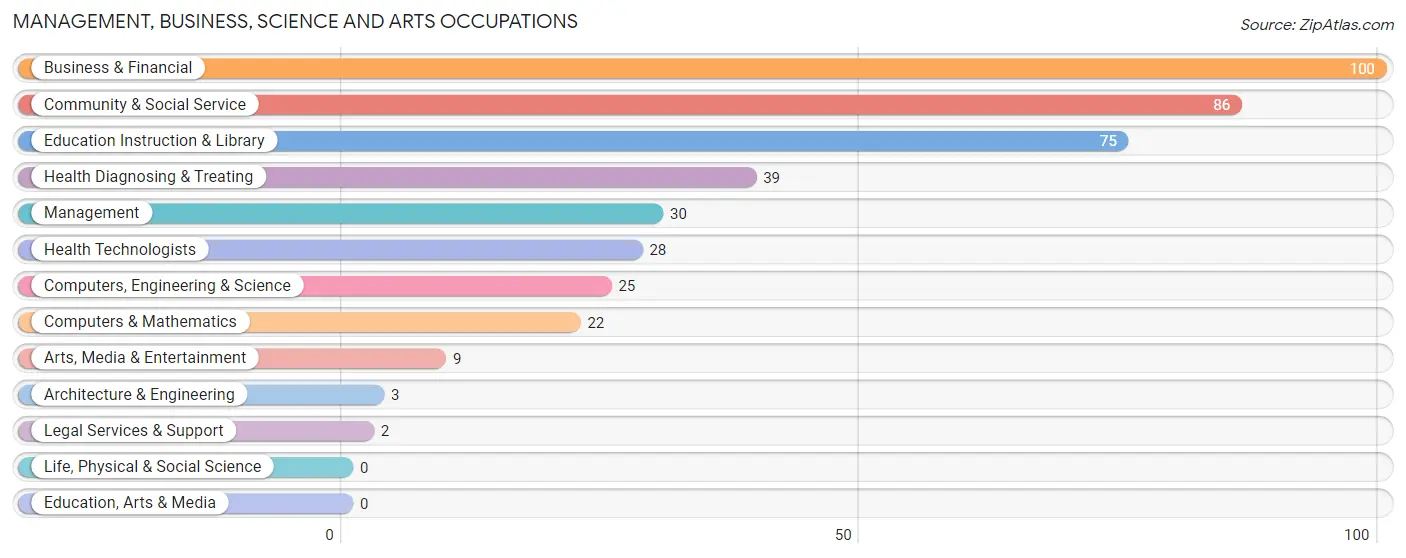
Management, Business, Science and Arts Occupations
The most common Management, Business, Science and Arts occupations in Raymond are Business & Financial (100 | 17.2%), Community & Social Service (86 | 14.8%), Education Instruction & Library (75 | 12.9%), Health Diagnosing & Treating (39 | 6.7%), and Management (30 | 5.2%).
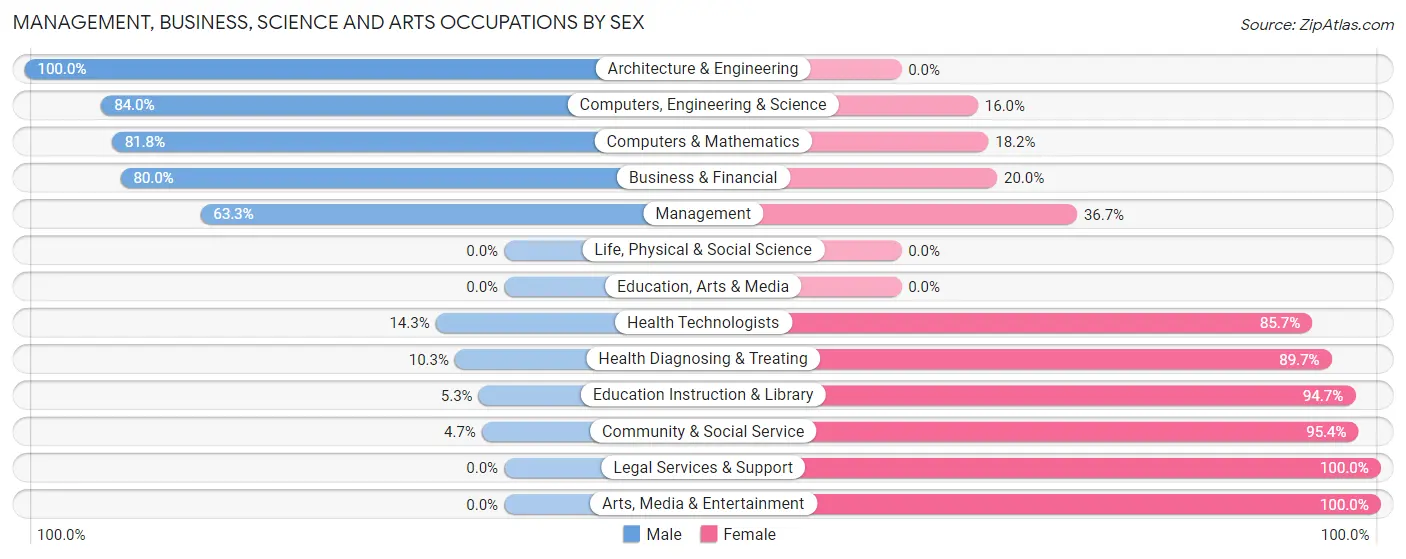
Management, Business, Science and Arts Occupations by Sex
Within the Management, Business, Science and Arts occupations in Raymond, the most male-oriented occupations are Architecture & Engineering (100.0%), Computers, Engineering & Science (84.0%), and Computers & Mathematics (81.8%), while the most female-oriented occupations are Legal Services & Support (100.0%), Arts, Media & Entertainment (100.0%), and Community & Social Service (95.4%).
| Occupation | Male | Female |
| Management | 19 (63.3%) | 11 (36.7%) |
| Business & Financial | 80 (80.0%) | 20 (20.0%) |
| Computers, Engineering & Science | 21 (84.0%) | 4 (16.0%) |
| Computers & Mathematics | 18 (81.8%) | 4 (18.2%) |
| Architecture & Engineering | 3 (100.0%) | 0 (0.0%) |
| Life, Physical & Social Science | 0 (0.0%) | 0 (0.0%) |
| Community & Social Service | 4 (4.6%) | 82 (95.4%) |
| Education, Arts & Media | 0 (0.0%) | 0 (0.0%) |
| Legal Services & Support | 0 (0.0%) | 2 (100.0%) |
| Education Instruction & Library | 4 (5.3%) | 71 (94.7%) |
| Arts, Media & Entertainment | 0 (0.0%) | 9 (100.0%) |
| Health Diagnosing & Treating | 4 (10.3%) | 35 (89.7%) |
| Health Technologists | 4 (14.3%) | 24 (85.7%) |
| Total (Category) | 128 (45.7%) | 152 (54.3%) |
| Total (Overall) | 290 (49.9%) | 291 (50.1%) |
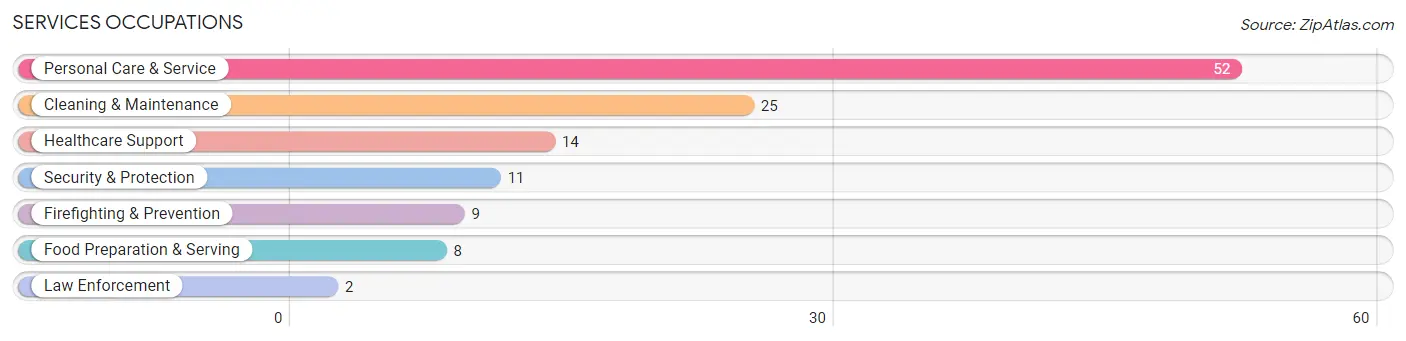
Services Occupations
The most common Services occupations in Raymond are Personal Care & Service (52 | 8.9%), Cleaning & Maintenance (25 | 4.3%), Healthcare Support (14 | 2.4%), Security & Protection (11 | 1.9%), and Firefighting & Prevention (9 | 1.5%).
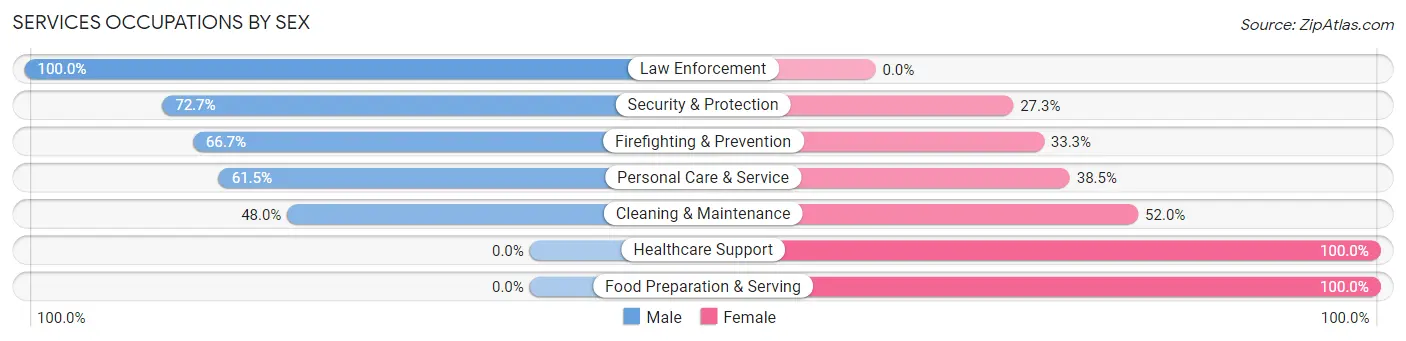
Services Occupations by Sex
Within the Services occupations in Raymond, the most male-oriented occupations are Law Enforcement (100.0%), Security & Protection (72.7%), and Firefighting & Prevention (66.7%), while the most female-oriented occupations are Healthcare Support (100.0%), Food Preparation & Serving (100.0%), and Cleaning & Maintenance (52.0%).
| Occupation | Male | Female |
| Healthcare Support | 0 (0.0%) | 14 (100.0%) |
| Security & Protection | 8 (72.7%) | 3 (27.3%) |
| Firefighting & Prevention | 6 (66.7%) | 3 (33.3%) |
| Law Enforcement | 2 (100.0%) | 0 (0.0%) |
| Food Preparation & Serving | 0 (0.0%) | 8 (100.0%) |
| Cleaning & Maintenance | 12 (48.0%) | 13 (52.0%) |
| Personal Care & Service | 32 (61.5%) | 20 (38.5%) |
| Total (Category) | 52 (47.3%) | 58 (52.7%) |
| Total (Overall) | 290 (49.9%) | 291 (50.1%) |
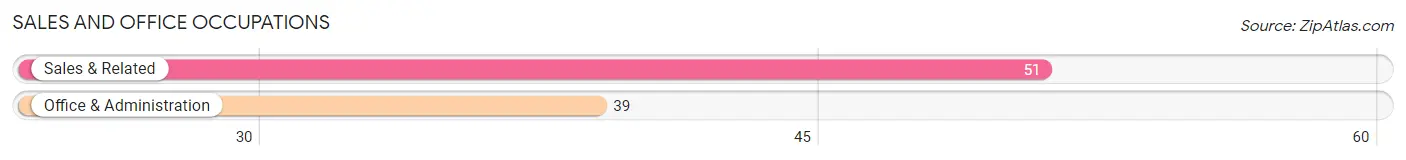
Sales and Office Occupations
The most common Sales and Office occupations in Raymond are Sales & Related (51 | 8.8%), and Office & Administration (39 | 6.7%).
Sales and Office Occupations by Sex
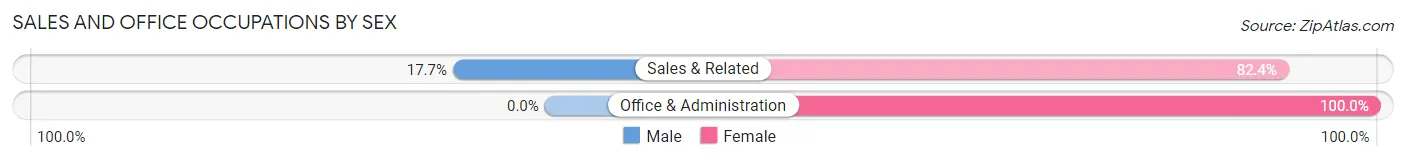
| Occupation | Male | Female |
| Sales & Related | 9 (17.6%) | 42 (82.4%) |
| Office & Administration | 0 (0.0%) | 39 (100.0%) |
| Total (Category) | 9 (10.0%) | 81 (90.0%) |
| Total (Overall) | 290 (49.9%) | 291 (50.1%) |
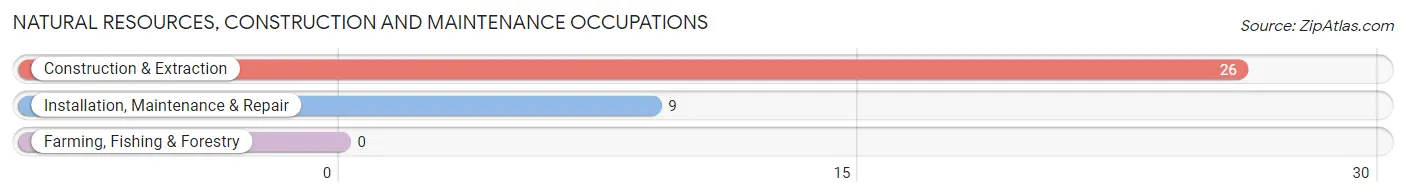
Natural Resources, Construction and Maintenance Occupations
The most common Natural Resources, Construction and Maintenance occupations in Raymond are Construction & Extraction (26 | 4.5%), and Installation, Maintenance & Repair (9 | 1.5%).
Natural Resources, Construction and Maintenance Occupations by Sex
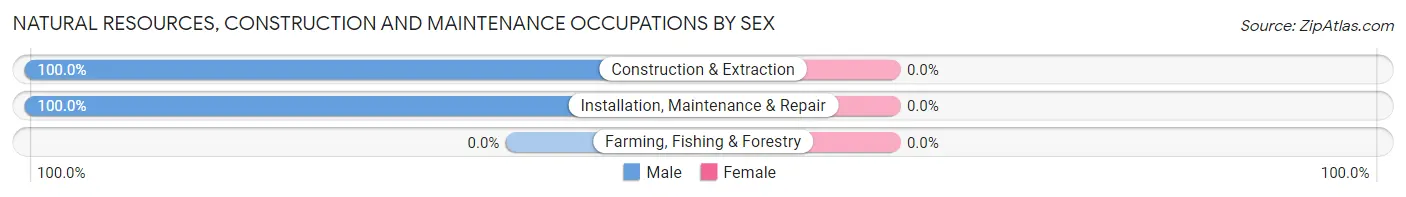
| Occupation | Male | Female |
| Farming, Fishing & Forestry | 0 (0.0%) | 0 (0.0%) |
| Construction & Extraction | 26 (100.0%) | 0 (0.0%) |
| Installation, Maintenance & Repair | 9 (100.0%) | 0 (0.0%) |
| Total (Category) | 35 (100.0%) | 0 (0.0%) |
| Total (Overall) | 290 (49.9%) | 291 (50.1%) |
Production, Transportation and Moving Occupations
The most common Production, Transportation and Moving occupations in Raymond are Production (51 | 8.8%), and Transportation (15 | 2.6%).
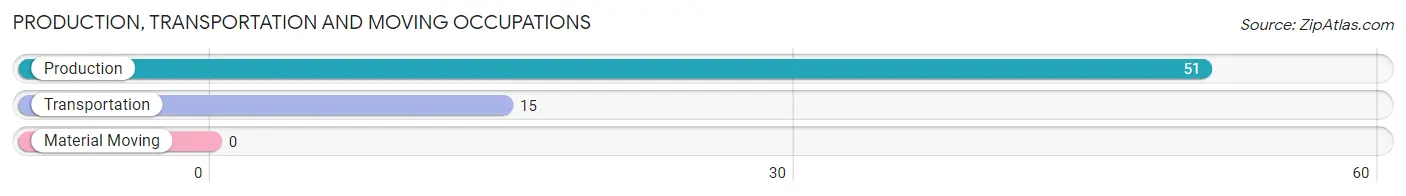
Production, Transportation and Moving Occupations by Sex
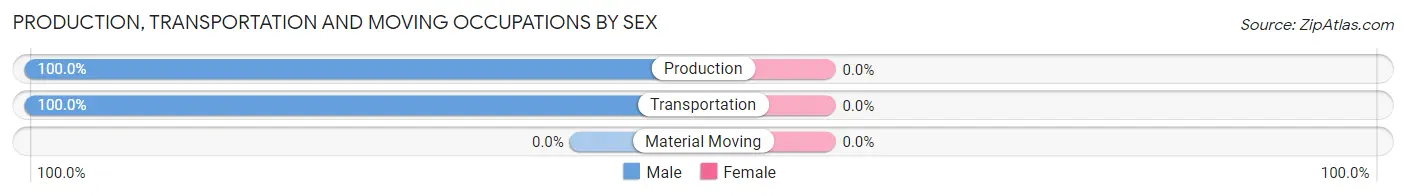
| Occupation | Male | Female |
| Production | 51 (100.0%) | 0 (0.0%) |
| Transportation | 15 (100.0%) | 0 (0.0%) |
| Material Moving | 0 (0.0%) | 0 (0.0%) |
| Total (Category) | 66 (100.0%) | 0 (0.0%) |
| Total (Overall) | 290 (49.9%) | 291 (50.1%) |
Employment Industries by Sex in Raymond
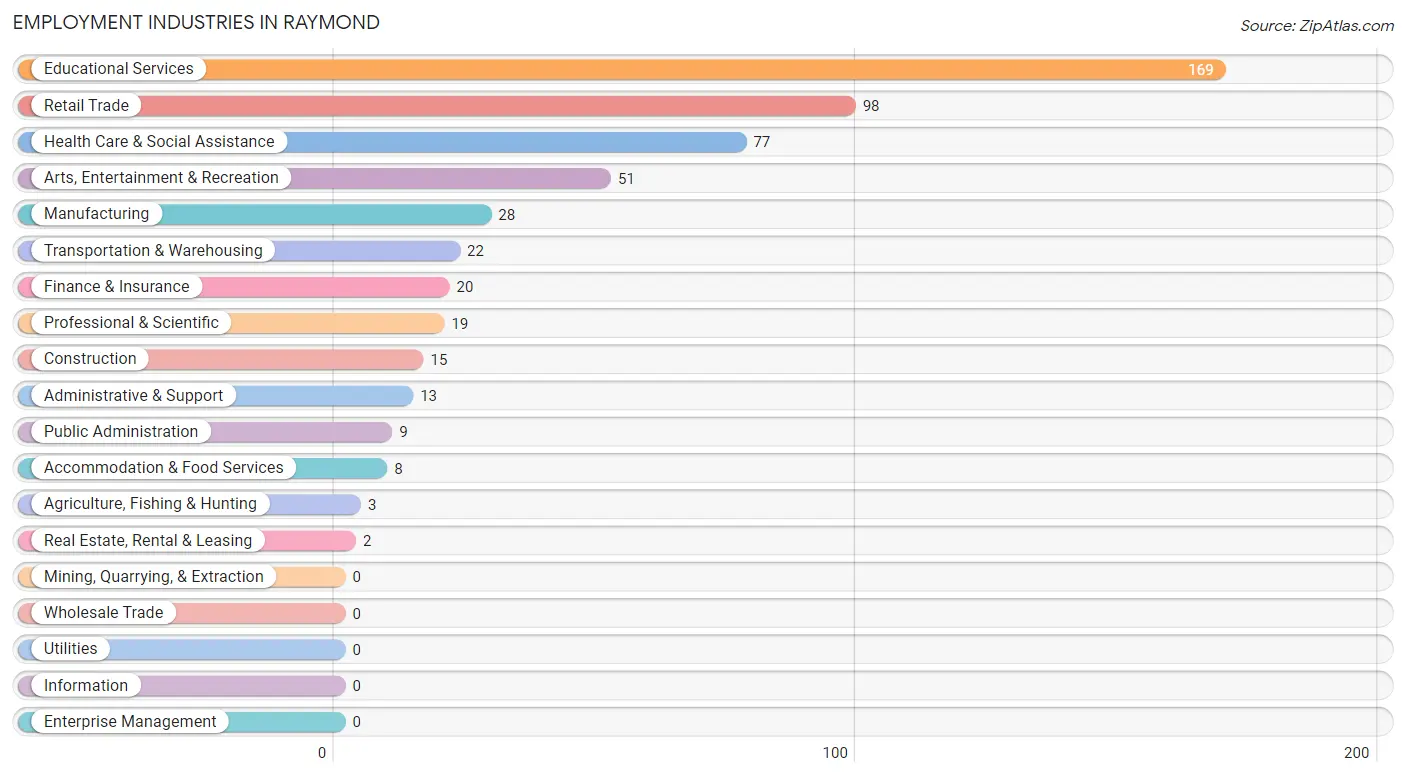
Employment Industries in Raymond
The major employment industries in Raymond include Educational Services (169 | 29.1%), Retail Trade (98 | 16.9%), Health Care & Social Assistance (77 | 13.3%), Arts, Entertainment & Recreation (51 | 8.8%), and Manufacturing (28 | 4.8%).
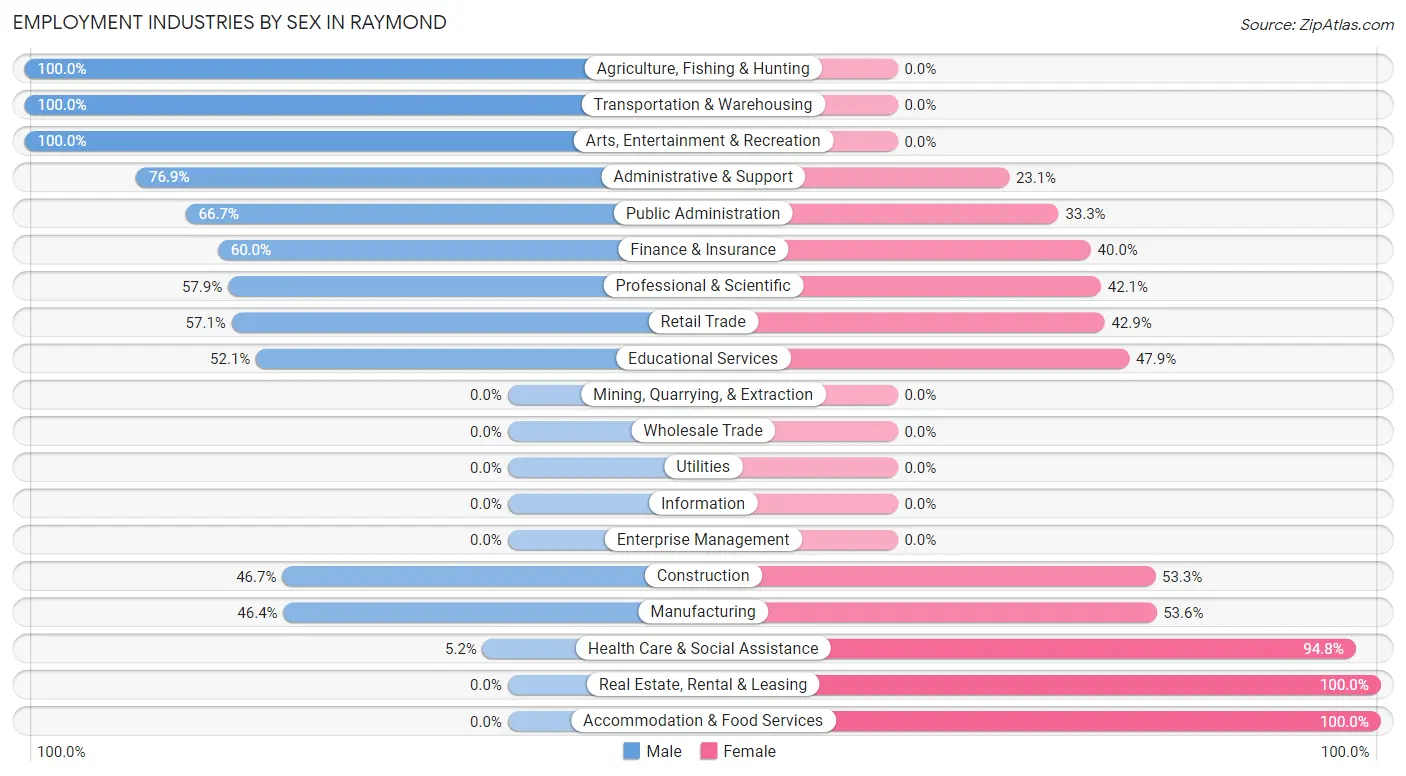
Employment Industries by Sex in Raymond
The Raymond industries that see more men than women are Agriculture, Fishing & Hunting (100.0%), Transportation & Warehousing (100.0%), and Arts, Entertainment & Recreation (100.0%), whereas the industries that tend to have a higher number of women are Real Estate, Rental & Leasing (100.0%), Accommodation & Food Services (100.0%), and Health Care & Social Assistance (94.8%).
| Industry | Male | Female |
| Agriculture, Fishing & Hunting | 3 (100.0%) | 0 (0.0%) |
| Mining, Quarrying, & Extraction | 0 (0.0%) | 0 (0.0%) |
| Construction | 7 (46.7%) | 8 (53.3%) |
| Manufacturing | 13 (46.4%) | 15 (53.6%) |
| Wholesale Trade | 0 (0.0%) | 0 (0.0%) |
| Retail Trade | 56 (57.1%) | 42 (42.9%) |
| Transportation & Warehousing | 22 (100.0%) | 0 (0.0%) |
| Utilities | 0 (0.0%) | 0 (0.0%) |
| Information | 0 (0.0%) | 0 (0.0%) |
| Finance & Insurance | 12 (60.0%) | 8 (40.0%) |
| Real Estate, Rental & Leasing | 0 (0.0%) | 2 (100.0%) |
| Professional & Scientific | 11 (57.9%) | 8 (42.1%) |
| Enterprise Management | 0 (0.0%) | 0 (0.0%) |
| Administrative & Support | 10 (76.9%) | 3 (23.1%) |
| Educational Services | 88 (52.1%) | 81 (47.9%) |
| Health Care & Social Assistance | 4 (5.2%) | 73 (94.8%) |
| Arts, Entertainment & Recreation | 51 (100.0%) | 0 (0.0%) |
| Accommodation & Food Services | 0 (0.0%) | 8 (100.0%) |
| Public Administration | 6 (66.7%) | 3 (33.3%) |
| Total | 290 (49.9%) | 291 (50.1%) |
Education in Raymond
School Enrollment in Raymond
The most common levels of schooling among the 1,459 students in Raymond are college / undergraduate (1,333 | 91.4%), graduate / professional (86 | 5.9%), and high school (20 | 1.4%).
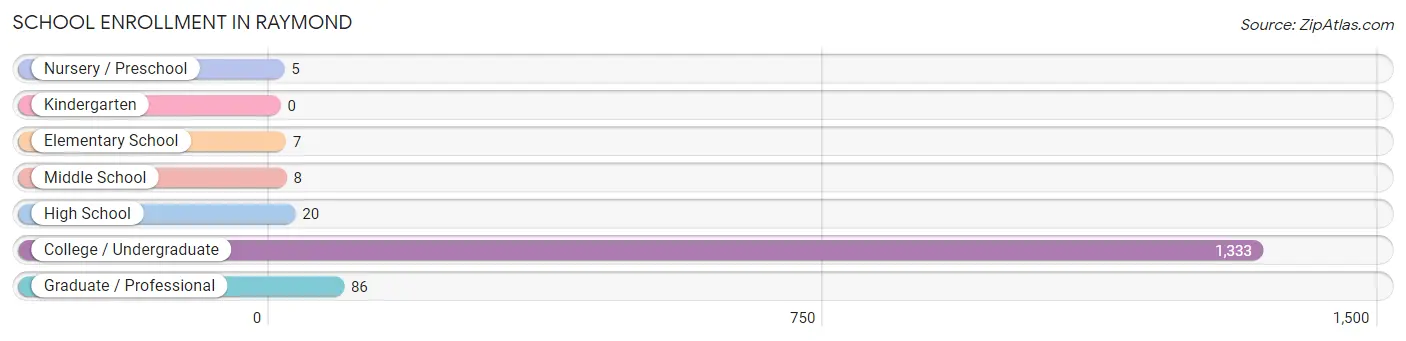
| School Level | # Students | % Students |
| Nursery / Preschool | 5 | 0.3% |
| Kindergarten | 0 | 0.0% |
| Elementary School | 7 | 0.5% |
| Middle School | 8 | 0.5% |
| High School | 20 | 1.4% |
| College / Undergraduate | 1,333 | 91.4% |
| Graduate / Professional | 86 | 5.9% |
| Total | 1,459 | 100.0% |
School Enrollment by Age by Funding Source in Raymond
Out of a total of 1,459 students who are enrolled in schools in Raymond, 220 (15.1%) attend a private institution, while the remaining 1,239 (84.9%) are enrolled in public schools. The age group of 35 years and over has the highest likelihood of being enrolled in private schools, with 15 (44.1% in the age bracket) enrolled. Conversely, the age group of 5 to 9 year old has the lowest likelihood of being enrolled in a private school, with 12 (100.0% in the age bracket) attending a public institution.
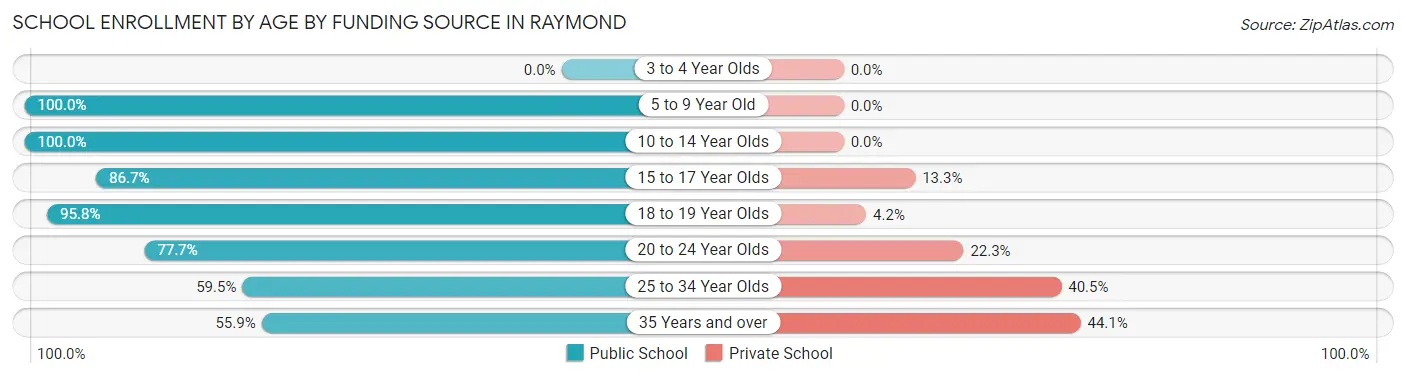
| Age Bracket | Public School | Private School |
| 3 to 4 Year Olds | 0 (0.0%) | 0 (0.0%) |
| 5 to 9 Year Old | 12 (100.0%) | 0 (0.0%) |
| 10 to 14 Year Olds | 8 (100.0%) | 0 (0.0%) |
| 15 to 17 Year Olds | 39 (86.7%) | 6 (13.3%) |
| 18 to 19 Year Olds | 618 (95.8%) | 27 (4.2%) |
| 20 to 24 Year Olds | 498 (77.7%) | 143 (22.3%) |
| 25 to 34 Year Olds | 44 (59.5%) | 30 (40.5%) |
| 35 Years and over | 19 (55.9%) | 15 (44.1%) |
| Total | 1,239 (84.9%) | 220 (15.1%) |
Educational Attainment by Field of Study in Raymond
Education (60 | 21.0%), business (46 | 16.1%), liberal arts & history (44 | 15.4%), arts & humanities (34 | 11.9%), and psychology (33 | 11.6%) are the most common fields of study among 285 individuals in Raymond who have obtained a bachelor's degree or higher.
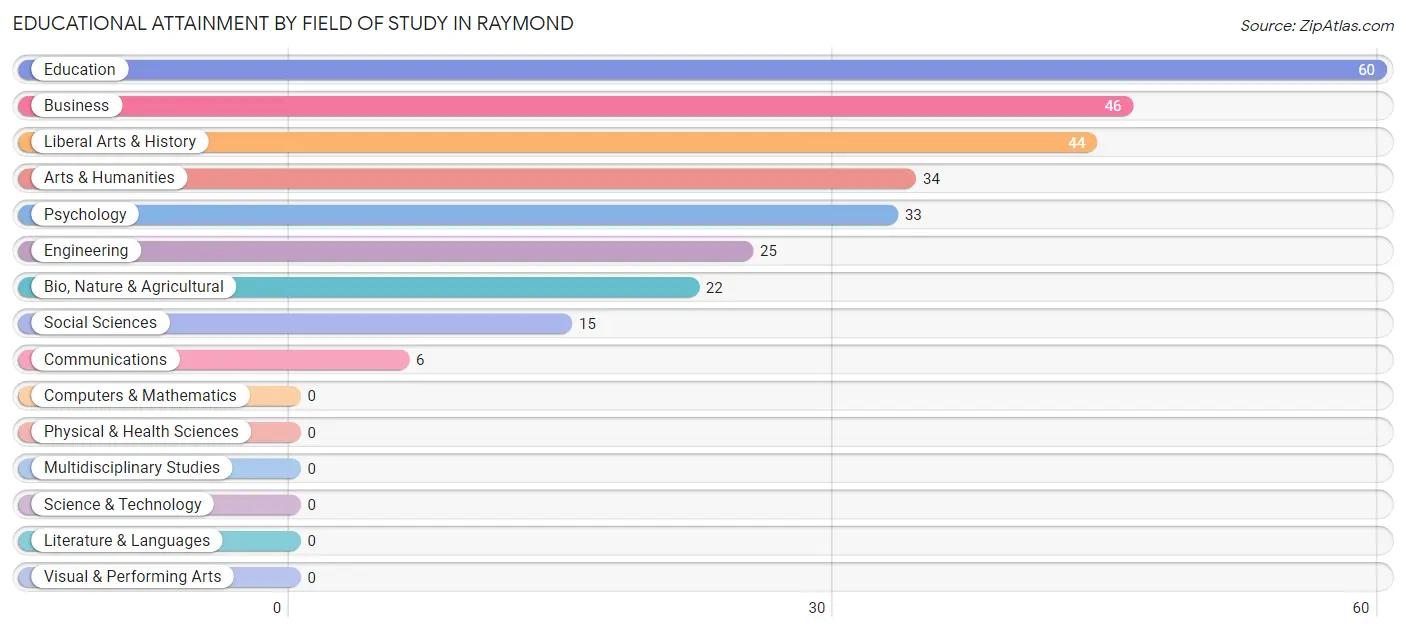
| Field of Study | # Graduates | % Graduates |
| Computers & Mathematics | 0 | 0.0% |
| Bio, Nature & Agricultural | 22 | 7.7% |
| Physical & Health Sciences | 0 | 0.0% |
| Psychology | 33 | 11.6% |
| Social Sciences | 15 | 5.3% |
| Engineering | 25 | 8.8% |
| Multidisciplinary Studies | 0 | 0.0% |
| Science & Technology | 0 | 0.0% |
| Business | 46 | 16.1% |
| Education | 60 | 21.0% |
| Literature & Languages | 0 | 0.0% |
| Liberal Arts & History | 44 | 15.4% |
| Visual & Performing Arts | 0 | 0.0% |
| Communications | 6 | 2.1% |
| Arts & Humanities | 34 | 11.9% |
| Total | 285 | 100.0% |
Transportation & Commute in Raymond
Vehicle Availability by Sex in Raymond
The most prevalent vehicle ownership categories in Raymond are males with 2 vehicles (58, accounting for 40.8%) and females with 2 vehicles (71, making up 27.0%).
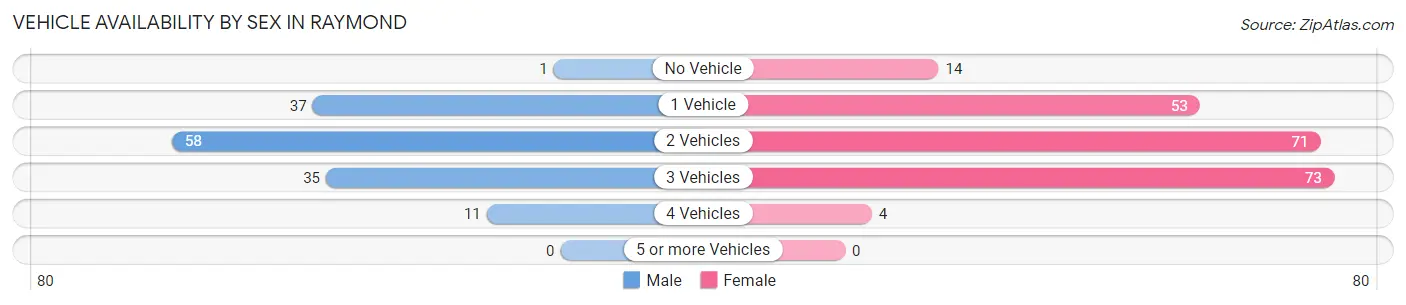
| Vehicles Available | Male | Female |
| No Vehicle | 1 (0.7%) | 14 (6.5%) |
| 1 Vehicle | 37 (26.1%) | 53 (24.6%) |
| 2 Vehicles | 58 (40.8%) | 71 (33.0%) |
| 3 Vehicles | 35 (24.6%) | 73 (34.0%) |
| 4 Vehicles | 11 (7.7%) | 4 (1.9%) |
| 5 or more Vehicles | 0 (0.0%) | 0 (0.0%) |
| Total | 142 (100.0%) | 215 (100.0%) |
Commute Time in Raymond
The most frequently occuring commute durations in Raymond are 5 to 9 minutes (128 commuters, 23.8%), 45 to 59 minutes (87 commuters, 16.2%), and less than 5 minutes (69 commuters, 12.8%).
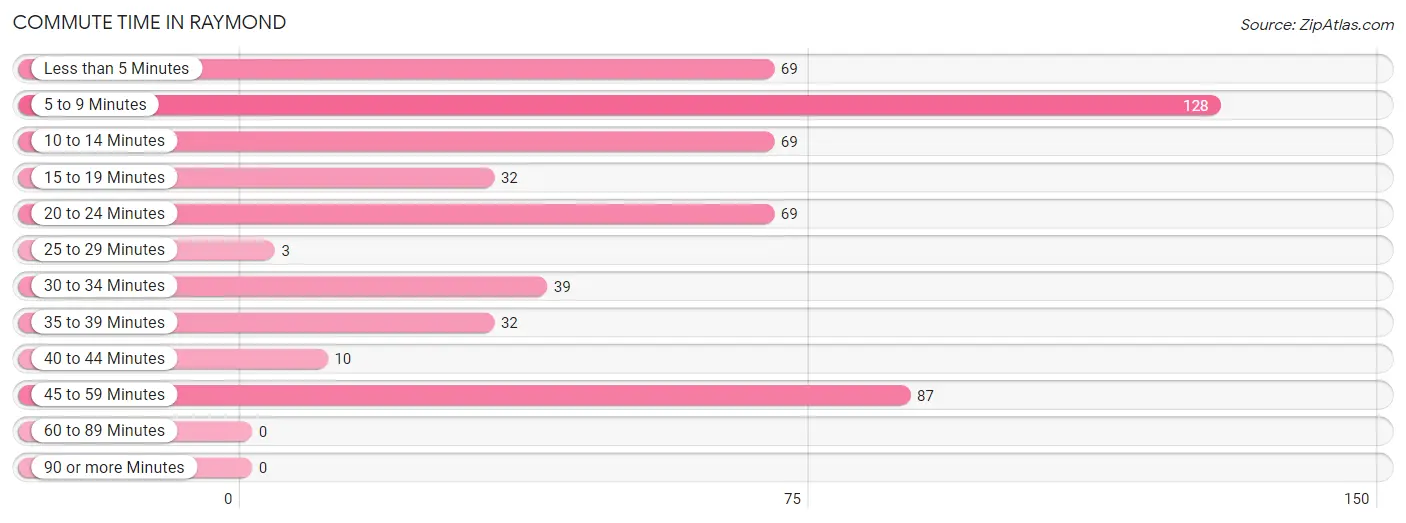
| Commute Time | # Commuters | % Commuters |
| Less than 5 Minutes | 69 | 12.8% |
| 5 to 9 Minutes | 128 | 23.8% |
| 10 to 14 Minutes | 69 | 12.8% |
| 15 to 19 Minutes | 32 | 5.9% |
| 20 to 24 Minutes | 69 | 12.8% |
| 25 to 29 Minutes | 3 | 0.6% |
| 30 to 34 Minutes | 39 | 7.2% |
| 35 to 39 Minutes | 32 | 5.9% |
| 40 to 44 Minutes | 10 | 1.9% |
| 45 to 59 Minutes | 87 | 16.2% |
| 60 to 89 Minutes | 0 | 0.0% |
| 90 or more Minutes | 0 | 0.0% |
Commute Time by Sex in Raymond
The most common commute times in Raymond are 45 to 59 minutes (84 commuters, 32.3%) for males and 5 to 9 minutes (99 commuters, 35.6%) for females.
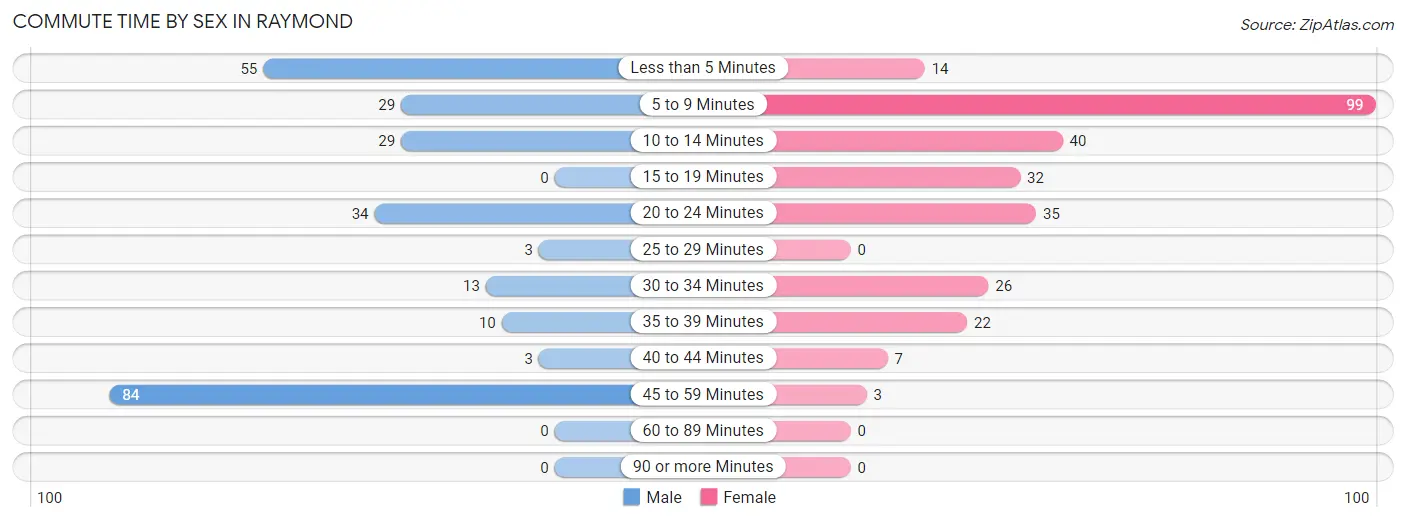
| Commute Time | Male | Female |
| Less than 5 Minutes | 55 (21.1%) | 14 (5.0%) |
| 5 to 9 Minutes | 29 (11.2%) | 99 (35.6%) |
| 10 to 14 Minutes | 29 (11.2%) | 40 (14.4%) |
| 15 to 19 Minutes | 0 (0.0%) | 32 (11.5%) |
| 20 to 24 Minutes | 34 (13.1%) | 35 (12.6%) |
| 25 to 29 Minutes | 3 (1.1%) | 0 (0.0%) |
| 30 to 34 Minutes | 13 (5.0%) | 26 (9.3%) |
| 35 to 39 Minutes | 10 (3.8%) | 22 (7.9%) |
| 40 to 44 Minutes | 3 (1.1%) | 7 (2.5%) |
| 45 to 59 Minutes | 84 (32.3%) | 3 (1.1%) |
| 60 to 89 Minutes | 0 (0.0%) | 0 (0.0%) |
| 90 or more Minutes | 0 (0.0%) | 0 (0.0%) |
Time of Departure to Work by Sex in Raymond
The most frequent times of departure to work in Raymond are 4:00 PM to 11:59 PM (66, 25.4%) for males and 12:00 PM to 3:59 PM (77, 27.7%) for females.
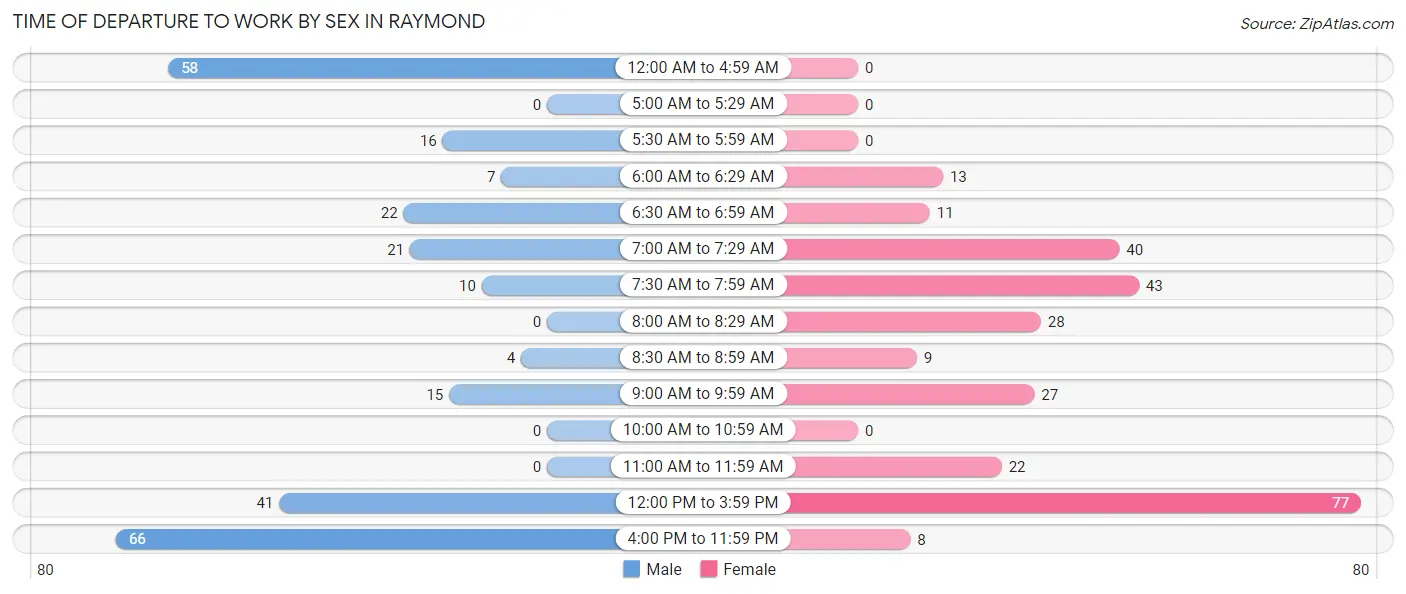
| Time of Departure | Male | Female |
| 12:00 AM to 4:59 AM | 58 (22.3%) | 0 (0.0%) |
| 5:00 AM to 5:29 AM | 0 (0.0%) | 0 (0.0%) |
| 5:30 AM to 5:59 AM | 16 (6.1%) | 0 (0.0%) |
| 6:00 AM to 6:29 AM | 7 (2.7%) | 13 (4.7%) |
| 6:30 AM to 6:59 AM | 22 (8.5%) | 11 (4.0%) |
| 7:00 AM to 7:29 AM | 21 (8.1%) | 40 (14.4%) |
| 7:30 AM to 7:59 AM | 10 (3.8%) | 43 (15.5%) |
| 8:00 AM to 8:29 AM | 0 (0.0%) | 28 (10.1%) |
| 8:30 AM to 8:59 AM | 4 (1.5%) | 9 (3.2%) |
| 9:00 AM to 9:59 AM | 15 (5.8%) | 27 (9.7%) |
| 10:00 AM to 10:59 AM | 0 (0.0%) | 0 (0.0%) |
| 11:00 AM to 11:59 AM | 0 (0.0%) | 22 (7.9%) |
| 12:00 PM to 3:59 PM | 41 (15.8%) | 77 (27.7%) |
| 4:00 PM to 11:59 PM | 66 (25.4%) | 8 (2.9%) |
| Total | 260 (100.0%) | 278 (100.0%) |
Housing Occupancy in Raymond
Occupancy by Ownership in Raymond
Of the total 343 dwellings in Raymond, owner-occupied units account for 212 (61.8%), while renter-occupied units make up 131 (38.2%).
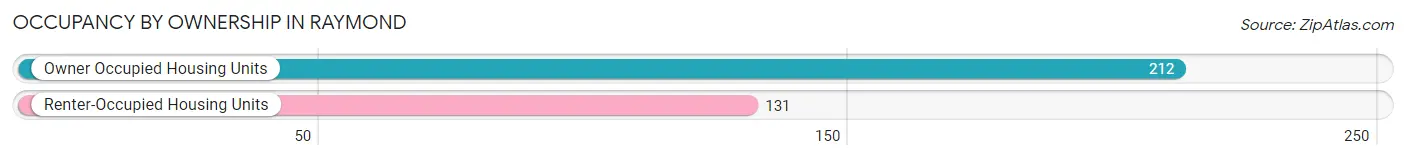
| Occupancy | # Housing Units | % Housing Units |
| Owner Occupied Housing Units | 212 | 61.8% |
| Renter-Occupied Housing Units | 131 | 38.2% |
| Total Occupied Housing Units | 343 | 100.0% |
Occupancy by Household Size in Raymond
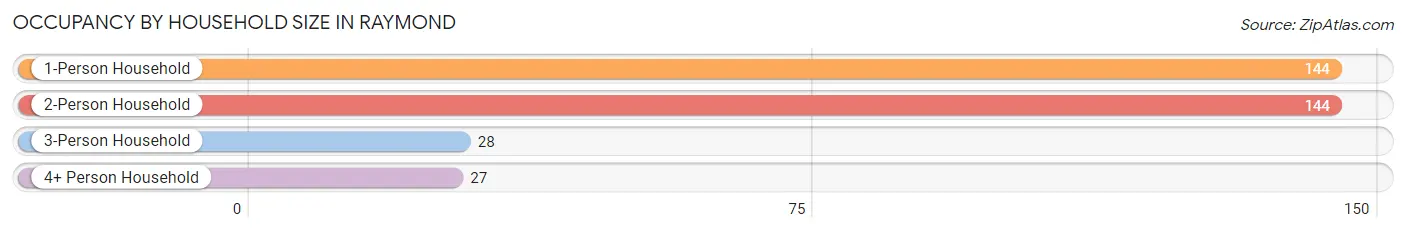
| Household Size | # Housing Units | % Housing Units |
| 1-Person Household | 144 | 42.0% |
| 2-Person Household | 144 | 42.0% |
| 3-Person Household | 28 | 8.2% |
| 4+ Person Household | 27 | 7.9% |
| Total Housing Units | 343 | 100.0% |
Occupancy by Ownership by Household Size in Raymond
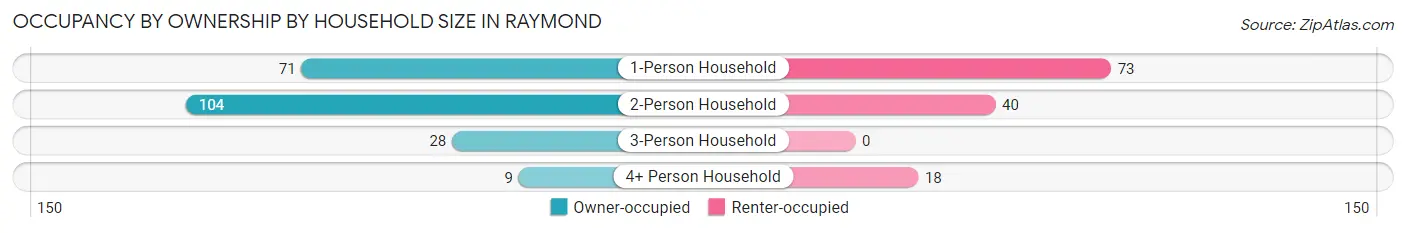
| Household Size | Owner-occupied | Renter-occupied |
| 1-Person Household | 71 (49.3%) | 73 (50.7%) |
| 2-Person Household | 104 (72.2%) | 40 (27.8%) |
| 3-Person Household | 28 (100.0%) | 0 (0.0%) |
| 4+ Person Household | 9 (33.3%) | 18 (66.7%) |
| Total Housing Units | 212 (61.8%) | 131 (38.2%) |
Occupancy by Educational Attainment in Raymond
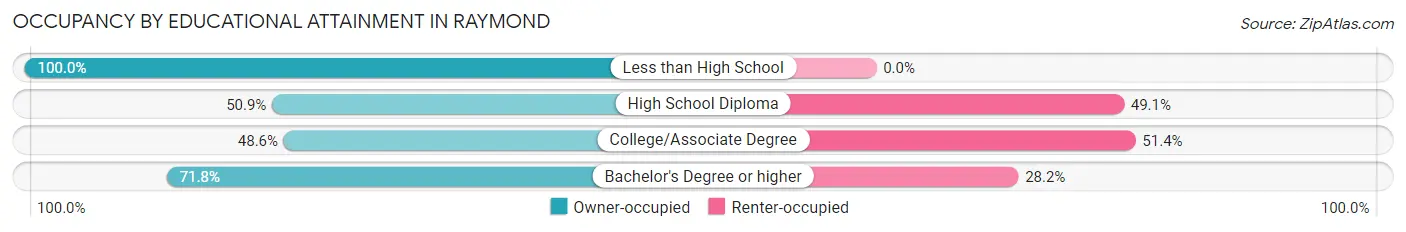
| Household Size | Owner-occupied | Renter-occupied |
| Less than High School | 7 (100.0%) | 0 (0.0%) |
| High School Diploma | 28 (50.9%) | 27 (49.1%) |
| College/Associate Degree | 52 (48.6%) | 55 (51.4%) |
| Bachelor's Degree or higher | 125 (71.8%) | 49 (28.2%) |
Occupancy by Age of Householder in Raymond
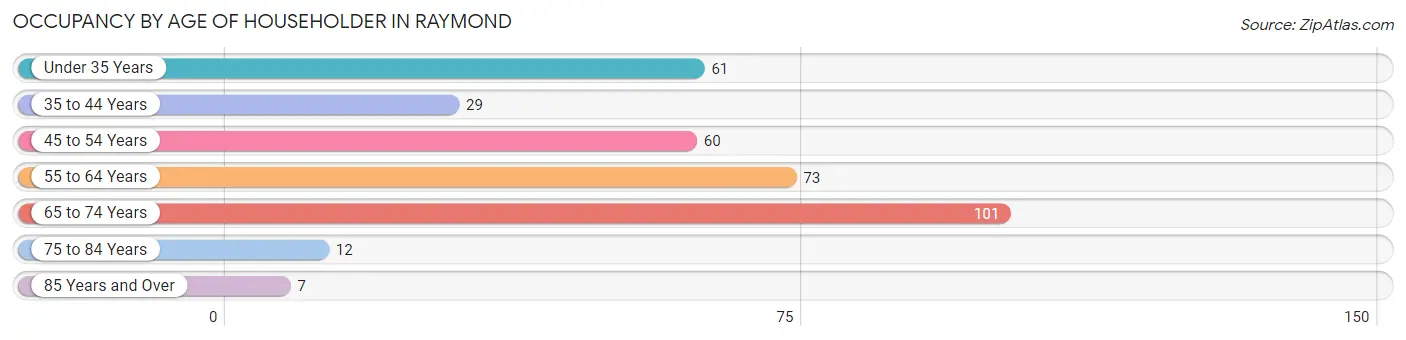
| Age Bracket | # Households | % Households |
| Under 35 Years | 61 | 17.8% |
| 35 to 44 Years | 29 | 8.5% |
| 45 to 54 Years | 60 | 17.5% |
| 55 to 64 Years | 73 | 21.3% |
| 65 to 74 Years | 101 | 29.4% |
| 75 to 84 Years | 12 | 3.5% |
| 85 Years and Over | 7 | 2.0% |
| Total | 343 | 100.0% |
Housing Finances in Raymond
Median Income by Occupancy in Raymond
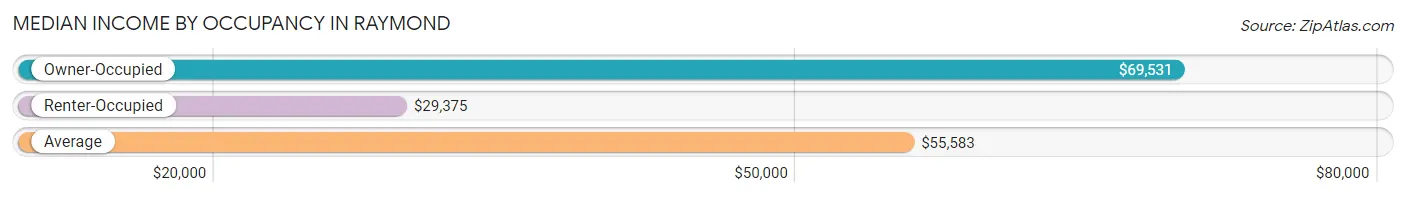
| Occupancy Type | # Households | Median Income |
| Owner-Occupied | 212 (61.8%) | $69,531 |
| Renter-Occupied | 131 (38.2%) | $29,375 |
| Average | 343 (100.0%) | $55,583 |
Occupancy by Householder Income Bracket in Raymond
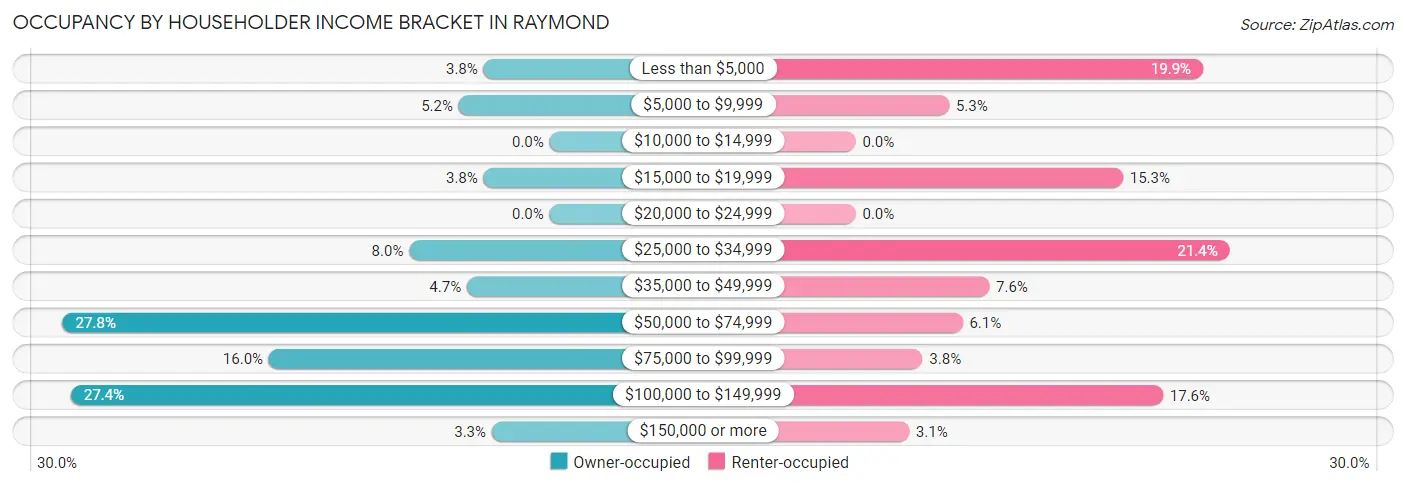
| Income Bracket | Owner-occupied | Renter-occupied |
| Less than $5,000 | 8 (3.8%) | 26 (19.9%) |
| $5,000 to $9,999 | 11 (5.2%) | 7 (5.3%) |
| $10,000 to $14,999 | 0 (0.0%) | 0 (0.0%) |
| $15,000 to $19,999 | 8 (3.8%) | 20 (15.3%) |
| $20,000 to $24,999 | 0 (0.0%) | 0 (0.0%) |
| $25,000 to $34,999 | 17 (8.0%) | 28 (21.4%) |
| $35,000 to $49,999 | 10 (4.7%) | 10 (7.6%) |
| $50,000 to $74,999 | 59 (27.8%) | 8 (6.1%) |
| $75,000 to $99,999 | 34 (16.0%) | 5 (3.8%) |
| $100,000 to $149,999 | 58 (27.4%) | 23 (17.6%) |
| $150,000 or more | 7 (3.3%) | 4 (3.0%) |
| Total | 212 (100.0%) | 131 (100.0%) |
Monthly Housing Cost Tiers in Raymond
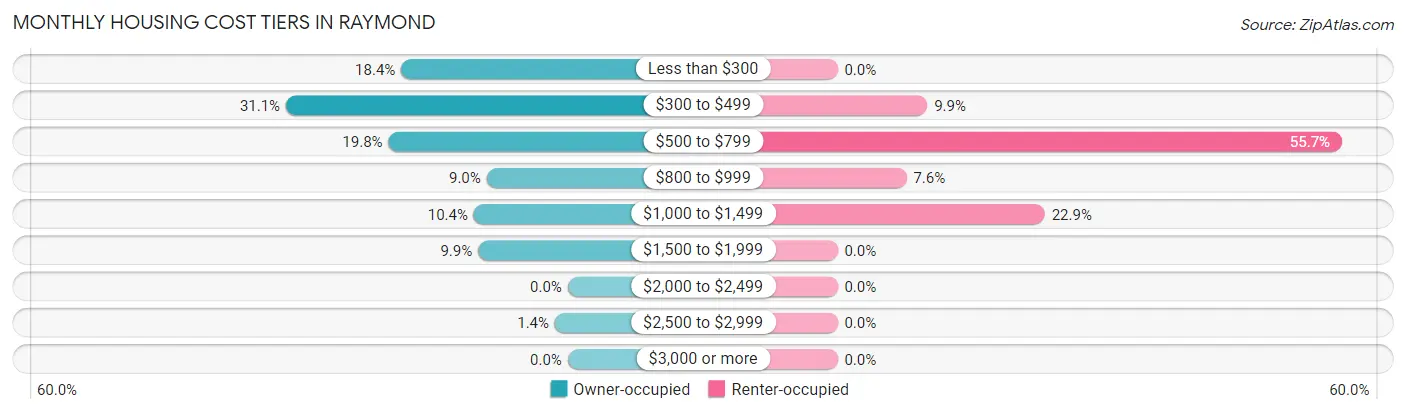
| Monthly Cost | Owner-occupied | Renter-occupied |
| Less than $300 | 39 (18.4%) | 0 (0.0%) |
| $300 to $499 | 66 (31.1%) | 13 (9.9%) |
| $500 to $799 | 42 (19.8%) | 73 (55.7%) |
| $800 to $999 | 19 (9.0%) | 10 (7.6%) |
| $1,000 to $1,499 | 22 (10.4%) | 30 (22.9%) |
| $1,500 to $1,999 | 21 (9.9%) | 0 (0.0%) |
| $2,000 to $2,499 | 0 (0.0%) | 0 (0.0%) |
| $2,500 to $2,999 | 3 (1.4%) | 0 (0.0%) |
| $3,000 or more | 0 (0.0%) | 0 (0.0%) |
| Total | 212 (100.0%) | 131 (100.0%) |
Physical Housing Characteristics in Raymond
Housing Structures in Raymond
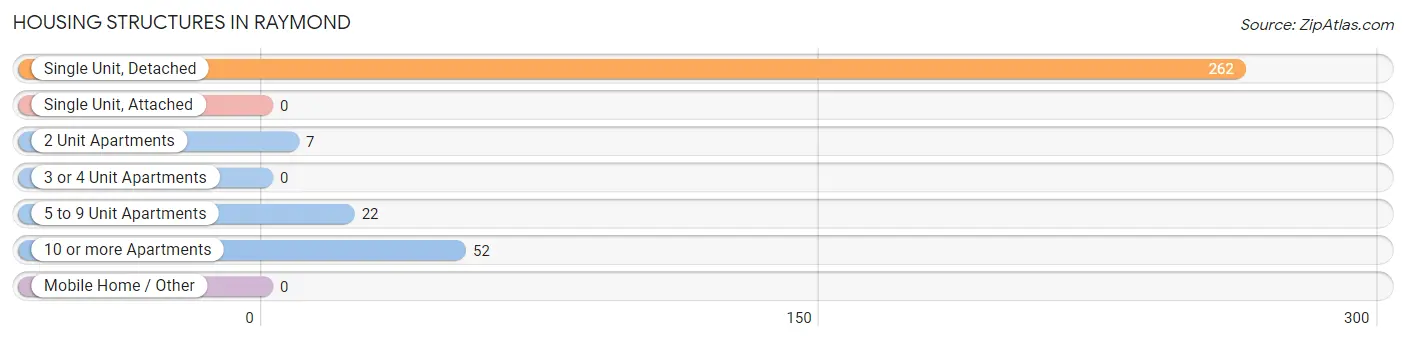
| Structure Type | # Housing Units | % Housing Units |
| Single Unit, Detached | 262 | 76.4% |
| Single Unit, Attached | 0 | 0.0% |
| 2 Unit Apartments | 7 | 2.0% |
| 3 or 4 Unit Apartments | 0 | 0.0% |
| 5 to 9 Unit Apartments | 22 | 6.4% |
| 10 or more Apartments | 52 | 15.2% |
| Mobile Home / Other | 0 | 0.0% |
| Total | 343 | 100.0% |
Housing Structures by Occupancy in Raymond
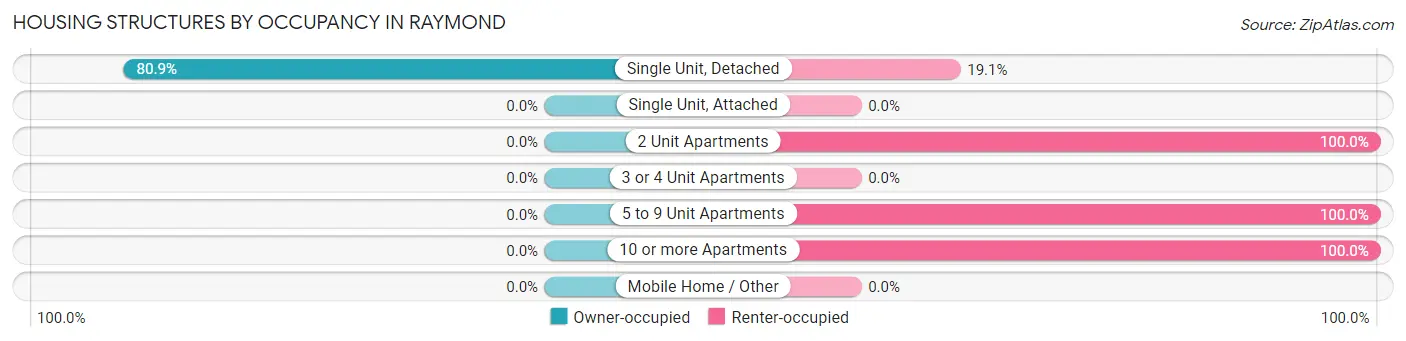
| Structure Type | Owner-occupied | Renter-occupied |
| Single Unit, Detached | 212 (80.9%) | 50 (19.1%) |
| Single Unit, Attached | 0 (0.0%) | 0 (0.0%) |
| 2 Unit Apartments | 0 (0.0%) | 7 (100.0%) |
| 3 or 4 Unit Apartments | 0 (0.0%) | 0 (0.0%) |
| 5 to 9 Unit Apartments | 0 (0.0%) | 22 (100.0%) |
| 10 or more Apartments | 0 (0.0%) | 52 (100.0%) |
| Mobile Home / Other | 0 (0.0%) | 0 (0.0%) |
| Total | 212 (61.8%) | 131 (38.2%) |
Housing Structures by Number of Rooms in Raymond
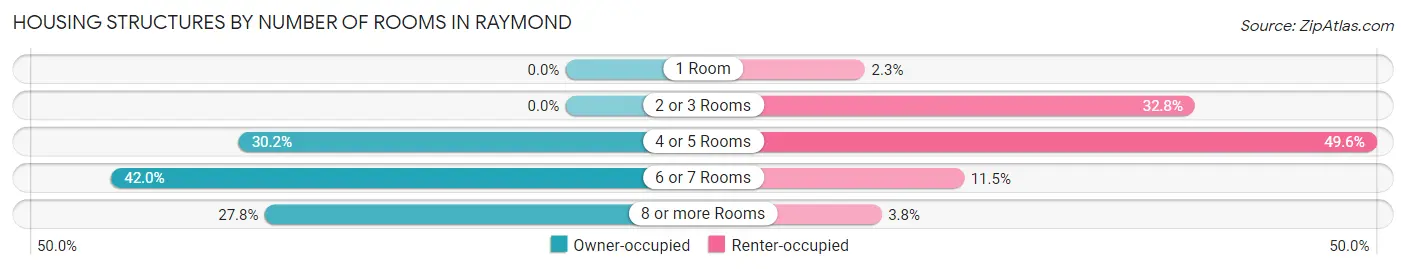
| Number of Rooms | Owner-occupied | Renter-occupied |
| 1 Room | 0 (0.0%) | 3 (2.3%) |
| 2 or 3 Rooms | 0 (0.0%) | 43 (32.8%) |
| 4 or 5 Rooms | 64 (30.2%) | 65 (49.6%) |
| 6 or 7 Rooms | 89 (42.0%) | 15 (11.5%) |
| 8 or more Rooms | 59 (27.8%) | 5 (3.8%) |
| Total | 212 (100.0%) | 131 (100.0%) |
Housing Structure by Heating Type in Raymond
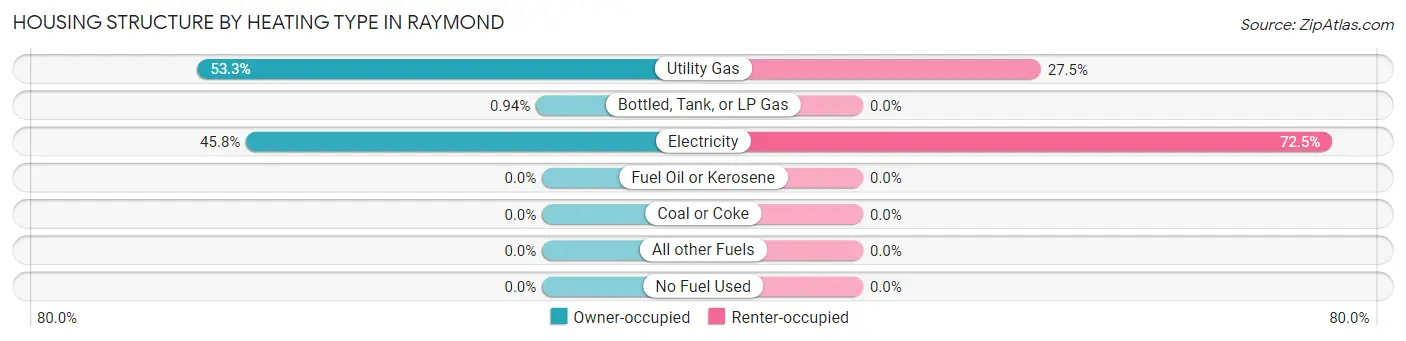
| Heating Type | Owner-occupied | Renter-occupied |
| Utility Gas | 113 (53.3%) | 36 (27.5%) |
| Bottled, Tank, or LP Gas | 2 (0.9%) | 0 (0.0%) |
| Electricity | 97 (45.8%) | 95 (72.5%) |
| Fuel Oil or Kerosene | 0 (0.0%) | 0 (0.0%) |
| Coal or Coke | 0 (0.0%) | 0 (0.0%) |
| All other Fuels | 0 (0.0%) | 0 (0.0%) |
| No Fuel Used | 0 (0.0%) | 0 (0.0%) |
| Total | 212 (100.0%) | 131 (100.0%) |
Household Vehicle Usage in Raymond
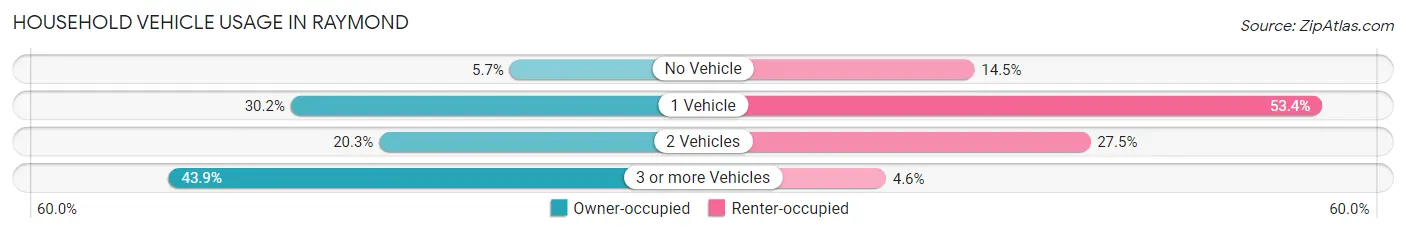
| Vehicles per Household | Owner-occupied | Renter-occupied |
| No Vehicle | 12 (5.7%) | 19 (14.5%) |
| 1 Vehicle | 64 (30.2%) | 70 (53.4%) |
| 2 Vehicles | 43 (20.3%) | 36 (27.5%) |
| 3 or more Vehicles | 93 (43.9%) | 6 (4.6%) |
| Total | 212 (100.0%) | 131 (100.0%) |
Real Estate & Mortgages in Raymond
Real Estate and Mortgage Overview in Raymond
| Characteristic | Without Mortgage | With Mortgage |
| Housing Units | 142 | 70 |
| Median Property Value | $147,400 | $207,400 |
| Median Household Income | $56,250 | $5 |
| Monthly Housing Costs | $396 | $0 |
| Real Estate Taxes | $1,236 | $6 |
Property Value by Mortgage Status in Raymond
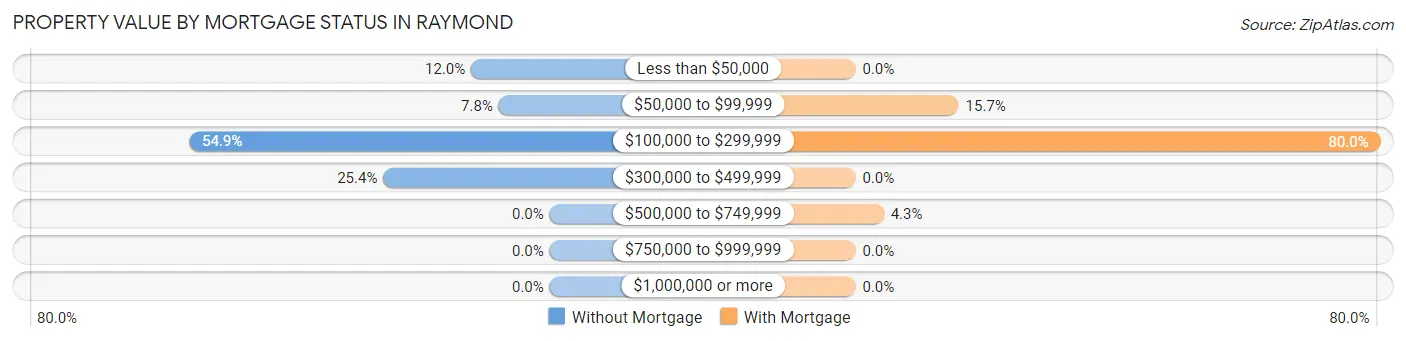
| Property Value | Without Mortgage | With Mortgage |
| Less than $50,000 | 17 (12.0%) | 0 (0.0%) |
| $50,000 to $99,999 | 11 (7.7%) | 11 (15.7%) |
| $100,000 to $299,999 | 78 (54.9%) | 56 (80.0%) |
| $300,000 to $499,999 | 36 (25.4%) | 0 (0.0%) |
| $500,000 to $749,999 | 0 (0.0%) | 3 (4.3%) |
| $750,000 to $999,999 | 0 (0.0%) | 0 (0.0%) |
| $1,000,000 or more | 0 (0.0%) | 0 (0.0%) |
| Total | 142 (100.0%) | 70 (100.0%) |
Household Income by Mortgage Status in Raymond
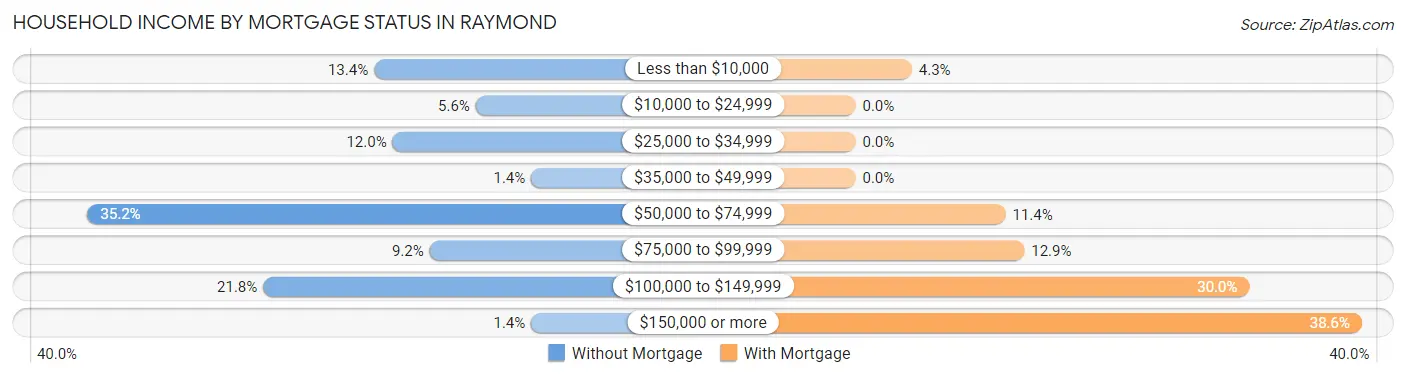
| Household Income | Without Mortgage | With Mortgage |
| Less than $10,000 | 19 (13.4%) | 3 (4.3%) |
| $10,000 to $24,999 | 8 (5.6%) | 0 (0.0%) |
| $25,000 to $34,999 | 17 (12.0%) | 0 (0.0%) |
| $35,000 to $49,999 | 2 (1.4%) | 0 (0.0%) |
| $50,000 to $74,999 | 50 (35.2%) | 8 (11.4%) |
| $75,000 to $99,999 | 13 (9.1%) | 9 (12.9%) |
| $100,000 to $149,999 | 31 (21.8%) | 21 (30.0%) |
| $150,000 or more | 2 (1.4%) | 27 (38.6%) |
| Total | 142 (100.0%) | 70 (100.0%) |
Property Value to Household Income Ratio in Raymond
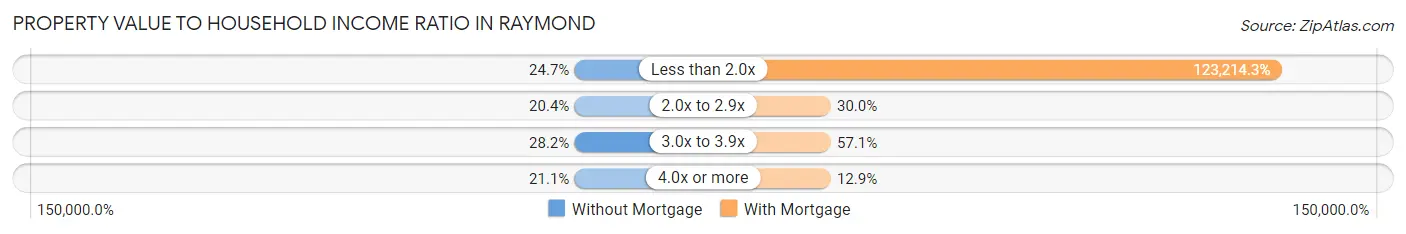
| Value-to-Income Ratio | Without Mortgage | With Mortgage |
| Less than 2.0x | 35 (24.6%) | 86,250 (123,214.3%) |
| 2.0x to 2.9x | 29 (20.4%) | 21 (30.0%) |
| 3.0x to 3.9x | 40 (28.2%) | 40 (57.1%) |
| 4.0x or more | 30 (21.1%) | 9 (12.9%) |
| Total | 142 (100.0%) | 70 (100.0%) |
Real Estate Taxes by Mortgage Status in Raymond
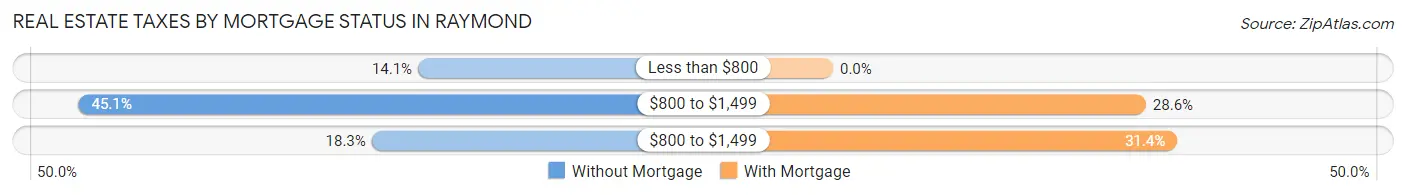
| Property Taxes | Without Mortgage | With Mortgage |
| Less than $800 | 20 (14.1%) | 0 (0.0%) |
| $800 to $1,499 | 64 (45.1%) | 20 (28.6%) |
| $800 to $1,499 | 26 (18.3%) | 22 (31.4%) |
| Total | 142 (100.0%) | 70 (100.0%) |
Health & Disability in Raymond
Health Insurance Coverage by Age in Raymond
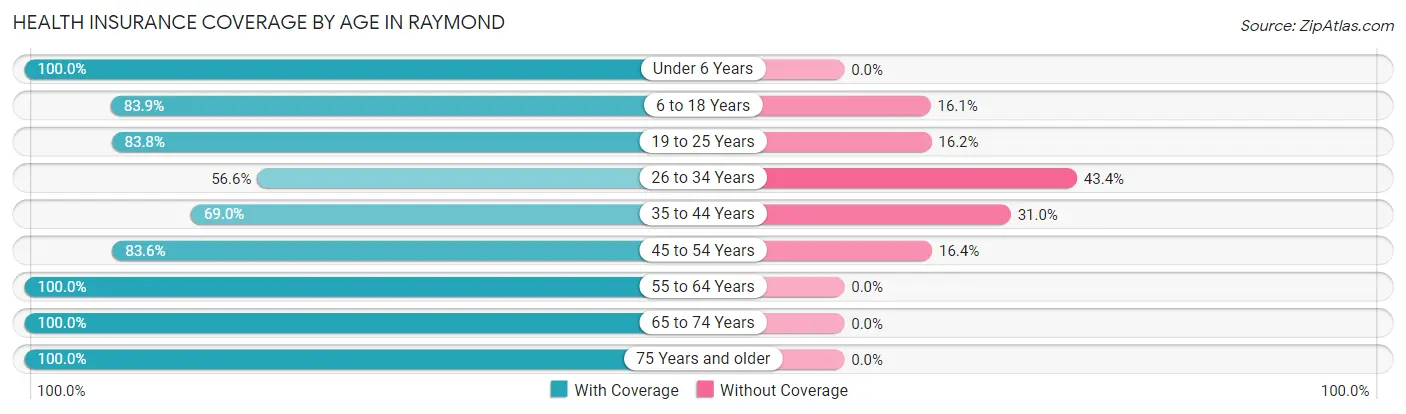
| Age Bracket | With Coverage | Without Coverage |
| Under 6 Years | 5 (100.0%) | 0 (0.0%) |
| 6 to 18 Years | 355 (83.9%) | 68 (16.1%) |
| 19 to 25 Years | 800 (83.8%) | 155 (16.2%) |
| 26 to 34 Years | 77 (56.6%) | 59 (43.4%) |
| 35 to 44 Years | 40 (69.0%) | 18 (31.0%) |
| 45 to 54 Years | 92 (83.6%) | 18 (16.4%) |
| 55 to 64 Years | 123 (100.0%) | 0 (0.0%) |
| 65 to 74 Years | 133 (100.0%) | 0 (0.0%) |
| 75 Years and older | 31 (100.0%) | 0 (0.0%) |
| Total | 1,656 (83.9%) | 318 (16.1%) |
Health Insurance Coverage by Citizenship Status in Raymond
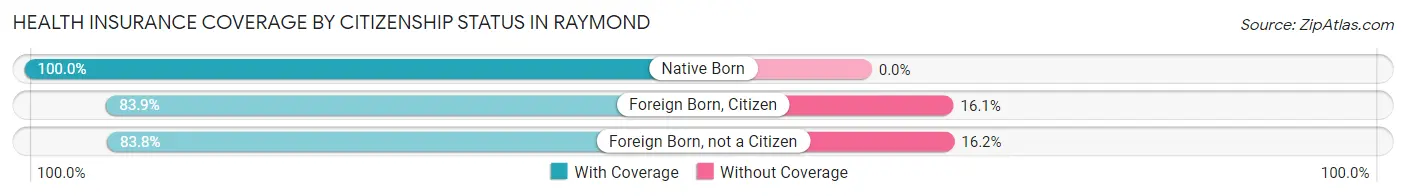
| Citizenship Status | With Coverage | Without Coverage |
| Native Born | 5 (100.0%) | 0 (0.0%) |
| Foreign Born, Citizen | 355 (83.9%) | 68 (16.1%) |
| Foreign Born, not a Citizen | 800 (83.8%) | 155 (16.2%) |
Health Insurance Coverage by Household Income in Raymond
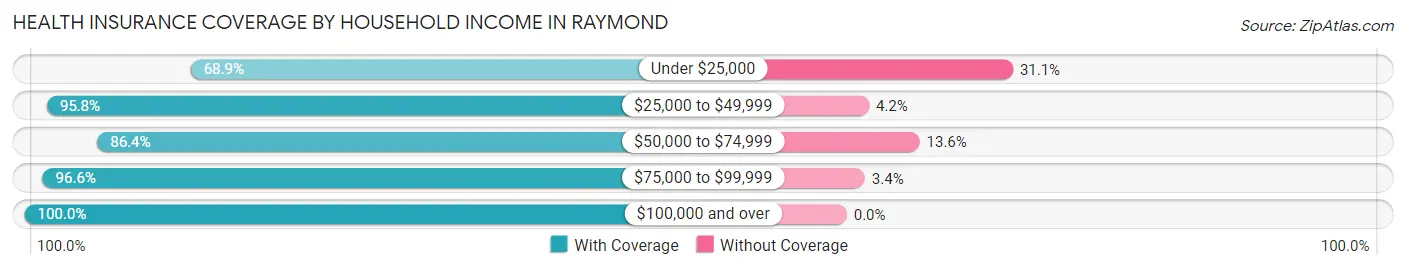
| Household Income | With Coverage | Without Coverage |
| Under $25,000 | 73 (68.9%) | 33 (31.1%) |
| $25,000 to $49,999 | 92 (95.8%) | 4 (4.2%) |
| $50,000 to $74,999 | 152 (86.4%) | 24 (13.6%) |
| $75,000 to $99,999 | 57 (96.6%) | 2 (3.4%) |
| $100,000 and over | 214 (100.0%) | 0 (0.0%) |
Public vs Private Health Insurance Coverage by Age in Raymond
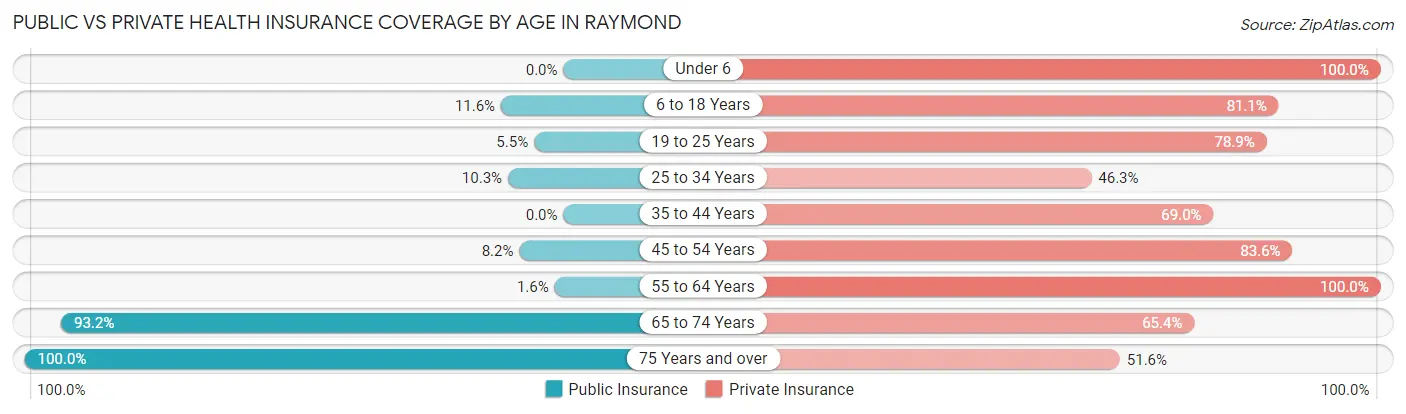
| Age Bracket | Public Insurance | Private Insurance |
| Under 6 | 0 (0.0%) | 5 (100.0%) |
| 6 to 18 Years | 49 (11.6%) | 343 (81.1%) |
| 19 to 25 Years | 52 (5.4%) | 753 (78.8%) |
| 25 to 34 Years | 14 (10.3%) | 63 (46.3%) |
| 35 to 44 Years | 0 (0.0%) | 40 (69.0%) |
| 45 to 54 Years | 9 (8.2%) | 92 (83.6%) |
| 55 to 64 Years | 2 (1.6%) | 123 (100.0%) |
| 65 to 74 Years | 124 (93.2%) | 87 (65.4%) |
| 75 Years and over | 31 (100.0%) | 16 (51.6%) |
| Total | 281 (14.2%) | 1,522 (77.1%) |
Disability Status by Sex by Age in Raymond
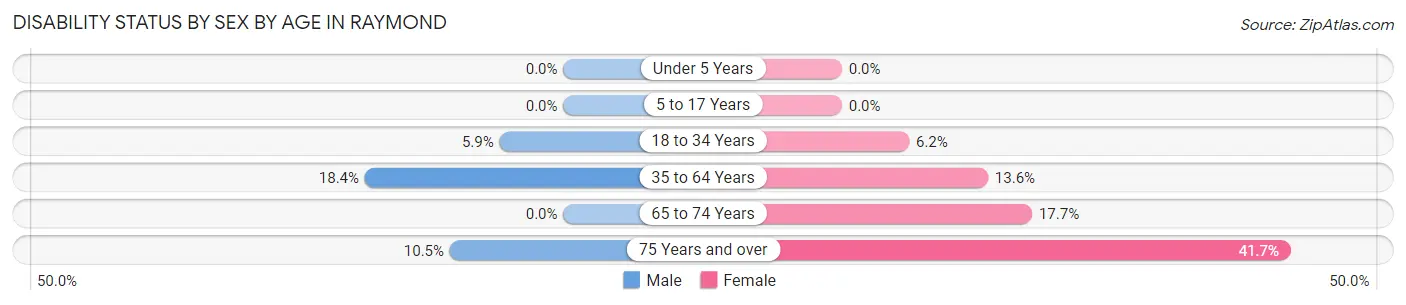
| Age Bracket | Male | Female |
| Under 5 Years | 0 (0.0%) | 0 (0.0%) |
| 5 to 17 Years | 0 (0.0%) | 0 (0.0%) |
| 18 to 34 Years | 50 (5.9%) | 38 (6.2%) |
| 35 to 64 Years | 21 (18.4%) | 24 (13.6%) |
| 65 to 74 Years | 0 (0.0%) | 15 (17.6%) |
| 75 Years and over | 2 (10.5%) | 5 (41.7%) |
Disability Class by Sex by Age in Raymond
Disability Class: Hearing Difficulty
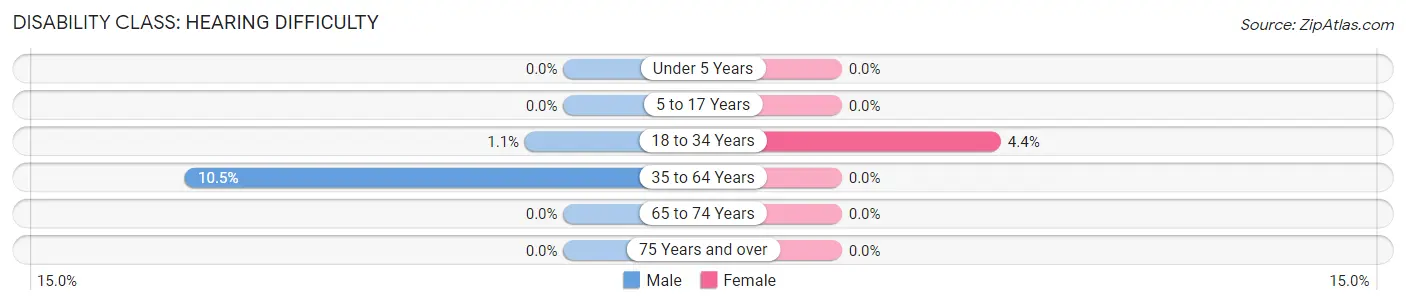
| Age Bracket | Male | Female |
| Under 5 Years | 0 (0.0%) | 0 (0.0%) |
| 5 to 17 Years | 0 (0.0%) | 0 (0.0%) |
| 18 to 34 Years | 9 (1.1%) | 27 (4.4%) |
| 35 to 64 Years | 12 (10.5%) | 0 (0.0%) |
| 65 to 74 Years | 0 (0.0%) | 0 (0.0%) |
| 75 Years and over | 0 (0.0%) | 0 (0.0%) |
Disability Class: Vision Difficulty
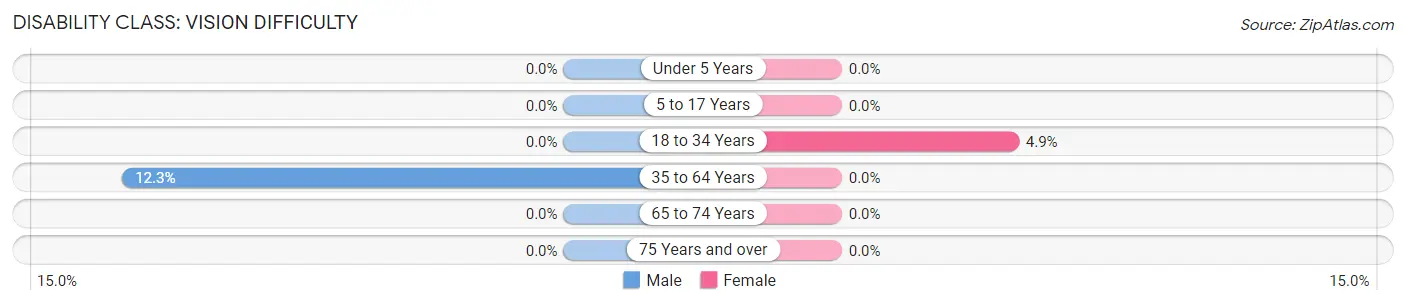
| Age Bracket | Male | Female |
| Under 5 Years | 0 (0.0%) | 0 (0.0%) |
| 5 to 17 Years | 0 (0.0%) | 0 (0.0%) |
| 18 to 34 Years | 0 (0.0%) | 30 (4.9%) |
| 35 to 64 Years | 14 (12.3%) | 0 (0.0%) |
| 65 to 74 Years | 0 (0.0%) | 0 (0.0%) |
| 75 Years and over | 0 (0.0%) | 0 (0.0%) |
Disability Class: Cognitive Difficulty
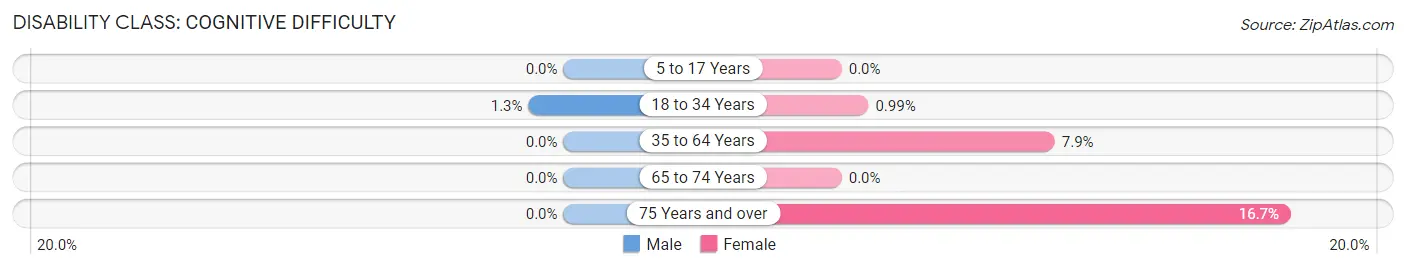
| Age Bracket | Male | Female |
| 5 to 17 Years | 0 (0.0%) | 0 (0.0%) |
| 18 to 34 Years | 11 (1.3%) | 6 (1.0%) |
| 35 to 64 Years | 0 (0.0%) | 14 (7.9%) |
| 65 to 74 Years | 0 (0.0%) | 0 (0.0%) |
| 75 Years and over | 0 (0.0%) | 2 (16.7%) |
Disability Class: Ambulatory Difficulty
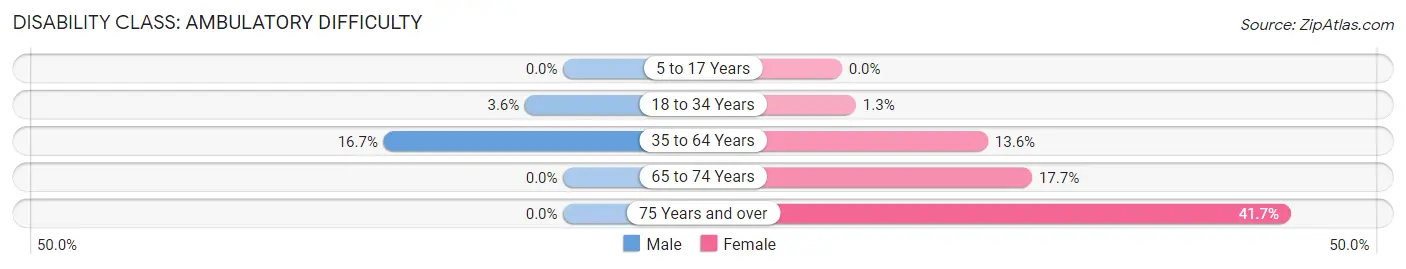
| Age Bracket | Male | Female |
| 5 to 17 Years | 0 (0.0%) | 0 (0.0%) |
| 18 to 34 Years | 30 (3.5%) | 8 (1.3%) |
| 35 to 64 Years | 19 (16.7%) | 24 (13.6%) |
| 65 to 74 Years | 0 (0.0%) | 15 (17.6%) |
| 75 Years and over | 0 (0.0%) | 5 (41.7%) |
Disability Class: Self-Care Difficulty
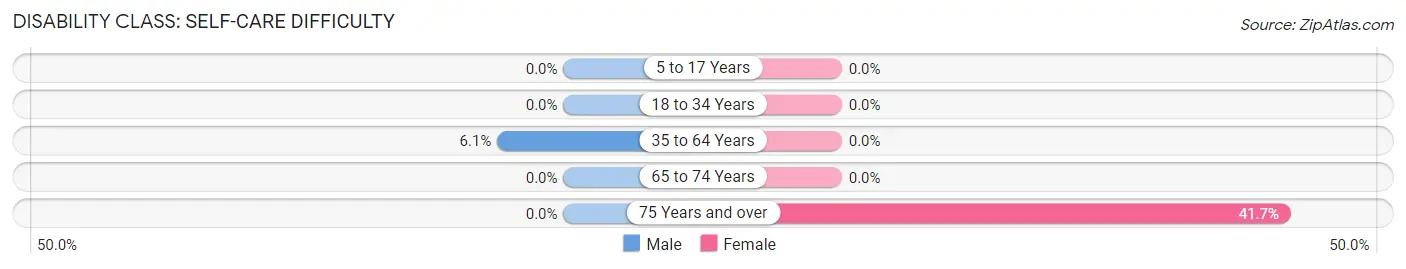
| Age Bracket | Male | Female |
| 5 to 17 Years | 0 (0.0%) | 0 (0.0%) |
| 18 to 34 Years | 0 (0.0%) | 0 (0.0%) |
| 35 to 64 Years | 7 (6.1%) | 0 (0.0%) |
| 65 to 74 Years | 0 (0.0%) | 0 (0.0%) |
| 75 Years and over | 0 (0.0%) | 5 (41.7%) |
Technology Access in Raymond
Computing Device Access in Raymond
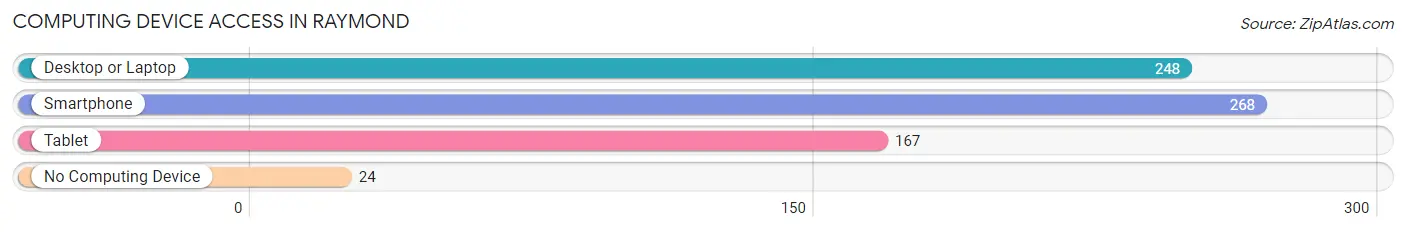
| Device Type | # Households | % Households |
| Desktop or Laptop | 248 | 72.3% |
| Smartphone | 268 | 78.1% |
| Tablet | 167 | 48.7% |
| No Computing Device | 24 | 7.0% |
| Total | 343 | 100.0% |
Internet Access in Raymond
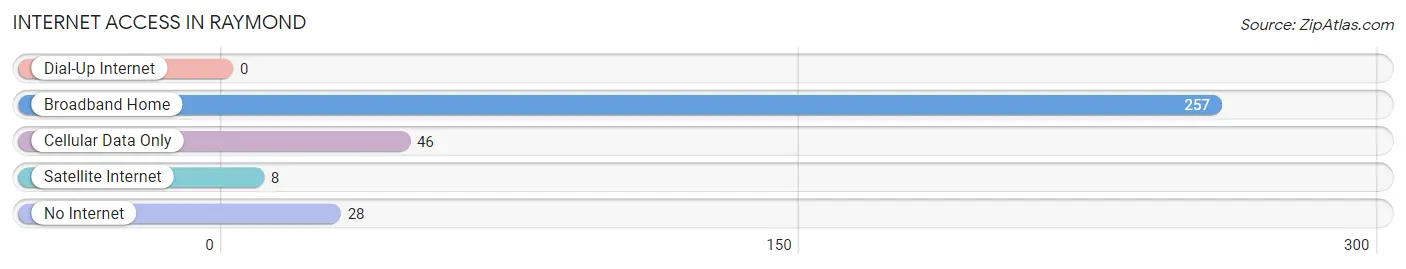
| Internet Type | # Households | % Households |
| Dial-Up Internet | 0 | 0.0% |
| Broadband Home | 257 | 74.9% |
| Cellular Data Only | 46 | 13.4% |
| Satellite Internet | 8 | 2.3% |
| No Internet | 28 | 8.2% |
| Total | 343 | 100.0% |
Raymond Summary
Raymond, Mississippi is a small town located in Hinds County, Mississippi. It is situated approximately 20 miles southwest of Jackson, the state capital. The town was founded in 1829 and is named after Colonel James Raymond, a prominent local landowner. The population of Raymond was 2,923 at the 2010 census.
Geography
Raymond is located at 32°22'25" North, 90°25'45" West (32.373611, -90.429167). It is situated in the central part of Hinds County, approximately 20 miles southwest of Jackson, the state capital. The town is located on the banks of the Pearl River, which is a tributary of the Mississippi River. The town is surrounded by rolling hills and is located in the Piney Woods region of Mississippi.
The town has a total area of 2.2 square miles, all of which is land. The town is located in the Central Time Zone and observes Daylight Saving Time.
Economy
The economy of Raymond is largely based on agriculture and manufacturing. The town is home to several small businesses, including a lumber mill, a feed mill, and a cotton gin. The town also has a small retail sector, with several stores and restaurants.
The town is also home to a number of small farms, which produce a variety of crops, including cotton, corn, soybeans, and wheat. The town is also home to a number of poultry farms, which produce eggs and poultry products.
Demographics
As of the 2010 census, the population of Raymond was 2,923. The racial makeup of the town was 79.2% White, 18.3% African American, 0.3% Native American, 0.2% Asian, 0.1% Pacific Islander, 0.7% from other races, and 1.4% from two or more races. Hispanic or Latino of any race were 1.7% of the population.
The median income for a household in Raymond was $31,250, and the median income for a family was $37,500. The per capita income for the town was $15,945. About 17.2% of families and 20.2% of the population were below the poverty line, including 28.3% of those under age 18 and 15.2% of those age 65 or over.
Education
Raymond is served by the Hinds County School District. The town is home to Raymond High School, which serves students in grades 9-12. The town is also home to Raymond Elementary School, which serves students in grades K-8.
Conclusion
Raymond, Mississippi is a small town located in Hinds County, Mississippi. It is situated approximately 20 miles southwest of Jackson, the state capital. The town was founded in 1829 and is named after Colonel James Raymond, a prominent local landowner. The population of Raymond was 2,923 at the 2010 census. The town is largely based on agriculture and manufacturing, and is home to several small businesses, farms, and retail stores. The town is served by the Hinds County School District, and is home to Raymond High School and Raymond Elementary School.
Common Questions
What is Per Capita Income in Raymond?
Per Capita income in Raymond is $13,632.
What is the Median Family Income in Raymond?
Median Family Income in Raymond is $69,844.
What is the Median Household income in Raymond?
Median Household Income in Raymond is $55,583.
What is Inequality or Gini Index in Raymond?
Inequality or Gini Index in Raymond is 0.41.
What is the Total Population of Raymond?
Total Population of Raymond is 1,974.
What is the Total Male Population of Raymond?
Total Male Population of Raymond is 1,059.
What is the Total Female Population of Raymond?
Total Female Population of Raymond is 915.
What is the Ratio of Males per 100 Females in Raymond?
There are 115.74 Males per 100 Females in Raymond.
What is the Ratio of Females per 100 Males in Raymond?
There are 86.40 Females per 100 Males in Raymond.
What is the Median Population Age in Raymond?
Median Population Age in Raymond is 21.1 Years.
What is the Average Family Size in Raymond
Average Family Size in Raymond is 2.6 People.
What is the Average Household Size in Raymond
Average Household Size in Raymond is 1.9 People.
How Large is the Labor Force in Raymond?
There are 624 People in the Labor Forcein in Raymond.
What is the Percentage of People in the Labor Force in Raymond?
32.1% of People are in the Labor Force in Raymond.
What is the Unemployment Rate in Raymond?
Unemployment Rate in Raymond is 6.7%.