Woodland, MS Map & Demographics
Woodland Map
Woodland Overview
$39,536
PER CAPITA INCOME
26.9%
WAGE / INCOME GAP [ % ]
73.1¢/ $1
WAGE / INCOME GAP [ $ ]
0.35
INEQUALITY / GINI INDEX
157
TOTAL POPULATION
92
MALE POPULATION
65
FEMALE POPULATION
141.54
MALES / 100 FEMALES
70.65
FEMALES / 100 MALES
43.0
MEDIAN AGE
2.4
AVG FAMILY SIZE
2.0
AVG HOUSEHOLD SIZE
114
LABOR FORCE [ PEOPLE ]
77.6%
PERCENT IN LABOR FORCE
6.1%
UNEMPLOYMENT RATE
Woodland Zip Codes
Woodland Area Codes
Income in Woodland
Income Overview in Woodland
| Characteristic | Number | Measure |
| Per Capita Income | 157 | $39,536 |
| Median Family Income | 54 | $0 |
| Mean Family Income | 54 | $113,526 |
| Median Household Income | 79 | $0 |
| Mean Household Income | 79 | $90,241 |
| Income Deficit | 54 | $0 |
| Wage / Income Gap (%) | 157 | 26.94% |
| Wage / Income Gap ($) | 157 | 73.06¢ per $1 |
| Gini / Inequality Index | 157 | 0.35 |
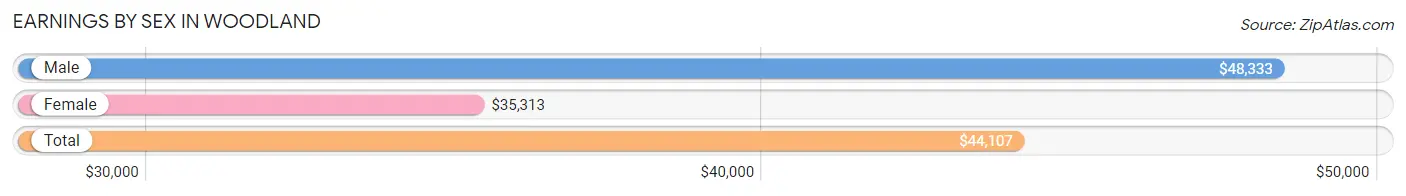
Earnings by Sex in Woodland
Average Earnings in Woodland are $44,107, $48,333 for men and $35,313 for women, a difference of 26.9%.
| Sex | Number | Average Earnings |
| Male | 64 (58.7%) | $48,333 |
| Female | 45 (41.3%) | $35,313 |
| Total | 109 (100.0%) | $44,107 |
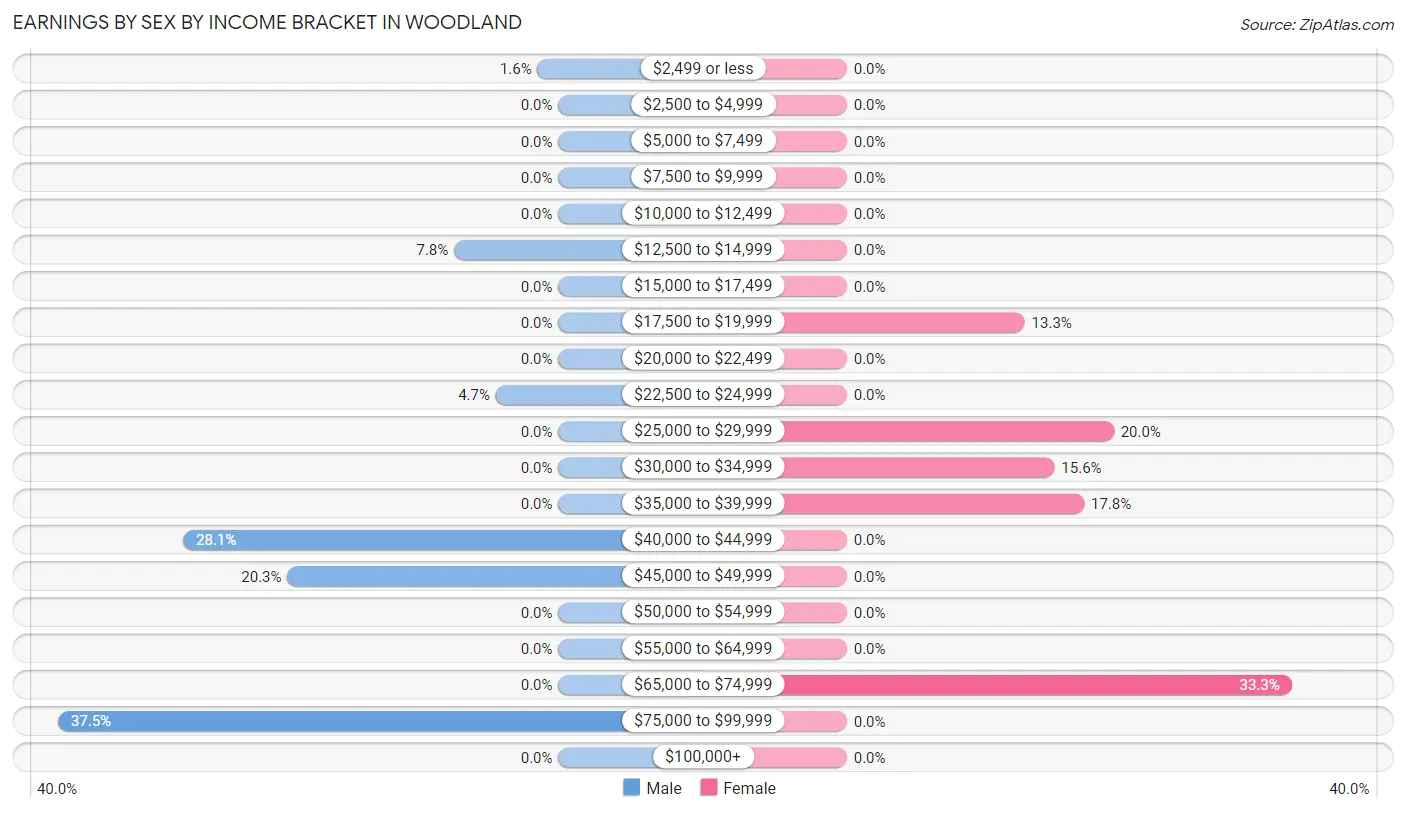
Earnings by Sex by Income Bracket in Woodland
The most common earnings brackets in Woodland are $75,000 to $99,999 for men (24 | 37.5%) and $65,000 to $74,999 for women (15 | 33.3%).
| Income | Male | Female |
| $2,499 or less | 1 (1.6%) | 0 (0.0%) |
| $2,500 to $4,999 | 0 (0.0%) | 0 (0.0%) |
| $5,000 to $7,499 | 0 (0.0%) | 0 (0.0%) |
| $7,500 to $9,999 | 0 (0.0%) | 0 (0.0%) |
| $10,000 to $12,499 | 0 (0.0%) | 0 (0.0%) |
| $12,500 to $14,999 | 5 (7.8%) | 0 (0.0%) |
| $15,000 to $17,499 | 0 (0.0%) | 0 (0.0%) |
| $17,500 to $19,999 | 0 (0.0%) | 6 (13.3%) |
| $20,000 to $22,499 | 0 (0.0%) | 0 (0.0%) |
| $22,500 to $24,999 | 3 (4.7%) | 0 (0.0%) |
| $25,000 to $29,999 | 0 (0.0%) | 9 (20.0%) |
| $30,000 to $34,999 | 0 (0.0%) | 7 (15.6%) |
| $35,000 to $39,999 | 0 (0.0%) | 8 (17.8%) |
| $40,000 to $44,999 | 18 (28.1%) | 0 (0.0%) |
| $45,000 to $49,999 | 13 (20.3%) | 0 (0.0%) |
| $50,000 to $54,999 | 0 (0.0%) | 0 (0.0%) |
| $55,000 to $64,999 | 0 (0.0%) | 0 (0.0%) |
| $65,000 to $74,999 | 0 (0.0%) | 15 (33.3%) |
| $75,000 to $99,999 | 24 (37.5%) | 0 (0.0%) |
| $100,000+ | 0 (0.0%) | 0 (0.0%) |
| Total | 64 (100.0%) | 45 (100.0%) |
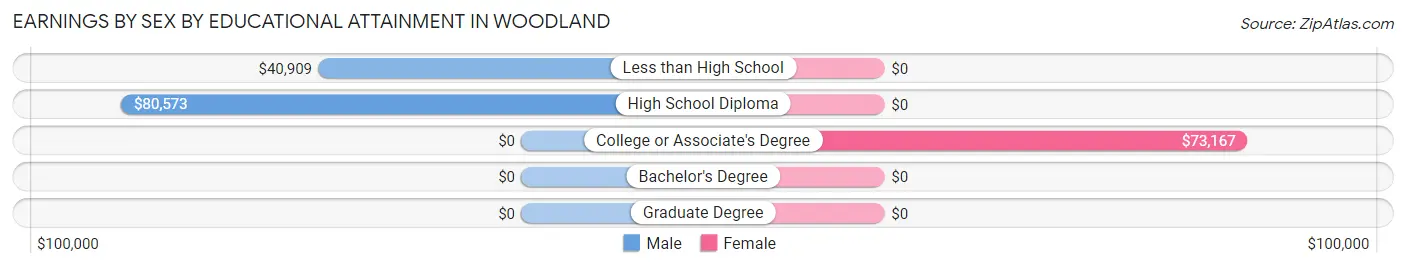
Earnings by Sex by Educational Attainment in Woodland
| Educational Attainment | Male Income | Female Income |
| Less than High School | $40,909 | $0 |
| High School Diploma | $80,573 | $0 |
| College or Associate's Degree | - | - |
| Bachelor's Degree | - | - |
| Graduate Degree | - | - |
| Total | $48,333 | $0 |
Family Income in Woodland
Family Income Brackets in Woodland
According to the Woodland family income data, there are 24 families falling into the $150,000 to $199,999 income range, which is the most common income bracket and makes up 44.4% of all families.
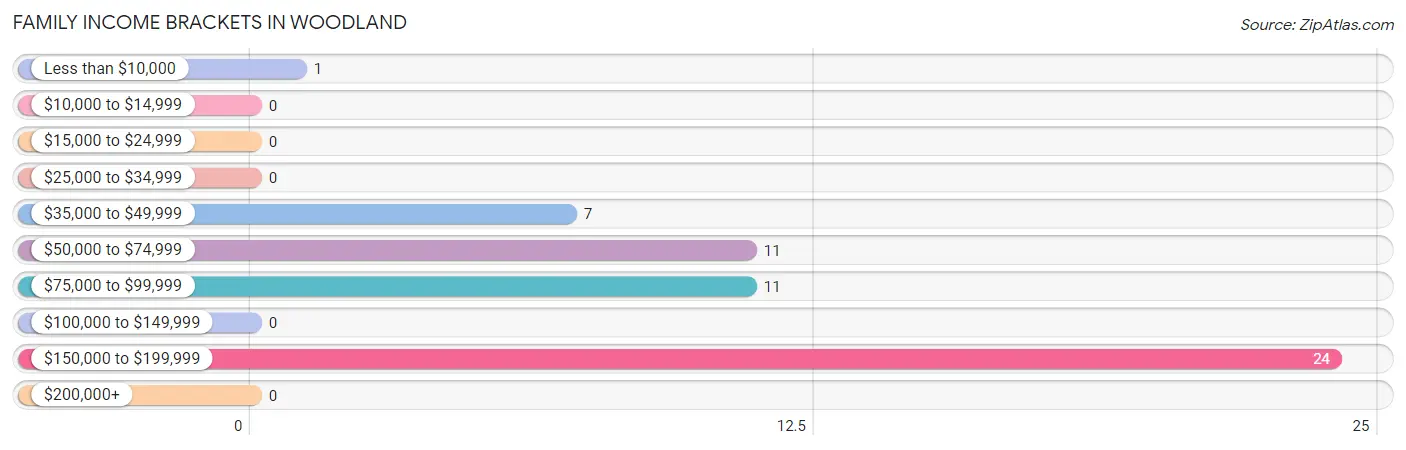
| Income Bracket | # Families | % Families |
| Less than $10,000 | 1 | 1.9% |
| $10,000 to $14,999 | 0 | 0.0% |
| $15,000 to $24,999 | 0 | 0.0% |
| $25,000 to $34,999 | 0 | 0.0% |
| $35,000 to $49,999 | 7 | 13.0% |
| $50,000 to $74,999 | 11 | 20.4% |
| $75,000 to $99,999 | 11 | 20.4% |
| $100,000 to $149,999 | 0 | 0.0% |
| $150,000 to $199,999 | 24 | 44.4% |
| $200,000+ | 0 | 0.0% |
Family Income by Famaliy Size in Woodland
3-person families (30 | 55.6%) account for the highest median family income in Woodland with $173,438 per family, while 3-person families (30 | 55.6%) have the highest median income of $57,813 per family member.
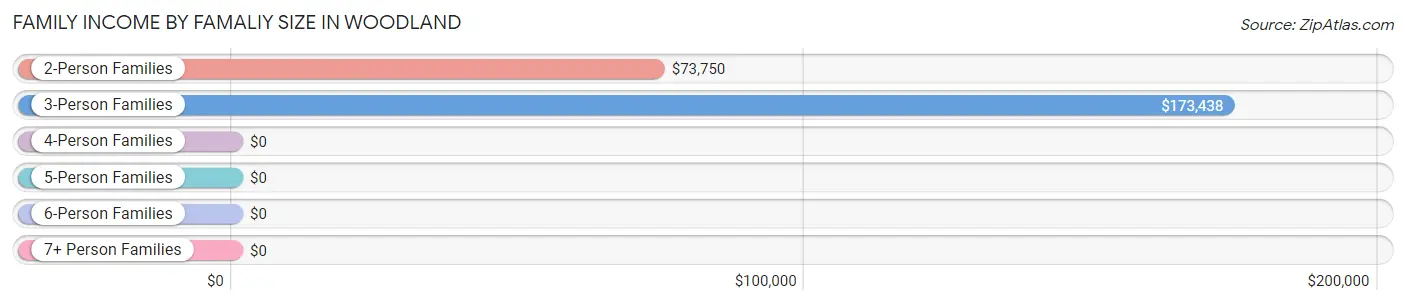
| Income Bracket | # Families | Median Income |
| 2-Person Families | 22 (40.7%) | $73,750 |
| 3-Person Families | 30 (55.6%) | $173,438 |
| 4-Person Families | 0 (0.0%) | $0 |
| 5-Person Families | 1 (1.8%) | $0 |
| 6-Person Families | 1 (1.8%) | $0 |
| 7+ Person Families | 0 (0.0%) | $0 |
| Total | 54 (100.0%) | $0 |
Family Income by Number of Earners in Woodland
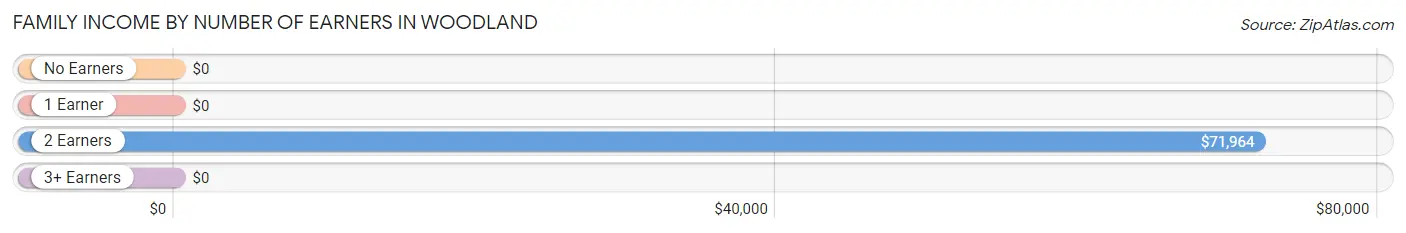
| Number of Earners | # Families | Median Income |
| No Earners | 4 (7.4%) | $0 |
| 1 Earner | 1 (1.8%) | $0 |
| 2 Earners | 25 (46.3%) | $71,964 |
| 3+ Earners | 24 (44.4%) | $0 |
| Total | 54 (100.0%) | $0 |
Household Income in Woodland
Household Income Brackets in Woodland
With 24 households falling in the category, the $150,000 to $199,999 income range is the most frequent in Woodland, accounting for 30.4% of all households.
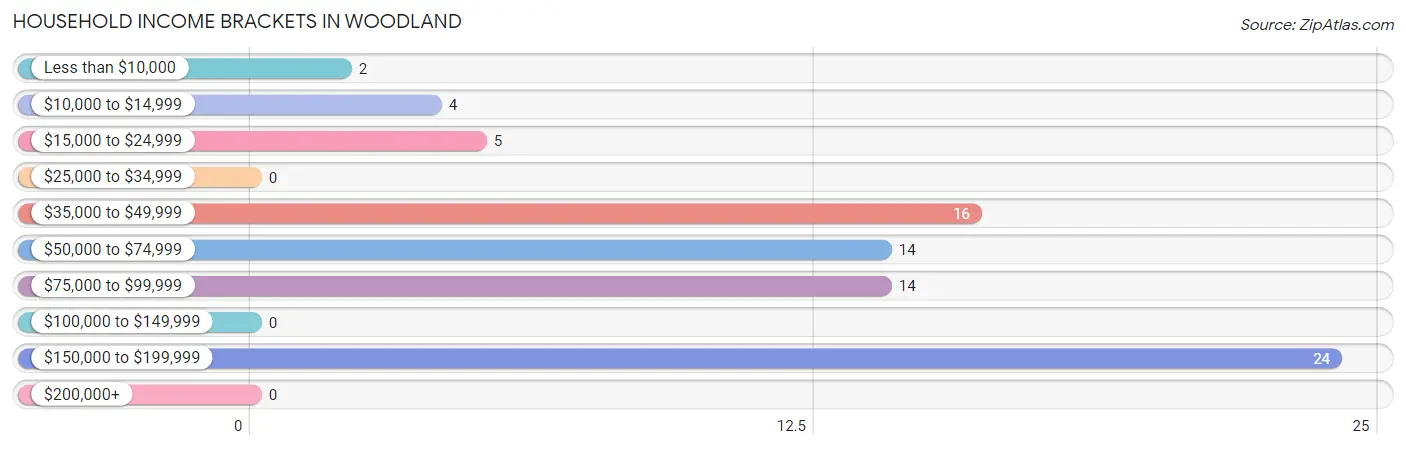
| Income Bracket | # Households | % Households |
| Less than $10,000 | 2 | 2.5% |
| $10,000 to $14,999 | 4 | 5.1% |
| $15,000 to $24,999 | 5 | 6.3% |
| $25,000 to $34,999 | 0 | 0.0% |
| $35,000 to $49,999 | 16 | 20.3% |
| $50,000 to $74,999 | 14 | 17.7% |
| $75,000 to $99,999 | 14 | 17.7% |
| $100,000 to $149,999 | 0 | 0.0% |
| $150,000 to $199,999 | 24 | 30.4% |
| $200,000+ | 0 | 0.0% |
Household Income by Householder Age in Woodland
The median household income in Woodland is $0, with the highest median household income of $173,333 found in the 25 to 44 years age bracket for the primary householder. A total of 32 households (40.5%) fall into this category.
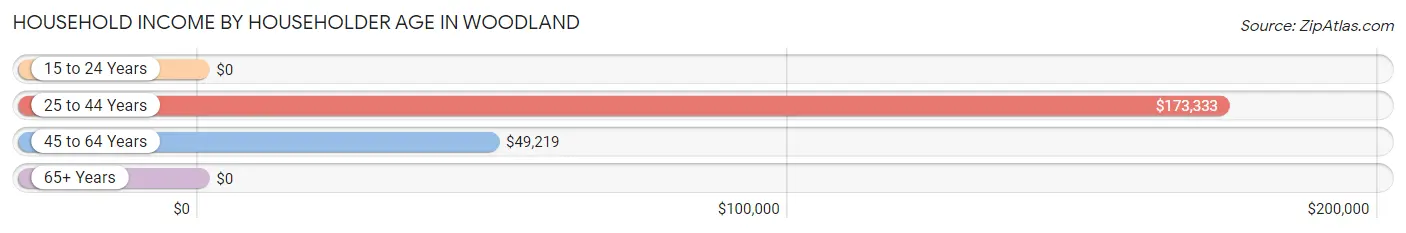
| Income Bracket | # Households | Median Income |
| 15 to 24 Years | 0 (0.0%) | $0 |
| 25 to 44 Years | 32 (40.5%) | $173,333 |
| 45 to 64 Years | 44 (55.7%) | $49,219 |
| 65+ Years | 3 (3.8%) | $0 |
| Total | 79 (100.0%) | $0 |
Poverty in Woodland
Income Below Poverty by Sex and Age in Woodland
With 21.7% poverty level for males and 4.6% for females among the residents of Woodland, under 5 year old males and 18 to 24 year old females are the most vulnerable to poverty, with 1 males (100.0%) and 1 females (100.0%) in their respective age groups living below the poverty level.
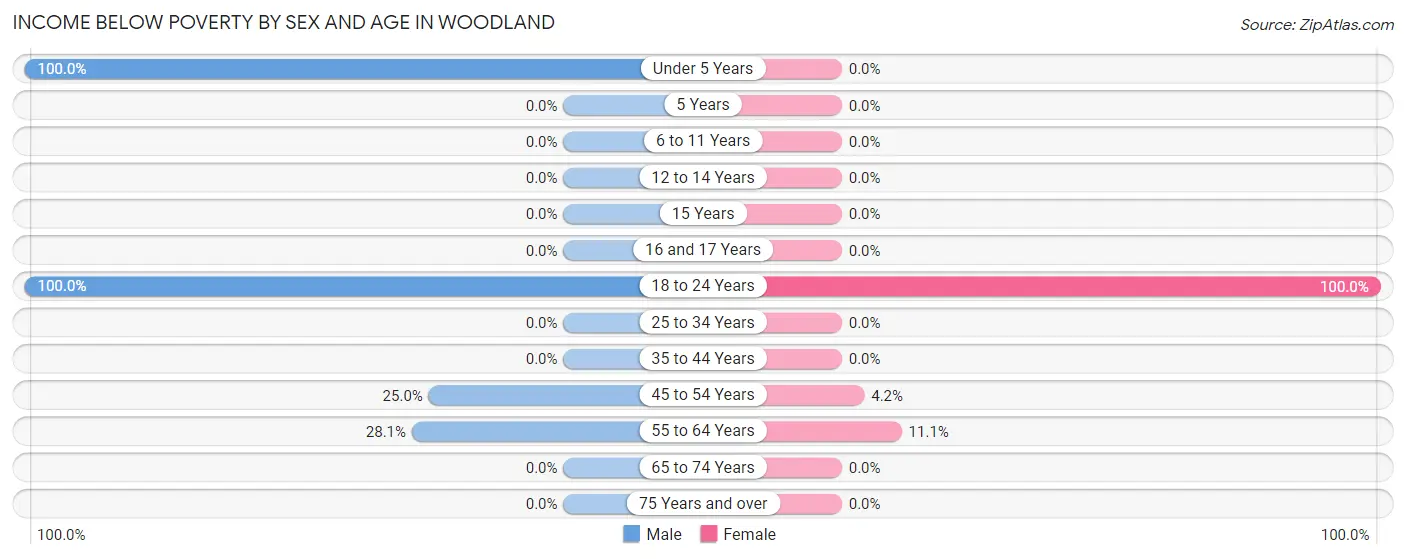
| Age Bracket | Male | Female |
| Under 5 Years | 1 (100.0%) | 0 (0.0%) |
| 5 Years | 0 (0.0%) | 0 (0.0%) |
| 6 to 11 Years | 0 (0.0%) | 0 (0.0%) |
| 12 to 14 Years | 0 (0.0%) | 0 (0.0%) |
| 15 Years | 0 (0.0%) | 0 (0.0%) |
| 16 and 17 Years | 0 (0.0%) | 0 (0.0%) |
| 18 to 24 Years | 9 (100.0%) | 1 (100.0%) |
| 25 to 34 Years | 0 (0.0%) | 0 (0.0%) |
| 35 to 44 Years | 0 (0.0%) | 0 (0.0%) |
| 45 to 54 Years | 1 (25.0%) | 1 (4.2%) |
| 55 to 64 Years | 9 (28.1%) | 1 (11.1%) |
| 65 to 74 Years | 0 (0.0%) | 0 (0.0%) |
| 75 Years and over | 0 (0.0%) | 0 (0.0%) |
| Total | 20 (21.7%) | 3 (4.6%) |
Income Above Poverty by Sex and Age in Woodland
According to the poverty statistics in Woodland, males aged 6 to 11 years and females aged 6 to 11 years are the age groups that are most secure financially, with 100.0% of males and 100.0% of females in these age groups living above the poverty line.
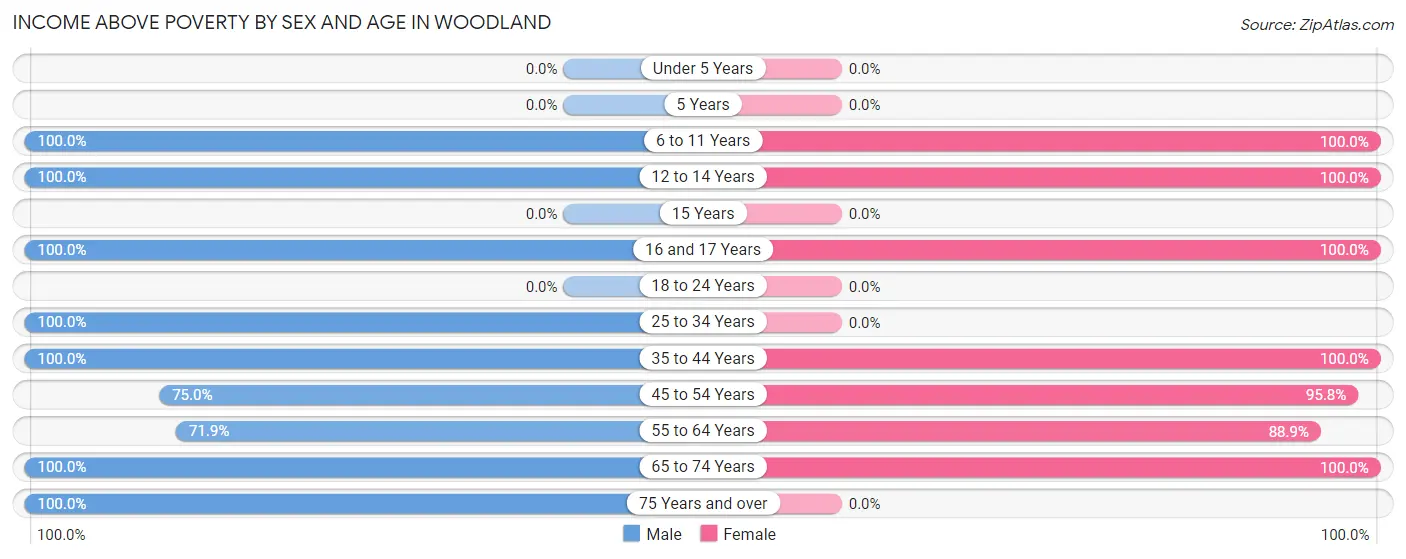
| Age Bracket | Male | Female |
| Under 5 Years | 0 (0.0%) | 0 (0.0%) |
| 5 Years | 0 (0.0%) | 0 (0.0%) |
| 6 to 11 Years | 4 (100.0%) | 3 (100.0%) |
| 12 to 14 Years | 1 (100.0%) | 1 (100.0%) |
| 15 Years | 0 (0.0%) | 0 (0.0%) |
| 16 and 17 Years | 1 (100.0%) | 6 (100.0%) |
| 18 to 24 Years | 0 (0.0%) | 0 (0.0%) |
| 25 to 34 Years | 5 (100.0%) | 0 (0.0%) |
| 35 to 44 Years | 32 (100.0%) | 16 (100.0%) |
| 45 to 54 Years | 3 (75.0%) | 23 (95.8%) |
| 55 to 64 Years | 23 (71.9%) | 8 (88.9%) |
| 65 to 74 Years | 2 (100.0%) | 5 (100.0%) |
| 75 Years and over | 1 (100.0%) | 0 (0.0%) |
| Total | 72 (78.3%) | 62 (95.4%) |
Income Below Poverty Among Married-Couple Families in Woodland
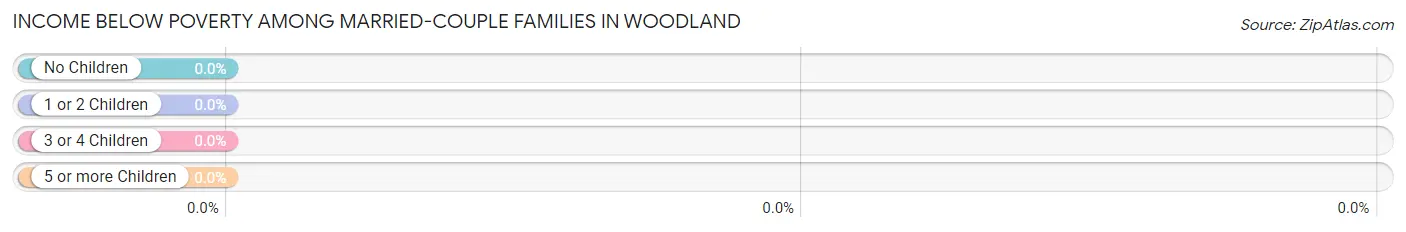
| Children | Above Poverty | Below Poverty |
| No Children | 18 (100.0%) | 0 (0.0%) |
| 1 or 2 Children | 27 (100.0%) | 0 (0.0%) |
| 3 or 4 Children | 1 (100.0%) | 0 (0.0%) |
| 5 or more Children | 0 (0.0%) | 0 (0.0%) |
| Total | 46 (100.0%) | 0 (0.0%) |
Income Below Poverty Among Single-Parent Households in Woodland
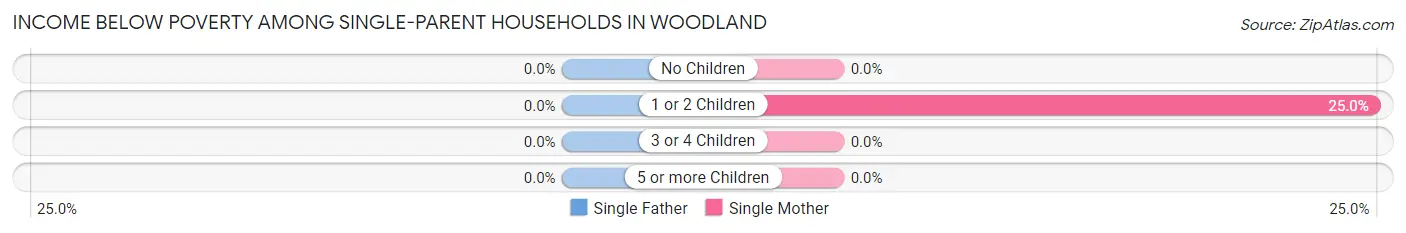
| Children | Single Father | Single Mother |
| No Children | 0 (0.0%) | 0 (0.0%) |
| 1 or 2 Children | 0 (0.0%) | 1 (25.0%) |
| 3 or 4 Children | 0 (0.0%) | 0 (0.0%) |
| 5 or more Children | 0 (0.0%) | 0 (0.0%) |
| Total | 0 (0.0%) | 1 (12.5%) |
Income Below Poverty Among Married-Couple vs Single-Parent Households in Woodland
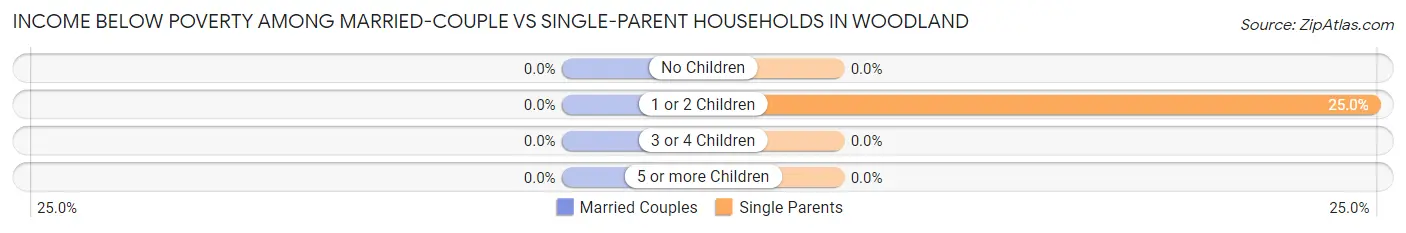
| Children | Married-Couple Families | Single-Parent Households |
| No Children | 0 (0.0%) | 0 (0.0%) |
| 1 or 2 Children | 0 (0.0%) | 1 (25.0%) |
| 3 or 4 Children | 0 (0.0%) | 0 (0.0%) |
| 5 or more Children | 0 (0.0%) | 0 (0.0%) |
| Total | 0 (0.0%) | 1 (12.5%) |
Race in Woodland
The most populous races in Woodland are Black / African American (76 | 48.4%), White / Caucasian (68 | 43.3%), and Hispanic or Latino (13 | 8.3%).
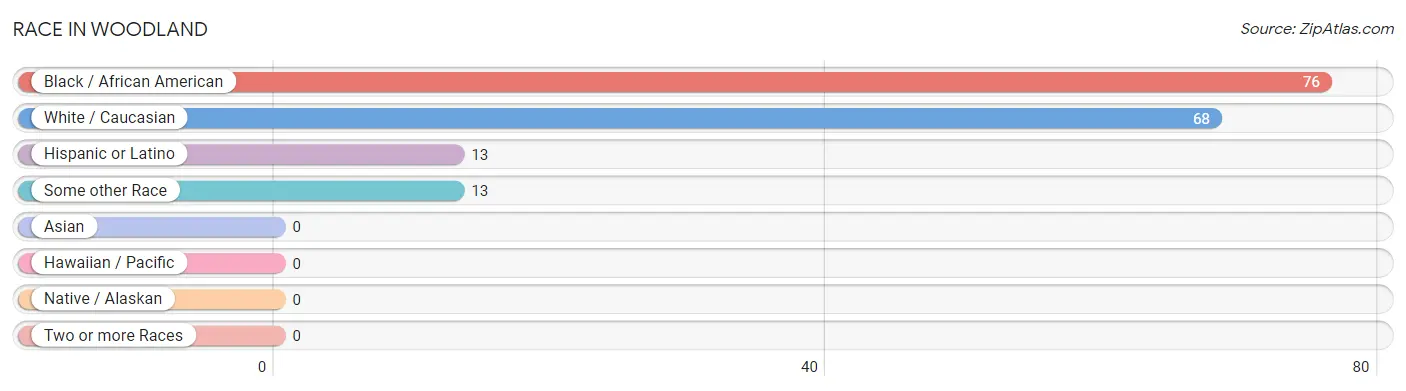
| Race | # Population | % Population |
| Asian | 0 | 0.0% |
| Black / African American | 76 | 48.4% |
| Hawaiian / Pacific | 0 | 0.0% |
| Hispanic or Latino | 13 | 8.3% |
| Native / Alaskan | 0 | 0.0% |
| White / Caucasian | 68 | 43.3% |
| Two or more Races | 0 | 0.0% |
| Some other Race | 13 | 8.3% |
| Total | 157 | 100.0% |
Ancestry in Woodland
The most populous ancestries reported in Woodland are American (25 | 15.9%), Mexican (13 | 8.3%), and English (4 | 2.5%), together accounting for 26.8% of all Woodland residents.
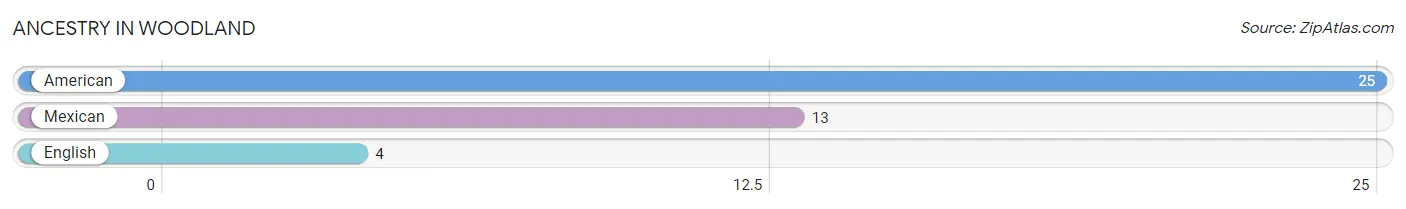
| Ancestry | # Population | % Population |
| American | 25 | 15.9% |
| English | 4 | 2.5% |
| Mexican | 13 | 8.3% | View All 3 Rows |
Immigrants in Woodland
The most numerous immigrant groups reported in Woodland came from Central America (13 | 8.3%), Latin America (13 | 8.3%), and Mexico (13 | 8.3%), together accounting for 24.8% of all Woodland residents.
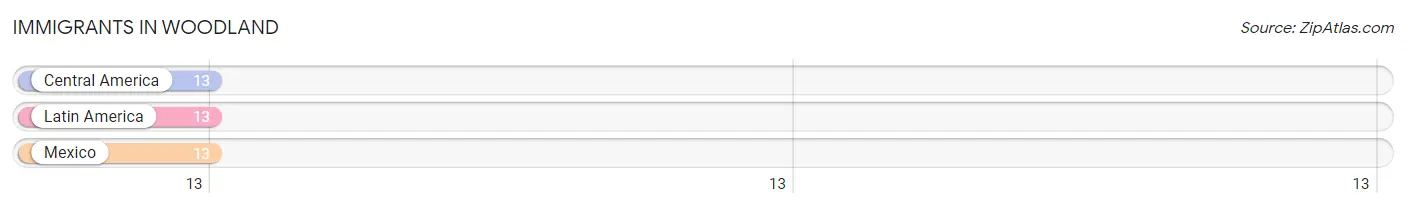
| Immigration Origin | # Population | % Population |
| Central America | 13 | 8.3% |
| Latin America | 13 | 8.3% |
| Mexico | 13 | 8.3% | View All 3 Rows |
Sex and Age in Woodland
Sex and Age in Woodland
The most populous age groups in Woodland are 40 to 44 Years (24 | 26.1%) for men and 40 to 44 Years (16 | 24.6%) for women.
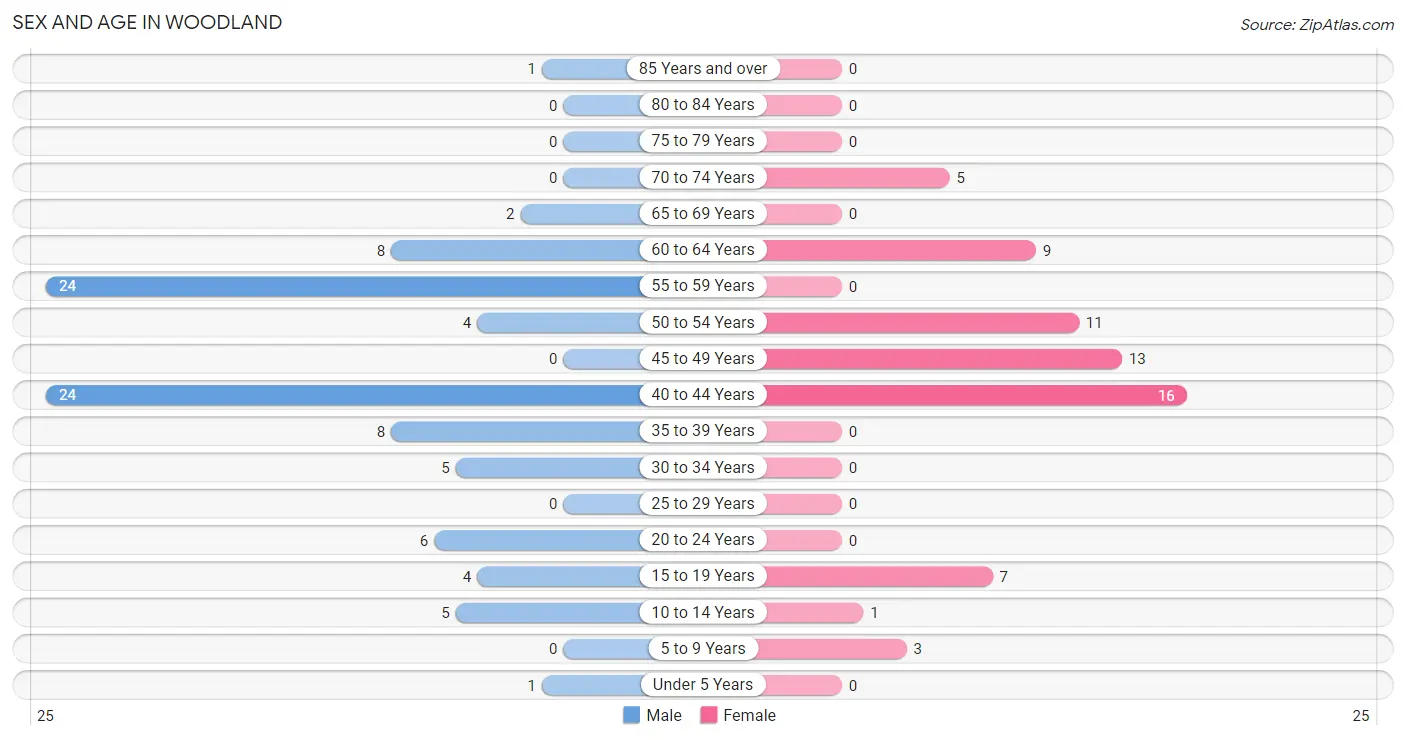
| Age Bracket | Male | Female |
| Under 5 Years | 1 (1.1%) | 0 (0.0%) |
| 5 to 9 Years | 0 (0.0%) | 3 (4.6%) |
| 10 to 14 Years | 5 (5.4%) | 1 (1.5%) |
| 15 to 19 Years | 4 (4.3%) | 7 (10.8%) |
| 20 to 24 Years | 6 (6.5%) | 0 (0.0%) |
| 25 to 29 Years | 0 (0.0%) | 0 (0.0%) |
| 30 to 34 Years | 5 (5.4%) | 0 (0.0%) |
| 35 to 39 Years | 8 (8.7%) | 0 (0.0%) |
| 40 to 44 Years | 24 (26.1%) | 16 (24.6%) |
| 45 to 49 Years | 0 (0.0%) | 13 (20.0%) |
| 50 to 54 Years | 4 (4.3%) | 11 (16.9%) |
| 55 to 59 Years | 24 (26.1%) | 0 (0.0%) |
| 60 to 64 Years | 8 (8.7%) | 9 (13.9%) |
| 65 to 69 Years | 2 (2.2%) | 0 (0.0%) |
| 70 to 74 Years | 0 (0.0%) | 5 (7.7%) |
| 75 to 79 Years | 0 (0.0%) | 0 (0.0%) |
| 80 to 84 Years | 0 (0.0%) | 0 (0.0%) |
| 85 Years and over | 1 (1.1%) | 0 (0.0%) |
| Total | 92 (100.0%) | 65 (100.0%) |
Families and Households in Woodland
Median Family Size in Woodland
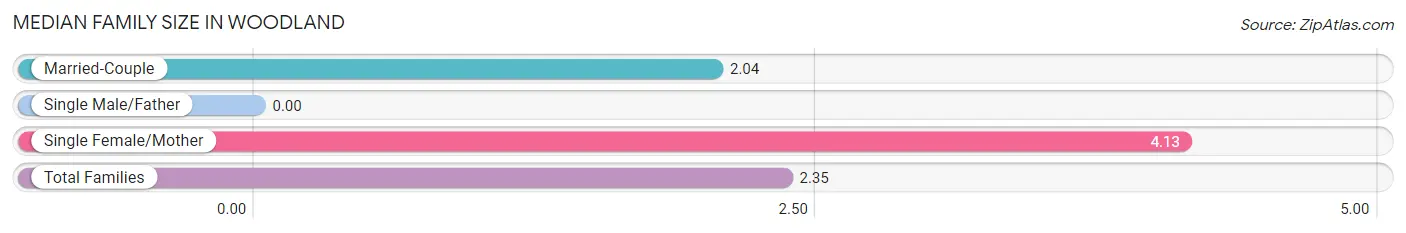
| Family Type | # Families | Family Size |
| Married-Couple | 46 (85.2%) | 2.04 |
| Single Male/Father | 0 (0.0%) | - |
| Single Female/Mother | 8 (14.8%) | 4.13 |
| Total Families | 54 (100.0%) | 2.35 |
Median Household Size in Woodland
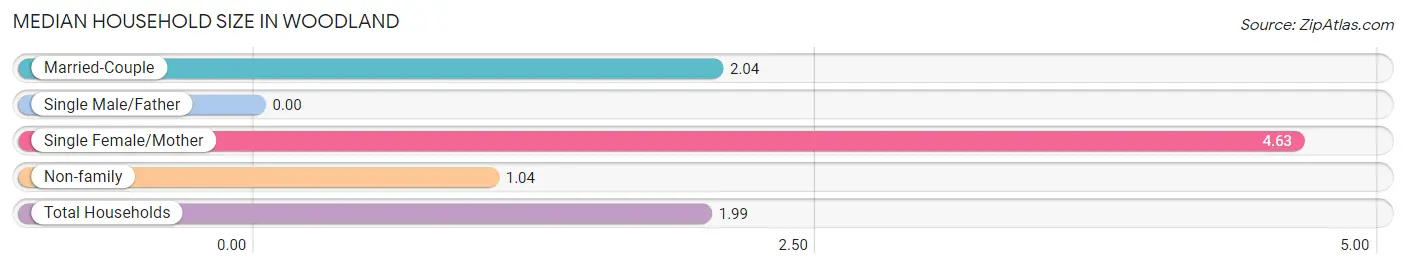
| Household Type | # Households | Household Size |
| Married-Couple | 46 (58.2%) | 2.04 |
| Single Male/Father | 0 (0.0%) | - |
| Single Female/Mother | 8 (10.1%) | 4.63 |
| Non-family | 25 (31.7%) | 1.04 |
| Total Households | 79 (100.0%) | 1.99 |
Household Size by Marriage Status in Woodland
Out of a total of 79 households in Woodland, 54 (68.3%) are family households, while 25 (31.7%) are nonfamily households. The most numerous type of family households are 3-person households, comprising 27, and the most common type of nonfamily households are 1-person households, comprising 24.
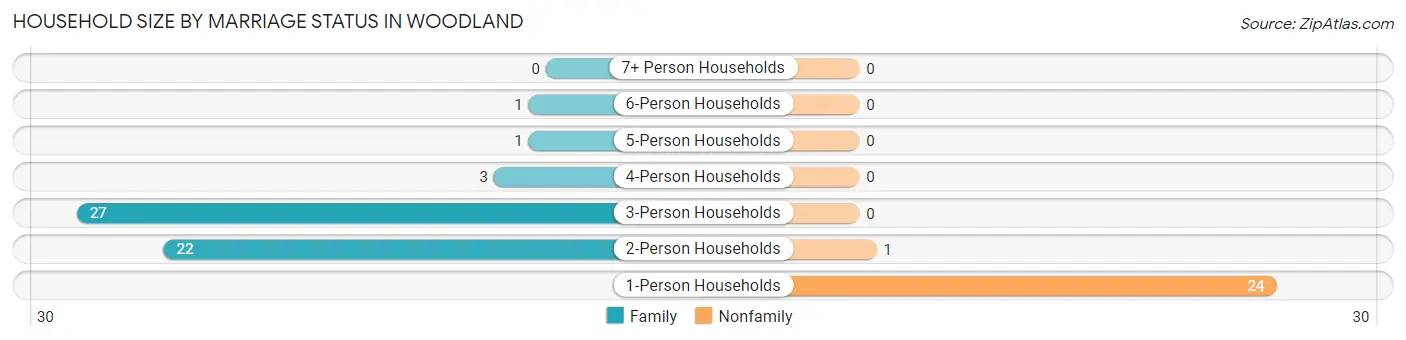
| Household Size | Family Households | Nonfamily Households |
| 1-Person Households | - | 24 (30.4%) |
| 2-Person Households | 22 (27.9%) | 1 (1.3%) |
| 3-Person Households | 27 (34.2%) | 0 (0.0%) |
| 4-Person Households | 3 (3.8%) | 0 (0.0%) |
| 5-Person Households | 1 (1.3%) | 0 (0.0%) |
| 6-Person Households | 1 (1.3%) | 0 (0.0%) |
| 7+ Person Households | 0 (0.0%) | 0 (0.0%) |
| Total | 54 (68.3%) | 25 (31.7%) |
Female Fertility in Woodland
Fertility by Age in Woodland
Average fertility rate in Woodland is 24.0 births per 1,000 women. Women in the age bracket of 15 to 19 years have the highest fertility rate with 143.0 births per 1,000 women. Women in the age bracket of 15 to 19 years acount for 100.0% of all women with births.
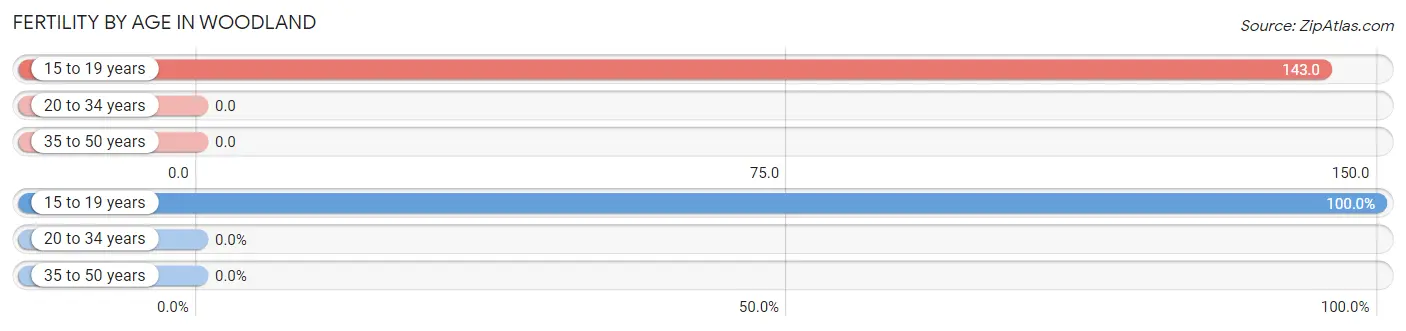
| Age Bracket | Women with Births | Births / 1,000 Women |
| 15 to 19 years | 1 (100.0%) | 143.0 |
| 20 to 34 years | 0 (0.0%) | 0.0 |
| 35 to 50 years | 0 (0.0%) | 0.0 |
| Total | 1 (100.0%) | 24.0 |
Fertility by Age by Marriage Status in Woodland
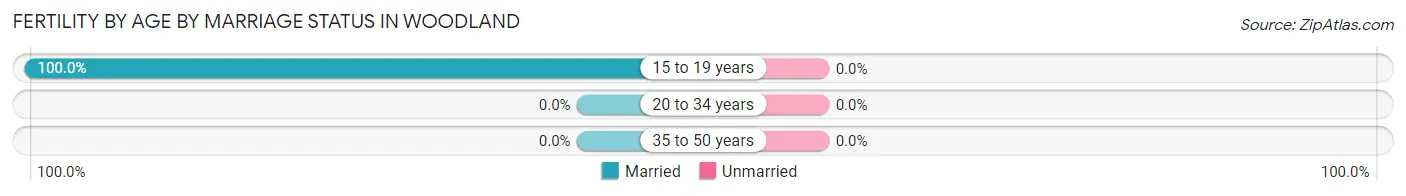
| Age Bracket | Married | Unmarried |
| 15 to 19 years | 1 (100.0%) | 0 (0.0%) |
| 20 to 34 years | 0 (0.0%) | 0 (0.0%) |
| 35 to 50 years | 0 (0.0%) | 0 (0.0%) |
| Total | 1 (100.0%) | 0 (0.0%) |
Fertility by Education in Woodland
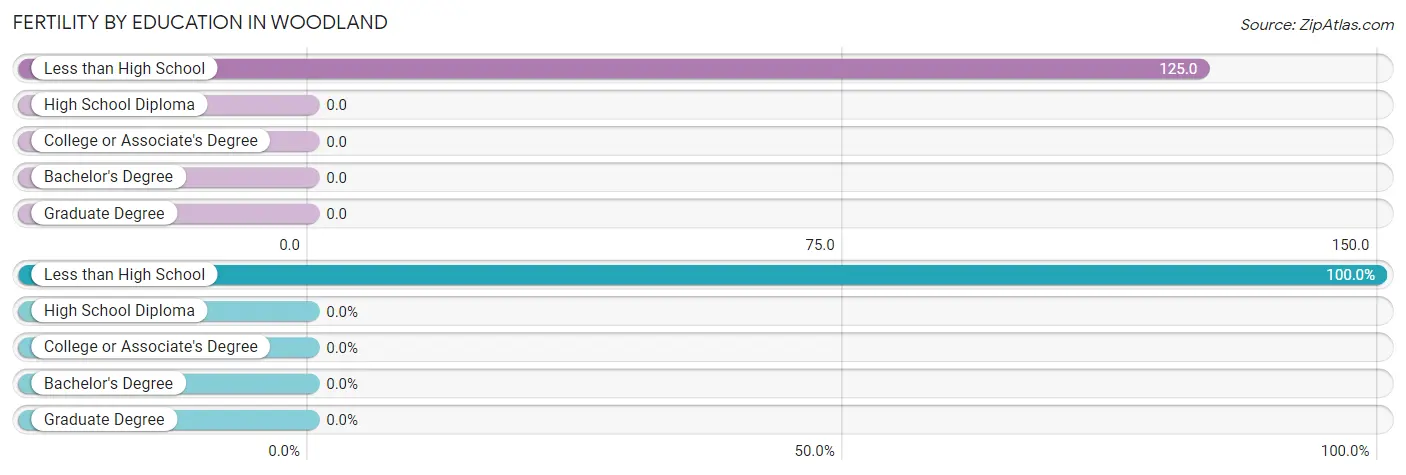
| Educational Attainment | Women with Births | Births / 1,000 Women |
| Less than High School | 1 (100.0%) | 125.0 |
| High School Diploma | 0 (0.0%) | 0.0 |
| College or Associate's Degree | 0 (0.0%) | 0.0 |
| Bachelor's Degree | 0 (0.0%) | 0.0 |
| Graduate Degree | 0 (0.0%) | 0.0 |
| Total | 1 (100.0%) | 24.0 |
Fertility by Education by Marriage Status in Woodland
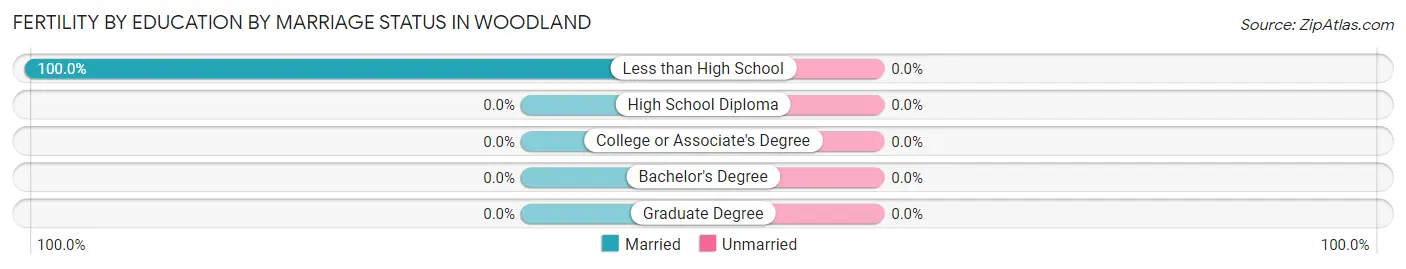
| Educational Attainment | Married | Unmarried |
| Less than High School | 1 (100.0%) | 0 (0.0%) |
| High School Diploma | 0 (0.0%) | 0 (0.0%) |
| College or Associate's Degree | 0 (0.0%) | 0 (0.0%) |
| Bachelor's Degree | 0 (0.0%) | 0 (0.0%) |
| Graduate Degree | 0 (0.0%) | 0 (0.0%) |
| Total | 1 (100.0%) | 0 (0.0%) |
Employment Characteristics in Woodland
Employment by Class of Employer in Woodland
Among the 107 employed individuals in Woodland, private company employees (102 | 95.3%), and local government employees (5 | 4.7%) make up the most common classes of employment.
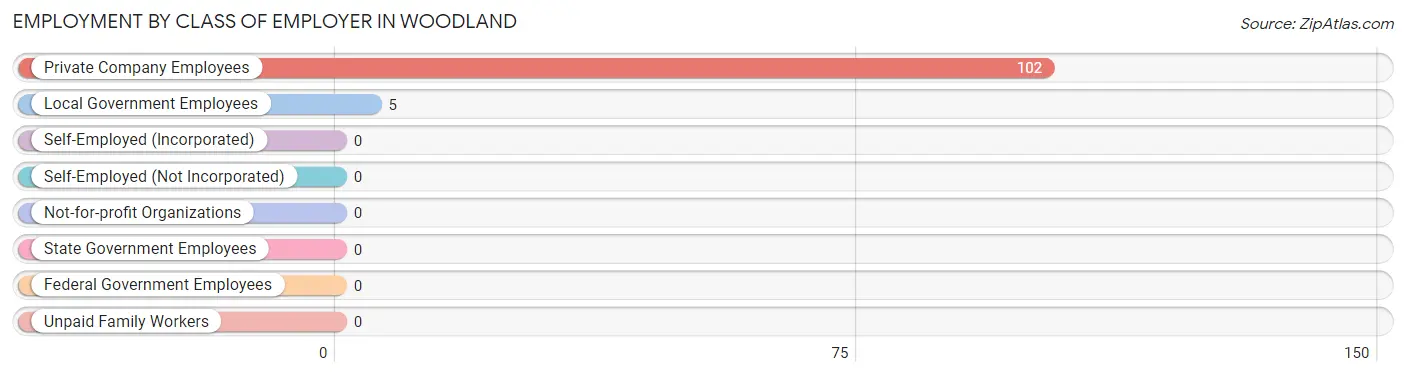
| Employer Class | # Employees | % Employees |
| Private Company Employees | 102 | 95.3% |
| Self-Employed (Incorporated) | 0 | 0.0% |
| Self-Employed (Not Incorporated) | 0 | 0.0% |
| Not-for-profit Organizations | 0 | 0.0% |
| Local Government Employees | 5 | 4.7% |
| State Government Employees | 0 | 0.0% |
| Federal Government Employees | 0 | 0.0% |
| Unpaid Family Workers | 0 | 0.0% |
| Total | 107 | 100.0% |
Employment Status by Age in Woodland
According to the labor force statistics for Woodland, out of the total population over 16 years of age (147), 77.6% or 114 individuals are in the labor force, with 6.1% or 7 of them unemployed. The age group with the highest labor force participation rate is 20 to 24 years, with 100.0% or 6 individuals in the labor force. Within the labor force, the 20 to 24 years age range has the highest percentage of unemployed individuals, with 100.0% or 6 of them being unemployed.
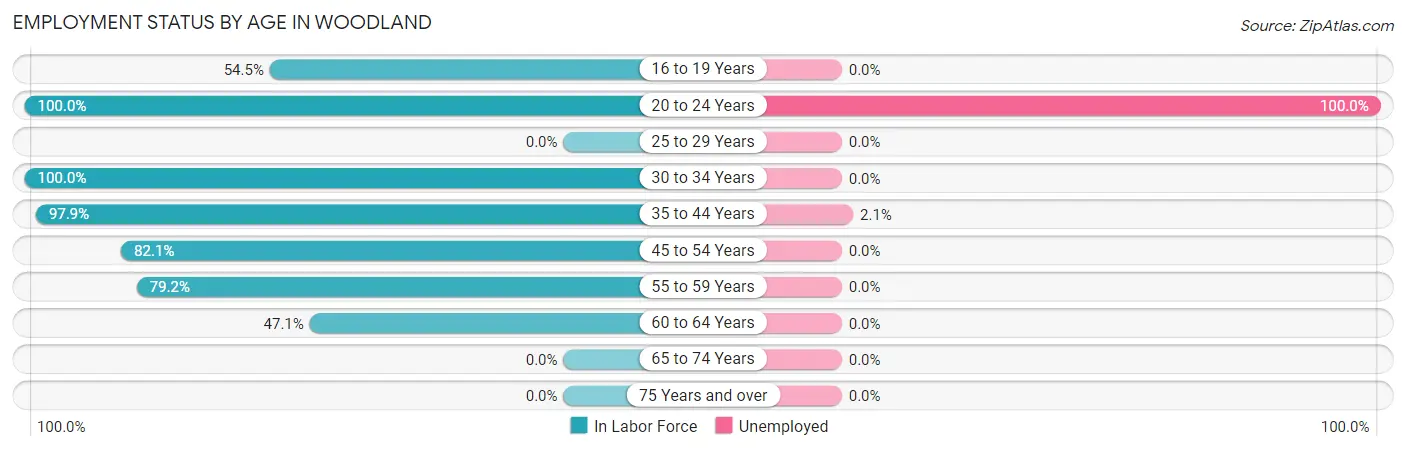
| Age Bracket | In Labor Force | Unemployed |
| 16 to 19 Years | 6 (54.5%) | 0 (0.0%) |
| 20 to 24 Years | 6 (100.0%) | 6 (100.0%) |
| 25 to 29 Years | 0 (0.0%) | 0 (0.0%) |
| 30 to 34 Years | 5 (100.0%) | 0 (0.0%) |
| 35 to 44 Years | 47 (97.9%) | 1 (2.1%) |
| 45 to 54 Years | 23 (82.1%) | 0 (0.0%) |
| 55 to 59 Years | 19 (79.2%) | 0 (0.0%) |
| 60 to 64 Years | 8 (47.1%) | 0 (0.0%) |
| 65 to 74 Years | 0 (0.0%) | 0 (0.0%) |
| 75 Years and over | 0 (0.0%) | 0 (0.0%) |
| Total | 114 (77.6%) | 7 (6.1%) |
Employment Status by Educational Attainment in Woodland
According to labor force statistics for Woodland, 83.6% of individuals (102) out of the total population between 25 and 64 years of age (122) are in the labor force, with 1.0% or 1 of them being unemployed. The group with the highest labor force participation rate are those with the educational attainment of high school diploma, with 100.0% or 48 individuals in the labor force. Within the labor force, individuals with high school diploma education have the highest percentage of unemployment, with 2.1% or 1 of them being unemployed.
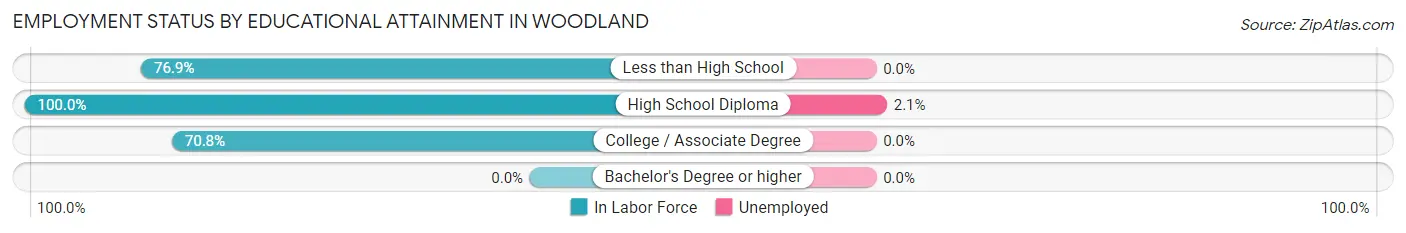
| Educational Attainment | In Labor Force | Unemployed |
| Less than High School | 20 (76.9%) | 0 (0.0%) |
| High School Diploma | 48 (100.0%) | 1 (2.1%) |
| College / Associate Degree | 34 (70.8%) | 0 (0.0%) |
| Bachelor's Degree or higher | 0 (0.0%) | 0 (0.0%) |
| Total | 102 (83.6%) | 1 (1.0%) |
Employment Occupations by Sex in Woodland
Management, Business, Science and Arts Occupations
The most common Management, Business, Science and Arts occupations in Woodland are Health Diagnosing & Treating (5 | 4.7%), Community & Social Service (4 | 3.7%), and Education, Arts & Media (4 | 3.7%).
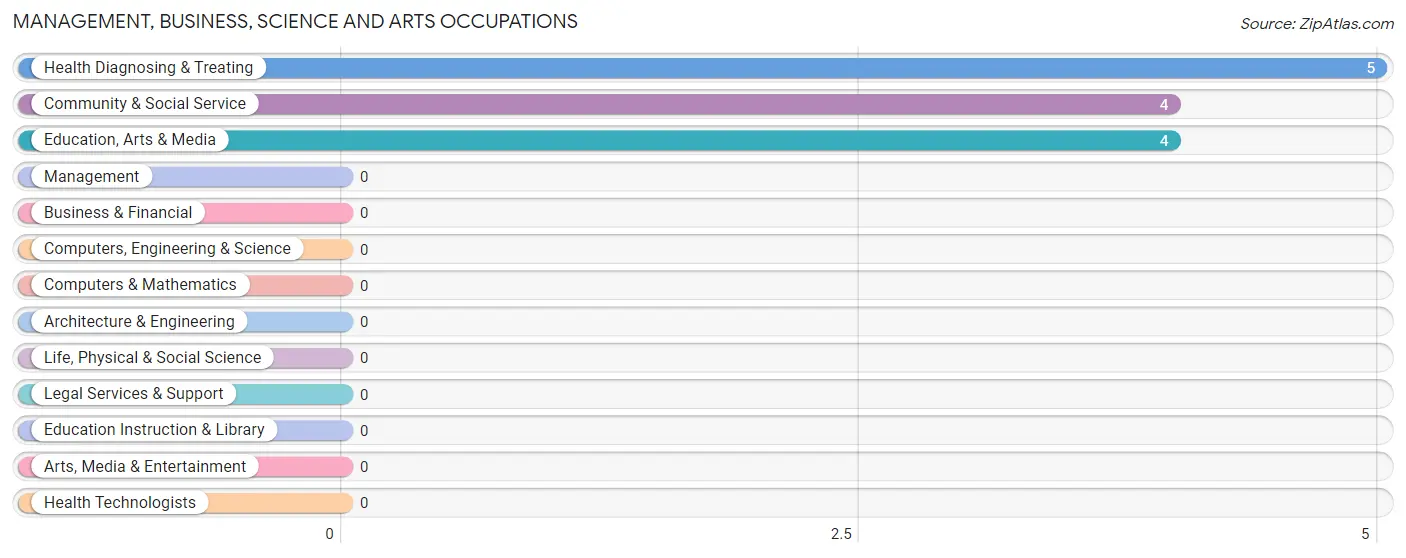
Management, Business, Science and Arts Occupations by Sex
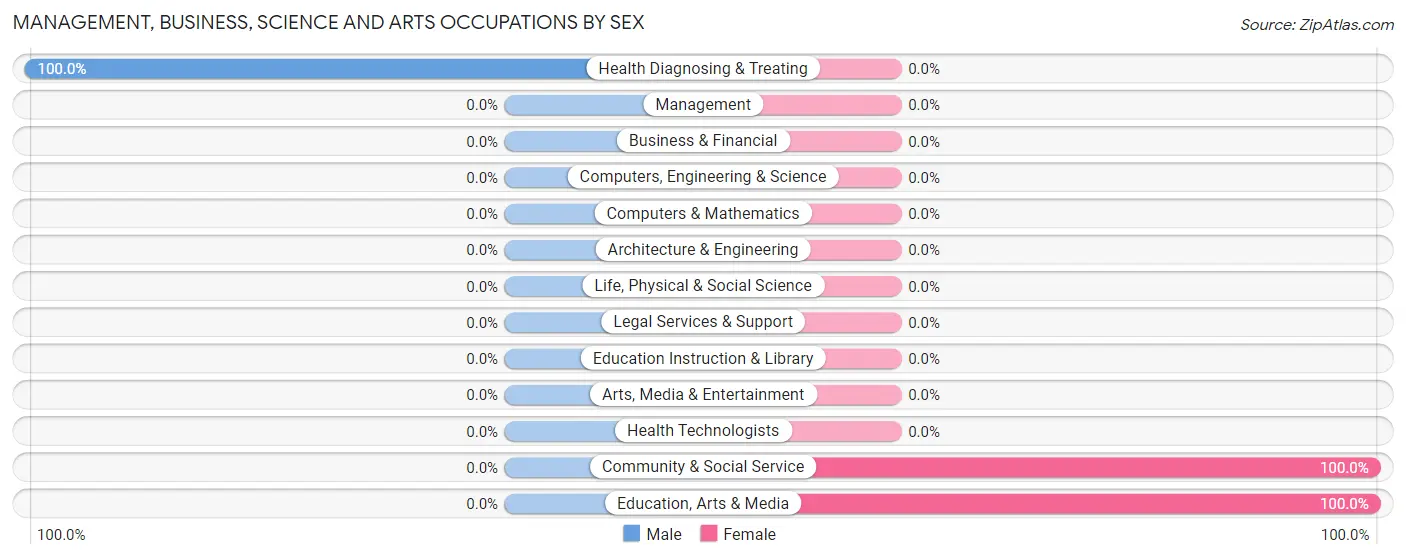
| Occupation | Male | Female |
| Management | 0 (0.0%) | 0 (0.0%) |
| Business & Financial | 0 (0.0%) | 0 (0.0%) |
| Computers, Engineering & Science | 0 (0.0%) | 0 (0.0%) |
| Computers & Mathematics | 0 (0.0%) | 0 (0.0%) |
| Architecture & Engineering | 0 (0.0%) | 0 (0.0%) |
| Life, Physical & Social Science | 0 (0.0%) | 0 (0.0%) |
| Community & Social Service | 0 (0.0%) | 4 (100.0%) |
| Education, Arts & Media | 0 (0.0%) | 4 (100.0%) |
| Legal Services & Support | 0 (0.0%) | 0 (0.0%) |
| Education Instruction & Library | 0 (0.0%) | 0 (0.0%) |
| Arts, Media & Entertainment | 0 (0.0%) | 0 (0.0%) |
| Health Diagnosing & Treating | 5 (100.0%) | 0 (0.0%) |
| Health Technologists | 0 (0.0%) | 0 (0.0%) |
| Total (Category) | 5 (55.6%) | 4 (44.4%) |
| Total (Overall) | 62 (57.9%) | 45 (42.1%) |
Services Occupations
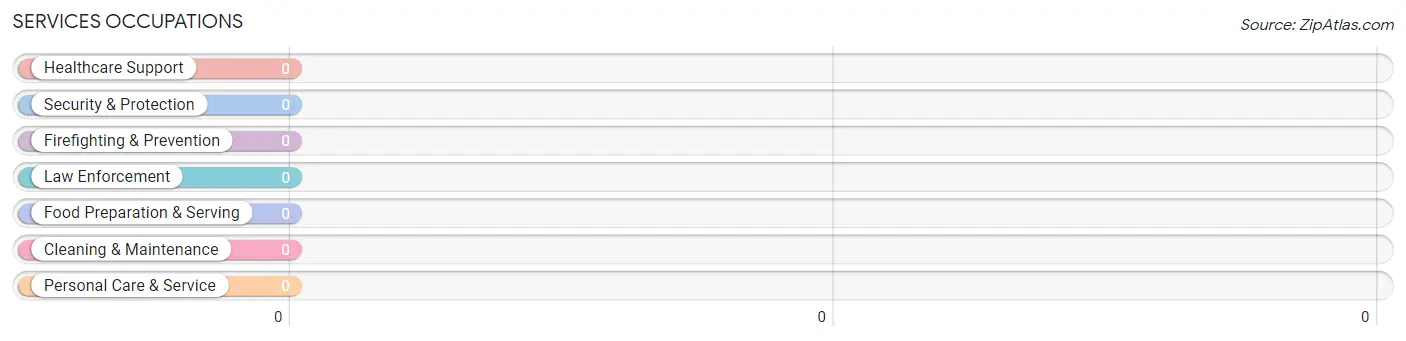
Services Occupations by Sex
| Occupation | Male | Female |
| Healthcare Support | 0 (0.0%) | 0 (0.0%) |
| Security & Protection | 0 (0.0%) | 0 (0.0%) |
| Firefighting & Prevention | 0 (0.0%) | 0 (0.0%) |
| Law Enforcement | 0 (0.0%) | 0 (0.0%) |
| Food Preparation & Serving | 0 (0.0%) | 0 (0.0%) |
| Cleaning & Maintenance | 0 (0.0%) | 0 (0.0%) |
| Personal Care & Service | 0 (0.0%) | 0 (0.0%) |
| Total (Category) | 0 (0.0%) | 0 (0.0%) |
| Total (Overall) | 62 (57.9%) | 45 (42.1%) |
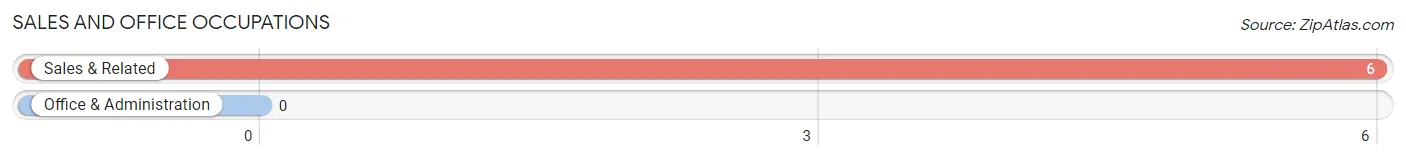
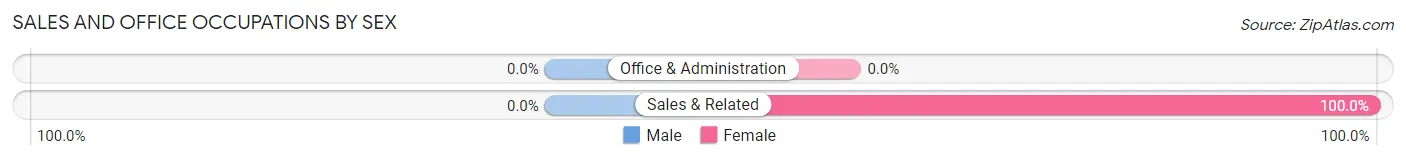
Sales and Office Occupations
The most common Sales and Office occupations in Woodland are , and Sales & Related (6 | 5.6%).
Sales and Office Occupations by Sex
| Occupation | Male | Female |
| Sales & Related | 0 (0.0%) | 6 (100.0%) |
| Office & Administration | 0 (0.0%) | 0 (0.0%) |
| Total (Category) | 0 (0.0%) | 6 (100.0%) |
| Total (Overall) | 62 (57.9%) | 45 (42.1%) |
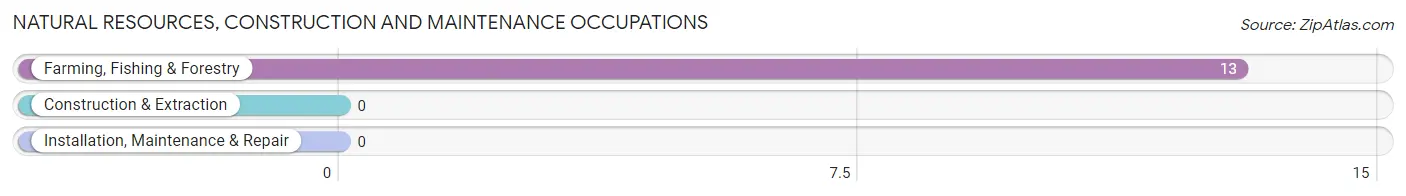
Natural Resources, Construction and Maintenance Occupations
The most common Natural Resources, Construction and Maintenance occupations in Woodland are , and Farming, Fishing & Forestry (13 | 12.1%).
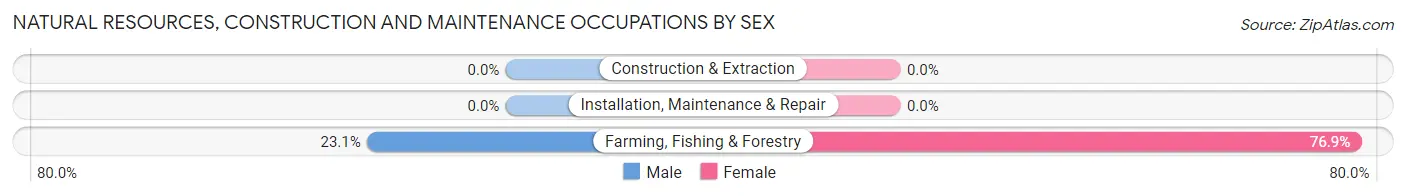
Natural Resources, Construction and Maintenance Occupations by Sex
| Occupation | Male | Female |
| Farming, Fishing & Forestry | 3 (23.1%) | 10 (76.9%) |
| Construction & Extraction | 0 (0.0%) | 0 (0.0%) |
| Installation, Maintenance & Repair | 0 (0.0%) | 0 (0.0%) |
| Total (Category) | 3 (23.1%) | 10 (76.9%) |
| Total (Overall) | 62 (57.9%) | 45 (42.1%) |
Production, Transportation and Moving Occupations
The most common Production, Transportation and Moving occupations in Woodland are Transportation (36 | 33.6%), Production (32 | 29.9%), and Material Moving (11 | 10.3%).
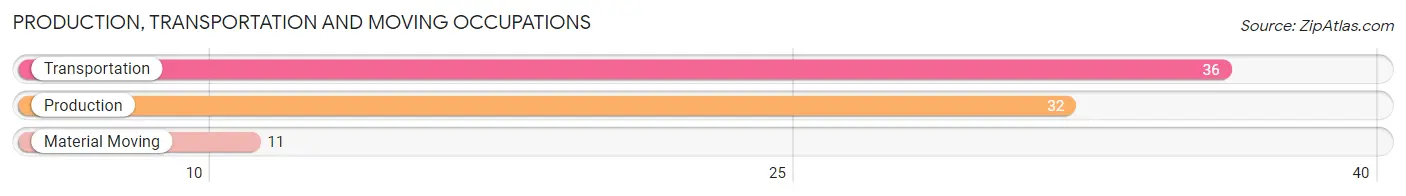
Production, Transportation and Moving Occupations by Sex
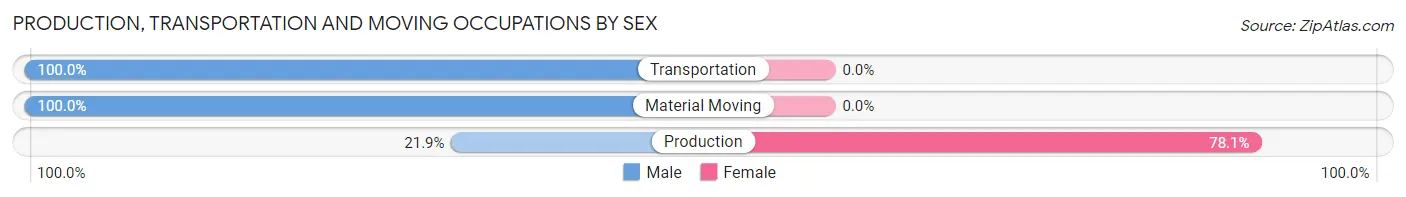
| Occupation | Male | Female |
| Production | 7 (21.9%) | 25 (78.1%) |
| Transportation | 36 (100.0%) | 0 (0.0%) |
| Material Moving | 11 (100.0%) | 0 (0.0%) |
| Total (Category) | 54 (68.3%) | 25 (31.7%) |
| Total (Overall) | 62 (57.9%) | 45 (42.1%) |
Employment Industries by Sex in Woodland
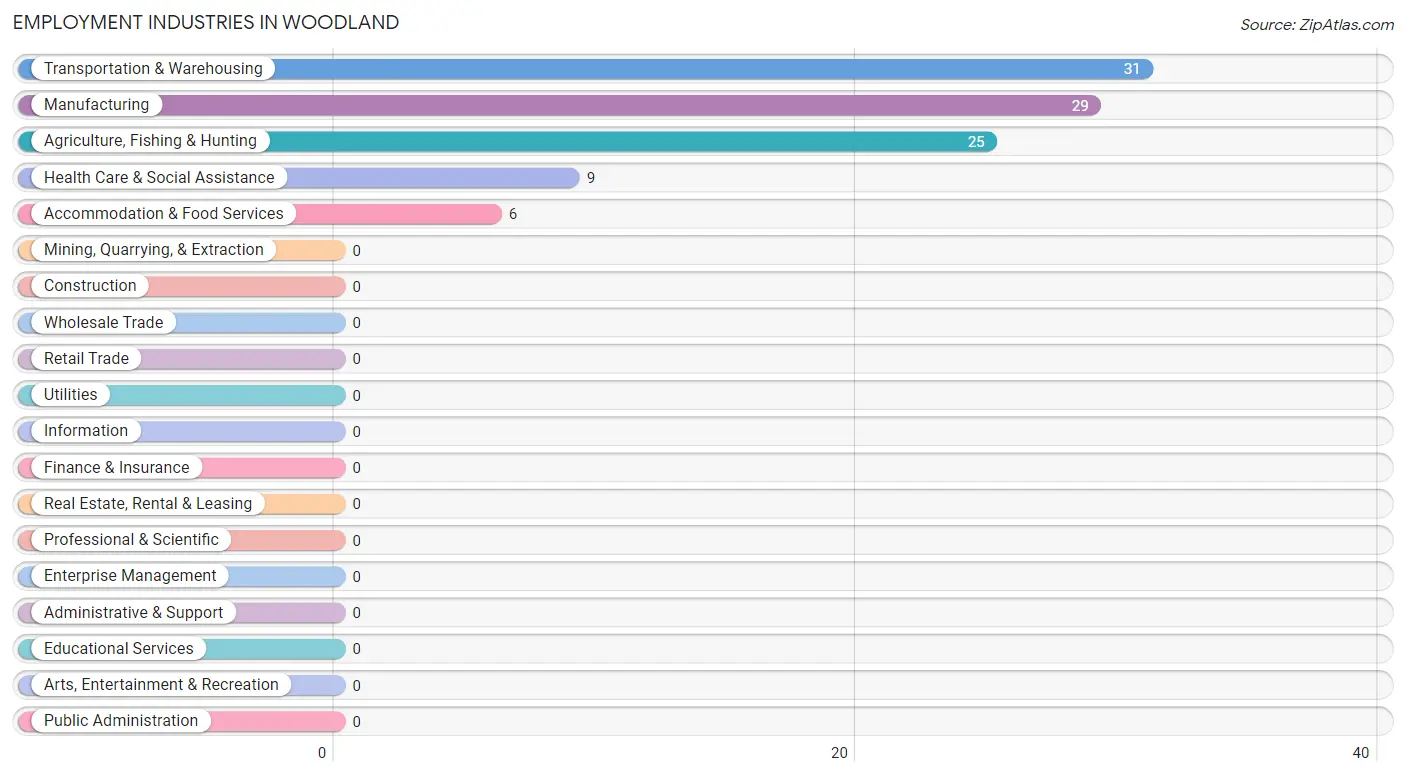
Employment Industries in Woodland
The major employment industries in Woodland include Transportation & Warehousing (31 | 29.0%), Manufacturing (29 | 27.1%), Agriculture, Fishing & Hunting (25 | 23.4%), Health Care & Social Assistance (9 | 8.4%), and Accommodation & Food Services (6 | 5.6%).
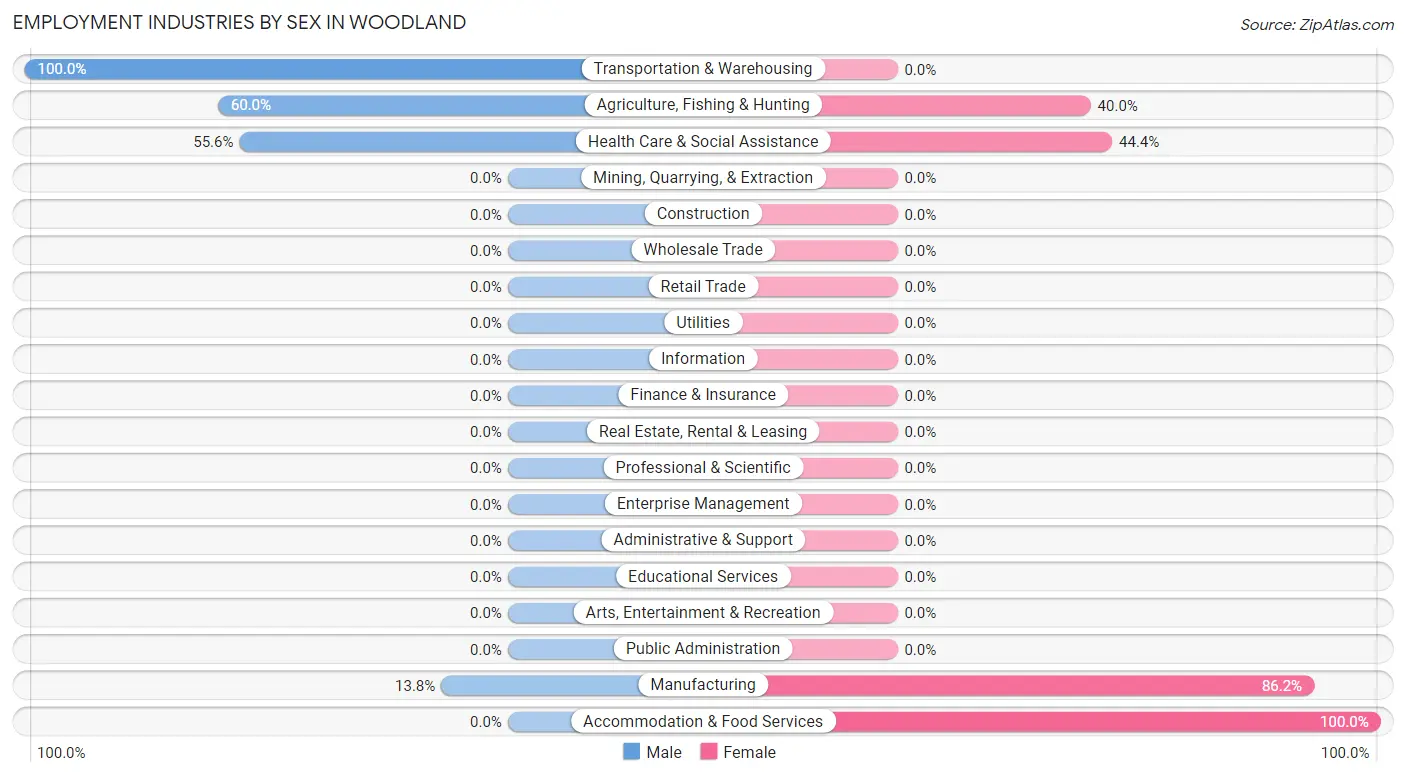
Employment Industries by Sex in Woodland
The Woodland industries that see more men than women are Transportation & Warehousing (100.0%), Agriculture, Fishing & Hunting (60.0%), and Health Care & Social Assistance (55.6%), whereas the industries that tend to have a higher number of women are Accommodation & Food Services (100.0%), Manufacturing (86.2%), and Health Care & Social Assistance (44.4%).
| Industry | Male | Female |
| Agriculture, Fishing & Hunting | 15 (60.0%) | 10 (40.0%) |
| Mining, Quarrying, & Extraction | 0 (0.0%) | 0 (0.0%) |
| Construction | 0 (0.0%) | 0 (0.0%) |
| Manufacturing | 4 (13.8%) | 25 (86.2%) |
| Wholesale Trade | 0 (0.0%) | 0 (0.0%) |
| Retail Trade | 0 (0.0%) | 0 (0.0%) |
| Transportation & Warehousing | 31 (100.0%) | 0 (0.0%) |
| Utilities | 0 (0.0%) | 0 (0.0%) |
| Information | 0 (0.0%) | 0 (0.0%) |
| Finance & Insurance | 0 (0.0%) | 0 (0.0%) |
| Real Estate, Rental & Leasing | 0 (0.0%) | 0 (0.0%) |
| Professional & Scientific | 0 (0.0%) | 0 (0.0%) |
| Enterprise Management | 0 (0.0%) | 0 (0.0%) |
| Administrative & Support | 0 (0.0%) | 0 (0.0%) |
| Educational Services | 0 (0.0%) | 0 (0.0%) |
| Health Care & Social Assistance | 5 (55.6%) | 4 (44.4%) |
| Arts, Entertainment & Recreation | 0 (0.0%) | 0 (0.0%) |
| Accommodation & Food Services | 0 (0.0%) | 6 (100.0%) |
| Public Administration | 0 (0.0%) | 0 (0.0%) |
| Total | 62 (57.9%) | 45 (42.1%) |
Education in Woodland
School Enrollment in Woodland
The most common levels of schooling among the 21 students in Woodland are high school (7 | 33.3%), middle school (6 | 28.6%), and college / undergraduate (5 | 23.8%).
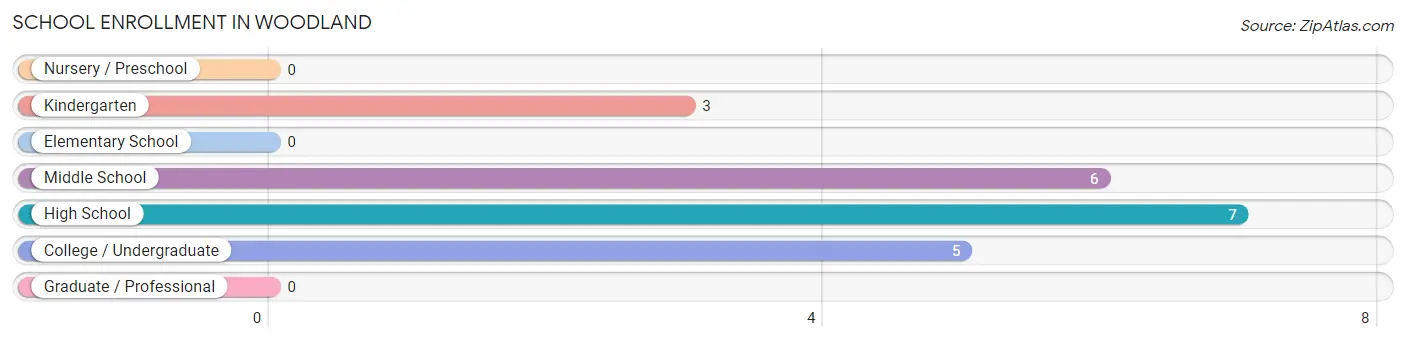
| School Level | # Students | % Students |
| Nursery / Preschool | 0 | 0.0% |
| Kindergarten | 3 | 14.3% |
| Elementary School | 0 | 0.0% |
| Middle School | 6 | 28.6% |
| High School | 7 | 33.3% |
| College / Undergraduate | 5 | 23.8% |
| Graduate / Professional | 0 | 0.0% |
| Total | 21 | 100.0% |
School Enrollment by Age by Funding Source in Woodland
Out of a total of 21 students who are enrolled in schools in Woodland, 5 (23.8%) attend a private institution, while the remaining 16 (76.2%) are enrolled in public schools. The age group of 25 to 34 year olds has the highest likelihood of being enrolled in private schools, with 5 (100.0% in the age bracket) enrolled. Conversely, the age group of 5 to 9 year old has the lowest likelihood of being enrolled in a private school, with 3 (100.0% in the age bracket) attending a public institution.
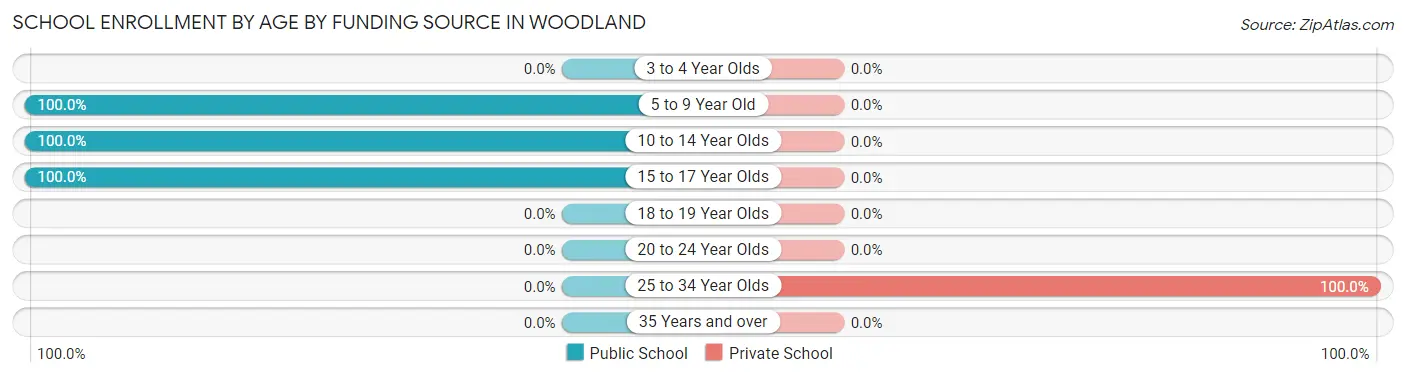
| Age Bracket | Public School | Private School |
| 3 to 4 Year Olds | 0 (0.0%) | 0 (0.0%) |
| 5 to 9 Year Old | 3 (100.0%) | 0 (0.0%) |
| 10 to 14 Year Olds | 6 (100.0%) | 0 (0.0%) |
| 15 to 17 Year Olds | 7 (100.0%) | 0 (0.0%) |
| 18 to 19 Year Olds | 0 (0.0%) | 0 (0.0%) |
| 20 to 24 Year Olds | 0 (0.0%) | 0 (0.0%) |
| 25 to 34 Year Olds | 0 (0.0%) | 5 (100.0%) |
| 35 Years and over | 0 (0.0%) | 0 (0.0%) |
| Total | 16 (76.2%) | 5 (23.8%) |
Educational Attainment by Field of Study in Woodland
, and education (2 | 100.0%) are the most common fields of study among 2 individuals in Woodland who have obtained a bachelor's degree or higher.
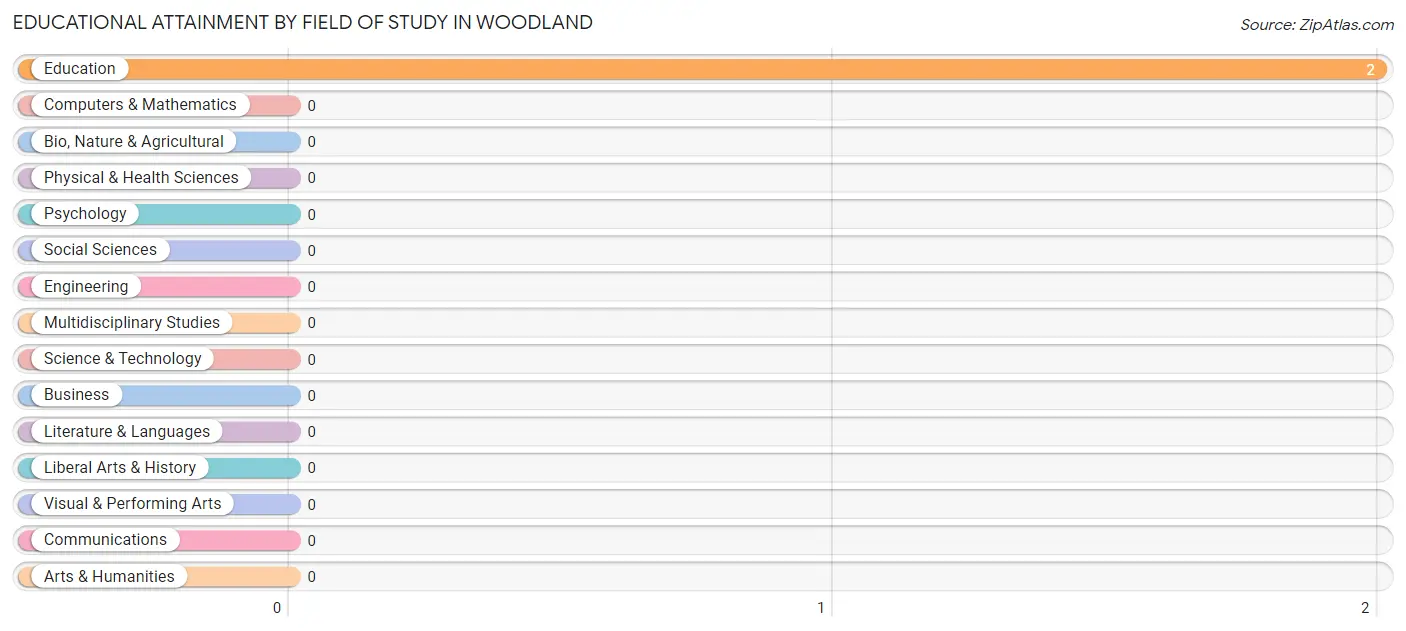
| Field of Study | # Graduates | % Graduates |
| Computers & Mathematics | 0 | 0.0% |
| Bio, Nature & Agricultural | 0 | 0.0% |
| Physical & Health Sciences | 0 | 0.0% |
| Psychology | 0 | 0.0% |
| Social Sciences | 0 | 0.0% |
| Engineering | 0 | 0.0% |
| Multidisciplinary Studies | 0 | 0.0% |
| Science & Technology | 0 | 0.0% |
| Business | 0 | 0.0% |
| Education | 2 | 100.0% |
| Literature & Languages | 0 | 0.0% |
| Liberal Arts & History | 0 | 0.0% |
| Visual & Performing Arts | 0 | 0.0% |
| Communications | 0 | 0.0% |
| Arts & Humanities | 0 | 0.0% |
| Total | 2 | 100.0% |
Transportation & Commute in Woodland
Vehicle Availability by Sex in Woodland
The most prevalent vehicle ownership categories in Woodland are males with 4 vehicles (28, accounting for 45.2%) and females with 4 vehicles (25, making up 62.2%).
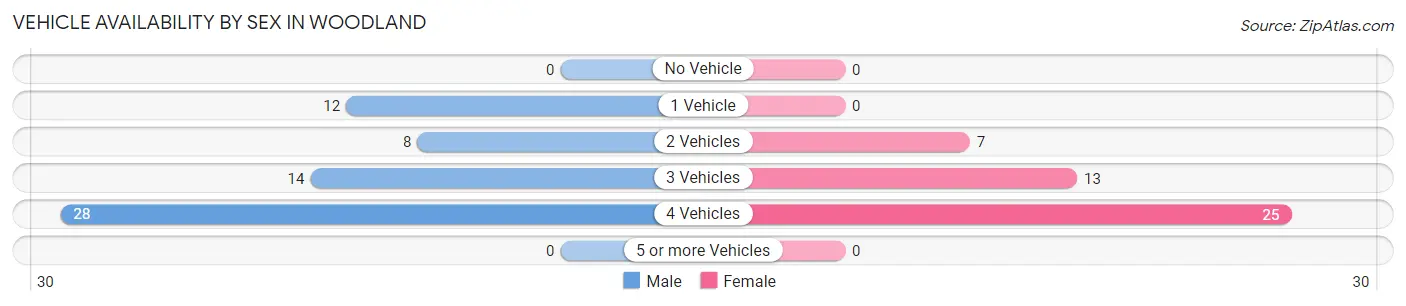
| Vehicles Available | Male | Female |
| No Vehicle | 0 (0.0%) | 0 (0.0%) |
| 1 Vehicle | 12 (19.4%) | 0 (0.0%) |
| 2 Vehicles | 8 (12.9%) | 7 (15.6%) |
| 3 Vehicles | 14 (22.6%) | 13 (28.9%) |
| 4 Vehicles | 28 (45.2%) | 25 (55.6%) |
| 5 or more Vehicles | 0 (0.0%) | 0 (0.0%) |
| Total | 62 (100.0%) | 45 (100.0%) |
Commute Time in Woodland
The most frequently occuring commute durations in Woodland are 90 or more minutes (31 commuters, 29.0%), 60 to 89 minutes (22 commuters, 20.6%), and 25 to 29 minutes (20 commuters, 18.7%).
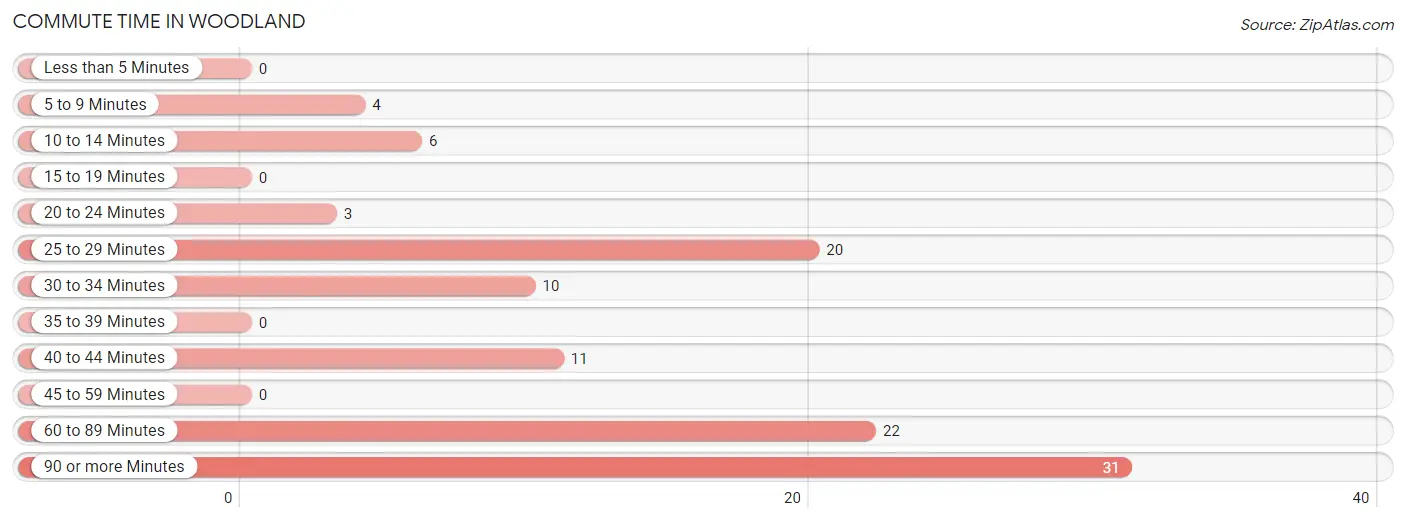
| Commute Time | # Commuters | % Commuters |
| Less than 5 Minutes | 0 | 0.0% |
| 5 to 9 Minutes | 4 | 3.7% |
| 10 to 14 Minutes | 6 | 5.6% |
| 15 to 19 Minutes | 0 | 0.0% |
| 20 to 24 Minutes | 3 | 2.8% |
| 25 to 29 Minutes | 20 | 18.7% |
| 30 to 34 Minutes | 10 | 9.3% |
| 35 to 39 Minutes | 0 | 0.0% |
| 40 to 44 Minutes | 11 | 10.3% |
| 45 to 59 Minutes | 0 | 0.0% |
| 60 to 89 Minutes | 22 | 20.6% |
| 90 or more Minutes | 31 | 29.0% |
Commute Time by Sex in Woodland
The most common commute times in Woodland are 90 or more minutes (31 commuters, 50.0%) for males and 60 to 89 minutes (15 commuters, 33.3%) for females.
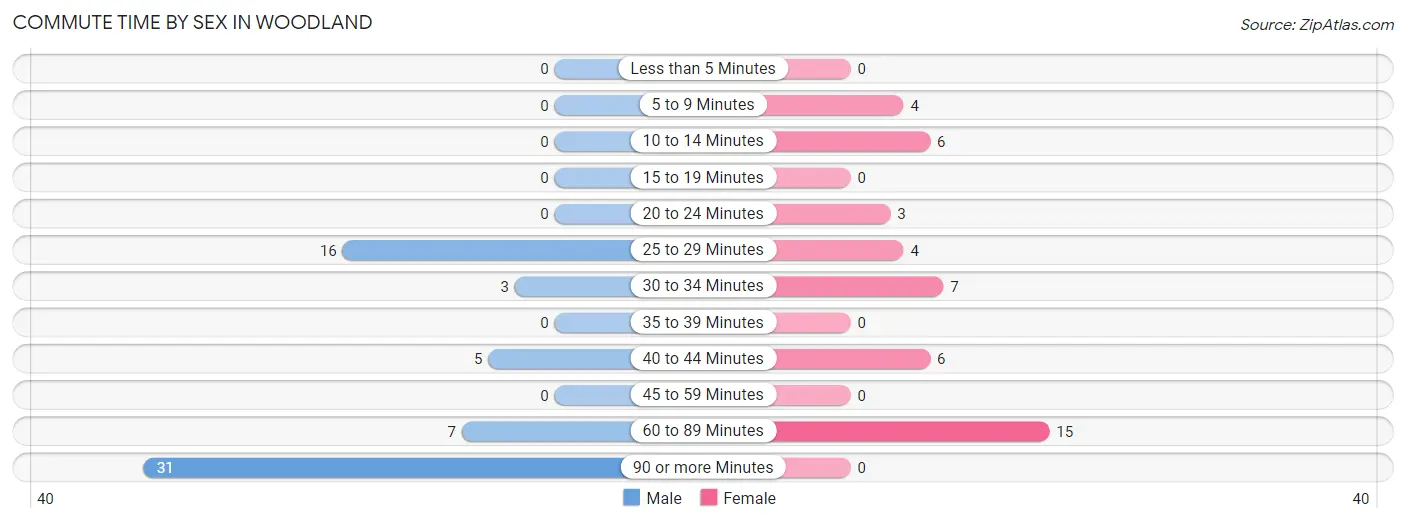
| Commute Time | Male | Female |
| Less than 5 Minutes | 0 (0.0%) | 0 (0.0%) |
| 5 to 9 Minutes | 0 (0.0%) | 4 (8.9%) |
| 10 to 14 Minutes | 0 (0.0%) | 6 (13.3%) |
| 15 to 19 Minutes | 0 (0.0%) | 0 (0.0%) |
| 20 to 24 Minutes | 0 (0.0%) | 3 (6.7%) |
| 25 to 29 Minutes | 16 (25.8%) | 4 (8.9%) |
| 30 to 34 Minutes | 3 (4.8%) | 7 (15.6%) |
| 35 to 39 Minutes | 0 (0.0%) | 0 (0.0%) |
| 40 to 44 Minutes | 5 (8.1%) | 6 (13.3%) |
| 45 to 59 Minutes | 0 (0.0%) | 0 (0.0%) |
| 60 to 89 Minutes | 7 (11.3%) | 15 (33.3%) |
| 90 or more Minutes | 31 (50.0%) | 0 (0.0%) |
Time of Departure to Work by Sex in Woodland
The most frequent times of departure to work in Woodland are 7:00 AM to 7:29 AM (24, 38.7%) for males and 12:00 AM to 4:59 AM (22, 48.9%) for females.
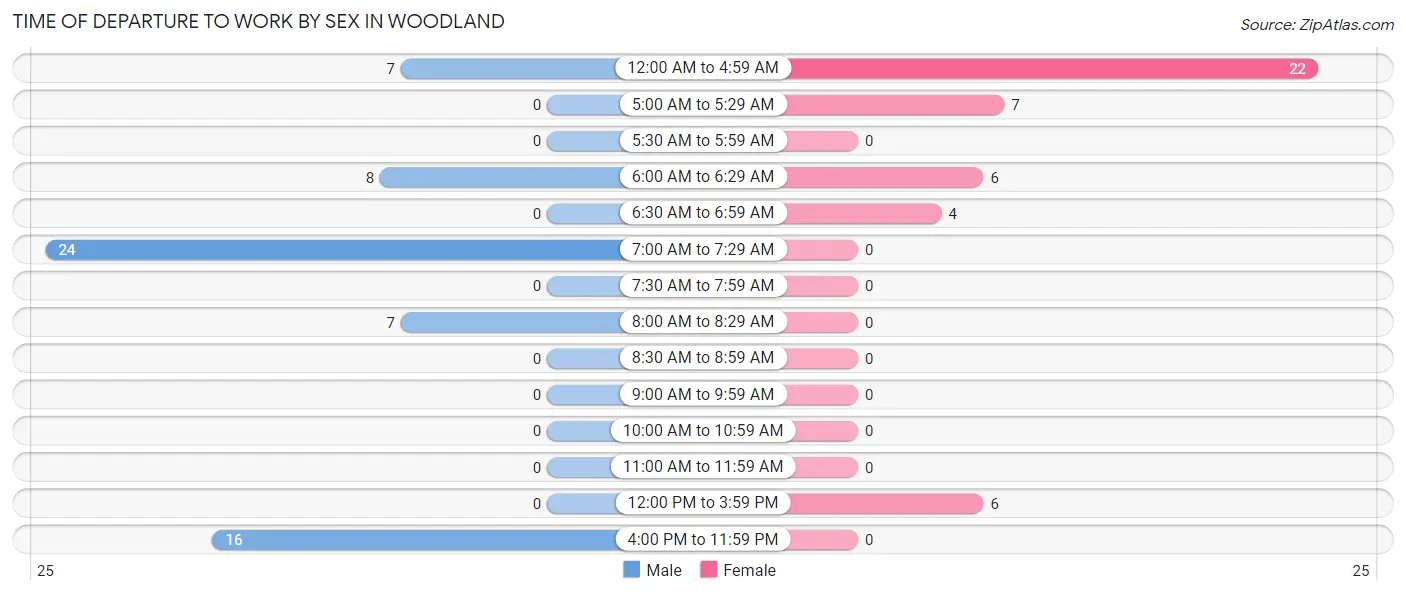
| Time of Departure | Male | Female |
| 12:00 AM to 4:59 AM | 7 (11.3%) | 22 (48.9%) |
| 5:00 AM to 5:29 AM | 0 (0.0%) | 7 (15.6%) |
| 5:30 AM to 5:59 AM | 0 (0.0%) | 0 (0.0%) |
| 6:00 AM to 6:29 AM | 8 (12.9%) | 6 (13.3%) |
| 6:30 AM to 6:59 AM | 0 (0.0%) | 4 (8.9%) |
| 7:00 AM to 7:29 AM | 24 (38.7%) | 0 (0.0%) |
| 7:30 AM to 7:59 AM | 0 (0.0%) | 0 (0.0%) |
| 8:00 AM to 8:29 AM | 7 (11.3%) | 0 (0.0%) |
| 8:30 AM to 8:59 AM | 0 (0.0%) | 0 (0.0%) |
| 9:00 AM to 9:59 AM | 0 (0.0%) | 0 (0.0%) |
| 10:00 AM to 10:59 AM | 0 (0.0%) | 0 (0.0%) |
| 11:00 AM to 11:59 AM | 0 (0.0%) | 0 (0.0%) |
| 12:00 PM to 3:59 PM | 0 (0.0%) | 6 (13.3%) |
| 4:00 PM to 11:59 PM | 16 (25.8%) | 0 (0.0%) |
| Total | 62 (100.0%) | 45 (100.0%) |
Housing Occupancy in Woodland
Occupancy by Ownership in Woodland
Of the total 79 dwellings in Woodland, owner-occupied units account for 27 (34.2%), while renter-occupied units make up 52 (65.8%).
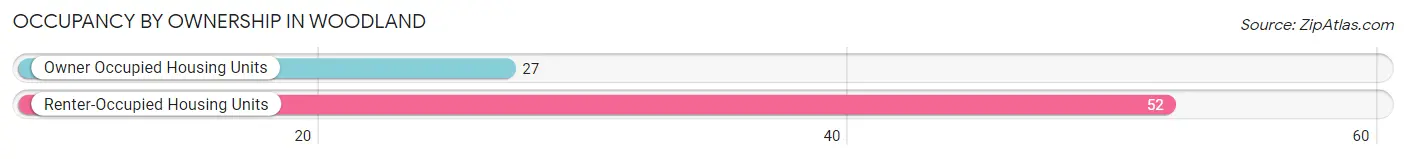
| Occupancy | # Housing Units | % Housing Units |
| Owner Occupied Housing Units | 27 | 34.2% |
| Renter-Occupied Housing Units | 52 | 65.8% |
| Total Occupied Housing Units | 79 | 100.0% |
Occupancy by Household Size in Woodland
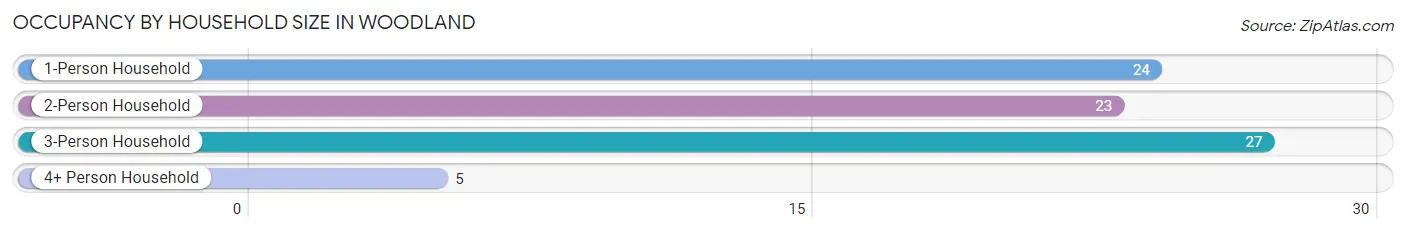
| Household Size | # Housing Units | % Housing Units |
| 1-Person Household | 24 | 30.4% |
| 2-Person Household | 23 | 29.1% |
| 3-Person Household | 27 | 34.2% |
| 4+ Person Household | 5 | 6.3% |
| Total Housing Units | 79 | 100.0% |
Occupancy by Ownership by Household Size in Woodland
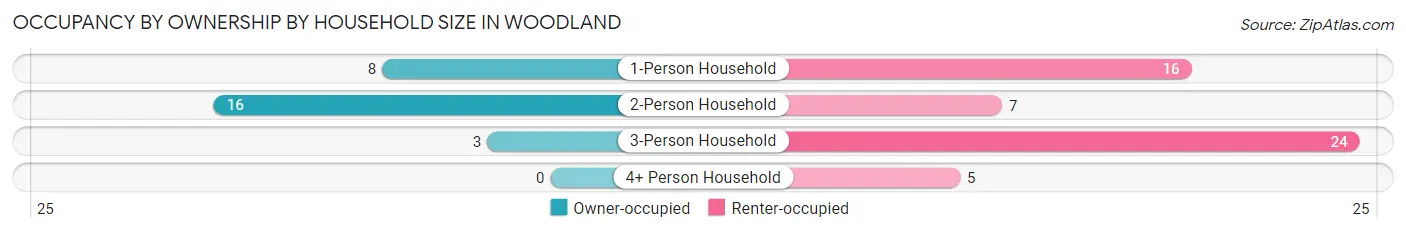
| Household Size | Owner-occupied | Renter-occupied |
| 1-Person Household | 8 (33.3%) | 16 (66.7%) |
| 2-Person Household | 16 (69.6%) | 7 (30.4%) |
| 3-Person Household | 3 (11.1%) | 24 (88.9%) |
| 4+ Person Household | 0 (0.0%) | 5 (100.0%) |
| Total Housing Units | 27 (34.2%) | 52 (65.8%) |
Occupancy by Educational Attainment in Woodland
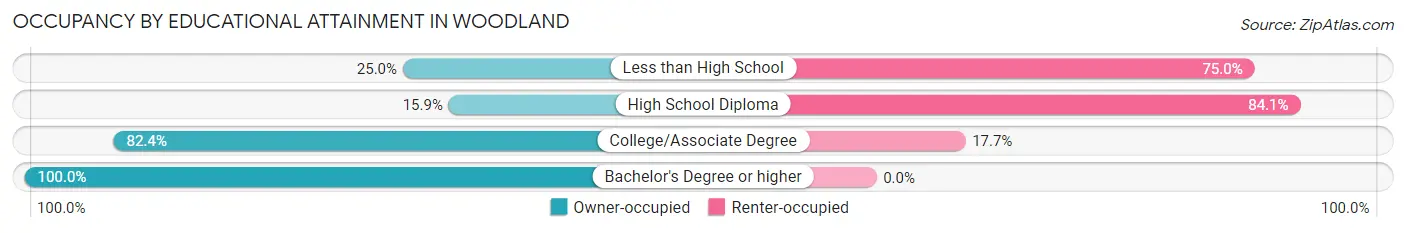
| Household Size | Owner-occupied | Renter-occupied |
| Less than High School | 4 (25.0%) | 12 (75.0%) |
| High School Diploma | 7 (15.9%) | 37 (84.1%) |
| College/Associate Degree | 14 (82.4%) | 3 (17.6%) |
| Bachelor's Degree or higher | 2 (100.0%) | 0 (0.0%) |
Occupancy by Age of Householder in Woodland
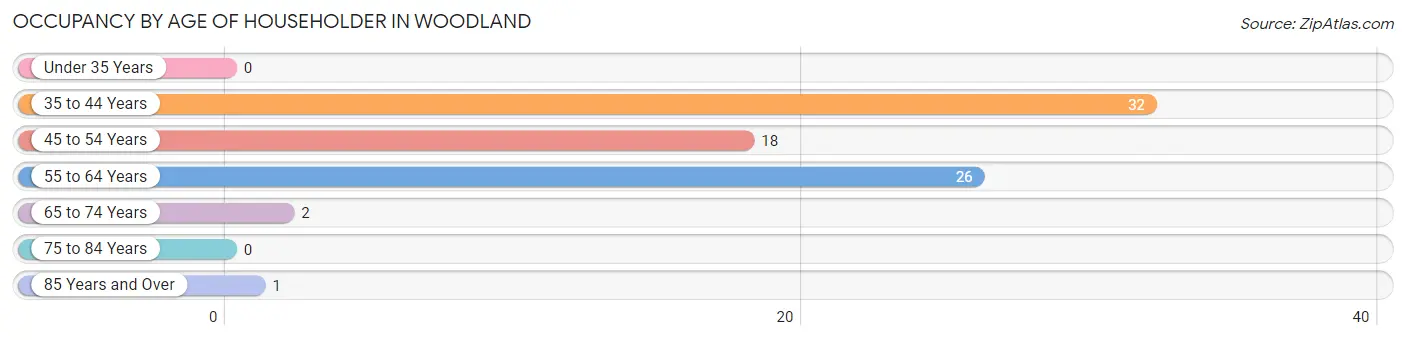
| Age Bracket | # Households | % Households |
| Under 35 Years | 0 | 0.0% |
| 35 to 44 Years | 32 | 40.5% |
| 45 to 54 Years | 18 | 22.8% |
| 55 to 64 Years | 26 | 32.9% |
| 65 to 74 Years | 2 | 2.5% |
| 75 to 84 Years | 0 | 0.0% |
| 85 Years and Over | 1 | 1.3% |
| Total | 79 | 100.0% |
Housing Finances in Woodland
Median Income by Occupancy in Woodland
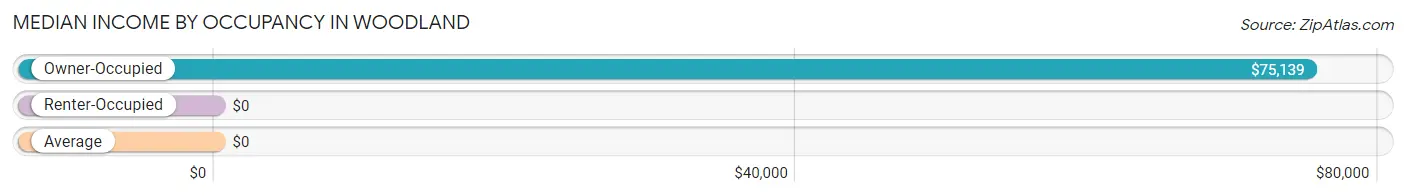
| Occupancy Type | # Households | Median Income |
| Owner-Occupied | 27 (34.2%) | $75,139 |
| Renter-Occupied | 52 (65.8%) | $0 |
| Average | 79 (100.0%) | $0 |
Occupancy by Householder Income Bracket in Woodland
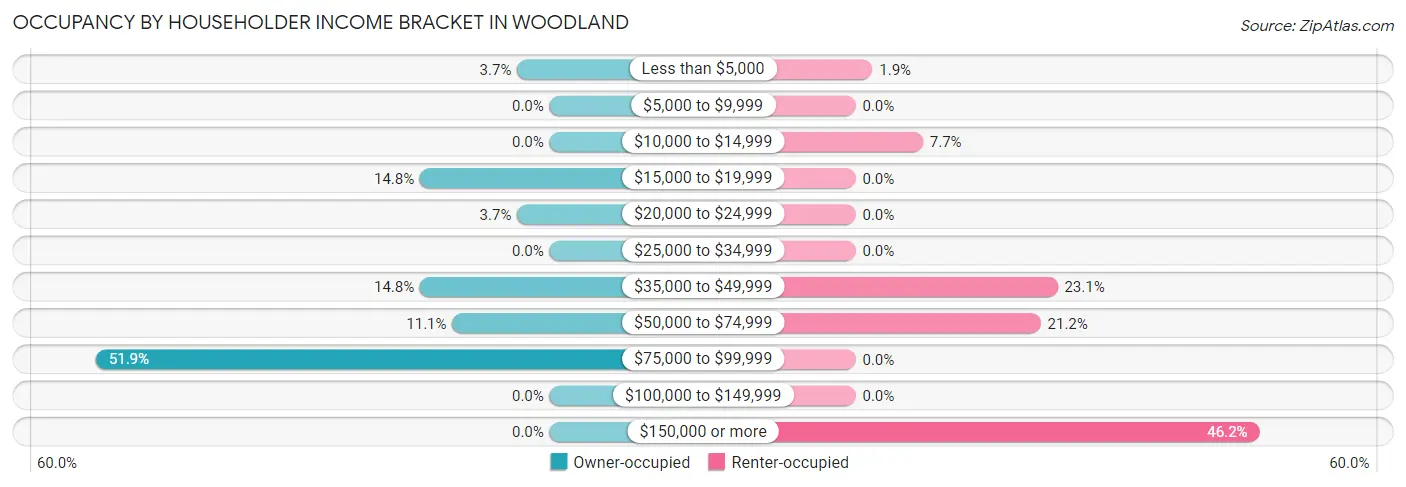
| Income Bracket | Owner-occupied | Renter-occupied |
| Less than $5,000 | 1 (3.7%) | 1 (1.9%) |
| $5,000 to $9,999 | 0 (0.0%) | 0 (0.0%) |
| $10,000 to $14,999 | 0 (0.0%) | 4 (7.7%) |
| $15,000 to $19,999 | 4 (14.8%) | 0 (0.0%) |
| $20,000 to $24,999 | 1 (3.7%) | 0 (0.0%) |
| $25,000 to $34,999 | 0 (0.0%) | 0 (0.0%) |
| $35,000 to $49,999 | 4 (14.8%) | 12 (23.1%) |
| $50,000 to $74,999 | 3 (11.1%) | 11 (21.1%) |
| $75,000 to $99,999 | 14 (51.8%) | 0 (0.0%) |
| $100,000 to $149,999 | 0 (0.0%) | 0 (0.0%) |
| $150,000 or more | 0 (0.0%) | 24 (46.2%) |
| Total | 27 (100.0%) | 52 (100.0%) |
Monthly Housing Cost Tiers in Woodland
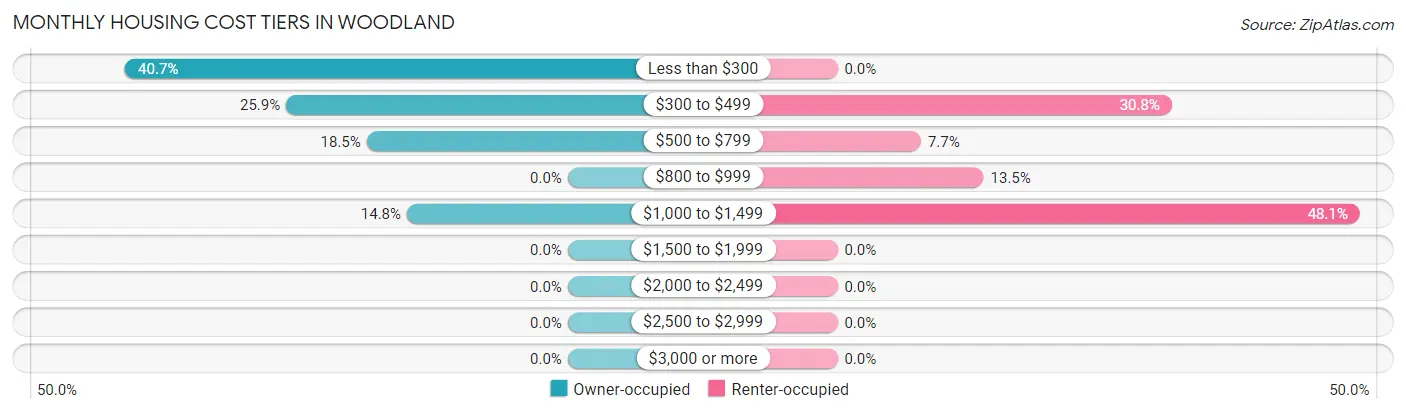
| Monthly Cost | Owner-occupied | Renter-occupied |
| Less than $300 | 11 (40.7%) | 0 (0.0%) |
| $300 to $499 | 7 (25.9%) | 16 (30.8%) |
| $500 to $799 | 5 (18.5%) | 4 (7.7%) |
| $800 to $999 | 0 (0.0%) | 7 (13.5%) |
| $1,000 to $1,499 | 4 (14.8%) | 25 (48.1%) |
| $1,500 to $1,999 | 0 (0.0%) | 0 (0.0%) |
| $2,000 to $2,499 | 0 (0.0%) | 0 (0.0%) |
| $2,500 to $2,999 | 0 (0.0%) | 0 (0.0%) |
| $3,000 or more | 0 (0.0%) | 0 (0.0%) |
| Total | 27 (100.0%) | 52 (100.0%) |
Physical Housing Characteristics in Woodland
Housing Structures in Woodland
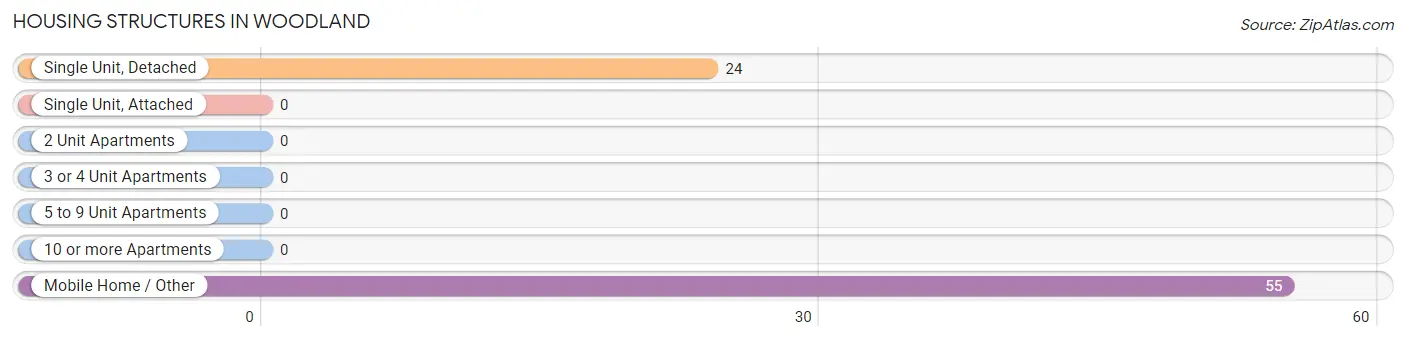
| Structure Type | # Housing Units | % Housing Units |
| Single Unit, Detached | 24 | 30.4% |
| Single Unit, Attached | 0 | 0.0% |
| 2 Unit Apartments | 0 | 0.0% |
| 3 or 4 Unit Apartments | 0 | 0.0% |
| 5 to 9 Unit Apartments | 0 | 0.0% |
| 10 or more Apartments | 0 | 0.0% |
| Mobile Home / Other | 55 | 69.6% |
| Total | 79 | 100.0% |
Housing Structures by Occupancy in Woodland
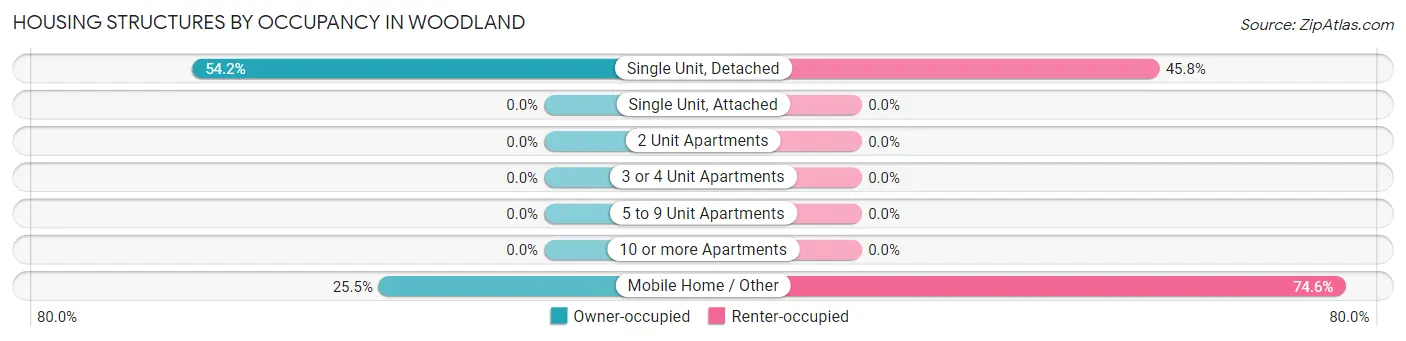
| Structure Type | Owner-occupied | Renter-occupied |
| Single Unit, Detached | 13 (54.2%) | 11 (45.8%) |
| Single Unit, Attached | 0 (0.0%) | 0 (0.0%) |
| 2 Unit Apartments | 0 (0.0%) | 0 (0.0%) |
| 3 or 4 Unit Apartments | 0 (0.0%) | 0 (0.0%) |
| 5 to 9 Unit Apartments | 0 (0.0%) | 0 (0.0%) |
| 10 or more Apartments | 0 (0.0%) | 0 (0.0%) |
| Mobile Home / Other | 14 (25.5%) | 41 (74.6%) |
| Total | 27 (34.2%) | 52 (65.8%) |
Housing Structures by Number of Rooms in Woodland
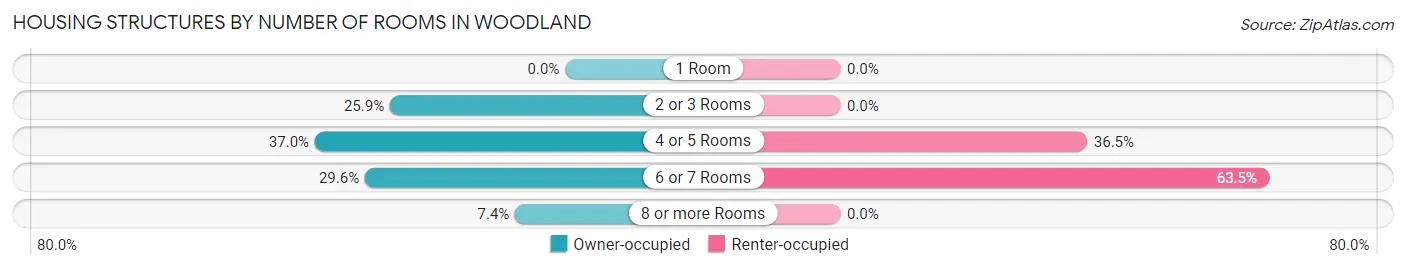
| Number of Rooms | Owner-occupied | Renter-occupied |
| 1 Room | 0 (0.0%) | 0 (0.0%) |
| 2 or 3 Rooms | 7 (25.9%) | 0 (0.0%) |
| 4 or 5 Rooms | 10 (37.0%) | 19 (36.5%) |
| 6 or 7 Rooms | 8 (29.6%) | 33 (63.5%) |
| 8 or more Rooms | 2 (7.4%) | 0 (0.0%) |
| Total | 27 (100.0%) | 52 (100.0%) |
Housing Structure by Heating Type in Woodland
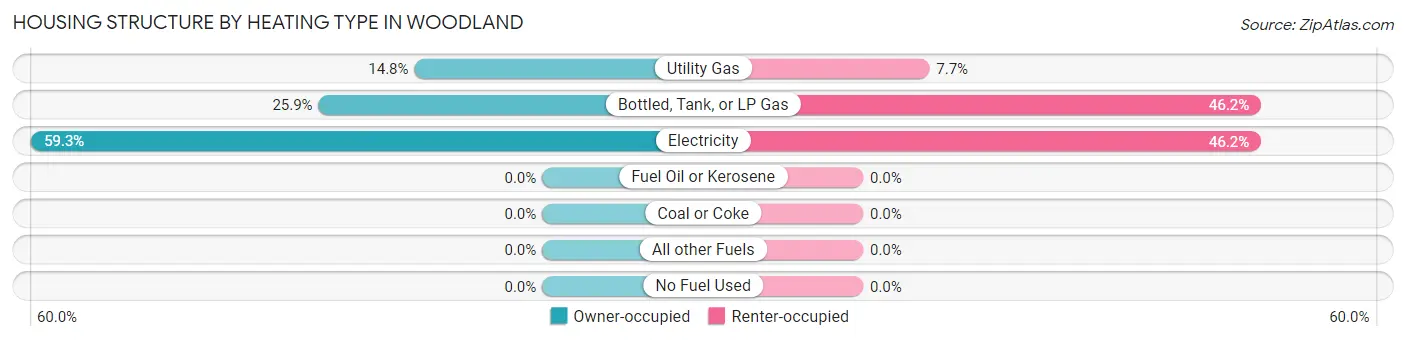
| Heating Type | Owner-occupied | Renter-occupied |
| Utility Gas | 4 (14.8%) | 4 (7.7%) |
| Bottled, Tank, or LP Gas | 7 (25.9%) | 24 (46.2%) |
| Electricity | 16 (59.3%) | 24 (46.2%) |
| Fuel Oil or Kerosene | 0 (0.0%) | 0 (0.0%) |
| Coal or Coke | 0 (0.0%) | 0 (0.0%) |
| All other Fuels | 0 (0.0%) | 0 (0.0%) |
| No Fuel Used | 0 (0.0%) | 0 (0.0%) |
| Total | 27 (100.0%) | 52 (100.0%) |
Household Vehicle Usage in Woodland
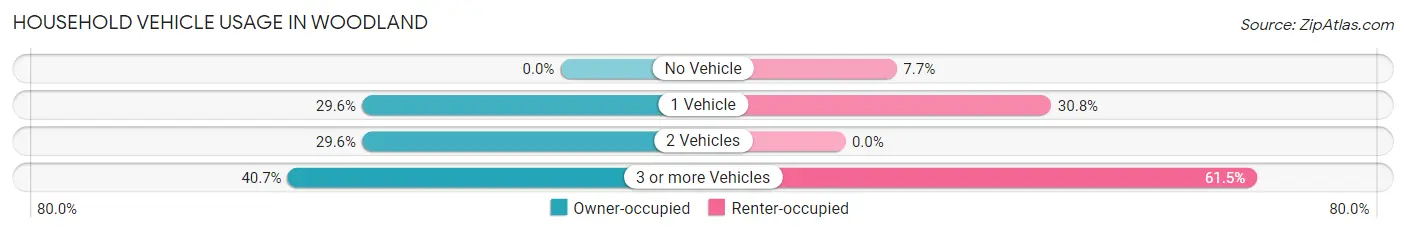
| Vehicles per Household | Owner-occupied | Renter-occupied |
| No Vehicle | 0 (0.0%) | 4 (7.7%) |
| 1 Vehicle | 8 (29.6%) | 16 (30.8%) |
| 2 Vehicles | 8 (29.6%) | 0 (0.0%) |
| 3 or more Vehicles | 11 (40.7%) | 32 (61.5%) |
| Total | 27 (100.0%) | 52 (100.0%) |
Real Estate & Mortgages in Woodland
Real Estate and Mortgage Overview in Woodland
| Characteristic | Without Mortgage | With Mortgage |
| Housing Units | 23 | 4 |
| Median Property Value | $54,400 | $0 |
| Median Household Income | $75,694 | $0 |
| Monthly Housing Costs | $308 | $0 |
| Real Estate Taxes | $350 | $0 |
Property Value by Mortgage Status in Woodland
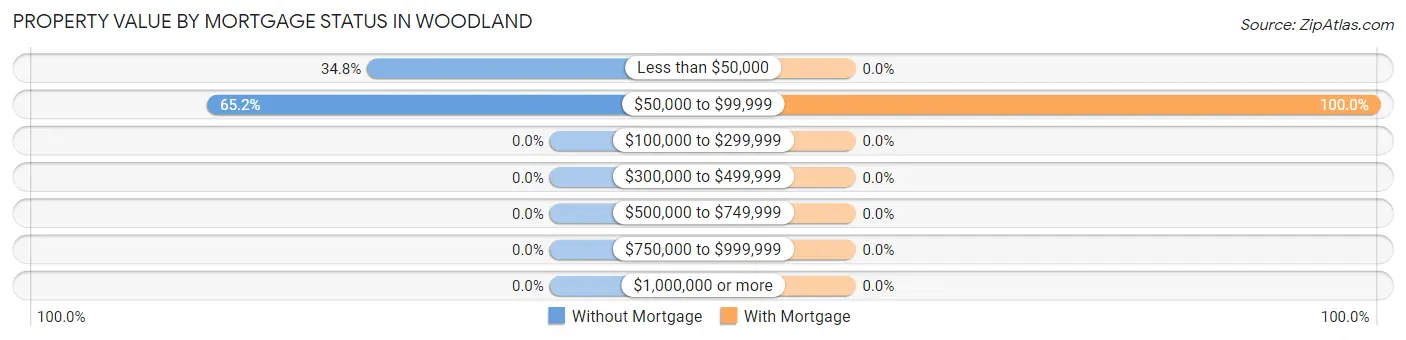
| Property Value | Without Mortgage | With Mortgage |
| Less than $50,000 | 8 (34.8%) | 0 (0.0%) |
| $50,000 to $99,999 | 15 (65.2%) | 4 (100.0%) |
| $100,000 to $299,999 | 0 (0.0%) | 0 (0.0%) |
| $300,000 to $499,999 | 0 (0.0%) | 0 (0.0%) |
| $500,000 to $749,999 | 0 (0.0%) | 0 (0.0%) |
| $750,000 to $999,999 | 0 (0.0%) | 0 (0.0%) |
| $1,000,000 or more | 0 (0.0%) | 0 (0.0%) |
| Total | 23 (100.0%) | 4 (100.0%) |
Household Income by Mortgage Status in Woodland
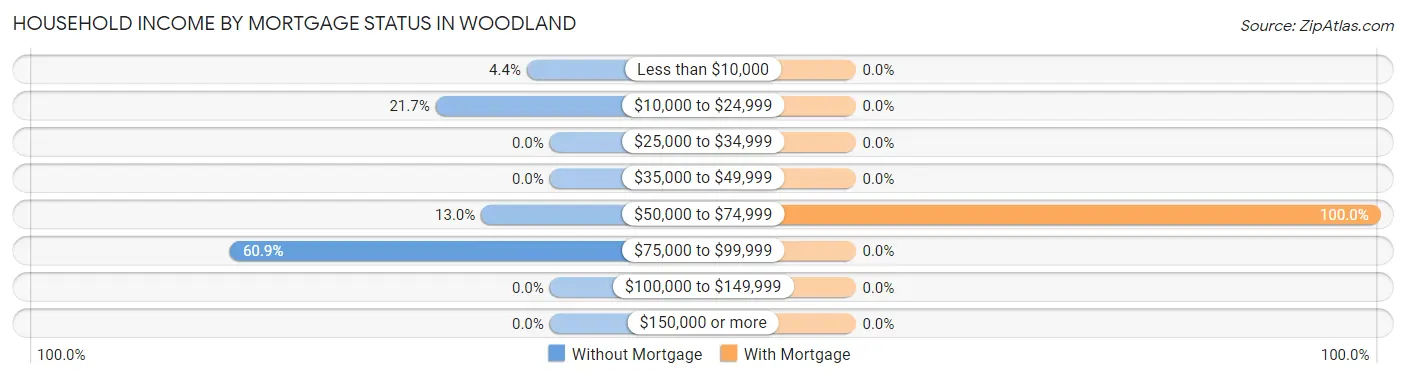
| Household Income | Without Mortgage | With Mortgage |
| Less than $10,000 | 1 (4.3%) | 0 (0.0%) |
| $10,000 to $24,999 | 5 (21.7%) | 0 (0.0%) |
| $25,000 to $34,999 | 0 (0.0%) | 0 (0.0%) |
| $35,000 to $49,999 | 0 (0.0%) | 0 (0.0%) |
| $50,000 to $74,999 | 3 (13.0%) | 4 (100.0%) |
| $75,000 to $99,999 | 14 (60.9%) | 0 (0.0%) |
| $100,000 to $149,999 | 0 (0.0%) | 0 (0.0%) |
| $150,000 or more | 0 (0.0%) | 0 (0.0%) |
| Total | 23 (100.0%) | 4 (100.0%) |
Property Value to Household Income Ratio in Woodland
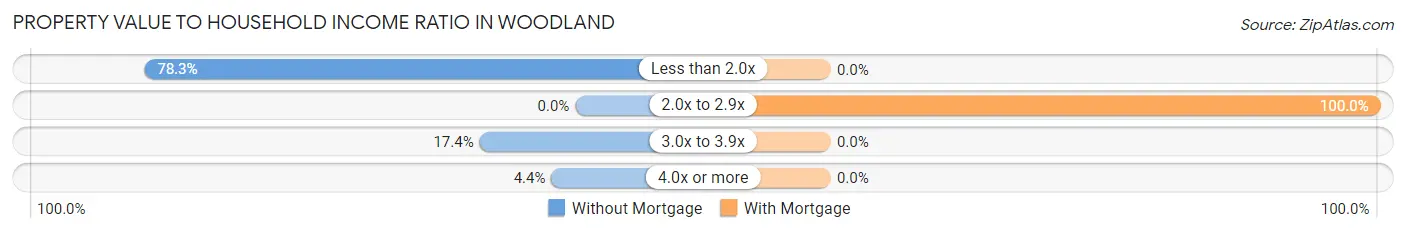
| Value-to-Income Ratio | Without Mortgage | With Mortgage |
| Less than 2.0x | 18 (78.3%) | 0 (0.0%) |
| 2.0x to 2.9x | 0 (0.0%) | 4 (100.0%) |
| 3.0x to 3.9x | 4 (17.4%) | 0 (0.0%) |
| 4.0x or more | 1 (4.3%) | 0 (0.0%) |
| Total | 23 (100.0%) | 4 (100.0%) |
Real Estate Taxes by Mortgage Status in Woodland
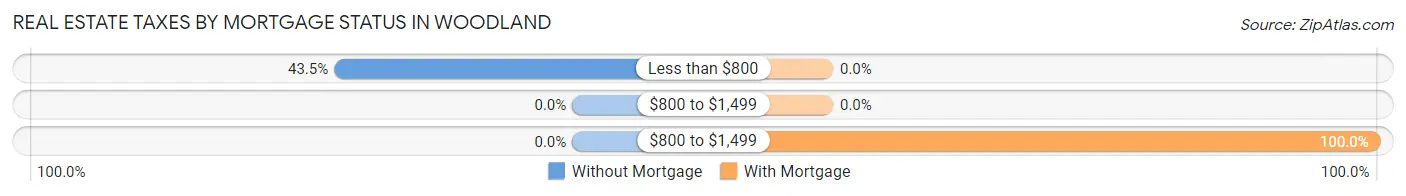
| Property Taxes | Without Mortgage | With Mortgage |
| Less than $800 | 10 (43.5%) | 0 (0.0%) |
| $800 to $1,499 | 0 (0.0%) | 0 (0.0%) |
| $800 to $1,499 | 0 (0.0%) | 4 (100.0%) |
| Total | 23 (100.0%) | 4 (100.0%) |
Health & Disability in Woodland
Health Insurance Coverage by Age in Woodland
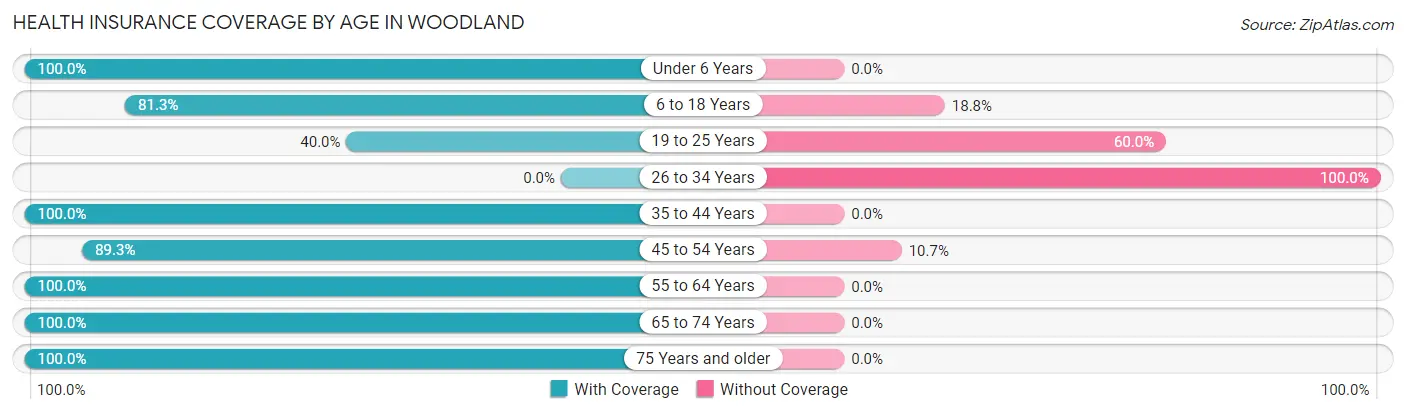
| Age Bracket | With Coverage | Without Coverage |
| Under 6 Years | 1 (100.0%) | 0 (0.0%) |
| 6 to 18 Years | 13 (81.2%) | 3 (18.8%) |
| 19 to 25 Years | 4 (40.0%) | 6 (60.0%) |
| 26 to 34 Years | 0 (0.0%) | 5 (100.0%) |
| 35 to 44 Years | 48 (100.0%) | 0 (0.0%) |
| 45 to 54 Years | 25 (89.3%) | 3 (10.7%) |
| 55 to 64 Years | 41 (100.0%) | 0 (0.0%) |
| 65 to 74 Years | 7 (100.0%) | 0 (0.0%) |
| 75 Years and older | 1 (100.0%) | 0 (0.0%) |
| Total | 140 (89.2%) | 17 (10.8%) |
Health Insurance Coverage by Citizenship Status in Woodland
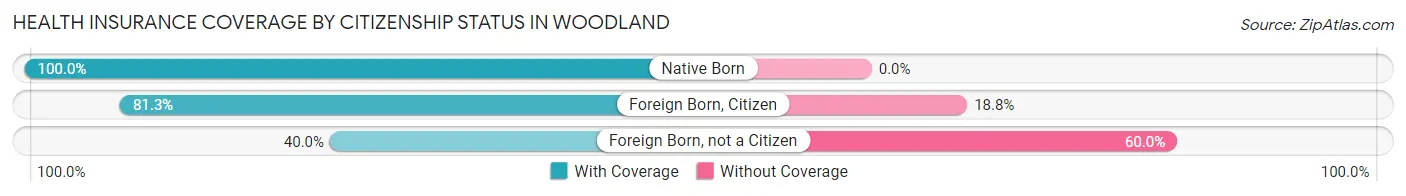
| Citizenship Status | With Coverage | Without Coverage |
| Native Born | 1 (100.0%) | 0 (0.0%) |
| Foreign Born, Citizen | 13 (81.2%) | 3 (18.8%) |
| Foreign Born, not a Citizen | 4 (40.0%) | 6 (60.0%) |
Health Insurance Coverage by Household Income in Woodland
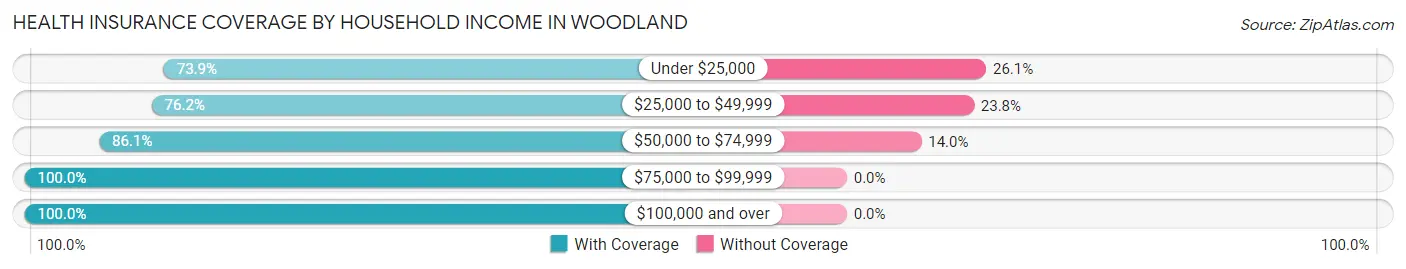
| Household Income | With Coverage | Without Coverage |
| Under $25,000 | 17 (73.9%) | 6 (26.1%) |
| $25,000 to $49,999 | 16 (76.2%) | 5 (23.8%) |
| $50,000 to $74,999 | 37 (86.1%) | 6 (14.0%) |
| $75,000 to $99,999 | 25 (100.0%) | 0 (0.0%) |
| $100,000 and over | 45 (100.0%) | 0 (0.0%) |
Public vs Private Health Insurance Coverage by Age in Woodland
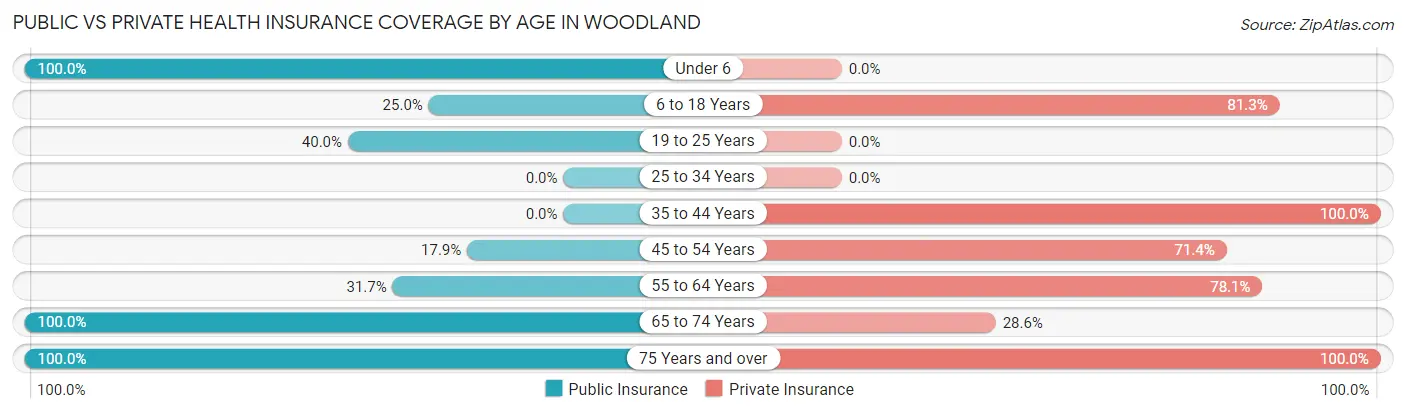
| Age Bracket | Public Insurance | Private Insurance |
| Under 6 | 1 (100.0%) | 0 (0.0%) |
| 6 to 18 Years | 4 (25.0%) | 13 (81.2%) |
| 19 to 25 Years | 4 (40.0%) | 0 (0.0%) |
| 25 to 34 Years | 0 (0.0%) | 0 (0.0%) |
| 35 to 44 Years | 0 (0.0%) | 48 (100.0%) |
| 45 to 54 Years | 5 (17.9%) | 20 (71.4%) |
| 55 to 64 Years | 13 (31.7%) | 32 (78.0%) |
| 65 to 74 Years | 7 (100.0%) | 2 (28.6%) |
| 75 Years and over | 1 (100.0%) | 1 (100.0%) |
| Total | 35 (22.3%) | 116 (73.9%) |
Disability Status by Sex by Age in Woodland
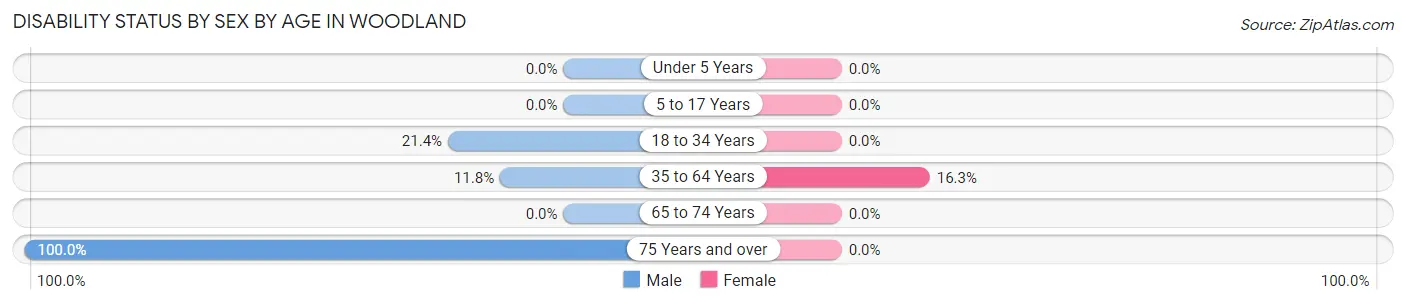
| Age Bracket | Male | Female |
| Under 5 Years | 0 (0.0%) | 0 (0.0%) |
| 5 to 17 Years | 0 (0.0%) | 0 (0.0%) |
| 18 to 34 Years | 3 (21.4%) | 0 (0.0%) |
| 35 to 64 Years | 8 (11.8%) | 8 (16.3%) |
| 65 to 74 Years | 0 (0.0%) | 0 (0.0%) |
| 75 Years and over | 1 (100.0%) | 0 (0.0%) |
Disability Class by Sex by Age in Woodland
Disability Class: Hearing Difficulty
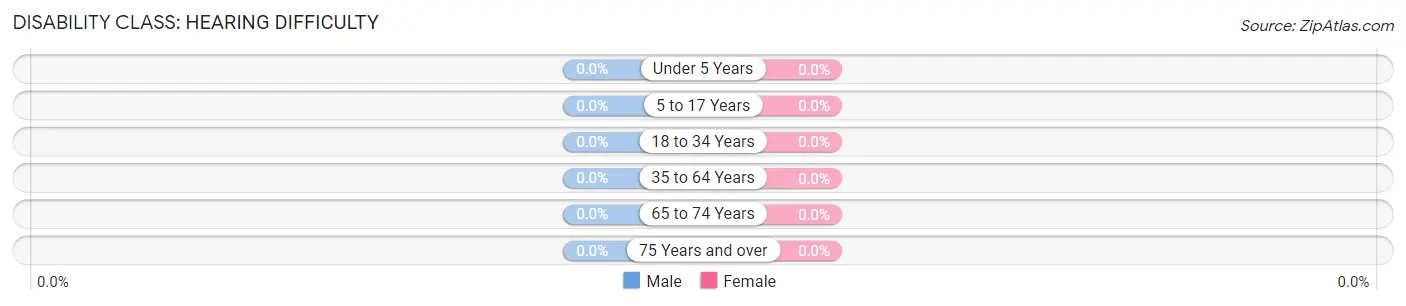
| Age Bracket | Male | Female |
| Under 5 Years | 0 (0.0%) | 0 (0.0%) |
| 5 to 17 Years | 0 (0.0%) | 0 (0.0%) |
| 18 to 34 Years | 0 (0.0%) | 0 (0.0%) |
| 35 to 64 Years | 0 (0.0%) | 0 (0.0%) |
| 65 to 74 Years | 0 (0.0%) | 0 (0.0%) |
| 75 Years and over | 0 (0.0%) | 0 (0.0%) |
Disability Class: Vision Difficulty
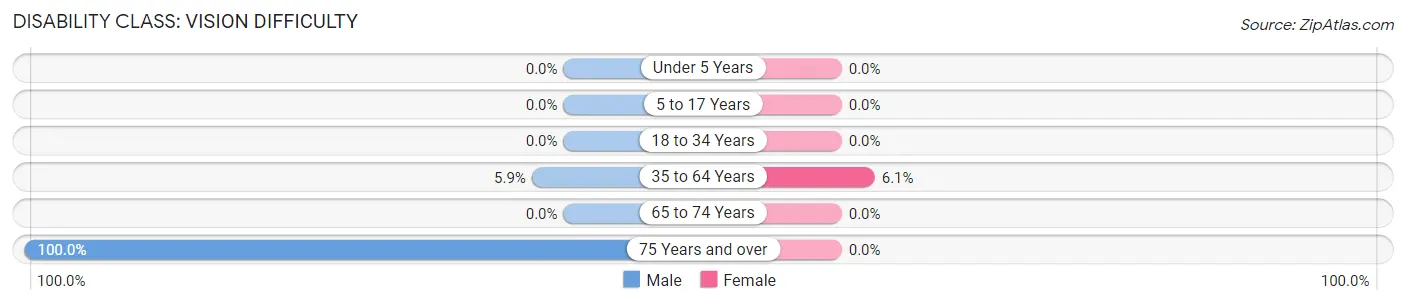
| Age Bracket | Male | Female |
| Under 5 Years | 0 (0.0%) | 0 (0.0%) |
| 5 to 17 Years | 0 (0.0%) | 0 (0.0%) |
| 18 to 34 Years | 0 (0.0%) | 0 (0.0%) |
| 35 to 64 Years | 4 (5.9%) | 3 (6.1%) |
| 65 to 74 Years | 0 (0.0%) | 0 (0.0%) |
| 75 Years and over | 1 (100.0%) | 0 (0.0%) |
Disability Class: Cognitive Difficulty
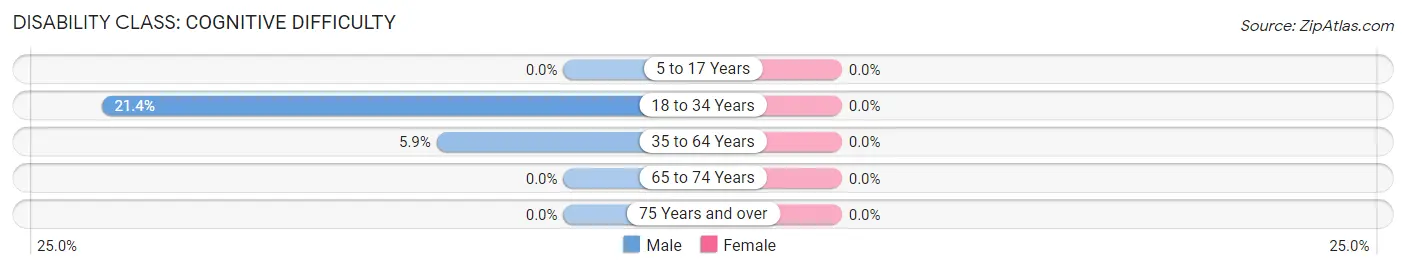
| Age Bracket | Male | Female |
| 5 to 17 Years | 0 (0.0%) | 0 (0.0%) |
| 18 to 34 Years | 3 (21.4%) | 0 (0.0%) |
| 35 to 64 Years | 4 (5.9%) | 0 (0.0%) |
| 65 to 74 Years | 0 (0.0%) | 0 (0.0%) |
| 75 Years and over | 0 (0.0%) | 0 (0.0%) |
Disability Class: Ambulatory Difficulty
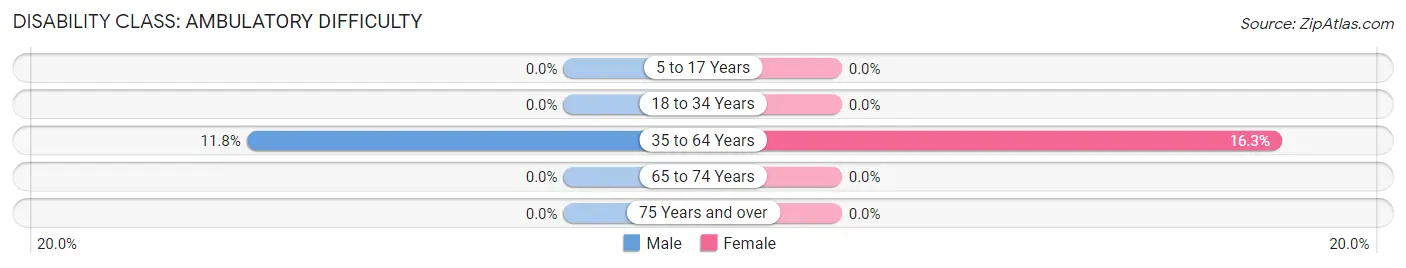
| Age Bracket | Male | Female |
| 5 to 17 Years | 0 (0.0%) | 0 (0.0%) |
| 18 to 34 Years | 0 (0.0%) | 0 (0.0%) |
| 35 to 64 Years | 8 (11.8%) | 8 (16.3%) |
| 65 to 74 Years | 0 (0.0%) | 0 (0.0%) |
| 75 Years and over | 0 (0.0%) | 0 (0.0%) |
Disability Class: Self-Care Difficulty
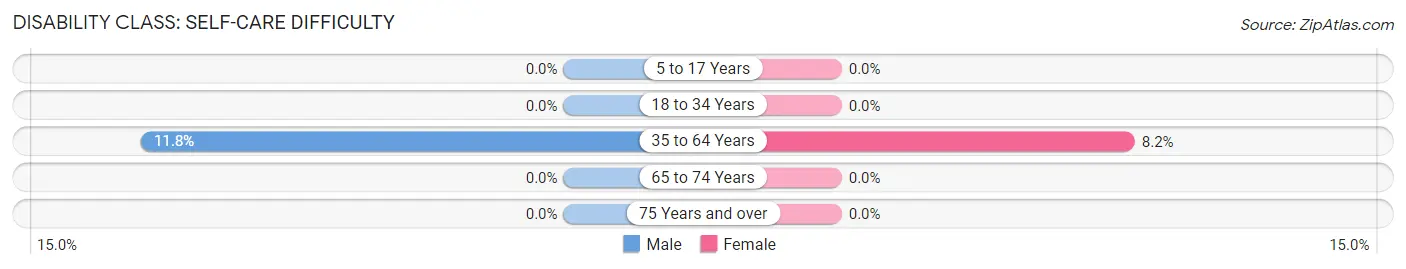
| Age Bracket | Male | Female |
| 5 to 17 Years | 0 (0.0%) | 0 (0.0%) |
| 18 to 34 Years | 0 (0.0%) | 0 (0.0%) |
| 35 to 64 Years | 8 (11.8%) | 4 (8.2%) |
| 65 to 74 Years | 0 (0.0%) | 0 (0.0%) |
| 75 Years and over | 0 (0.0%) | 0 (0.0%) |
Technology Access in Woodland
Computing Device Access in Woodland
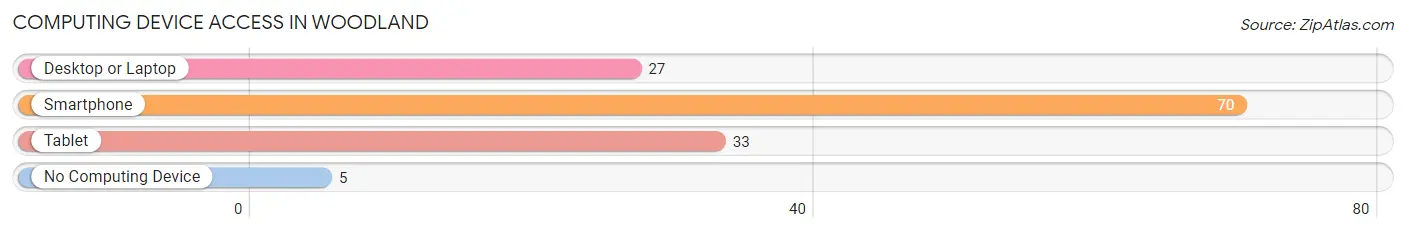
| Device Type | # Households | % Households |
| Desktop or Laptop | 27 | 34.2% |
| Smartphone | 70 | 88.6% |
| Tablet | 33 | 41.8% |
| No Computing Device | 5 | 6.3% |
| Total | 79 | 100.0% |
Internet Access in Woodland
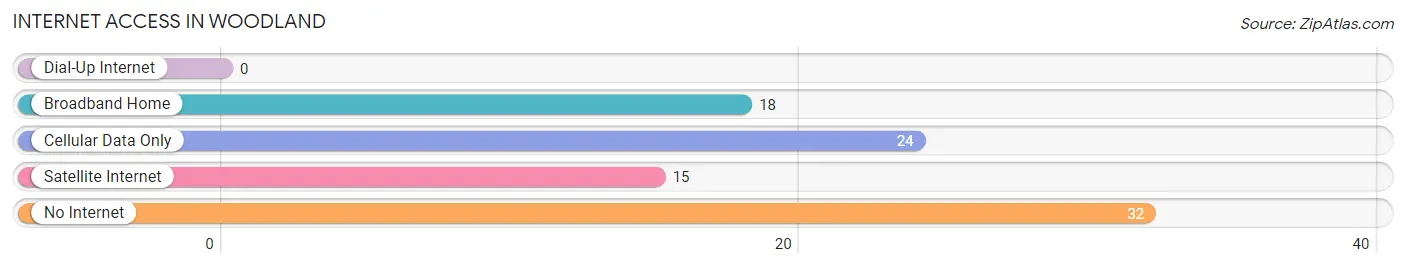
| Internet Type | # Households | % Households |
| Dial-Up Internet | 0 | 0.0% |
| Broadband Home | 18 | 22.8% |
| Cellular Data Only | 24 | 30.4% |
| Satellite Internet | 15 | 19.0% |
| No Internet | 32 | 40.5% |
| Total | 79 | 100.0% |
Woodland Summary
Woodland, Mississippi is a small town located in the northern part of the state, in the heart of the Mississippi Delta. It is situated in the Yazoo County, and is part of the Greenwood, Mississippi Metropolitan Statistical Area. The town has a population of approximately 1,000 people, and is known for its rich history and culture.
Geography
Woodland is located in the northern part of the Mississippi Delta, in the Yazoo County. It is situated on the banks of the Yazoo River, and is surrounded by the Yazoo National Wildlife Refuge. The town is located approximately 30 miles south of the state capital, Jackson, and is about an hour and a half drive from Memphis, Tennessee. The town is situated on a flat plain, and is surrounded by farmland and forests.
History
Woodland was founded in 1837, and was originally known as “Woodland Station”. The town was named after the nearby Woodland Plantation, which was owned by the prominent local family of the same name. The town was a major stop on the Yazoo and Mississippi Valley Railroad, and was a popular destination for travelers and traders. During the Civil War, the town was occupied by Union forces, and was the site of several skirmishes. After the war, the town was rebuilt and continued to grow.
Economy
Woodland’s economy is largely based on agriculture and forestry. The town is home to several farms, and the surrounding area is known for its cotton, soybeans, and corn production. The town is also home to several timber companies, which harvest the surrounding forests for lumber. In addition, the town is home to several small businesses, including restaurants, shops, and other services.
Demographics
As of the 2010 census, Woodland had a population of 1,000 people. The town is predominantly white, with a small African American population. The median household income is $30,000, and the median age is 37. The town is home to several churches, and is served by the Yazoo County School District.
Woodland is a small town with a rich history and culture. The town is home to several farms and timber companies, and is a popular destination for travelers and traders. The town is predominantly white, with a small African American population, and has a median household income of $30,000. Woodland is served by the Yazoo County School District, and is a great place to live and work.
Common Questions
What is Per Capita Income in Woodland?
Per Capita income in Woodland is $39,536.
What is Income or Wage Gap in Woodland?
Income or Wage Gap in Woodland is 26.9%.
Women in Woodland earn 73.1 cents for every dollar earned by a man.
What is Inequality or Gini Index in Woodland?
Inequality or Gini Index in Woodland is 0.35.
What is the Total Population of Woodland?
Total Population of Woodland is 157.
What is the Total Male Population of Woodland?
Total Male Population of Woodland is 92.
What is the Total Female Population of Woodland?
Total Female Population of Woodland is 65.
What is the Ratio of Males per 100 Females in Woodland?
There are 141.54 Males per 100 Females in Woodland.
What is the Ratio of Females per 100 Males in Woodland?
There are 70.65 Females per 100 Males in Woodland.
What is the Median Population Age in Woodland?
Median Population Age in Woodland is 43.0 Years.
What is the Average Family Size in Woodland
Average Family Size in Woodland is 2.4 People.
What is the Average Household Size in Woodland
Average Household Size in Woodland is 2.0 People.
How Large is the Labor Force in Woodland?
There are 114 People in the Labor Forcein in Woodland.
What is the Percentage of People in the Labor Force in Woodland?
77.6% of People are in the Labor Force in Woodland.
What is the Unemployment Rate in Woodland?
Unemployment Rate in Woodland is 6.1%.