Taylorsville, MS Map & Demographics
Taylorsville Map
Taylorsville Overview
$24,522
PER CAPITA INCOME
$67,321
AVG FAMILY INCOME
$40,060
AVG HOUSEHOLD INCOME
1.1%
WAGE / INCOME GAP [ % ]
98.9¢/ $1
WAGE / INCOME GAP [ $ ]
0.49
INEQUALITY / GINI INDEX
1,915
TOTAL POPULATION
849
MALE POPULATION
1,066
FEMALE POPULATION
79.64
MALES / 100 FEMALES
125.56
FEMALES / 100 MALES
28.4
MEDIAN AGE
3.5
AVG FAMILY SIZE
2.9
AVG HOUSEHOLD SIZE
754
LABOR FORCE [ PEOPLE ]
47.7%
PERCENT IN LABOR FORCE
Taylorsville Zip Codes
Income in Taylorsville
Income Overview in Taylorsville
Per Capita Income in Taylorsville is $24,522, while median incomes of families and households are $67,321 and $40,060 respectively.
| Characteristic | Number | Measure |
| Per Capita Income | 1,915 | $24,522 |
| Median Family Income | 424 | $67,321 |
| Mean Family Income | 424 | $90,104 |
| Median Household Income | 657 | $40,060 |
| Mean Household Income | 657 | $67,704 |
| Income Deficit | 424 | $0 |
| Wage / Income Gap (%) | 1,915 | 1.11% |
| Wage / Income Gap ($) | 1,915 | 98.89¢ per $1 |
| Gini / Inequality Index | 1,915 | 0.49 |
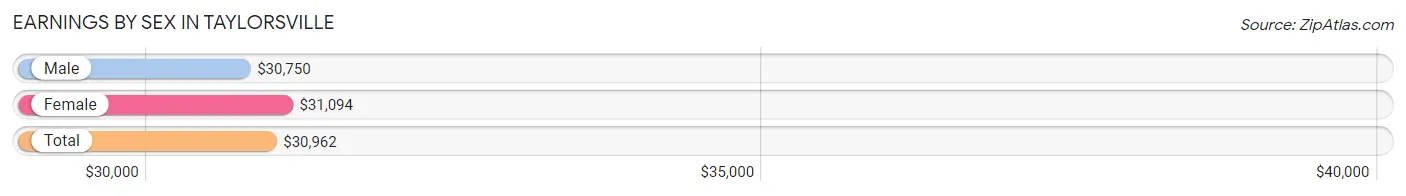
Earnings by Sex in Taylorsville
Average Earnings in Taylorsville are $30,962, $30,750 for men and $31,094 for women, a difference of 1.1%.
| Sex | Number | Average Earnings |
| Male | 455 (58.3%) | $30,750 |
| Female | 325 (41.7%) | $31,094 |
| Total | 780 (100.0%) | $30,962 |
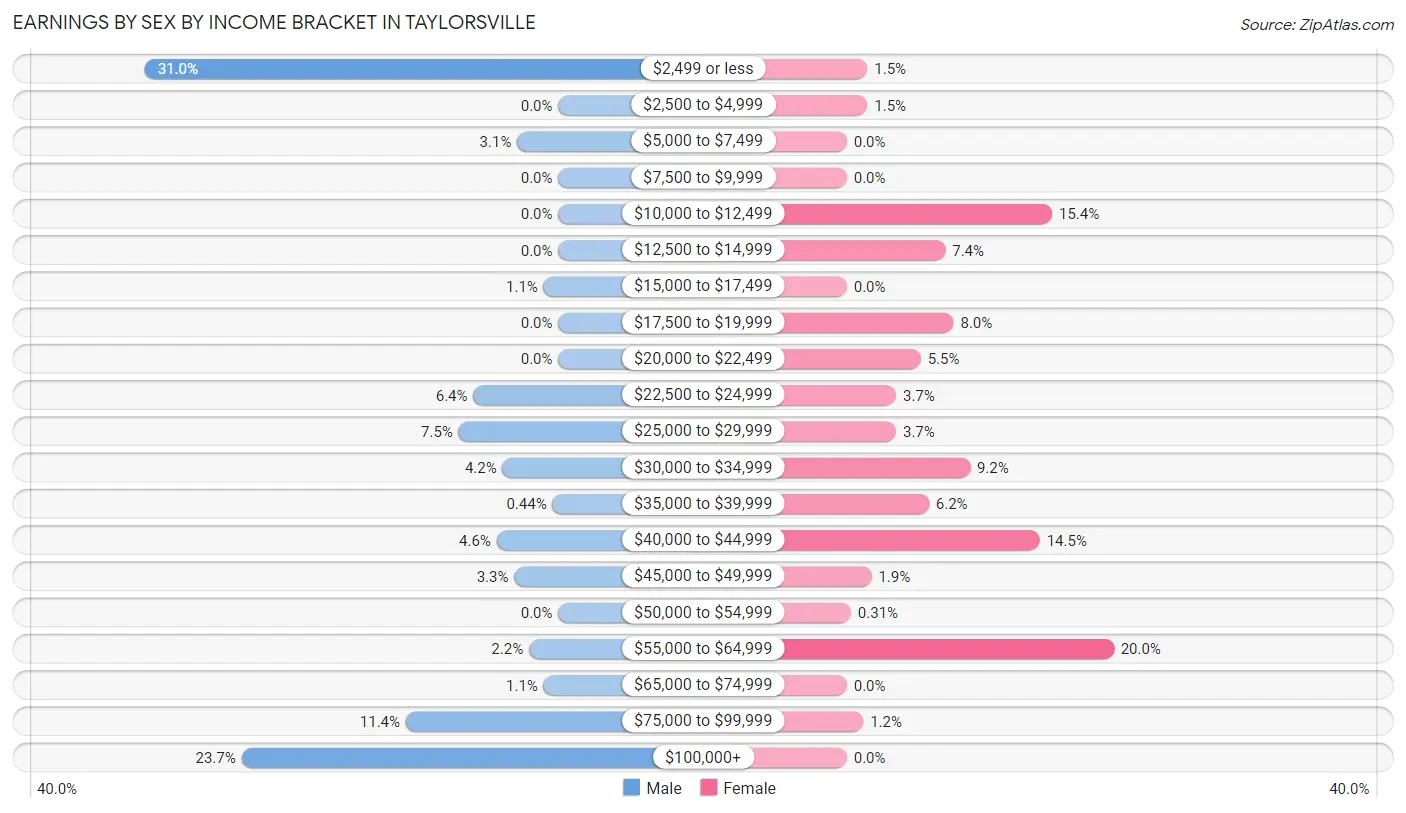
Earnings by Sex by Income Bracket in Taylorsville
The most common earnings brackets in Taylorsville are $2,499 or less for men (141 | 31.0%) and $55,000 to $64,999 for women (65 | 20.0%).
| Income | Male | Female |
| $2,499 or less | 141 (31.0%) | 5 (1.5%) |
| $2,500 to $4,999 | 0 (0.0%) | 5 (1.5%) |
| $5,000 to $7,499 | 14 (3.1%) | 0 (0.0%) |
| $7,500 to $9,999 | 0 (0.0%) | 0 (0.0%) |
| $10,000 to $12,499 | 0 (0.0%) | 50 (15.4%) |
| $12,500 to $14,999 | 0 (0.0%) | 24 (7.4%) |
| $15,000 to $17,499 | 5 (1.1%) | 0 (0.0%) |
| $17,500 to $19,999 | 0 (0.0%) | 26 (8.0%) |
| $20,000 to $22,499 | 0 (0.0%) | 18 (5.5%) |
| $22,500 to $24,999 | 29 (6.4%) | 12 (3.7%) |
| $25,000 to $29,999 | 34 (7.5%) | 12 (3.7%) |
| $30,000 to $34,999 | 19 (4.2%) | 30 (9.2%) |
| $35,000 to $39,999 | 2 (0.4%) | 20 (6.1%) |
| $40,000 to $44,999 | 21 (4.6%) | 47 (14.5%) |
| $45,000 to $49,999 | 15 (3.3%) | 6 (1.8%) |
| $50,000 to $54,999 | 0 (0.0%) | 1 (0.3%) |
| $55,000 to $64,999 | 10 (2.2%) | 65 (20.0%) |
| $65,000 to $74,999 | 5 (1.1%) | 0 (0.0%) |
| $75,000 to $99,999 | 52 (11.4%) | 4 (1.2%) |
| $100,000+ | 108 (23.7%) | 0 (0.0%) |
| Total | 455 (100.0%) | 325 (100.0%) |
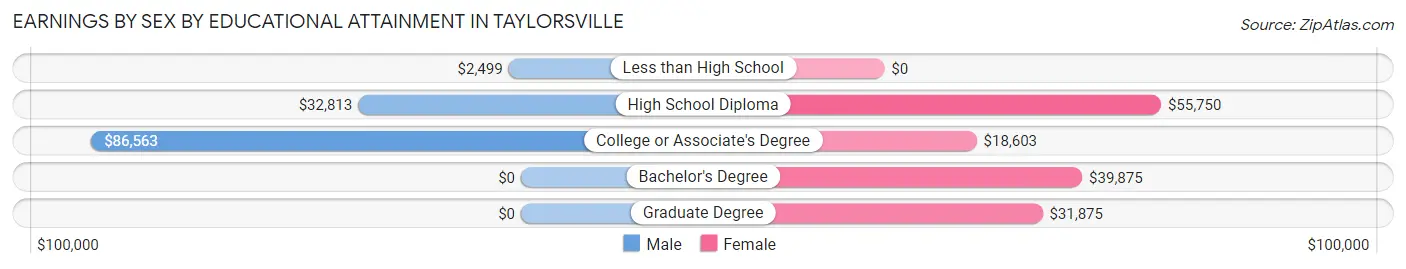
Earnings by Sex by Educational Attainment in Taylorsville
Average earnings in Taylorsville are $41,875 for men and $38,250 for women, a difference of 8.7%. Men with an educational attainment of college or associate's degree enjoy the highest average annual earnings of $86,563, while those with less than high school education earn the least with $2,499. Women with an educational attainment of high school diploma earn the most with the average annual earnings of $55,750, while those with college or associate's degree education have the smallest earnings of $18,603.
| Educational Attainment | Male Income | Female Income |
| Less than High School | $2,499 | $0 |
| High School Diploma | $32,813 | $55,750 |
| College or Associate's Degree | $86,563 | $18,603 |
| Bachelor's Degree | - | - |
| Graduate Degree | - | - |
| Total | $41,875 | $38,250 |
Family Income in Taylorsville
Family Income Brackets in Taylorsville
According to the Taylorsville family income data, there are 98 families falling into the $100,000 to $149,999 income range, which is the most common income bracket and makes up 23.1% of all families.
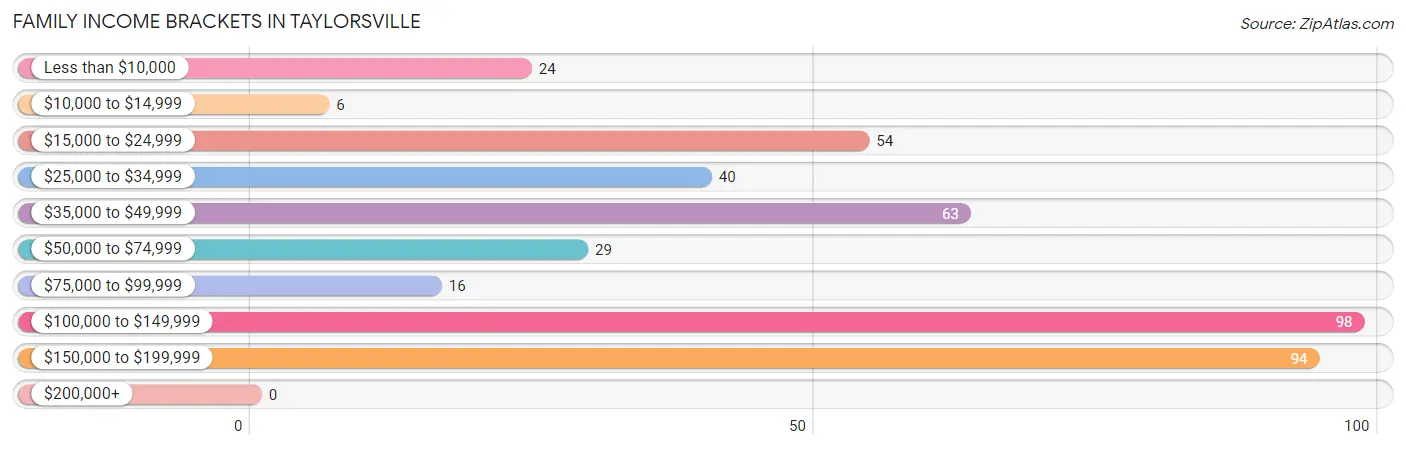
| Income Bracket | # Families | % Families |
| Less than $10,000 | 24 | 5.7% |
| $10,000 to $14,999 | 6 | 1.4% |
| $15,000 to $24,999 | 54 | 12.7% |
| $25,000 to $34,999 | 40 | 9.4% |
| $35,000 to $49,999 | 63 | 14.9% |
| $50,000 to $74,999 | 29 | 6.8% |
| $75,000 to $99,999 | 16 | 3.8% |
| $100,000 to $149,999 | 98 | 23.1% |
| $150,000 to $199,999 | 94 | 22.2% |
| $200,000+ | 0 | 0.0% |
Family Income by Famaliy Size in Taylorsville
3-person families (199 | 46.9%) account for the highest median family income in Taylorsville with $143,438 per family, while 3-person families (199 | 46.9%) have the highest median income of $47,813 per family member.
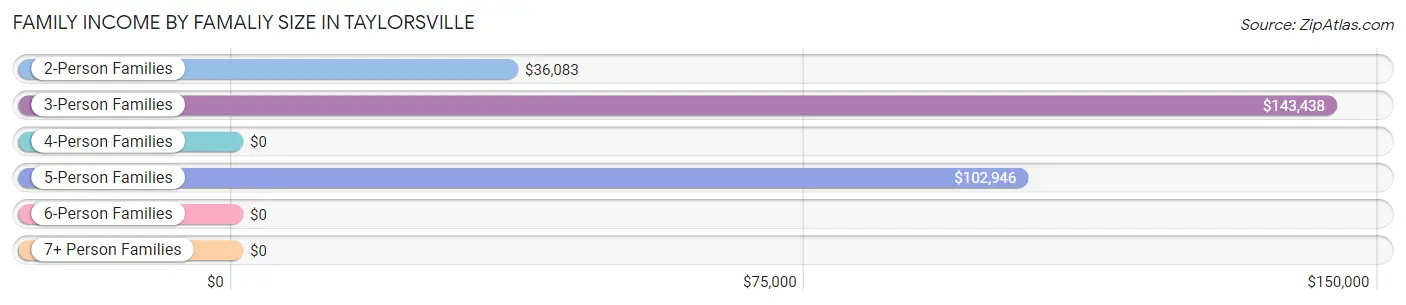
| Income Bracket | # Families | Median Income |
| 2-Person Families | 121 (28.5%) | $36,083 |
| 3-Person Families | 199 (46.9%) | $143,438 |
| 4-Person Families | 81 (19.1%) | $0 |
| 5-Person Families | 23 (5.4%) | $102,946 |
| 6-Person Families | 0 (0.0%) | $0 |
| 7+ Person Families | 0 (0.0%) | $0 |
| Total | 424 (100.0%) | $67,321 |
Family Income by Number of Earners in Taylorsville
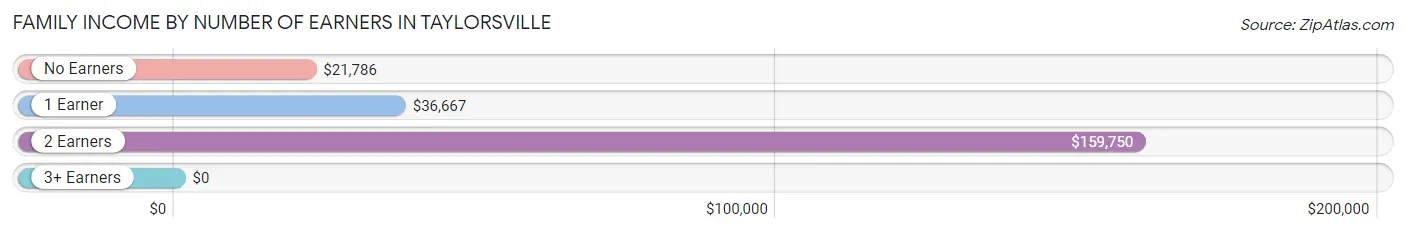
| Number of Earners | # Families | Median Income |
| No Earners | 70 (16.5%) | $21,786 |
| 1 Earner | 156 (36.8%) | $36,667 |
| 2 Earners | 179 (42.2%) | $159,750 |
| 3+ Earners | 19 (4.5%) | $0 |
| Total | 424 (100.0%) | $67,321 |
Household Income in Taylorsville
Household Income Brackets in Taylorsville
With 134 households falling in the category, the $15,000 to $24,999 income range is the most frequent in Taylorsville, accounting for 20.4% of all households.
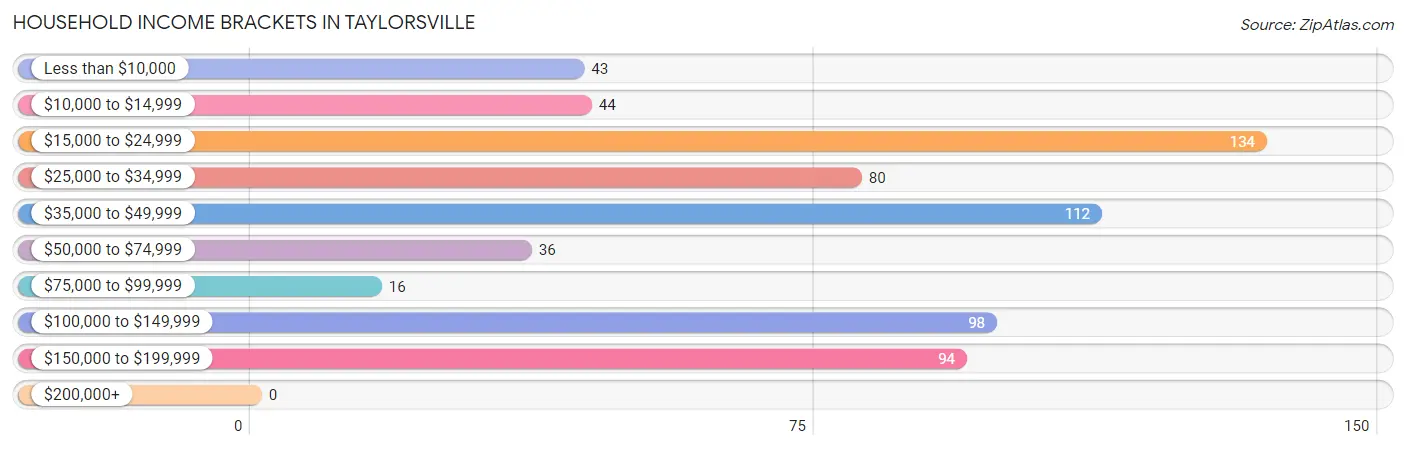
| Income Bracket | # Households | % Households |
| Less than $10,000 | 43 | 6.5% |
| $10,000 to $14,999 | 44 | 6.7% |
| $15,000 to $24,999 | 134 | 20.4% |
| $25,000 to $34,999 | 80 | 12.2% |
| $35,000 to $49,999 | 112 | 17.0% |
| $50,000 to $74,999 | 36 | 5.5% |
| $75,000 to $99,999 | 16 | 2.4% |
| $100,000 to $149,999 | 98 | 14.9% |
| $150,000 to $199,999 | 94 | 14.3% |
| $200,000+ | 0 | 0.0% |
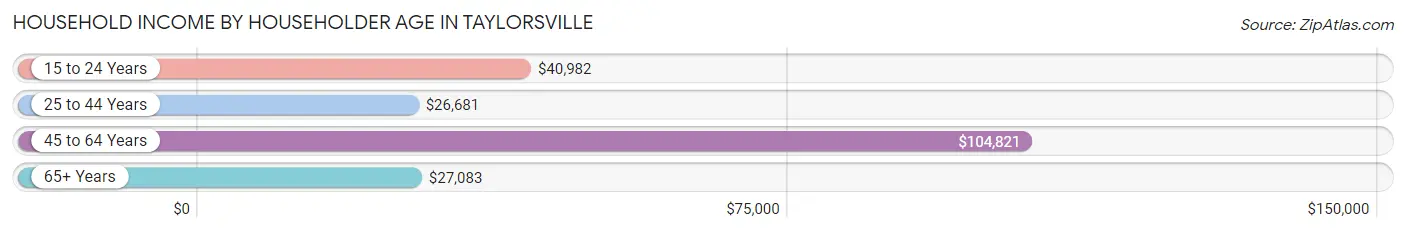
Household Income by Householder Age in Taylorsville
The median household income in Taylorsville is $40,060, with the highest median household income of $104,821 found in the 45 to 64 years age bracket for the primary householder. A total of 226 households (34.4%) fall into this category. Meanwhile, the 25 to 44 years age bracket for the primary householder has the lowest median household income of $26,681, with 163 households (24.8%) in this group.
| Income Bracket | # Households | Median Income |
| 15 to 24 Years | 69 (10.5%) | $40,982 |
| 25 to 44 Years | 163 (24.8%) | $26,681 |
| 45 to 64 Years | 226 (34.4%) | $104,821 |
| 65+ Years | 199 (30.3%) | $27,083 |
| Total | 657 (100.0%) | $40,060 |
Poverty in Taylorsville
Income Below Poverty by Sex and Age in Taylorsville
With 20.6% poverty level for males and 27.0% for females among the residents of Taylorsville, under 5 year old males and 6 to 11 year old females are the most vulnerable to poverty, with 43 males (87.8%) and 61 females (100.0%) in their respective age groups living below the poverty level.
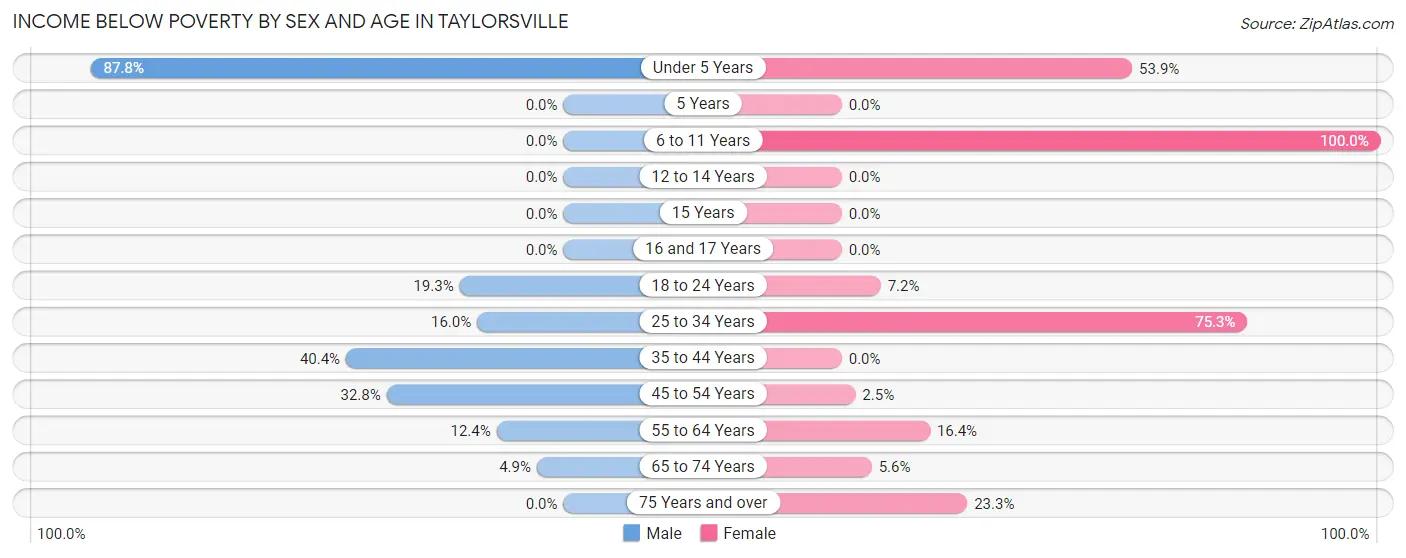
| Age Bracket | Male | Female |
| Under 5 Years | 43 (87.8%) | 90 (53.9%) |
| 5 Years | 0 (0.0%) | 0 (0.0%) |
| 6 to 11 Years | 0 (0.0%) | 61 (100.0%) |
| 12 to 14 Years | 0 (0.0%) | 0 (0.0%) |
| 15 Years | 0 (0.0%) | 0 (0.0%) |
| 16 and 17 Years | 0 (0.0%) | 0 (0.0%) |
| 18 to 24 Years | 32 (19.3%) | 18 (7.2%) |
| 25 to 34 Years | 37 (16.0%) | 73 (75.3%) |
| 35 to 44 Years | 23 (40.4%) | 0 (0.0%) |
| 45 to 54 Years | 21 (32.8%) | 4 (2.5%) |
| 55 to 64 Years | 16 (12.4%) | 9 (16.4%) |
| 65 to 74 Years | 3 (4.9%) | 6 (5.6%) |
| 75 Years and over | 0 (0.0%) | 27 (23.3%) |
| Total | 175 (20.6%) | 288 (27.0%) |
Income Above Poverty by Sex and Age in Taylorsville
According to the poverty statistics in Taylorsville, males aged 5 years and females aged 5 years are the age groups that are most secure financially, with 100.0% of males and 100.0% of females in these age groups living above the poverty line.
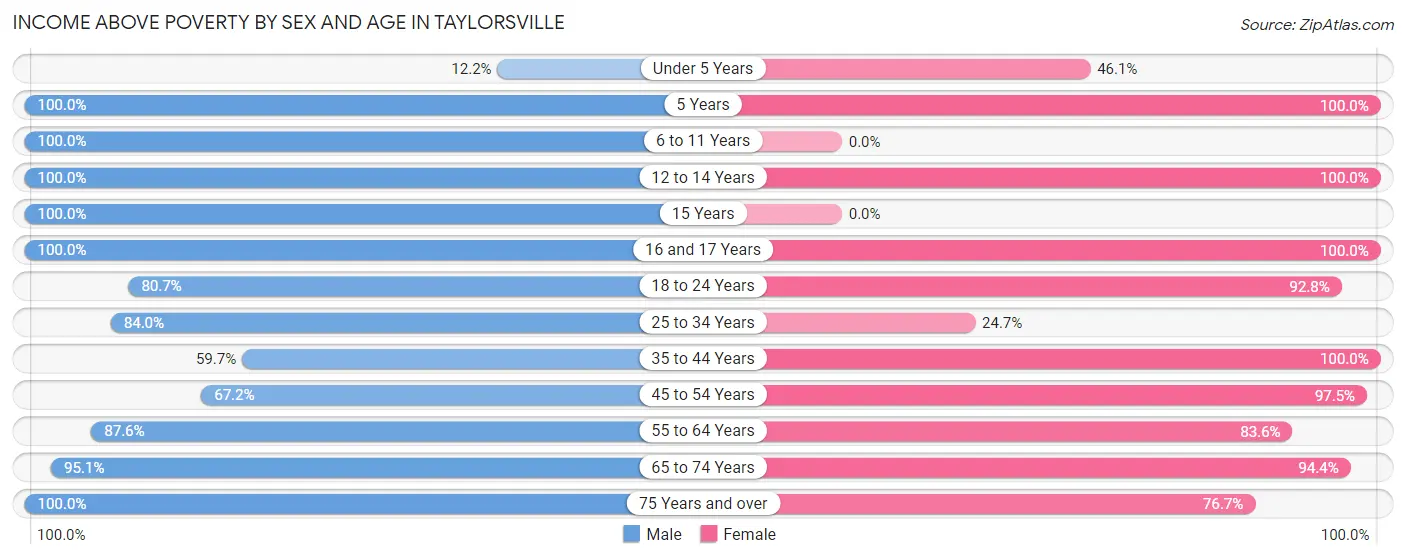
| Age Bracket | Male | Female |
| Under 5 Years | 6 (12.2%) | 77 (46.1%) |
| 5 Years | 8 (100.0%) | 6 (100.0%) |
| 6 to 11 Years | 13 (100.0%) | 0 (0.0%) |
| 12 to 14 Years | 11 (100.0%) | 4 (100.0%) |
| 15 Years | 16 (100.0%) | 0 (0.0%) |
| 16 and 17 Years | 20 (100.0%) | 22 (100.0%) |
| 18 to 24 Years | 134 (80.7%) | 231 (92.8%) |
| 25 to 34 Years | 194 (84.0%) | 24 (24.7%) |
| 35 to 44 Years | 34 (59.7%) | 23 (100.0%) |
| 45 to 54 Years | 43 (67.2%) | 154 (97.5%) |
| 55 to 64 Years | 113 (87.6%) | 46 (83.6%) |
| 65 to 74 Years | 58 (95.1%) | 102 (94.4%) |
| 75 Years and over | 24 (100.0%) | 89 (76.7%) |
| Total | 674 (79.4%) | 778 (73.0%) |
Income Below Poverty Among Married-Couple Families in Taylorsville
The poverty statistics for married-couple families in Taylorsville show that 1.7% or 5 of the total 288 families live below the poverty line. Families with 1 or 2 children have the highest poverty rate of 4.5%, comprising of 5 families. On the other hand, families with no children have the lowest poverty rate of 0.0%, which includes 0 families.
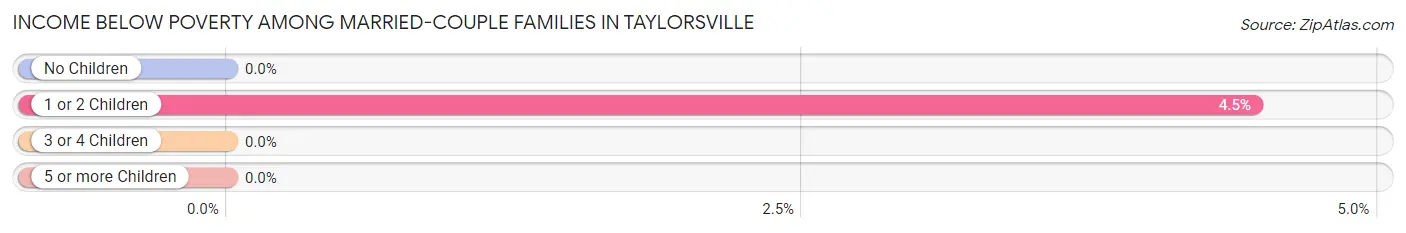
| Children | Above Poverty | Below Poverty |
| No Children | 176 (100.0%) | 0 (0.0%) |
| 1 or 2 Children | 107 (95.5%) | 5 (4.5%) |
| 3 or 4 Children | 0 (0.0%) | 0 (0.0%) |
| 5 or more Children | 0 (0.0%) | 0 (0.0%) |
| Total | 283 (98.3%) | 5 (1.7%) |
Income Below Poverty Among Single-Parent Households in Taylorsville
According to the poverty data in Taylorsville, 47.6% or 10 single-father households and 53.9% or 62 single-mother households are living below the poverty line. Among single-father households, those with 3 or 4 children have the highest poverty rate, with 4 households (100.0%) experiencing poverty. Likewise, among single-mother households, those with 3 or 4 children have the highest poverty rate, with 50 households (100.0%) falling below the poverty line.
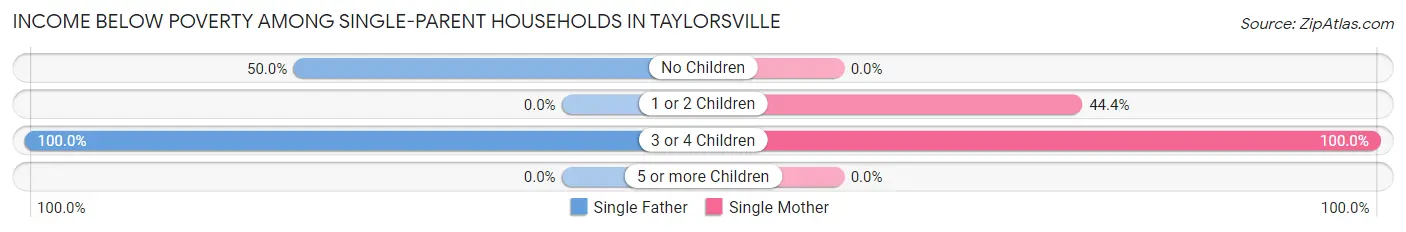
| Children | Single Father | Single Mother |
| No Children | 6 (50.0%) | 0 (0.0%) |
| 1 or 2 Children | 0 (0.0%) | 12 (44.4%) |
| 3 or 4 Children | 4 (100.0%) | 50 (100.0%) |
| 5 or more Children | 0 (0.0%) | 0 (0.0%) |
| Total | 10 (47.6%) | 62 (53.9%) |
Income Below Poverty Among Married-Couple vs Single-Parent Households in Taylorsville
The poverty data for Taylorsville shows that 5 of the married-couple family households (1.7%) and 72 of the single-parent households (52.9%) are living below the poverty level. Within the married-couple family households, those with 1 or 2 children have the highest poverty rate, with 5 households (4.5%) falling below the poverty line. Among the single-parent households, those with 3 or 4 children have the highest poverty rate, with 54 household (100.0%) living below poverty.
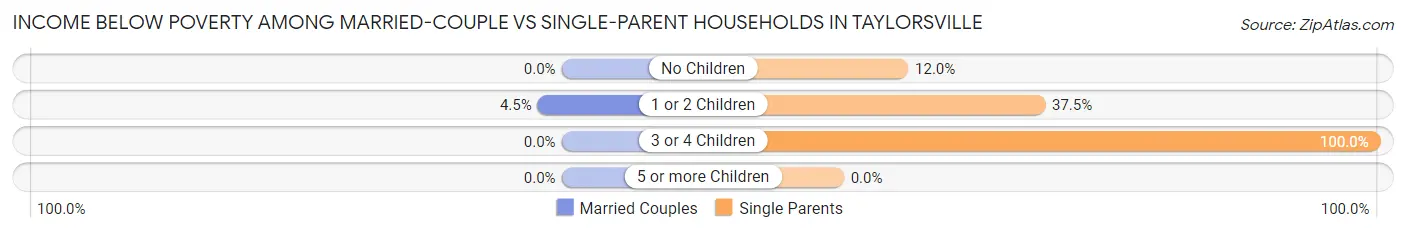
| Children | Married-Couple Families | Single-Parent Households |
| No Children | 0 (0.0%) | 6 (12.0%) |
| 1 or 2 Children | 5 (4.5%) | 12 (37.5%) |
| 3 or 4 Children | 0 (0.0%) | 54 (100.0%) |
| 5 or more Children | 0 (0.0%) | 0 (0.0%) |
| Total | 5 (1.7%) | 72 (52.9%) |
Race in Taylorsville
The most populous races in Taylorsville are White / Caucasian (1,058 | 55.2%), Black / African American (844 | 44.1%), and Some other Race (13 | 0.7%).
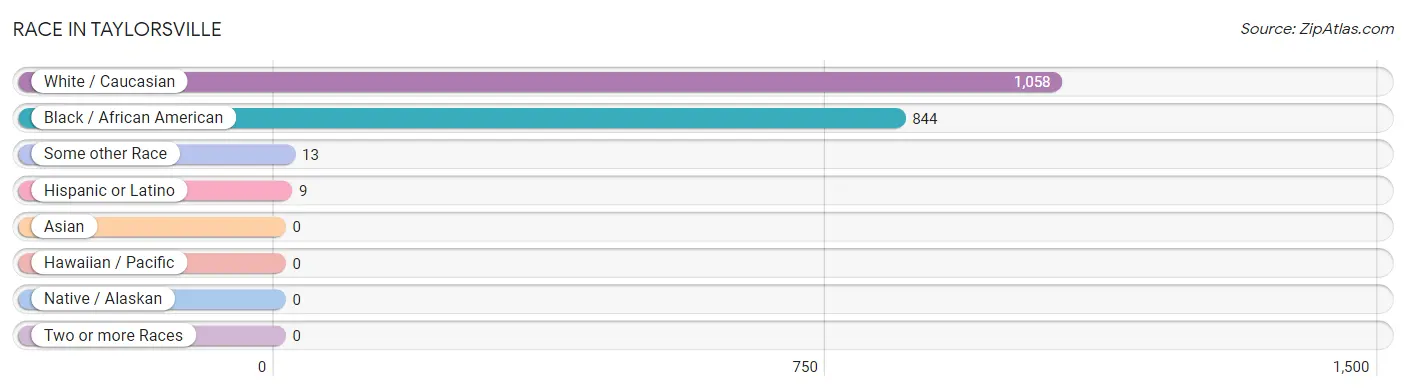
| Race | # Population | % Population |
| Asian | 0 | 0.0% |
| Black / African American | 844 | 44.1% |
| Hawaiian / Pacific | 0 | 0.0% |
| Hispanic or Latino | 9 | 0.5% |
| Native / Alaskan | 0 | 0.0% |
| White / Caucasian | 1,058 | 55.2% |
| Two or more Races | 0 | 0.0% |
| Some other Race | 13 | 0.7% |
| Total | 1,915 | 100.0% |
Ancestry in Taylorsville
The most populous ancestries reported in Taylorsville are American (1,388 | 72.5%), English (44 | 2.3%), Irish (44 | 2.3%), African (29 | 1.5%), and Subsaharan African (29 | 1.5%), together accounting for 80.1% of all Taylorsville residents.
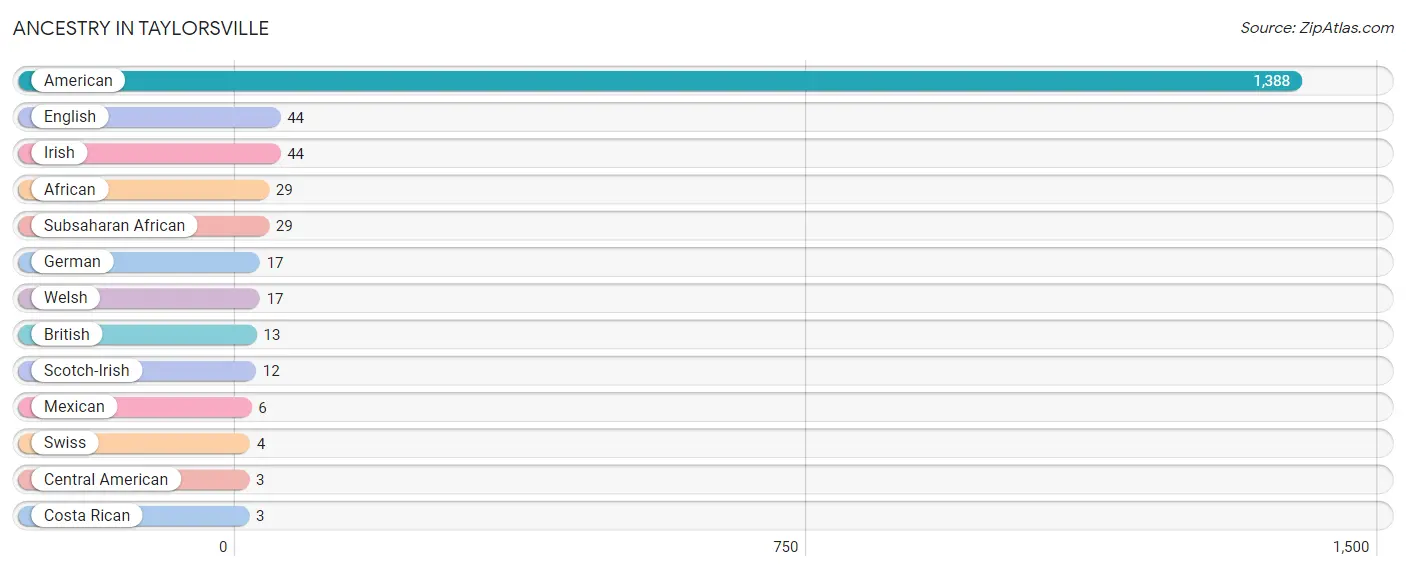
| Ancestry | # Population | % Population |
| African | 29 | 1.5% |
| American | 1,388 | 72.5% |
| British | 13 | 0.7% |
| Central American | 3 | 0.2% |
| Costa Rican | 3 | 0.2% |
| English | 44 | 2.3% |
| German | 17 | 0.9% |
| Irish | 44 | 2.3% |
| Mexican | 6 | 0.3% |
| Scotch-Irish | 12 | 0.6% |
| Subsaharan African | 29 | 1.5% |
| Swiss | 4 | 0.2% |
| Welsh | 17 | 0.9% | View All 13 Rows |
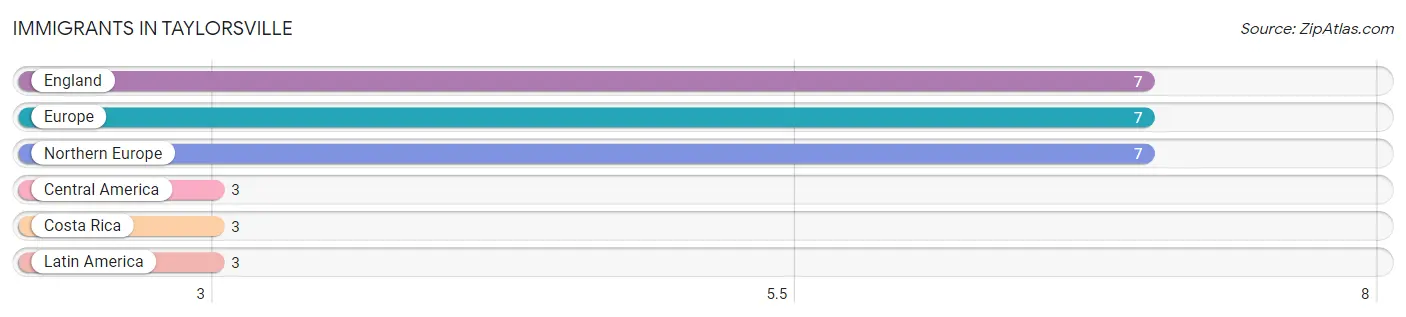
Immigrants in Taylorsville
The most numerous immigrant groups reported in Taylorsville came from England (7 | 0.4%), Europe (7 | 0.4%), Northern Europe (7 | 0.4%), Central America (3 | 0.2%), and Costa Rica (3 | 0.2%), together accounting for 1.4% of all Taylorsville residents.
| Immigration Origin | # Population | % Population |
| Central America | 3 | 0.2% |
| Costa Rica | 3 | 0.2% |
| England | 7 | 0.4% |
| Europe | 7 | 0.4% |
| Latin America | 3 | 0.2% |
| Northern Europe | 7 | 0.4% | View All 6 Rows |
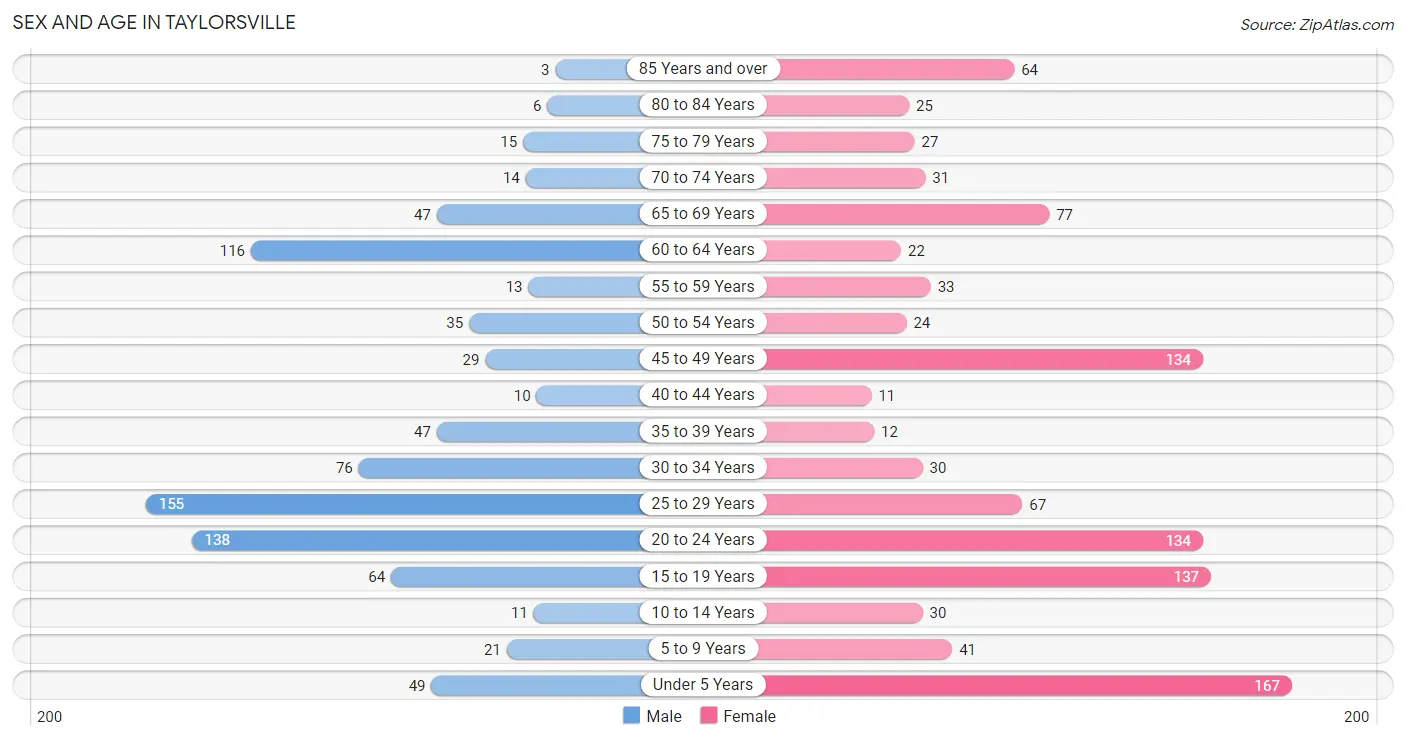
Sex and Age in Taylorsville
Sex and Age in Taylorsville
The most populous age groups in Taylorsville are 25 to 29 Years (155 | 18.3%) for men and Under 5 Years (167 | 15.7%) for women.
| Age Bracket | Male | Female |
| Under 5 Years | 49 (5.8%) | 167 (15.7%) |
| 5 to 9 Years | 21 (2.5%) | 41 (3.8%) |
| 10 to 14 Years | 11 (1.3%) | 30 (2.8%) |
| 15 to 19 Years | 64 (7.5%) | 137 (12.9%) |
| 20 to 24 Years | 138 (16.3%) | 134 (12.6%) |
| 25 to 29 Years | 155 (18.3%) | 67 (6.3%) |
| 30 to 34 Years | 76 (8.9%) | 30 (2.8%) |
| 35 to 39 Years | 47 (5.5%) | 12 (1.1%) |
| 40 to 44 Years | 10 (1.2%) | 11 (1.0%) |
| 45 to 49 Years | 29 (3.4%) | 134 (12.6%) |
| 50 to 54 Years | 35 (4.1%) | 24 (2.2%) |
| 55 to 59 Years | 13 (1.5%) | 33 (3.1%) |
| 60 to 64 Years | 116 (13.7%) | 22 (2.1%) |
| 65 to 69 Years | 47 (5.5%) | 77 (7.2%) |
| 70 to 74 Years | 14 (1.7%) | 31 (2.9%) |
| 75 to 79 Years | 15 (1.8%) | 27 (2.5%) |
| 80 to 84 Years | 6 (0.7%) | 25 (2.4%) |
| 85 Years and over | 3 (0.4%) | 64 (6.0%) |
| Total | 849 (100.0%) | 1,066 (100.0%) |
Families and Households in Taylorsville
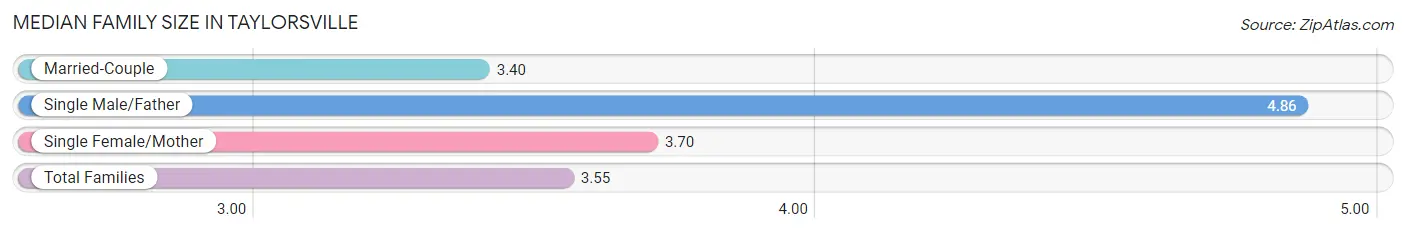
Median Family Size in Taylorsville
The median family size in Taylorsville is 3.55 persons per family, with single male/father families (21 | 5.0%) accounting for the largest median family size of 4.86 persons per family. On the other hand, married-couple families (288 | 67.9%) represent the smallest median family size with 3.40 persons per family.
| Family Type | # Families | Family Size |
| Married-Couple | 288 (67.9%) | 3.40 |
| Single Male/Father | 21 (5.0%) | 4.86 |
| Single Female/Mother | 115 (27.1%) | 3.70 |
| Total Families | 424 (100.0%) | 3.55 |
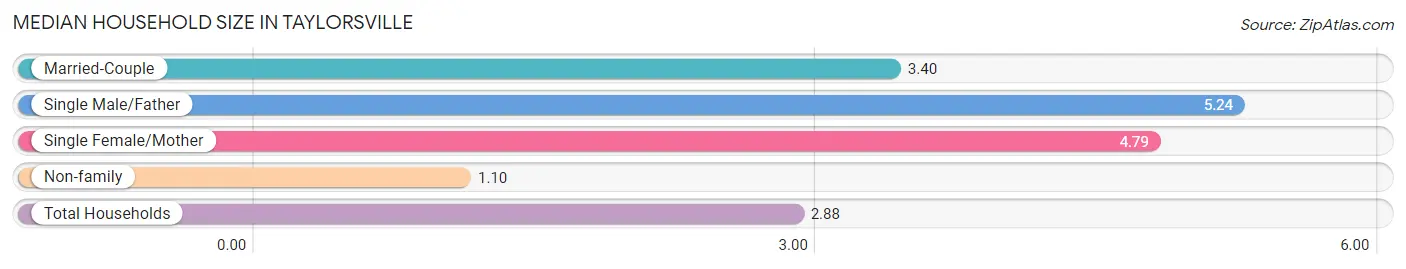
Median Household Size in Taylorsville
The median household size in Taylorsville is 2.88 persons per household, with single male/father households (21 | 3.2%) accounting for the largest median household size of 5.24 persons per household. non-family households (233 | 35.5%) represent the smallest median household size with 1.10 persons per household.
| Household Type | # Households | Household Size |
| Married-Couple | 288 (43.8%) | 3.40 |
| Single Male/Father | 21 (3.2%) | 5.24 |
| Single Female/Mother | 115 (17.5%) | 4.79 |
| Non-family | 233 (35.5%) | 1.10 |
| Total Households | 657 (100.0%) | 2.88 |
Household Size by Marriage Status in Taylorsville
Out of a total of 657 households in Taylorsville, 424 (64.5%) are family households, while 233 (35.5%) are nonfamily households. The most numerous type of family households are 3-person households, comprising 208, and the most common type of nonfamily households are 1-person households, comprising 215.
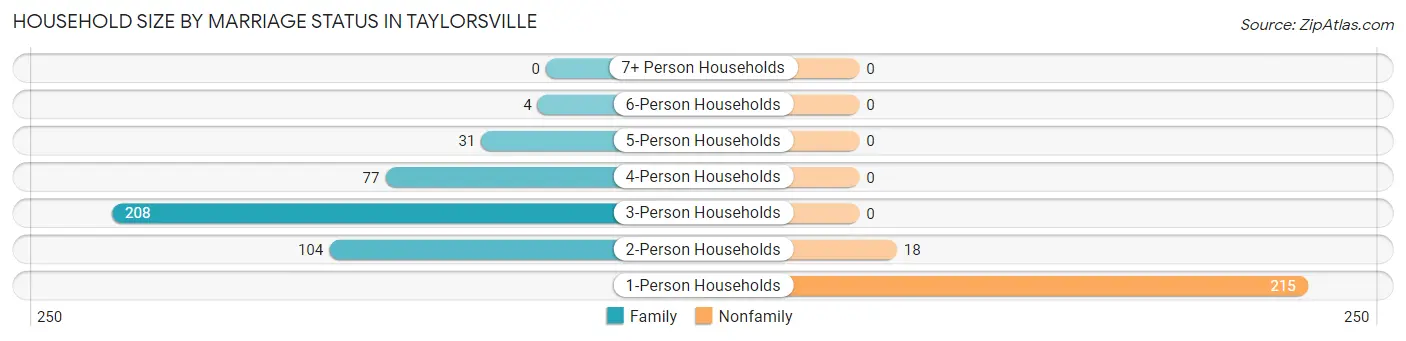
| Household Size | Family Households | Nonfamily Households |
| 1-Person Households | - | 215 (32.7%) |
| 2-Person Households | 104 (15.8%) | 18 (2.7%) |
| 3-Person Households | 208 (31.7%) | 0 (0.0%) |
| 4-Person Households | 77 (11.7%) | 0 (0.0%) |
| 5-Person Households | 31 (4.7%) | 0 (0.0%) |
| 6-Person Households | 4 (0.6%) | 0 (0.0%) |
| 7+ Person Households | 0 (0.0%) | 0 (0.0%) |
| Total | 424 (64.5%) | 233 (35.5%) |
Female Fertility in Taylorsville
Fertility by Age in Taylorsville
Average fertility rate in Taylorsville is 95.0 births per 1,000 women. Women in the age bracket of 20 to 34 years have the highest fertility rate with 216.0 births per 1,000 women. Women in the age bracket of 20 to 34 years acount for 100.0% of all women with births.
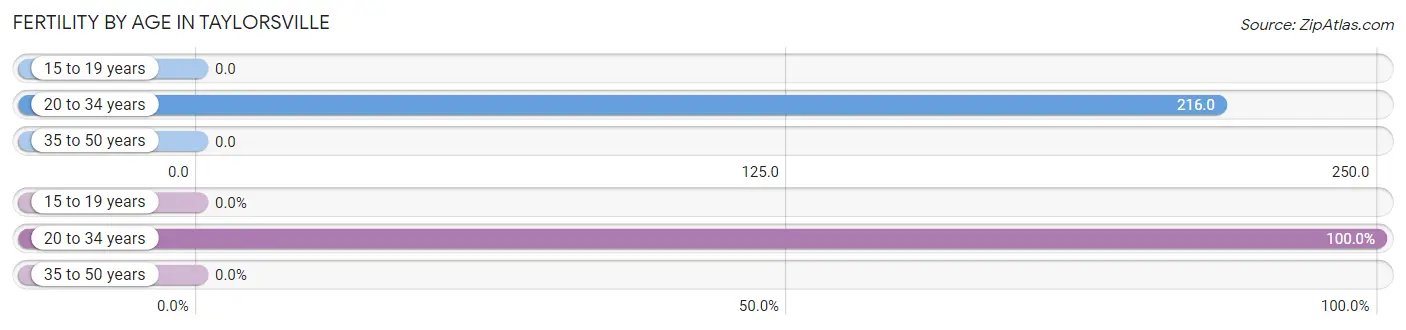
| Age Bracket | Women with Births | Births / 1,000 Women |
| 15 to 19 years | 0 (0.0%) | 0.0 |
| 20 to 34 years | 50 (100.0%) | 216.0 |
| 35 to 50 years | 0 (0.0%) | 0.0 |
| Total | 50 (100.0%) | 95.0 |
Fertility by Age by Marriage Status in Taylorsville
10.0% of women with births (50) in Taylorsville are married. The highest percentage of unmarried women with births falls into 20 to 34 years age bracket with 90.0% of them unmarried at the time of birth, while the lowest percentage of unmarried women with births belong to 20 to 34 years age bracket with 90.0% of them unmarried.
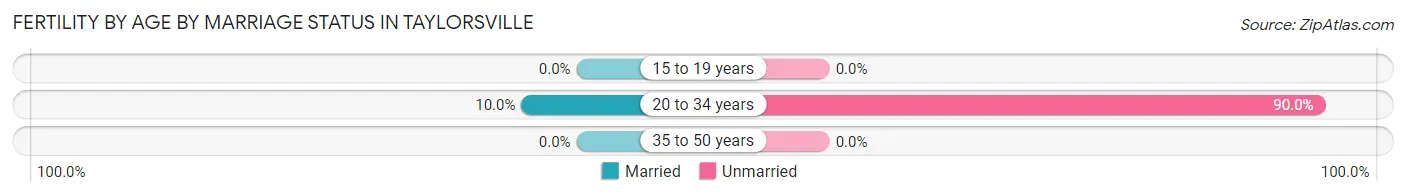
| Age Bracket | Married | Unmarried |
| 15 to 19 years | 0 (0.0%) | 0 (0.0%) |
| 20 to 34 years | 5 (10.0%) | 45 (90.0%) |
| 35 to 50 years | 0 (0.0%) | 0 (0.0%) |
| Total | 5 (10.0%) | 45 (90.0%) |
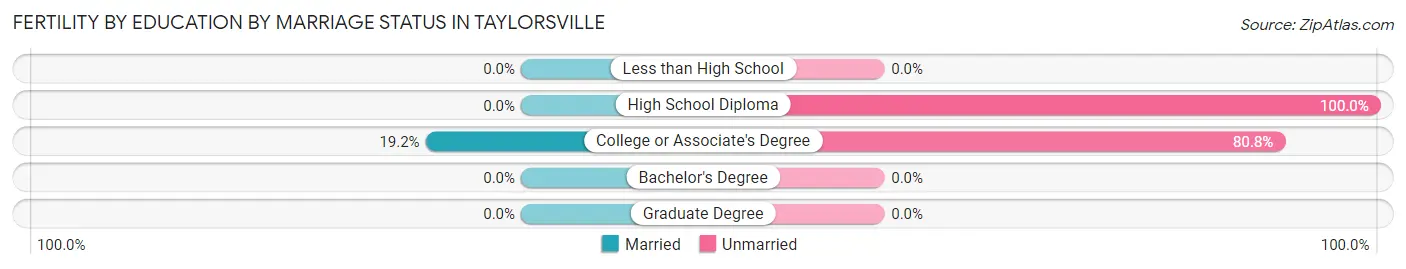
Fertility by Education in Taylorsville
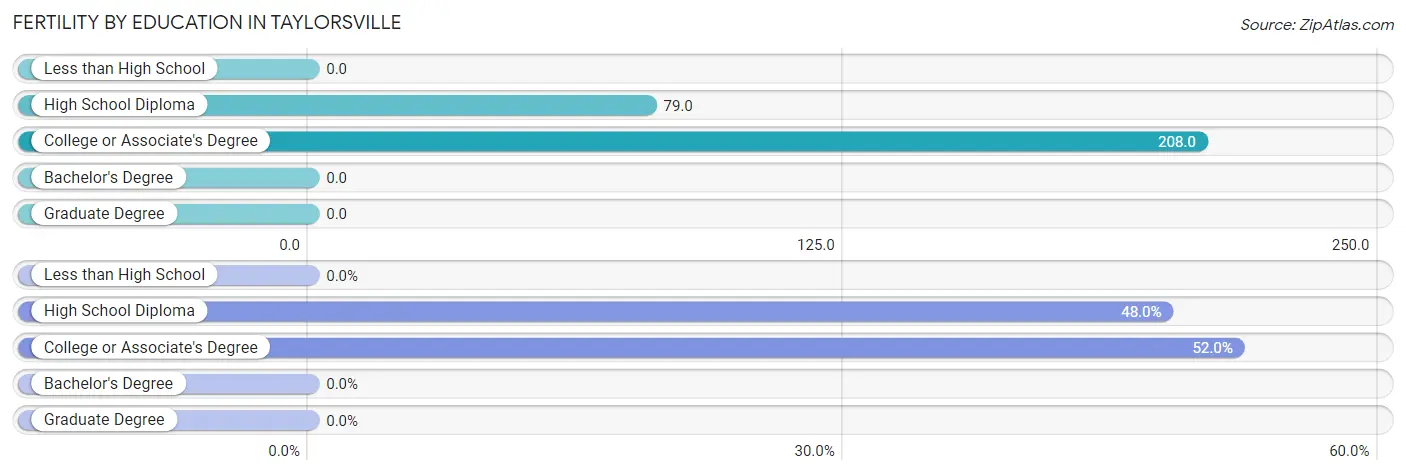
| Educational Attainment | Women with Births | Births / 1,000 Women |
| Less than High School | 0 (0.0%) | 0.0 |
| High School Diploma | 24 (48.0%) | 79.0 |
| College or Associate's Degree | 26 (52.0%) | 208.0 |
| Bachelor's Degree | 0 (0.0%) | 0.0 |
| Graduate Degree | 0 (0.0%) | 0.0 |
| Total | 50 (100.0%) | 95.0 |
Fertility by Education by Marriage Status in Taylorsville
90.0% of women with births in Taylorsville are unmarried. Women with the educational attainment of college or associate's degree are most likely to be married with 19.2% of them married at childbirth, while women with the educational attainment of high school diploma are least likely to be married with 100.0% of them unmarried at childbirth.
| Educational Attainment | Married | Unmarried |
| Less than High School | 0 (0.0%) | 0 (0.0%) |
| High School Diploma | 0 (0.0%) | 24 (100.0%) |
| College or Associate's Degree | 5 (19.2%) | 21 (80.8%) |
| Bachelor's Degree | 0 (0.0%) | 0 (0.0%) |
| Graduate Degree | 0 (0.0%) | 0 (0.0%) |
| Total | 5 (10.0%) | 45 (90.0%) |
Employment Characteristics in Taylorsville
Employment by Class of Employer in Taylorsville
Among the 743 employed individuals in Taylorsville, private company employees (332 | 44.7%), not-for-profit organizations (175 | 23.5%), and self-employed (incorporated) (82 | 11.0%) make up the most common classes of employment.
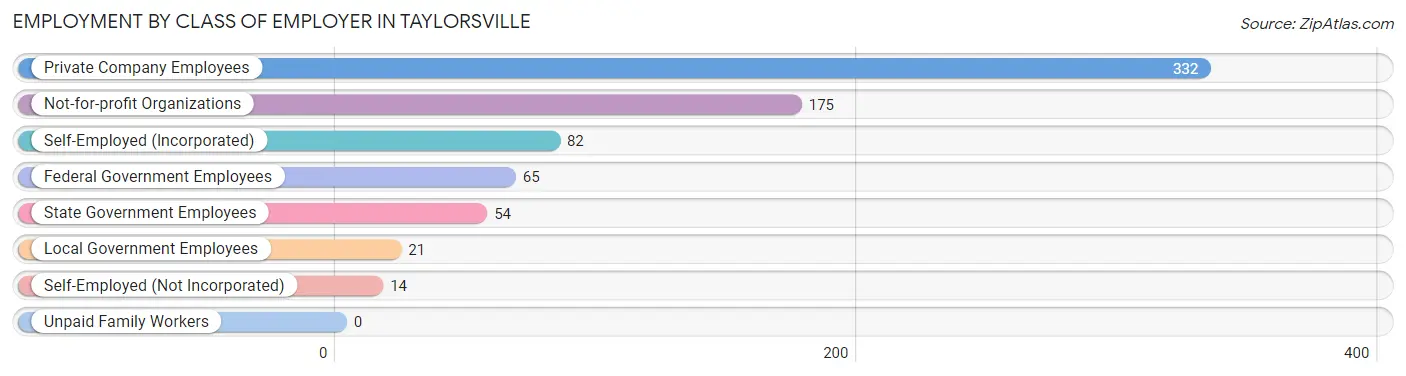
| Employer Class | # Employees | % Employees |
| Private Company Employees | 332 | 44.7% |
| Self-Employed (Incorporated) | 82 | 11.0% |
| Self-Employed (Not Incorporated) | 14 | 1.9% |
| Not-for-profit Organizations | 175 | 23.5% |
| Local Government Employees | 21 | 2.8% |
| State Government Employees | 54 | 7.3% |
| Federal Government Employees | 65 | 8.7% |
| Unpaid Family Workers | 0 | 0.0% |
| Total | 743 | 100.0% |
Employment Status by Age in Taylorsville
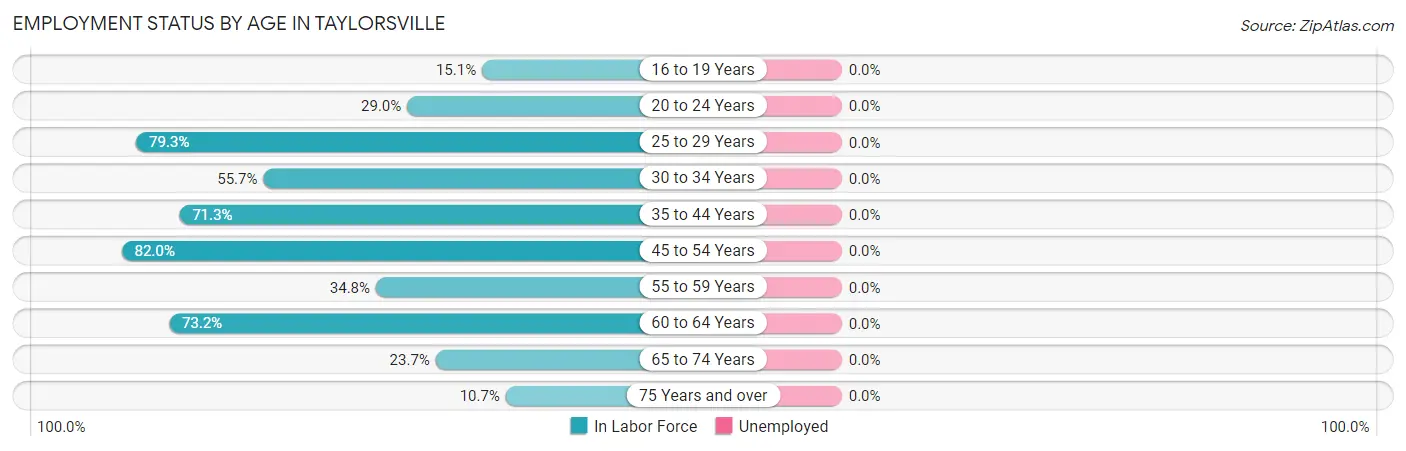
| Age Bracket | In Labor Force | Unemployed |
| 16 to 19 Years | 28 (15.1%) | 0 (0.0%) |
| 20 to 24 Years | 79 (29.0%) | 0 (0.0%) |
| 25 to 29 Years | 176 (79.3%) | 0 (0.0%) |
| 30 to 34 Years | 59 (55.7%) | 0 (0.0%) |
| 35 to 44 Years | 57 (71.3%) | 0 (0.0%) |
| 45 to 54 Years | 182 (82.0%) | 0 (0.0%) |
| 55 to 59 Years | 16 (34.8%) | 0 (0.0%) |
| 60 to 64 Years | 101 (73.2%) | 0 (0.0%) |
| 65 to 74 Years | 40 (23.7%) | 0 (0.0%) |
| 75 Years and over | 15 (10.7%) | 0 (0.0%) |
| Total | 754 (47.7%) | 0 (0.0%) |
Employment Status by Educational Attainment in Taylorsville
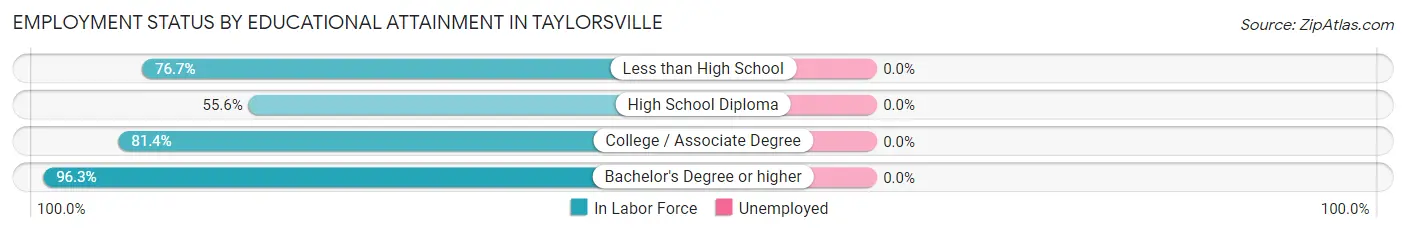
| Educational Attainment | In Labor Force | Unemployed |
| Less than High School | 135 (76.7%) | 0 (0.0%) |
| High School Diploma | 163 (55.6%) | 0 (0.0%) |
| College / Associate Degree | 215 (81.4%) | 0 (0.0%) |
| Bachelor's Degree or higher | 78 (96.3%) | 0 (0.0%) |
| Total | 591 (72.6%) | 0 (0.0%) |
Employment Occupations by Sex in Taylorsville
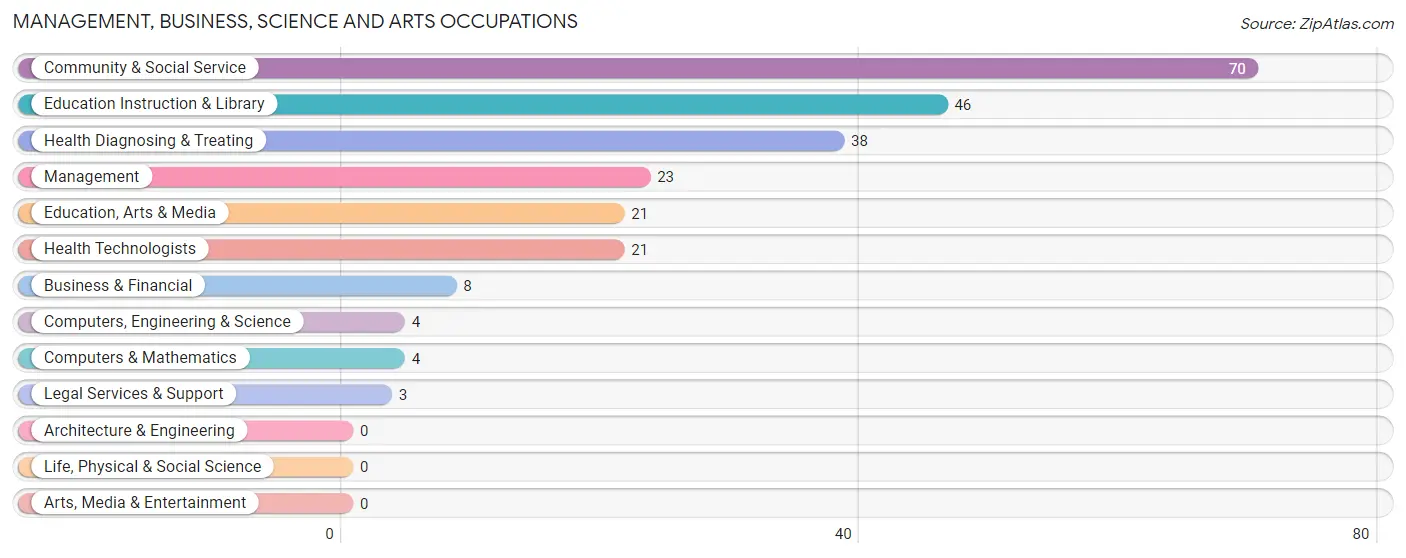
Management, Business, Science and Arts Occupations
The most common Management, Business, Science and Arts occupations in Taylorsville are Community & Social Service (70 | 9.3%), Education Instruction & Library (46 | 6.1%), Health Diagnosing & Treating (38 | 5.1%), Management (23 | 3.0%), and Education, Arts & Media (21 | 2.8%).
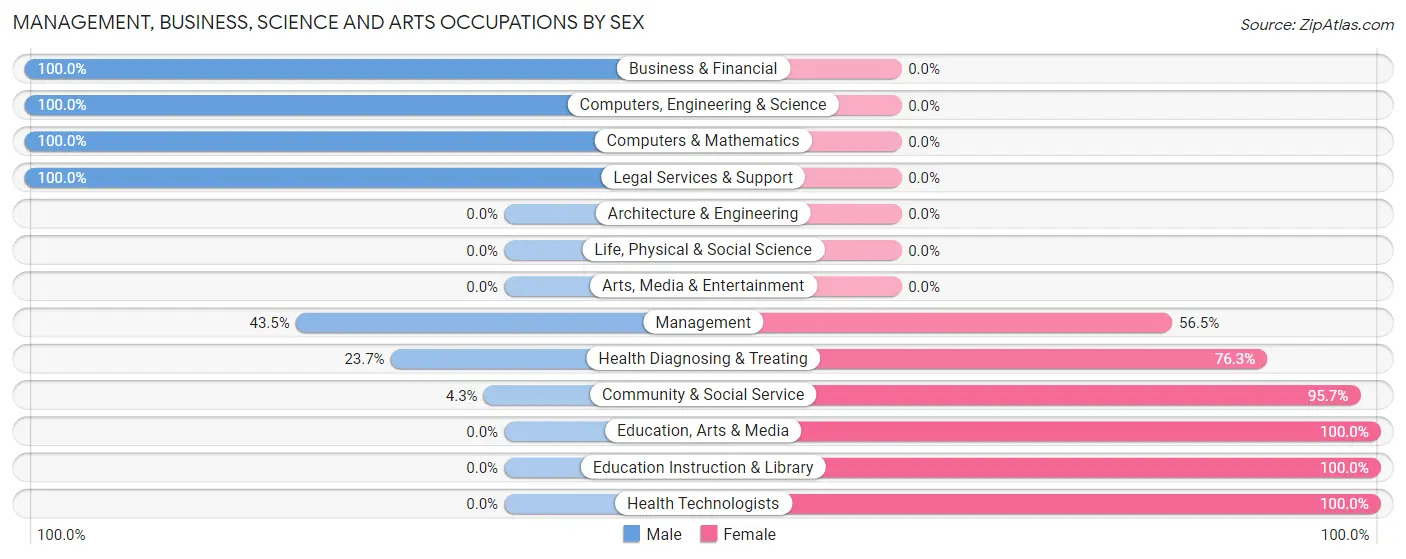
Management, Business, Science and Arts Occupations by Sex
Within the Management, Business, Science and Arts occupations in Taylorsville, the most male-oriented occupations are Business & Financial (100.0%), Computers, Engineering & Science (100.0%), and Computers & Mathematics (100.0%), while the most female-oriented occupations are Education, Arts & Media (100.0%), Education Instruction & Library (100.0%), and Health Technologists (100.0%).
| Occupation | Male | Female |
| Management | 10 (43.5%) | 13 (56.5%) |
| Business & Financial | 8 (100.0%) | 0 (0.0%) |
| Computers, Engineering & Science | 4 (100.0%) | 0 (0.0%) |
| Computers & Mathematics | 4 (100.0%) | 0 (0.0%) |
| Architecture & Engineering | 0 (0.0%) | 0 (0.0%) |
| Life, Physical & Social Science | 0 (0.0%) | 0 (0.0%) |
| Community & Social Service | 3 (4.3%) | 67 (95.7%) |
| Education, Arts & Media | 0 (0.0%) | 21 (100.0%) |
| Legal Services & Support | 3 (100.0%) | 0 (0.0%) |
| Education Instruction & Library | 0 (0.0%) | 46 (100.0%) |
| Arts, Media & Entertainment | 0 (0.0%) | 0 (0.0%) |
| Health Diagnosing & Treating | 9 (23.7%) | 29 (76.3%) |
| Health Technologists | 0 (0.0%) | 21 (100.0%) |
| Total (Category) | 34 (23.8%) | 109 (76.2%) |
| Total (Overall) | 449 (59.6%) | 304 (40.4%) |
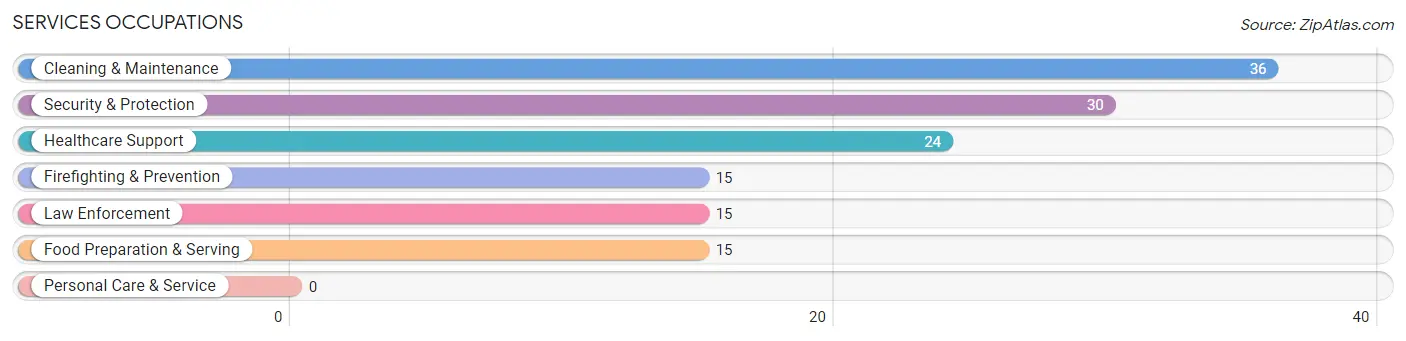
Services Occupations
The most common Services occupations in Taylorsville are Cleaning & Maintenance (36 | 4.8%), Security & Protection (30 | 4.0%), Healthcare Support (24 | 3.2%), Firefighting & Prevention (15 | 2.0%), and Law Enforcement (15 | 2.0%).
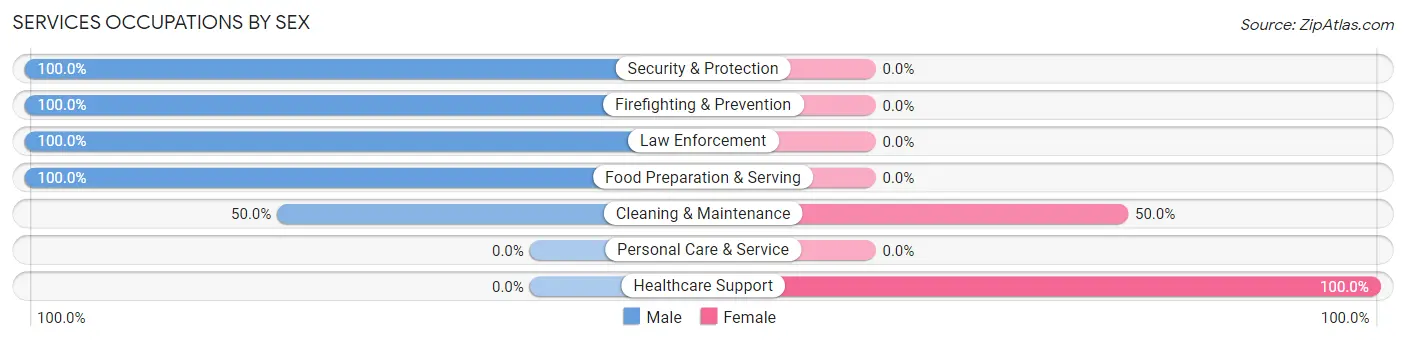
Services Occupations by Sex
Within the Services occupations in Taylorsville, the most male-oriented occupations are Security & Protection (100.0%), Firefighting & Prevention (100.0%), and Law Enforcement (100.0%), while the most female-oriented occupations are Healthcare Support (100.0%), and Cleaning & Maintenance (50.0%).
| Occupation | Male | Female |
| Healthcare Support | 0 (0.0%) | 24 (100.0%) |
| Security & Protection | 30 (100.0%) | 0 (0.0%) |
| Firefighting & Prevention | 15 (100.0%) | 0 (0.0%) |
| Law Enforcement | 15 (100.0%) | 0 (0.0%) |
| Food Preparation & Serving | 15 (100.0%) | 0 (0.0%) |
| Cleaning & Maintenance | 18 (50.0%) | 18 (50.0%) |
| Personal Care & Service | 0 (0.0%) | 0 (0.0%) |
| Total (Category) | 63 (60.0%) | 42 (40.0%) |
| Total (Overall) | 449 (59.6%) | 304 (40.4%) |
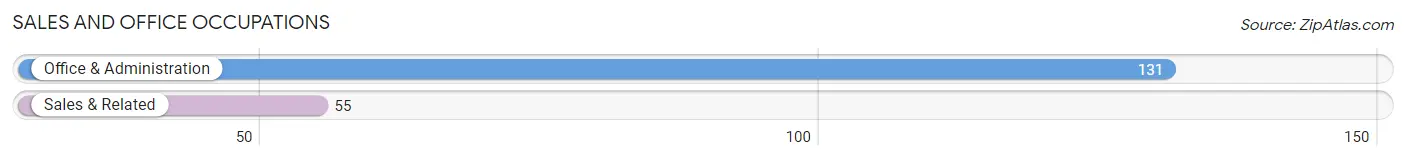
Sales and Office Occupations
The most common Sales and Office occupations in Taylorsville are Office & Administration (131 | 17.4%), and Sales & Related (55 | 7.3%).
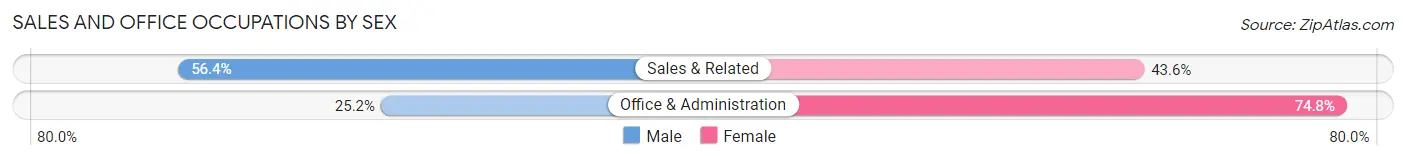
Sales and Office Occupations by Sex
| Occupation | Male | Female |
| Sales & Related | 31 (56.4%) | 24 (43.6%) |
| Office & Administration | 33 (25.2%) | 98 (74.8%) |
| Total (Category) | 64 (34.4%) | 122 (65.6%) |
| Total (Overall) | 449 (59.6%) | 304 (40.4%) |
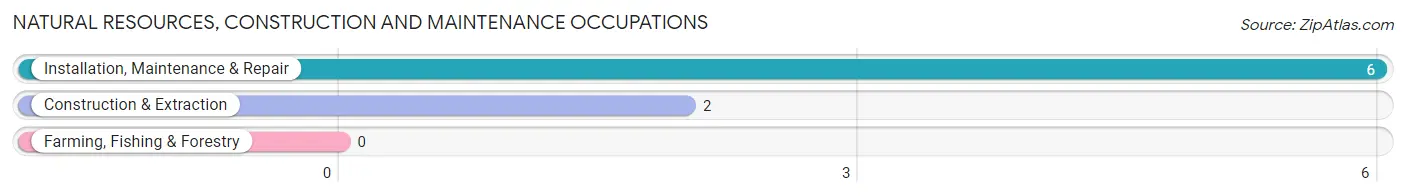
Natural Resources, Construction and Maintenance Occupations
The most common Natural Resources, Construction and Maintenance occupations in Taylorsville are Installation, Maintenance & Repair (6 | 0.8%), and Construction & Extraction (2 | 0.3%).
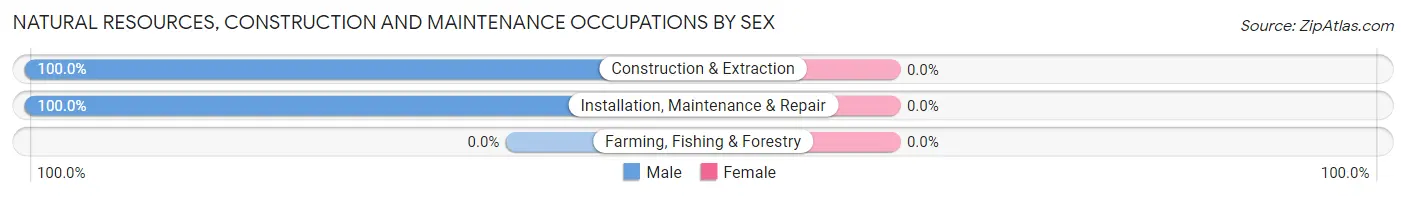
Natural Resources, Construction and Maintenance Occupations by Sex
| Occupation | Male | Female |
| Farming, Fishing & Forestry | 0 (0.0%) | 0 (0.0%) |
| Construction & Extraction | 2 (100.0%) | 0 (0.0%) |
| Installation, Maintenance & Repair | 6 (100.0%) | 0 (0.0%) |
| Total (Category) | 8 (100.0%) | 0 (0.0%) |
| Total (Overall) | 449 (59.6%) | 304 (40.4%) |
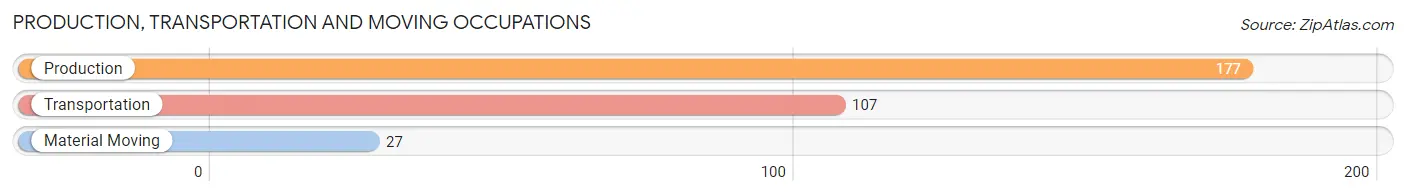
Production, Transportation and Moving Occupations
The most common Production, Transportation and Moving occupations in Taylorsville are Production (177 | 23.5%), Transportation (107 | 14.2%), and Material Moving (27 | 3.6%).
Production, Transportation and Moving Occupations by Sex
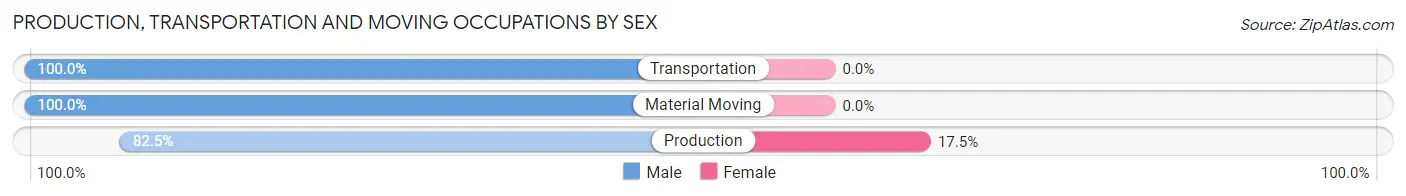
| Occupation | Male | Female |
| Production | 146 (82.5%) | 31 (17.5%) |
| Transportation | 107 (100.0%) | 0 (0.0%) |
| Material Moving | 27 (100.0%) | 0 (0.0%) |
| Total (Category) | 280 (90.0%) | 31 (10.0%) |
| Total (Overall) | 449 (59.6%) | 304 (40.4%) |
Employment Industries by Sex in Taylorsville
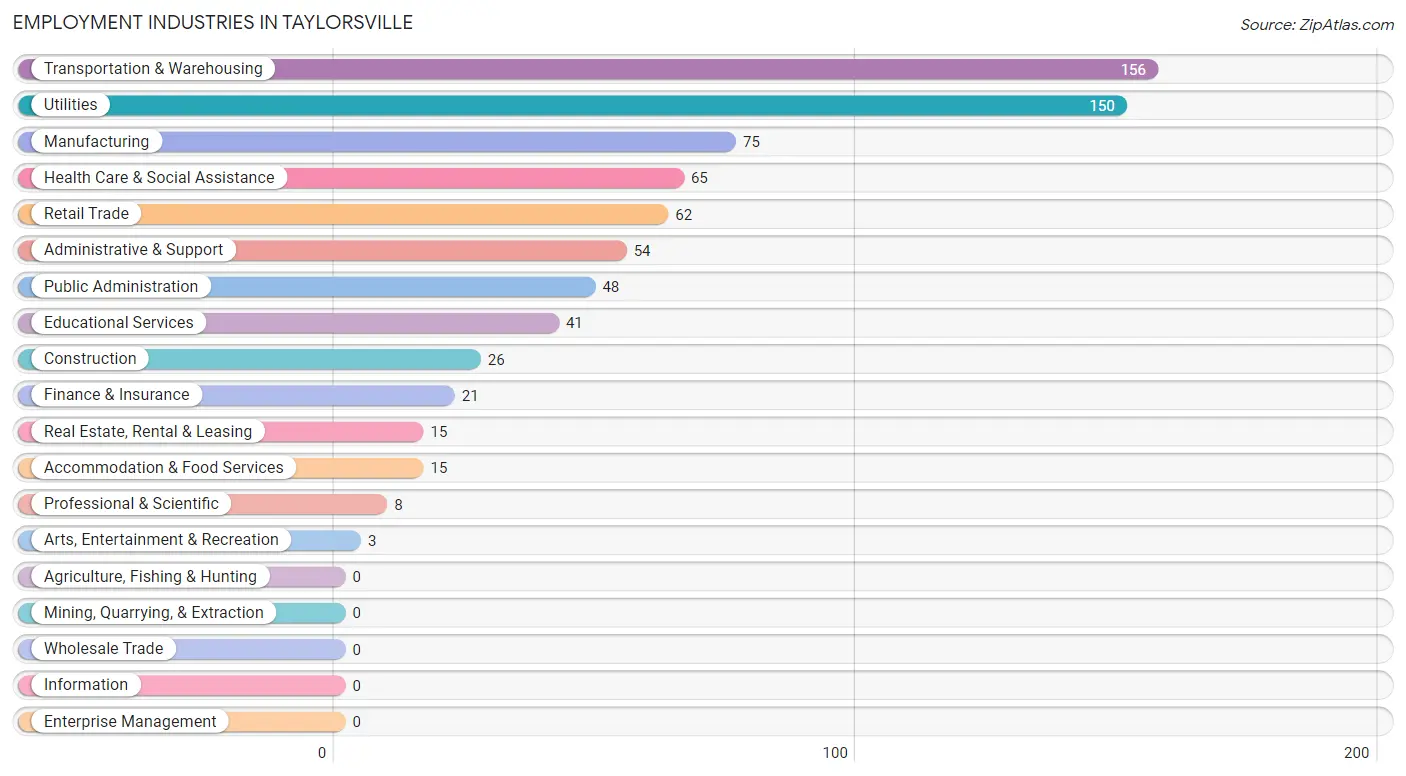
Employment Industries in Taylorsville
The major employment industries in Taylorsville include Transportation & Warehousing (156 | 20.7%), Utilities (150 | 19.9%), Manufacturing (75 | 10.0%), Health Care & Social Assistance (65 | 8.6%), and Retail Trade (62 | 8.2%).
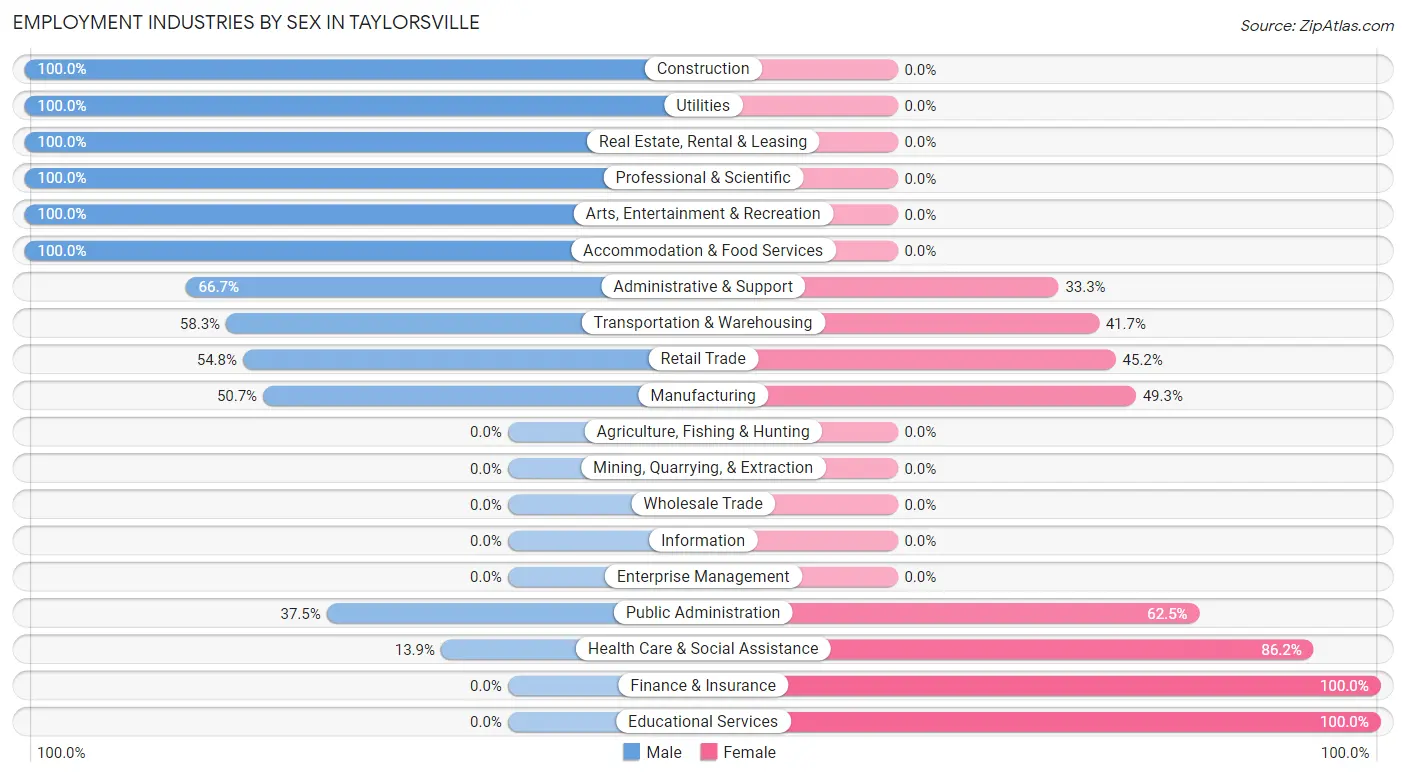
Employment Industries by Sex in Taylorsville
The Taylorsville industries that see more men than women are Construction (100.0%), Utilities (100.0%), and Real Estate, Rental & Leasing (100.0%), whereas the industries that tend to have a higher number of women are Finance & Insurance (100.0%), Educational Services (100.0%), and Health Care & Social Assistance (86.2%).
| Industry | Male | Female |
| Agriculture, Fishing & Hunting | 0 (0.0%) | 0 (0.0%) |
| Mining, Quarrying, & Extraction | 0 (0.0%) | 0 (0.0%) |
| Construction | 26 (100.0%) | 0 (0.0%) |
| Manufacturing | 38 (50.7%) | 37 (49.3%) |
| Wholesale Trade | 0 (0.0%) | 0 (0.0%) |
| Retail Trade | 34 (54.8%) | 28 (45.2%) |
| Transportation & Warehousing | 91 (58.3%) | 65 (41.7%) |
| Utilities | 150 (100.0%) | 0 (0.0%) |
| Information | 0 (0.0%) | 0 (0.0%) |
| Finance & Insurance | 0 (0.0%) | 21 (100.0%) |
| Real Estate, Rental & Leasing | 15 (100.0%) | 0 (0.0%) |
| Professional & Scientific | 8 (100.0%) | 0 (0.0%) |
| Enterprise Management | 0 (0.0%) | 0 (0.0%) |
| Administrative & Support | 36 (66.7%) | 18 (33.3%) |
| Educational Services | 0 (0.0%) | 41 (100.0%) |
| Health Care & Social Assistance | 9 (13.9%) | 56 (86.2%) |
| Arts, Entertainment & Recreation | 3 (100.0%) | 0 (0.0%) |
| Accommodation & Food Services | 15 (100.0%) | 0 (0.0%) |
| Public Administration | 18 (37.5%) | 30 (62.5%) |
| Total | 449 (59.6%) | 304 (40.4%) |
Education in Taylorsville
School Enrollment in Taylorsville
The most common levels of schooling among the 263 students in Taylorsville are elementary school (69 | 26.2%), middle school (47 | 17.9%), and high school (46 | 17.5%).
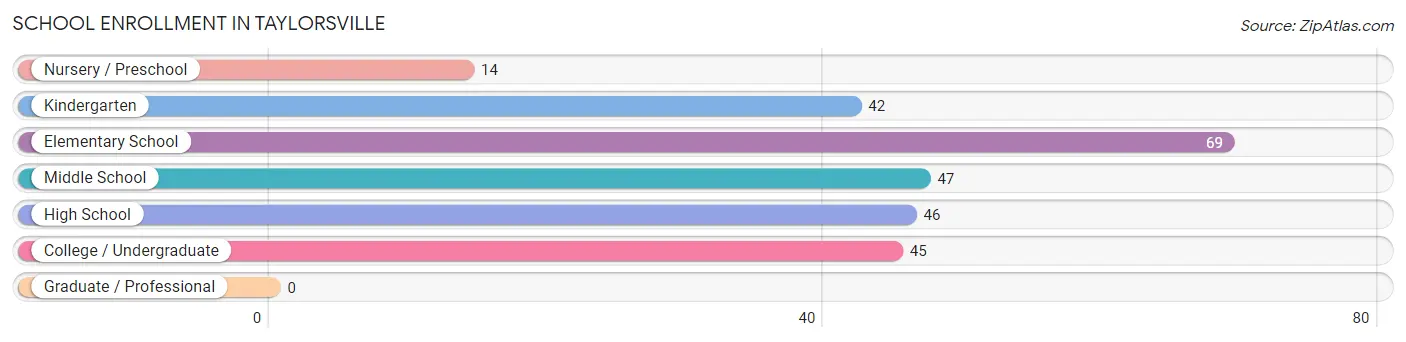
| School Level | # Students | % Students |
| Nursery / Preschool | 14 | 5.3% |
| Kindergarten | 42 | 16.0% |
| Elementary School | 69 | 26.2% |
| Middle School | 47 | 17.9% |
| High School | 46 | 17.5% |
| College / Undergraduate | 45 | 17.1% |
| Graduate / Professional | 0 | 0.0% |
| Total | 263 | 100.0% |
School Enrollment by Age by Funding Source in Taylorsville
Out of a total of 263 students who are enrolled in schools in Taylorsville, 21 (8.0%) attend a private institution, while the remaining 242 (92.0%) are enrolled in public schools. The age group of 20 to 24 year olds has the highest likelihood of being enrolled in private schools, with 15 (24.2% in the age bracket) enrolled. Conversely, the age group of 5 to 9 year old has the lowest likelihood of being enrolled in a private school, with 62 (100.0% in the age bracket) attending a public institution.
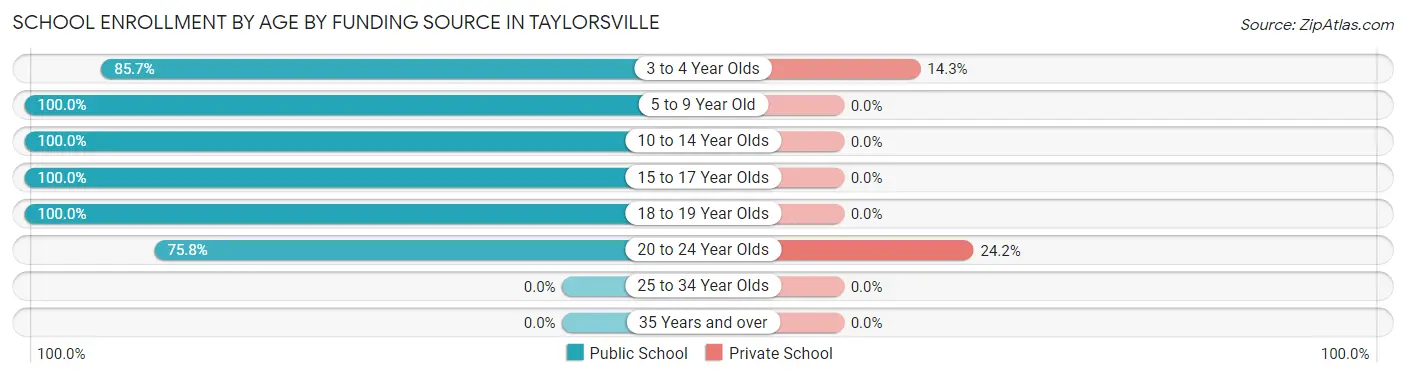
| Age Bracket | Public School | Private School |
| 3 to 4 Year Olds | 36 (85.7%) | 6 (14.3%) |
| 5 to 9 Year Old | 62 (100.0%) | 0 (0.0%) |
| 10 to 14 Year Olds | 36 (100.0%) | 0 (0.0%) |
| 15 to 17 Year Olds | 46 (100.0%) | 0 (0.0%) |
| 18 to 19 Year Olds | 15 (100.0%) | 0 (0.0%) |
| 20 to 24 Year Olds | 47 (75.8%) | 15 (24.2%) |
| 25 to 34 Year Olds | 0 (0.0%) | 0 (0.0%) |
| 35 Years and over | 0 (0.0%) | 0 (0.0%) |
| Total | 242 (92.0%) | 21 (8.0%) |
Educational Attainment by Field of Study in Taylorsville
Arts & humanities (62 | 42.8%), education (51 | 35.2%), science & technology (17 | 11.7%), psychology (5 | 3.5%), and business (5 | 3.5%) are the most common fields of study among 145 individuals in Taylorsville who have obtained a bachelor's degree or higher.
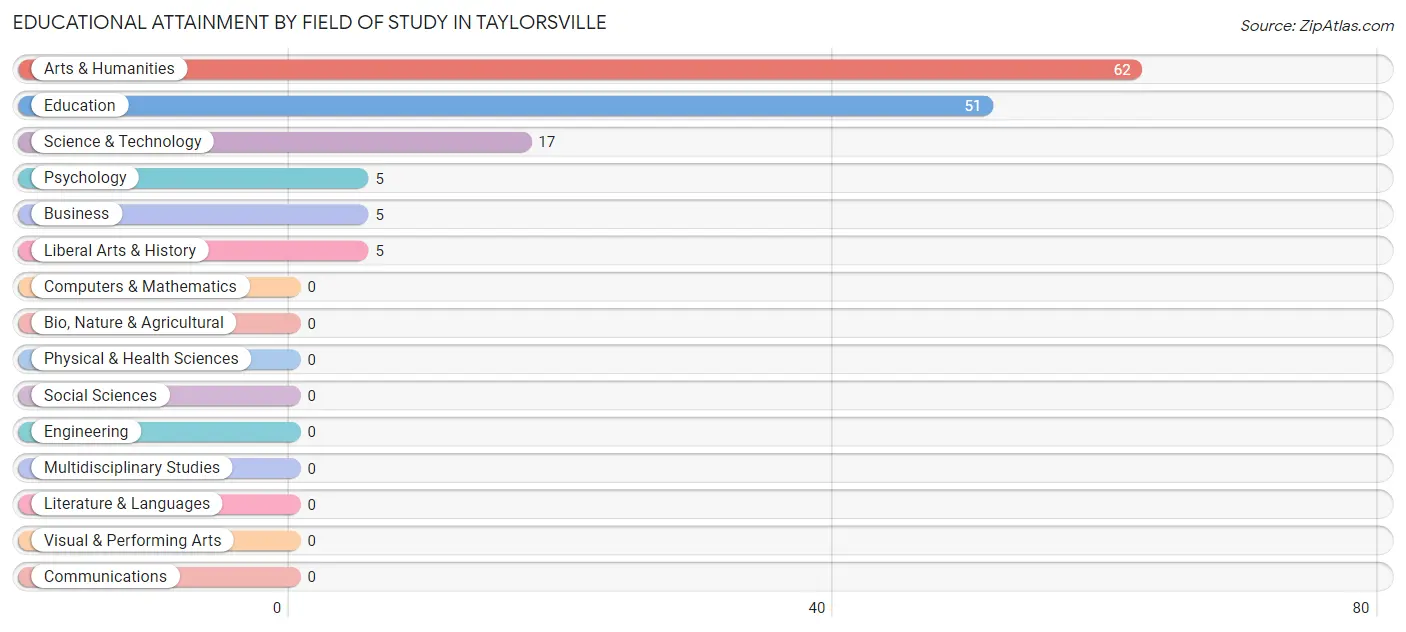
| Field of Study | # Graduates | % Graduates |
| Computers & Mathematics | 0 | 0.0% |
| Bio, Nature & Agricultural | 0 | 0.0% |
| Physical & Health Sciences | 0 | 0.0% |
| Psychology | 5 | 3.5% |
| Social Sciences | 0 | 0.0% |
| Engineering | 0 | 0.0% |
| Multidisciplinary Studies | 0 | 0.0% |
| Science & Technology | 17 | 11.7% |
| Business | 5 | 3.5% |
| Education | 51 | 35.2% |
| Literature & Languages | 0 | 0.0% |
| Liberal Arts & History | 5 | 3.5% |
| Visual & Performing Arts | 0 | 0.0% |
| Communications | 0 | 0.0% |
| Arts & Humanities | 62 | 42.8% |
| Total | 145 | 100.0% |
Transportation & Commute in Taylorsville
Vehicle Availability by Sex in Taylorsville
The most prevalent vehicle ownership categories in Taylorsville are males with 2 vehicles (329, accounting for 73.3%) and females with 2 vehicles (135, making up 111.9%).
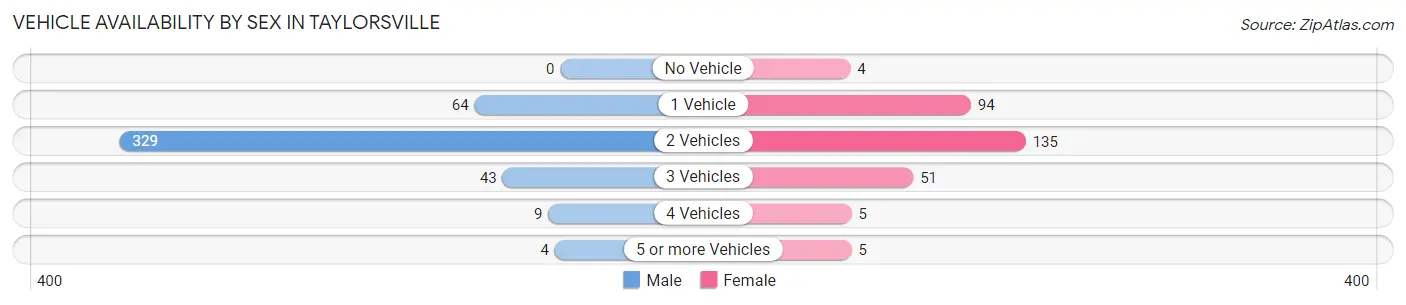
| Vehicles Available | Male | Female |
| No Vehicle | 0 (0.0%) | 4 (1.4%) |
| 1 Vehicle | 64 (14.2%) | 94 (32.0%) |
| 2 Vehicles | 329 (73.3%) | 135 (45.9%) |
| 3 Vehicles | 43 (9.6%) | 51 (17.3%) |
| 4 Vehicles | 9 (2.0%) | 5 (1.7%) |
| 5 or more Vehicles | 4 (0.9%) | 5 (1.7%) |
| Total | 449 (100.0%) | 294 (100.0%) |
Commute Time in Taylorsville
The most frequently occuring commute durations in Taylorsville are 5 to 9 minutes (206 commuters, 31.6%), 10 to 14 minutes (105 commuters, 16.1%), and 20 to 24 minutes (104 commuters, 16.0%).
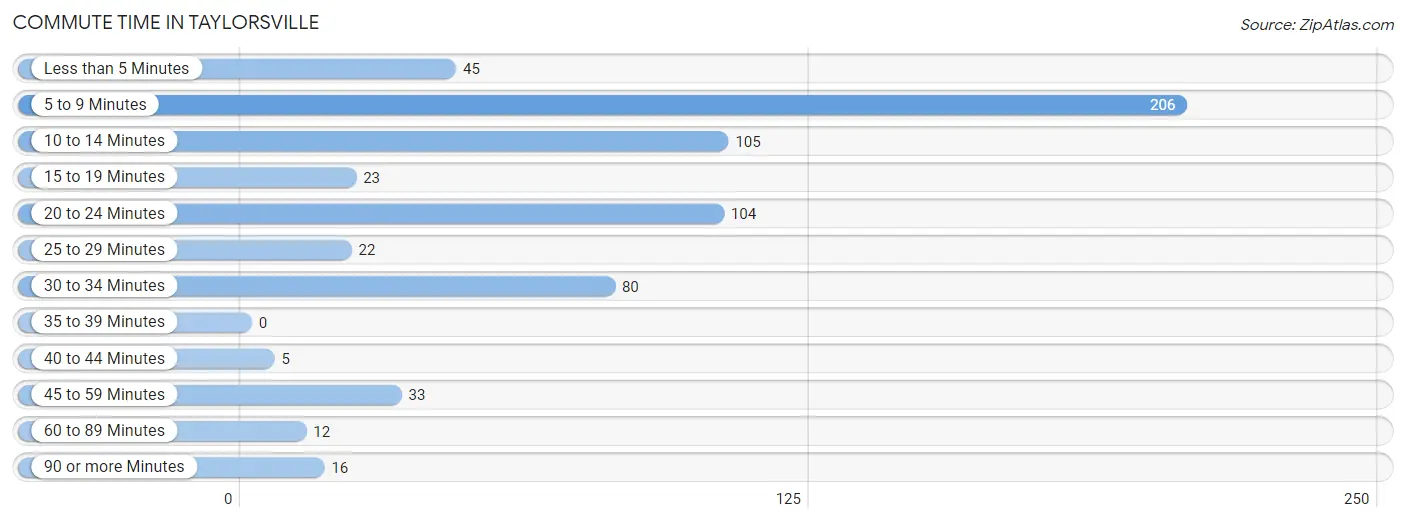
| Commute Time | # Commuters | % Commuters |
| Less than 5 Minutes | 45 | 6.9% |
| 5 to 9 Minutes | 206 | 31.6% |
| 10 to 14 Minutes | 105 | 16.1% |
| 15 to 19 Minutes | 23 | 3.5% |
| 20 to 24 Minutes | 104 | 16.0% |
| 25 to 29 Minutes | 22 | 3.4% |
| 30 to 34 Minutes | 80 | 12.3% |
| 35 to 39 Minutes | 0 | 0.0% |
| 40 to 44 Minutes | 5 | 0.8% |
| 45 to 59 Minutes | 33 | 5.1% |
| 60 to 89 Minutes | 12 | 1.8% |
| 90 or more Minutes | 16 | 2.5% |
Commute Time by Sex in Taylorsville
The most common commute times in Taylorsville are 5 to 9 minutes (178 commuters, 49.2%) for males and 10 to 14 minutes (90 commuters, 31.1%) for females.
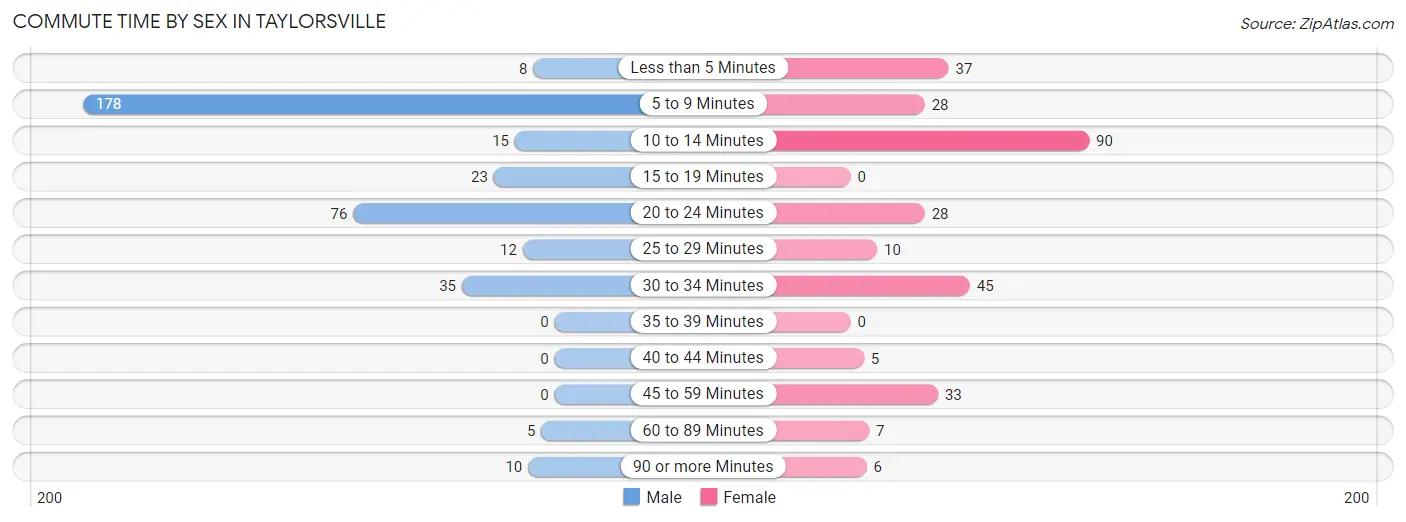
| Commute Time | Male | Female |
| Less than 5 Minutes | 8 (2.2%) | 37 (12.8%) |
| 5 to 9 Minutes | 178 (49.2%) | 28 (9.7%) |
| 10 to 14 Minutes | 15 (4.1%) | 90 (31.1%) |
| 15 to 19 Minutes | 23 (6.4%) | 0 (0.0%) |
| 20 to 24 Minutes | 76 (21.0%) | 28 (9.7%) |
| 25 to 29 Minutes | 12 (3.3%) | 10 (3.5%) |
| 30 to 34 Minutes | 35 (9.7%) | 45 (15.6%) |
| 35 to 39 Minutes | 0 (0.0%) | 0 (0.0%) |
| 40 to 44 Minutes | 0 (0.0%) | 5 (1.7%) |
| 45 to 59 Minutes | 0 (0.0%) | 33 (11.4%) |
| 60 to 89 Minutes | 5 (1.4%) | 7 (2.4%) |
| 90 or more Minutes | 10 (2.8%) | 6 (2.1%) |
Time of Departure to Work by Sex in Taylorsville
The most frequent times of departure to work in Taylorsville are 8:00 AM to 8:29 AM (122, 33.7%) for males and 7:00 AM to 7:29 AM (119, 41.2%) for females.
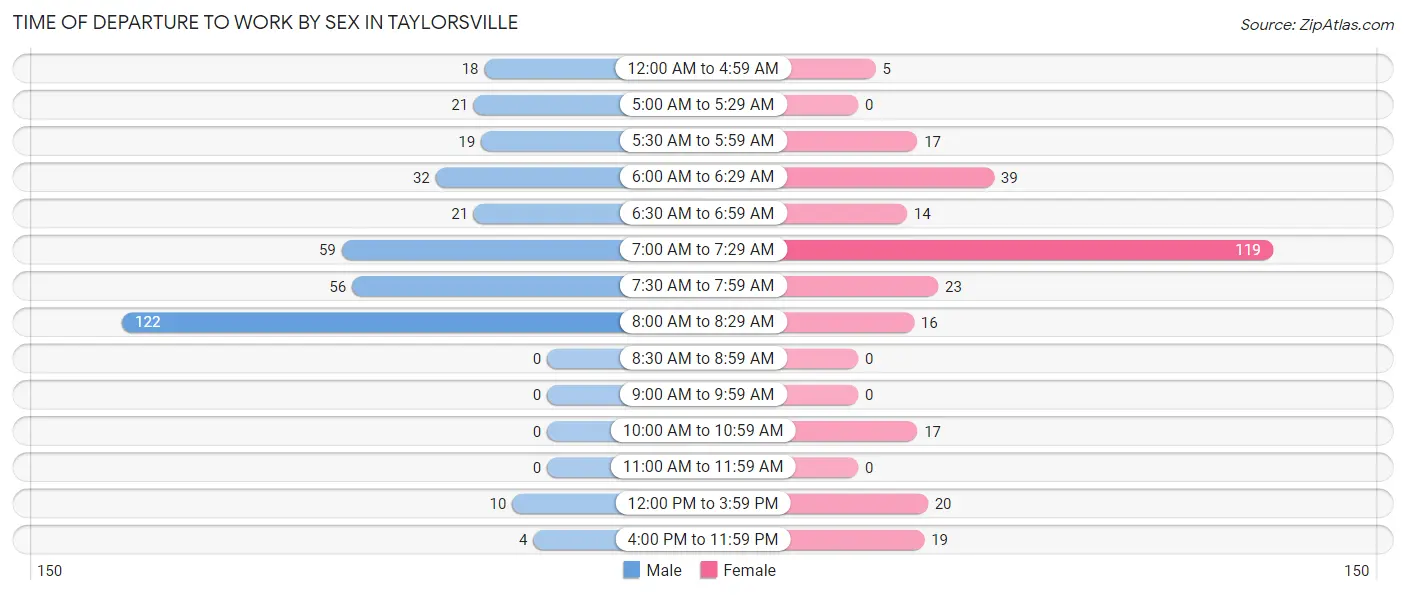
| Time of Departure | Male | Female |
| 12:00 AM to 4:59 AM | 18 (5.0%) | 5 (1.7%) |
| 5:00 AM to 5:29 AM | 21 (5.8%) | 0 (0.0%) |
| 5:30 AM to 5:59 AM | 19 (5.2%) | 17 (5.9%) |
| 6:00 AM to 6:29 AM | 32 (8.8%) | 39 (13.5%) |
| 6:30 AM to 6:59 AM | 21 (5.8%) | 14 (4.8%) |
| 7:00 AM to 7:29 AM | 59 (16.3%) | 119 (41.2%) |
| 7:30 AM to 7:59 AM | 56 (15.5%) | 23 (8.0%) |
| 8:00 AM to 8:29 AM | 122 (33.7%) | 16 (5.5%) |
| 8:30 AM to 8:59 AM | 0 (0.0%) | 0 (0.0%) |
| 9:00 AM to 9:59 AM | 0 (0.0%) | 0 (0.0%) |
| 10:00 AM to 10:59 AM | 0 (0.0%) | 17 (5.9%) |
| 11:00 AM to 11:59 AM | 0 (0.0%) | 0 (0.0%) |
| 12:00 PM to 3:59 PM | 10 (2.8%) | 20 (6.9%) |
| 4:00 PM to 11:59 PM | 4 (1.1%) | 19 (6.6%) |
| Total | 362 (100.0%) | 289 (100.0%) |
Housing Occupancy in Taylorsville
Occupancy by Ownership in Taylorsville
Of the total 657 dwellings in Taylorsville, owner-occupied units account for 398 (60.6%), while renter-occupied units make up 259 (39.4%).
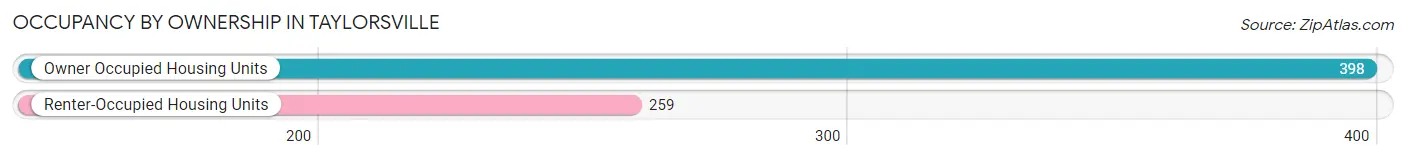
| Occupancy | # Housing Units | % Housing Units |
| Owner Occupied Housing Units | 398 | 60.6% |
| Renter-Occupied Housing Units | 259 | 39.4% |
| Total Occupied Housing Units | 657 | 100.0% |
Occupancy by Household Size in Taylorsville
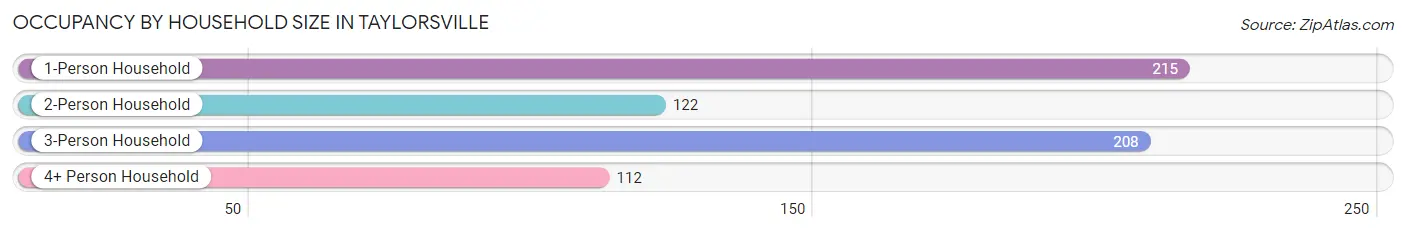
| Household Size | # Housing Units | % Housing Units |
| 1-Person Household | 215 | 32.7% |
| 2-Person Household | 122 | 18.6% |
| 3-Person Household | 208 | 31.7% |
| 4+ Person Household | 112 | 17.1% |
| Total Housing Units | 657 | 100.0% |
Occupancy by Ownership by Household Size in Taylorsville
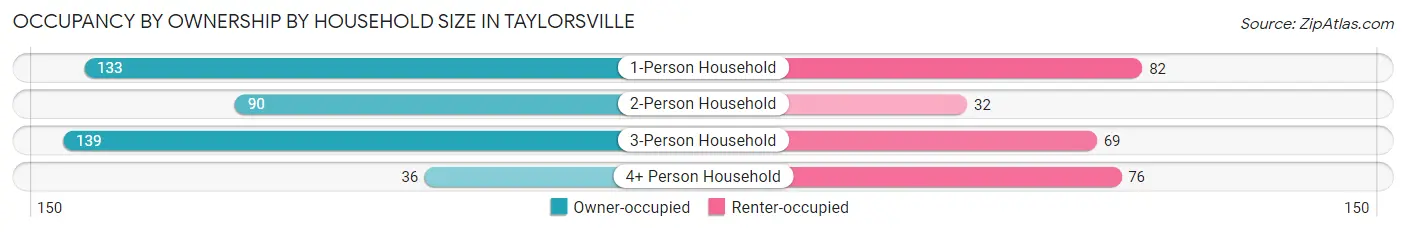
| Household Size | Owner-occupied | Renter-occupied |
| 1-Person Household | 133 (61.9%) | 82 (38.1%) |
| 2-Person Household | 90 (73.8%) | 32 (26.2%) |
| 3-Person Household | 139 (66.8%) | 69 (33.2%) |
| 4+ Person Household | 36 (32.1%) | 76 (67.9%) |
| Total Housing Units | 398 (60.6%) | 259 (39.4%) |
Occupancy by Educational Attainment in Taylorsville
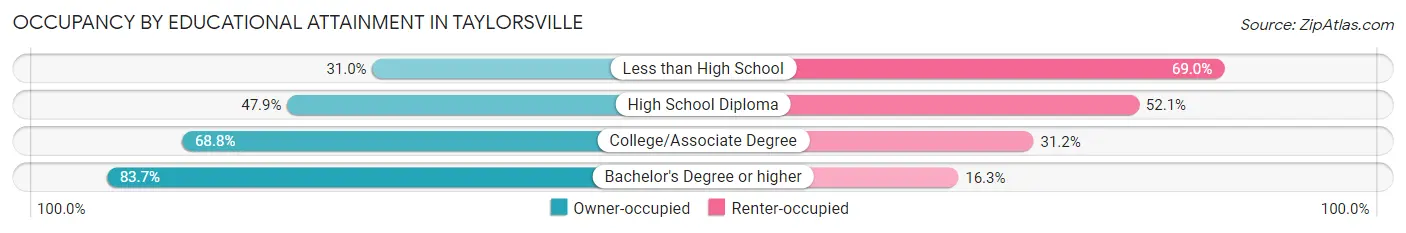
| Household Size | Owner-occupied | Renter-occupied |
| Less than High School | 18 (31.0%) | 40 (69.0%) |
| High School Diploma | 103 (47.9%) | 112 (52.1%) |
| College/Associate Degree | 205 (68.8%) | 93 (31.2%) |
| Bachelor's Degree or higher | 72 (83.7%) | 14 (16.3%) |
Occupancy by Age of Householder in Taylorsville
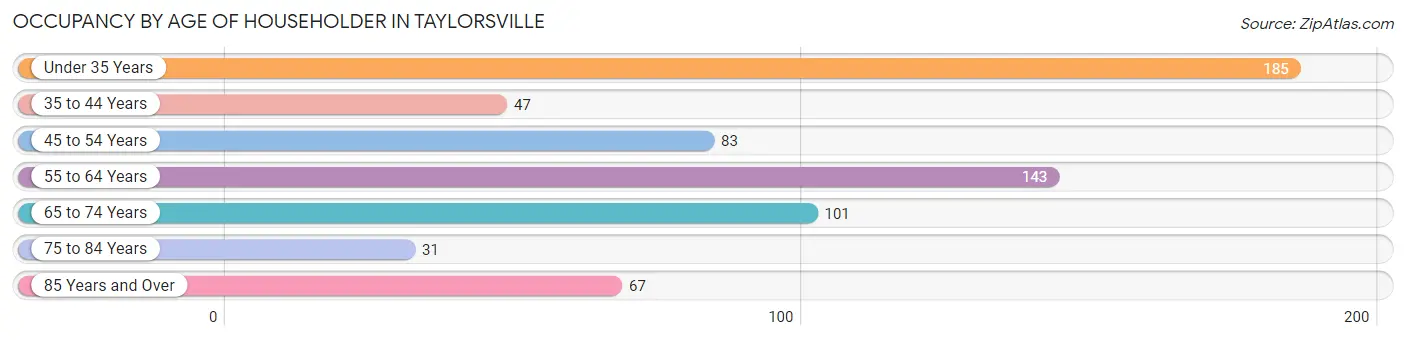
| Age Bracket | # Households | % Households |
| Under 35 Years | 185 | 28.2% |
| 35 to 44 Years | 47 | 7.1% |
| 45 to 54 Years | 83 | 12.6% |
| 55 to 64 Years | 143 | 21.8% |
| 65 to 74 Years | 101 | 15.4% |
| 75 to 84 Years | 31 | 4.7% |
| 85 Years and Over | 67 | 10.2% |
| Total | 657 | 100.0% |
Housing Finances in Taylorsville
Median Income by Occupancy in Taylorsville
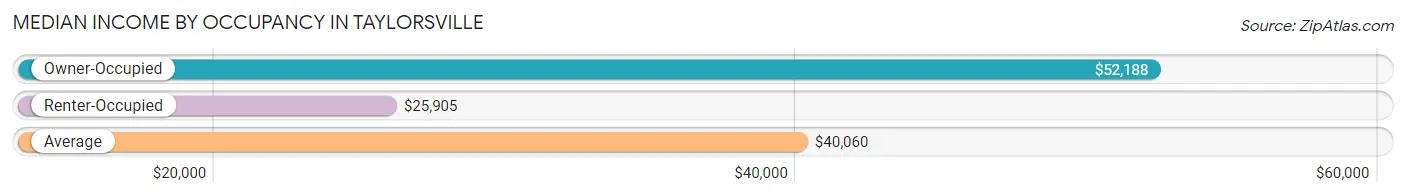
| Occupancy Type | # Households | Median Income |
| Owner-Occupied | 398 (60.6%) | $52,188 |
| Renter-Occupied | 259 (39.4%) | $25,905 |
| Average | 657 (100.0%) | $40,060 |
Occupancy by Householder Income Bracket in Taylorsville
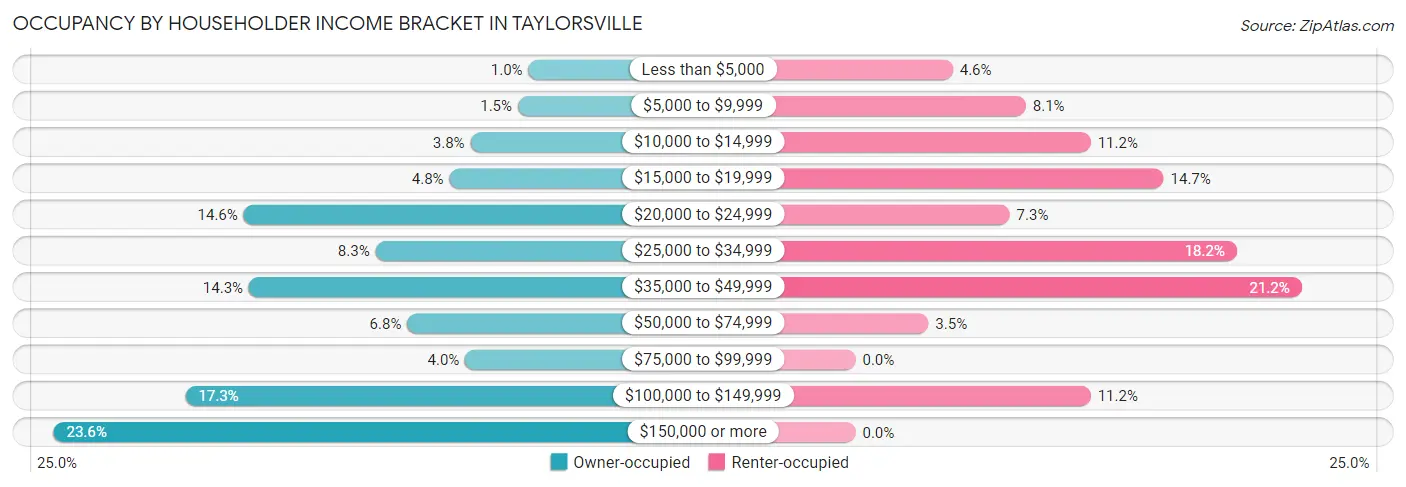
| Income Bracket | Owner-occupied | Renter-occupied |
| Less than $5,000 | 4 (1.0%) | 12 (4.6%) |
| $5,000 to $9,999 | 6 (1.5%) | 21 (8.1%) |
| $10,000 to $14,999 | 15 (3.8%) | 29 (11.2%) |
| $15,000 to $19,999 | 19 (4.8%) | 38 (14.7%) |
| $20,000 to $24,999 | 58 (14.6%) | 19 (7.3%) |
| $25,000 to $34,999 | 33 (8.3%) | 47 (18.1%) |
| $35,000 to $49,999 | 57 (14.3%) | 55 (21.2%) |
| $50,000 to $74,999 | 27 (6.8%) | 9 (3.5%) |
| $75,000 to $99,999 | 16 (4.0%) | 0 (0.0%) |
| $100,000 to $149,999 | 69 (17.3%) | 29 (11.2%) |
| $150,000 or more | 94 (23.6%) | 0 (0.0%) |
| Total | 398 (100.0%) | 259 (100.0%) |
Monthly Housing Cost Tiers in Taylorsville
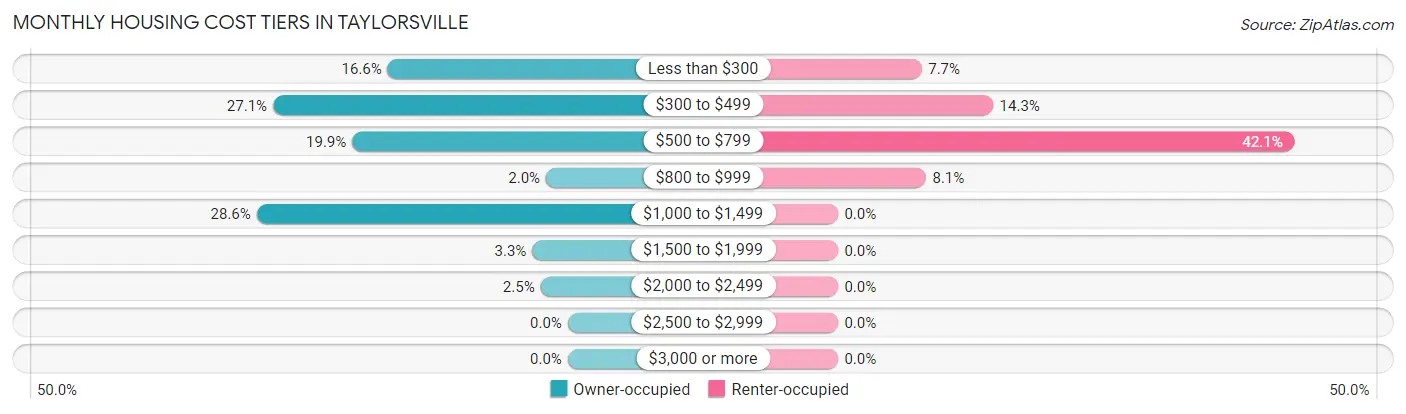
| Monthly Cost | Owner-occupied | Renter-occupied |
| Less than $300 | 66 (16.6%) | 20 (7.7%) |
| $300 to $499 | 108 (27.1%) | 37 (14.3%) |
| $500 to $799 | 79 (19.9%) | 109 (42.1%) |
| $800 to $999 | 8 (2.0%) | 21 (8.1%) |
| $1,000 to $1,499 | 114 (28.6%) | 0 (0.0%) |
| $1,500 to $1,999 | 13 (3.3%) | 0 (0.0%) |
| $2,000 to $2,499 | 10 (2.5%) | 0 (0.0%) |
| $2,500 to $2,999 | 0 (0.0%) | 0 (0.0%) |
| $3,000 or more | 0 (0.0%) | 0 (0.0%) |
| Total | 398 (100.0%) | 259 (100.0%) |
Physical Housing Characteristics in Taylorsville
Housing Structures in Taylorsville
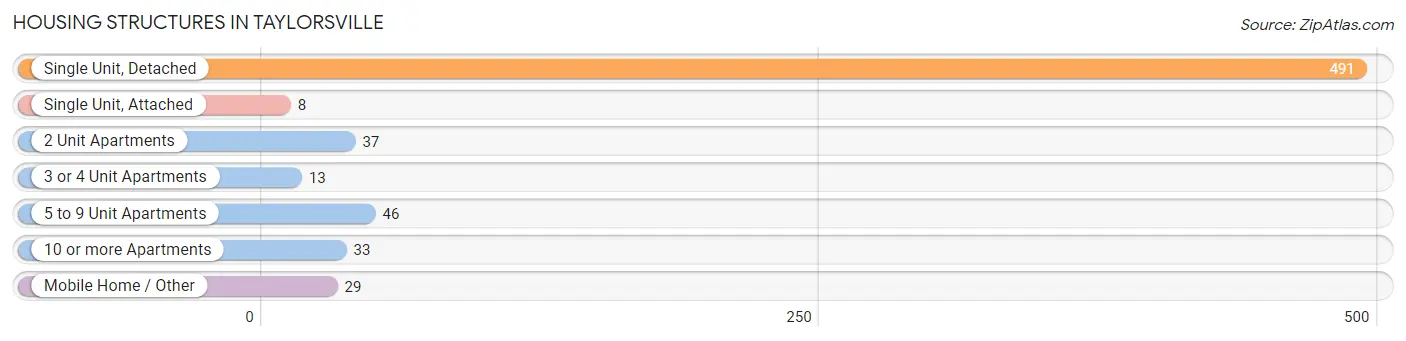
| Structure Type | # Housing Units | % Housing Units |
| Single Unit, Detached | 491 | 74.7% |
| Single Unit, Attached | 8 | 1.2% |
| 2 Unit Apartments | 37 | 5.6% |
| 3 or 4 Unit Apartments | 13 | 2.0% |
| 5 to 9 Unit Apartments | 46 | 7.0% |
| 10 or more Apartments | 33 | 5.0% |
| Mobile Home / Other | 29 | 4.4% |
| Total | 657 | 100.0% |
Housing Structures by Occupancy in Taylorsville
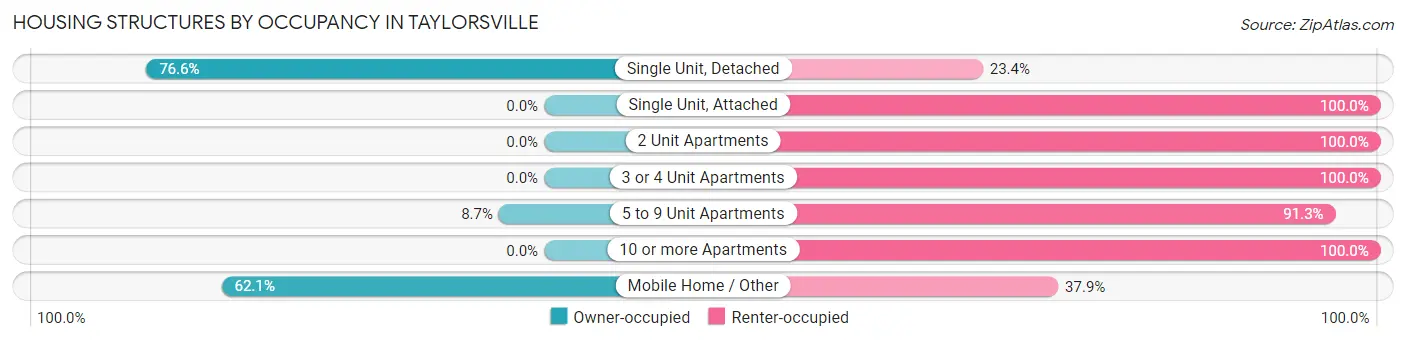
| Structure Type | Owner-occupied | Renter-occupied |
| Single Unit, Detached | 376 (76.6%) | 115 (23.4%) |
| Single Unit, Attached | 0 (0.0%) | 8 (100.0%) |
| 2 Unit Apartments | 0 (0.0%) | 37 (100.0%) |
| 3 or 4 Unit Apartments | 0 (0.0%) | 13 (100.0%) |
| 5 to 9 Unit Apartments | 4 (8.7%) | 42 (91.3%) |
| 10 or more Apartments | 0 (0.0%) | 33 (100.0%) |
| Mobile Home / Other | 18 (62.1%) | 11 (37.9%) |
| Total | 398 (60.6%) | 259 (39.4%) |
Housing Structures by Number of Rooms in Taylorsville
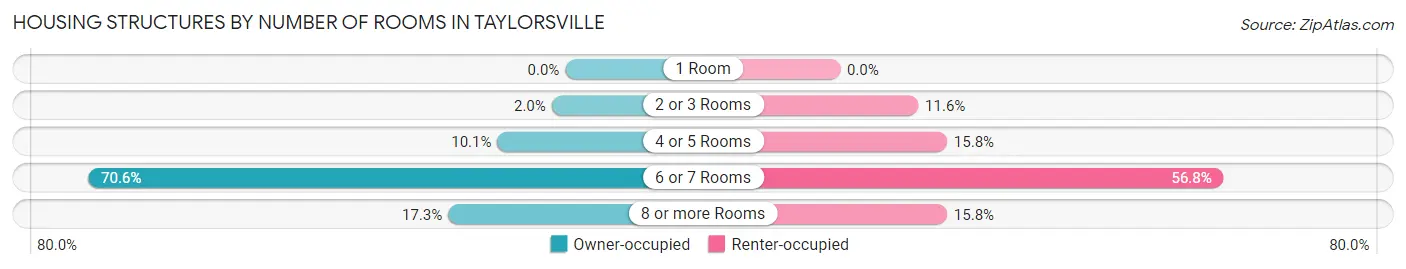
| Number of Rooms | Owner-occupied | Renter-occupied |
| 1 Room | 0 (0.0%) | 0 (0.0%) |
| 2 or 3 Rooms | 8 (2.0%) | 30 (11.6%) |
| 4 or 5 Rooms | 40 (10.1%) | 41 (15.8%) |
| 6 or 7 Rooms | 281 (70.6%) | 147 (56.8%) |
| 8 or more Rooms | 69 (17.3%) | 41 (15.8%) |
| Total | 398 (100.0%) | 259 (100.0%) |
Housing Structure by Heating Type in Taylorsville
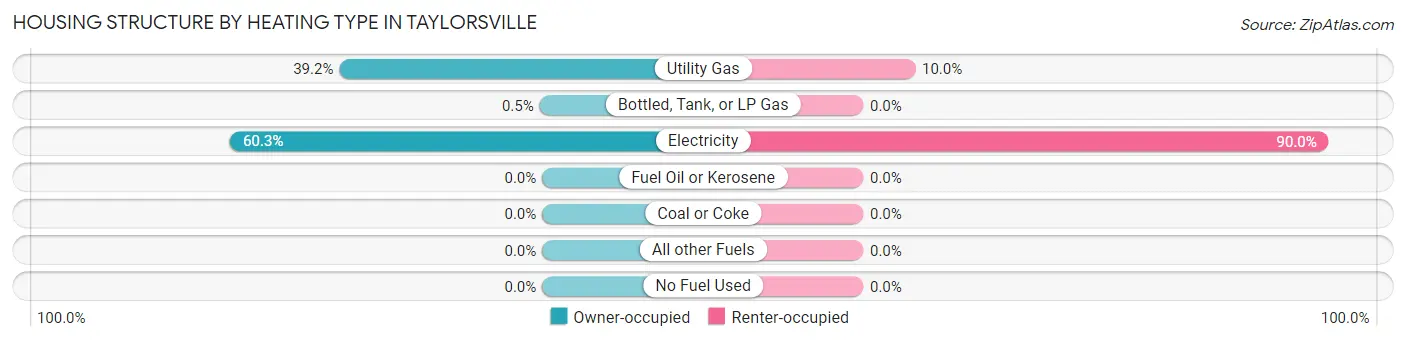
| Heating Type | Owner-occupied | Renter-occupied |
| Utility Gas | 156 (39.2%) | 26 (10.0%) |
| Bottled, Tank, or LP Gas | 2 (0.5%) | 0 (0.0%) |
| Electricity | 240 (60.3%) | 233 (90.0%) |
| Fuel Oil or Kerosene | 0 (0.0%) | 0 (0.0%) |
| Coal or Coke | 0 (0.0%) | 0 (0.0%) |
| All other Fuels | 0 (0.0%) | 0 (0.0%) |
| No Fuel Used | 0 (0.0%) | 0 (0.0%) |
| Total | 398 (100.0%) | 259 (100.0%) |
Household Vehicle Usage in Taylorsville
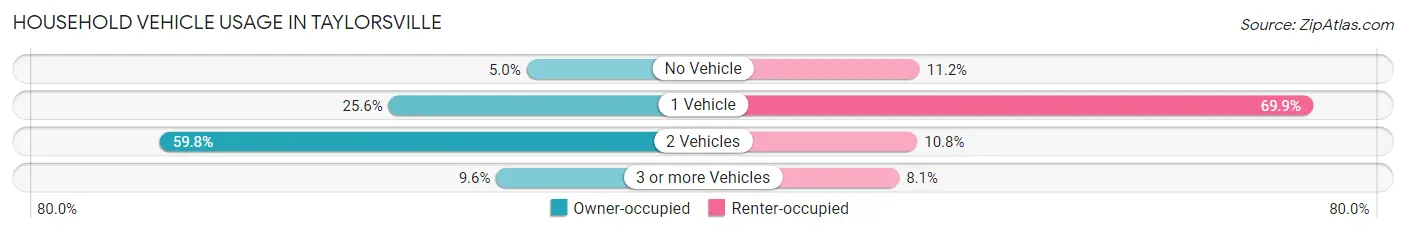
| Vehicles per Household | Owner-occupied | Renter-occupied |
| No Vehicle | 20 (5.0%) | 29 (11.2%) |
| 1 Vehicle | 102 (25.6%) | 181 (69.9%) |
| 2 Vehicles | 238 (59.8%) | 28 (10.8%) |
| 3 or more Vehicles | 38 (9.6%) | 21 (8.1%) |
| Total | 398 (100.0%) | 259 (100.0%) |
Real Estate & Mortgages in Taylorsville
Real Estate and Mortgage Overview in Taylorsville
| Characteristic | Without Mortgage | With Mortgage |
| Housing Units | 228 | 170 |
| Median Property Value | $133,100 | $138,500 |
| Median Household Income | $36,477 | $89 |
| Monthly Housing Costs | $353 | $0 |
| Real Estate Taxes | $807 | $102 |
Property Value by Mortgage Status in Taylorsville
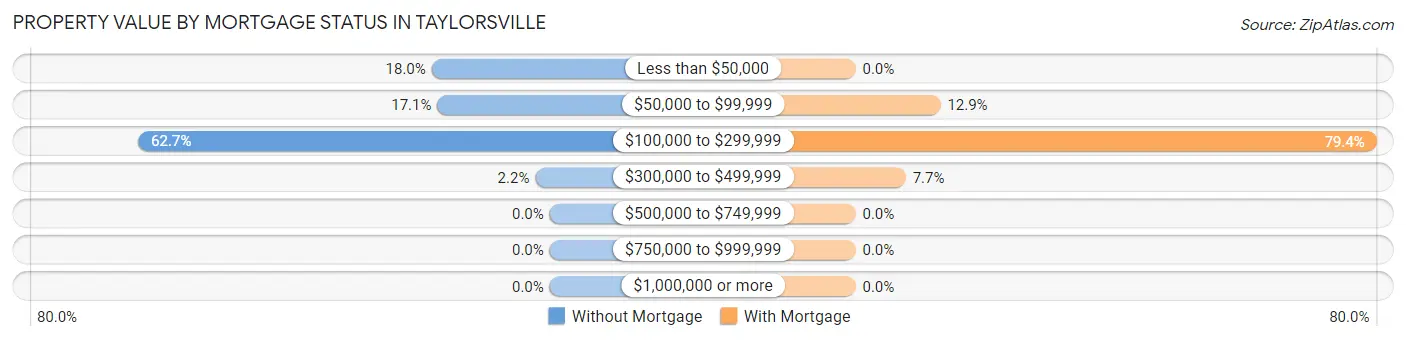
| Property Value | Without Mortgage | With Mortgage |
| Less than $50,000 | 41 (18.0%) | 0 (0.0%) |
| $50,000 to $99,999 | 39 (17.1%) | 22 (12.9%) |
| $100,000 to $299,999 | 143 (62.7%) | 135 (79.4%) |
| $300,000 to $499,999 | 5 (2.2%) | 13 (7.6%) |
| $500,000 to $749,999 | 0 (0.0%) | 0 (0.0%) |
| $750,000 to $999,999 | 0 (0.0%) | 0 (0.0%) |
| $1,000,000 or more | 0 (0.0%) | 0 (0.0%) |
| Total | 228 (100.0%) | 170 (100.0%) |
Household Income by Mortgage Status in Taylorsville
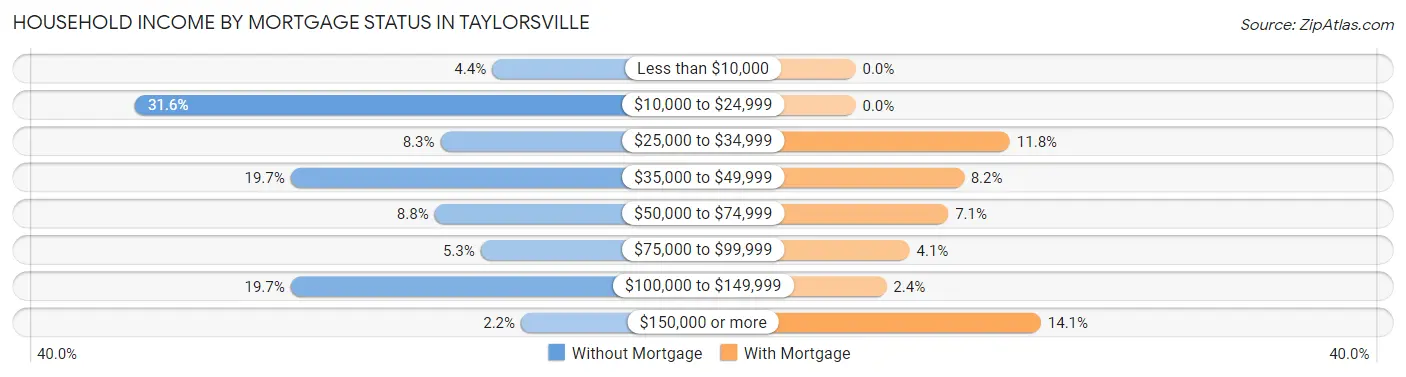
| Household Income | Without Mortgage | With Mortgage |
| Less than $10,000 | 10 (4.4%) | 0 (0.0%) |
| $10,000 to $24,999 | 72 (31.6%) | 0 (0.0%) |
| $25,000 to $34,999 | 19 (8.3%) | 20 (11.8%) |
| $35,000 to $49,999 | 45 (19.7%) | 14 (8.2%) |
| $50,000 to $74,999 | 20 (8.8%) | 12 (7.1%) |
| $75,000 to $99,999 | 12 (5.3%) | 7 (4.1%) |
| $100,000 to $149,999 | 45 (19.7%) | 4 (2.4%) |
| $150,000 or more | 5 (2.2%) | 24 (14.1%) |
| Total | 228 (100.0%) | 170 (100.0%) |
Property Value to Household Income Ratio in Taylorsville
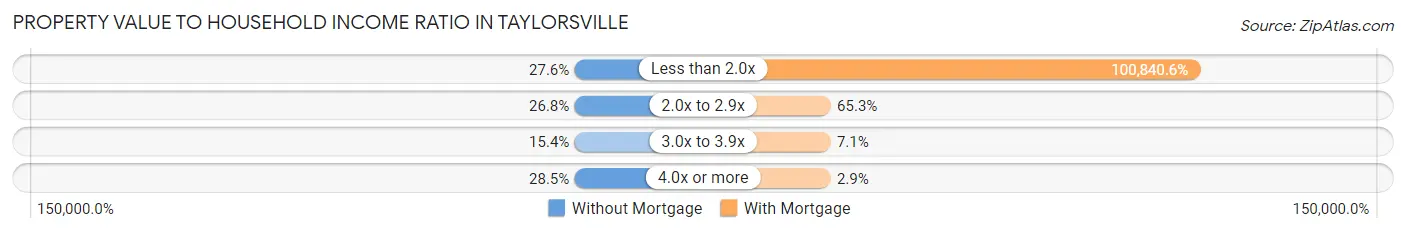
| Value-to-Income Ratio | Without Mortgage | With Mortgage |
| Less than 2.0x | 63 (27.6%) | 171,429 (100,840.6%) |
| 2.0x to 2.9x | 61 (26.8%) | 111 (65.3%) |
| 3.0x to 3.9x | 35 (15.3%) | 12 (7.1%) |
| 4.0x or more | 65 (28.5%) | 5 (2.9%) |
| Total | 228 (100.0%) | 170 (100.0%) |
Real Estate Taxes by Mortgage Status in Taylorsville
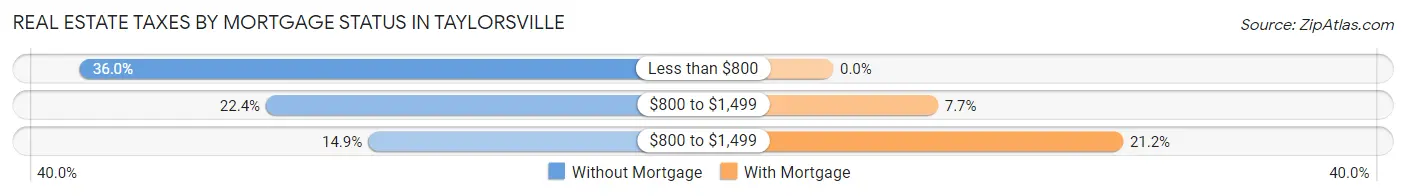
| Property Taxes | Without Mortgage | With Mortgage |
| Less than $800 | 82 (36.0%) | 0 (0.0%) |
| $800 to $1,499 | 51 (22.4%) | 13 (7.6%) |
| $800 to $1,499 | 34 (14.9%) | 36 (21.2%) |
| Total | 228 (100.0%) | 170 (100.0%) |
Health & Disability in Taylorsville
Health Insurance Coverage by Age in Taylorsville
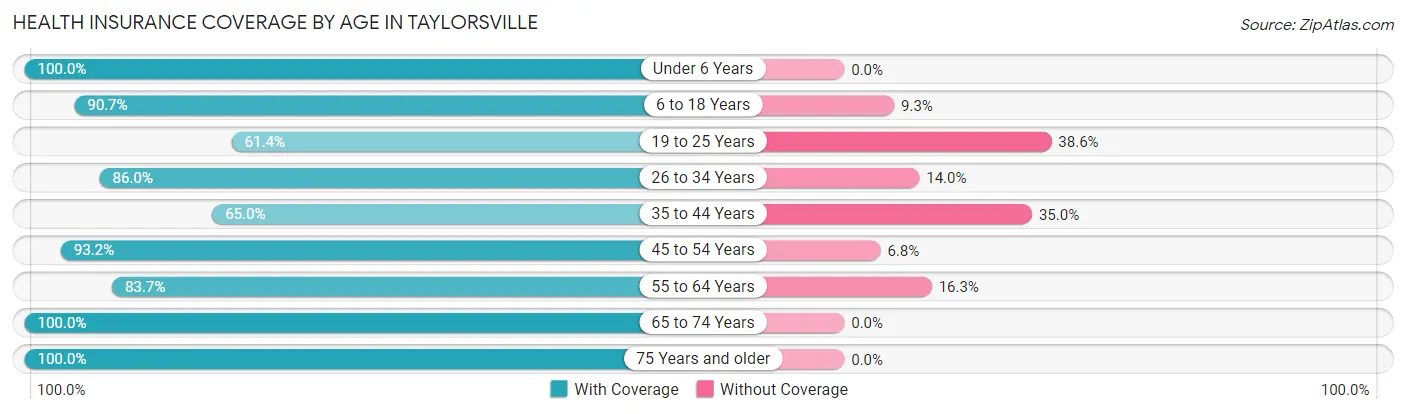
| Age Bracket | With Coverage | Without Coverage |
| Under 6 Years | 230 (100.0%) | 0 (0.0%) |
| 6 to 18 Years | 244 (90.7%) | 25 (9.3%) |
| 19 to 25 Years | 267 (61.4%) | 168 (38.6%) |
| 26 to 34 Years | 160 (86.0%) | 26 (14.0%) |
| 35 to 44 Years | 52 (65.0%) | 28 (35.0%) |
| 45 to 54 Years | 207 (93.2%) | 15 (6.8%) |
| 55 to 64 Years | 154 (83.7%) | 30 (16.3%) |
| 65 to 74 Years | 169 (100.0%) | 0 (0.0%) |
| 75 Years and older | 140 (100.0%) | 0 (0.0%) |
| Total | 1,623 (84.8%) | 292 (15.2%) |
Health Insurance Coverage by Citizenship Status in Taylorsville
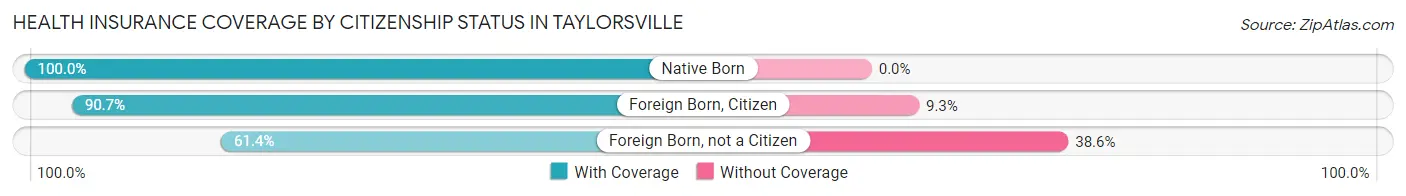
| Citizenship Status | With Coverage | Without Coverage |
| Native Born | 230 (100.0%) | 0 (0.0%) |
| Foreign Born, Citizen | 244 (90.7%) | 25 (9.3%) |
| Foreign Born, not a Citizen | 267 (61.4%) | 168 (38.6%) |
Health Insurance Coverage by Household Income in Taylorsville
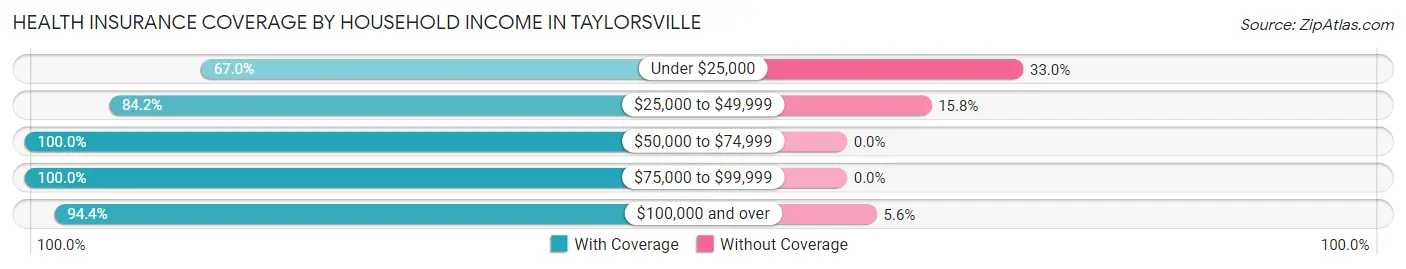
| Household Income | With Coverage | Without Coverage |
| Under $25,000 | 361 (67.0%) | 178 (33.0%) |
| $25,000 to $49,999 | 378 (84.2%) | 71 (15.8%) |
| $50,000 to $74,999 | 88 (100.0%) | 0 (0.0%) |
| $75,000 to $99,999 | 48 (100.0%) | 0 (0.0%) |
| $100,000 and over | 728 (94.4%) | 43 (5.6%) |
Public vs Private Health Insurance Coverage by Age in Taylorsville
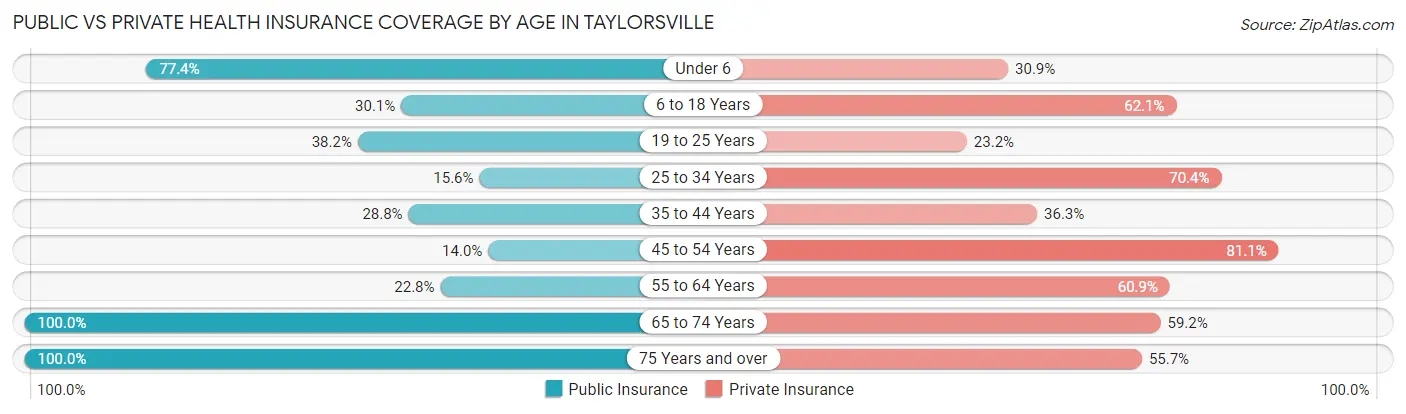
| Age Bracket | Public Insurance | Private Insurance |
| Under 6 | 178 (77.4%) | 71 (30.9%) |
| 6 to 18 Years | 81 (30.1%) | 167 (62.1%) |
| 19 to 25 Years | 166 (38.2%) | 101 (23.2%) |
| 25 to 34 Years | 29 (15.6%) | 131 (70.4%) |
| 35 to 44 Years | 23 (28.7%) | 29 (36.2%) |
| 45 to 54 Years | 31 (14.0%) | 180 (81.1%) |
| 55 to 64 Years | 42 (22.8%) | 112 (60.9%) |
| 65 to 74 Years | 169 (100.0%) | 100 (59.2%) |
| 75 Years and over | 140 (100.0%) | 78 (55.7%) |
| Total | 859 (44.9%) | 969 (50.6%) |
Disability Status by Sex by Age in Taylorsville
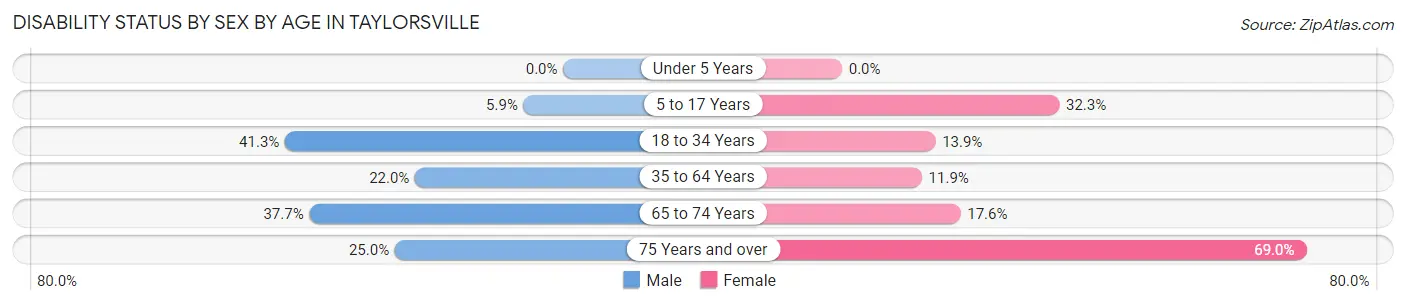
| Age Bracket | Male | Female |
| Under 5 Years | 0 (0.0%) | 0 (0.0%) |
| 5 to 17 Years | 4 (5.9%) | 30 (32.3%) |
| 18 to 34 Years | 164 (41.3%) | 48 (13.9%) |
| 35 to 64 Years | 55 (22.0%) | 28 (11.9%) |
| 65 to 74 Years | 23 (37.7%) | 19 (17.6%) |
| 75 Years and over | 6 (25.0%) | 80 (69.0%) |
Disability Class by Sex by Age in Taylorsville
Disability Class: Hearing Difficulty
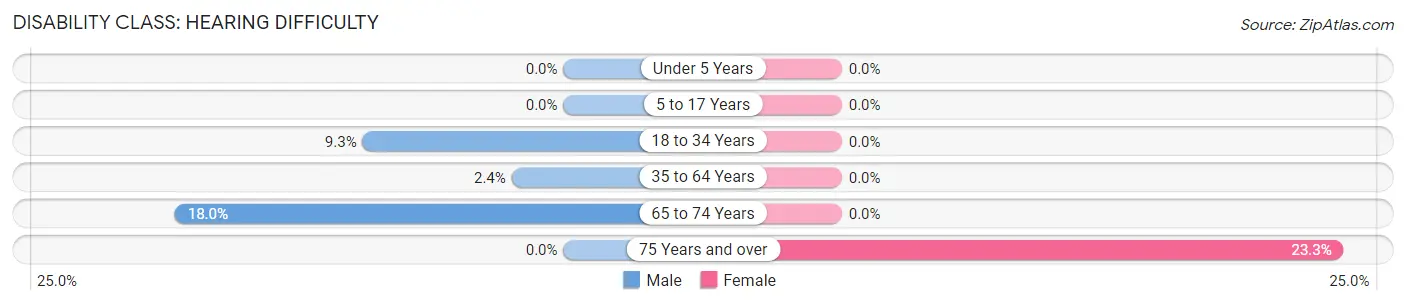
| Age Bracket | Male | Female |
| Under 5 Years | 0 (0.0%) | 0 (0.0%) |
| 5 to 17 Years | 0 (0.0%) | 0 (0.0%) |
| 18 to 34 Years | 37 (9.3%) | 0 (0.0%) |
| 35 to 64 Years | 6 (2.4%) | 0 (0.0%) |
| 65 to 74 Years | 11 (18.0%) | 0 (0.0%) |
| 75 Years and over | 0 (0.0%) | 27 (23.3%) |
Disability Class: Vision Difficulty
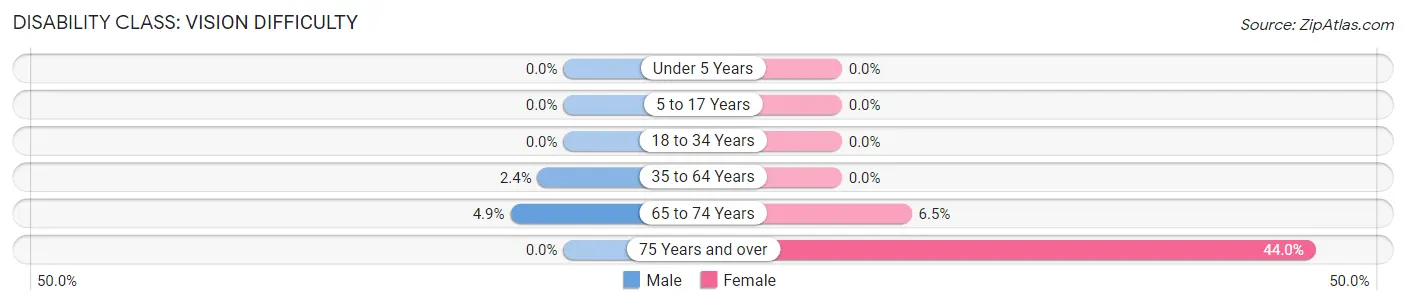
| Age Bracket | Male | Female |
| Under 5 Years | 0 (0.0%) | 0 (0.0%) |
| 5 to 17 Years | 0 (0.0%) | 0 (0.0%) |
| 18 to 34 Years | 0 (0.0%) | 0 (0.0%) |
| 35 to 64 Years | 6 (2.4%) | 0 (0.0%) |
| 65 to 74 Years | 3 (4.9%) | 7 (6.5%) |
| 75 Years and over | 0 (0.0%) | 51 (44.0%) |
Disability Class: Cognitive Difficulty
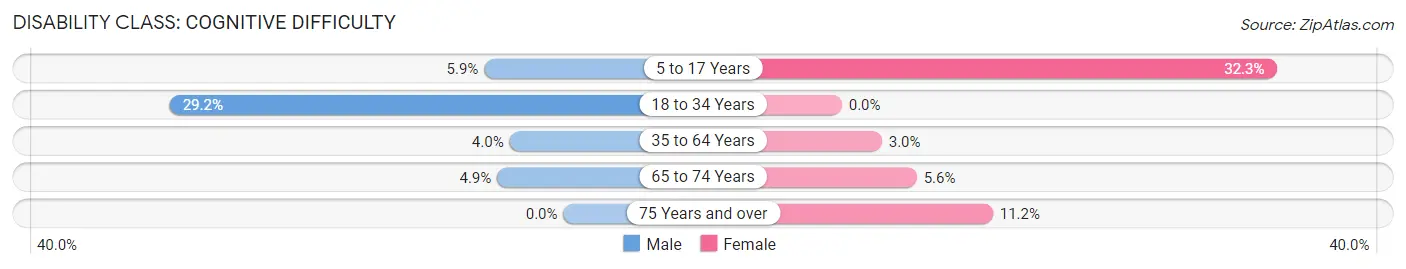
| Age Bracket | Male | Female |
| 5 to 17 Years | 4 (5.9%) | 30 (32.3%) |
| 18 to 34 Years | 116 (29.2%) | 0 (0.0%) |
| 35 to 64 Years | 10 (4.0%) | 7 (3.0%) |
| 65 to 74 Years | 3 (4.9%) | 6 (5.6%) |
| 75 Years and over | 0 (0.0%) | 13 (11.2%) |
Disability Class: Ambulatory Difficulty
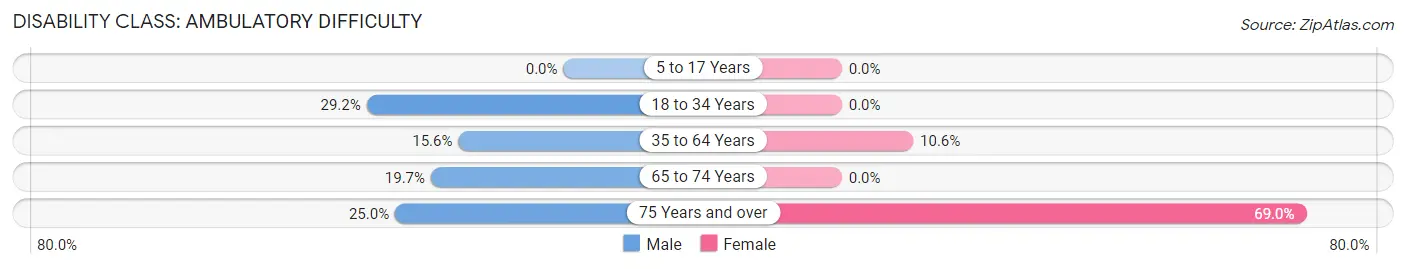
| Age Bracket | Male | Female |
| 5 to 17 Years | 0 (0.0%) | 0 (0.0%) |
| 18 to 34 Years | 116 (29.2%) | 0 (0.0%) |
| 35 to 64 Years | 39 (15.6%) | 25 (10.6%) |
| 65 to 74 Years | 12 (19.7%) | 0 (0.0%) |
| 75 Years and over | 6 (25.0%) | 80 (69.0%) |
Disability Class: Self-Care Difficulty
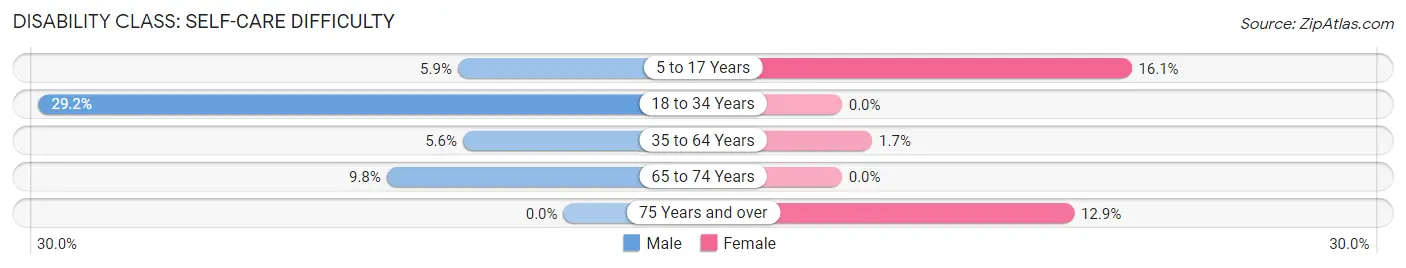
| Age Bracket | Male | Female |
| 5 to 17 Years | 4 (5.9%) | 15 (16.1%) |
| 18 to 34 Years | 116 (29.2%) | 0 (0.0%) |
| 35 to 64 Years | 14 (5.6%) | 4 (1.7%) |
| 65 to 74 Years | 6 (9.8%) | 0 (0.0%) |
| 75 Years and over | 0 (0.0%) | 15 (12.9%) |
Technology Access in Taylorsville
Computing Device Access in Taylorsville
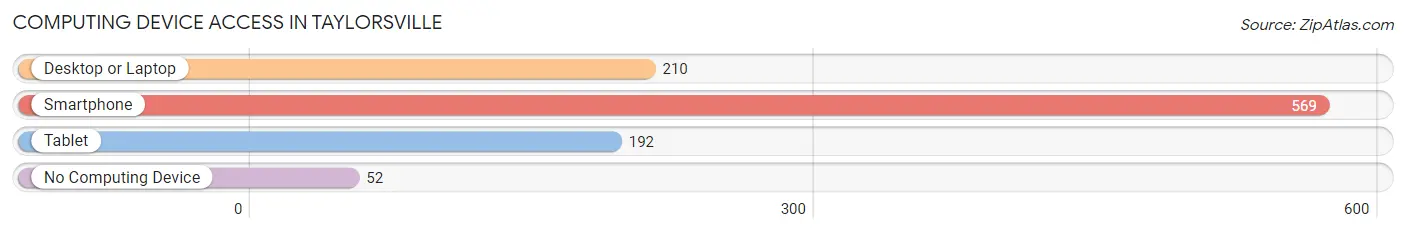
| Device Type | # Households | % Households |
| Desktop or Laptop | 210 | 32.0% |
| Smartphone | 569 | 86.6% |
| Tablet | 192 | 29.2% |
| No Computing Device | 52 | 7.9% |
| Total | 657 | 100.0% |
Internet Access in Taylorsville
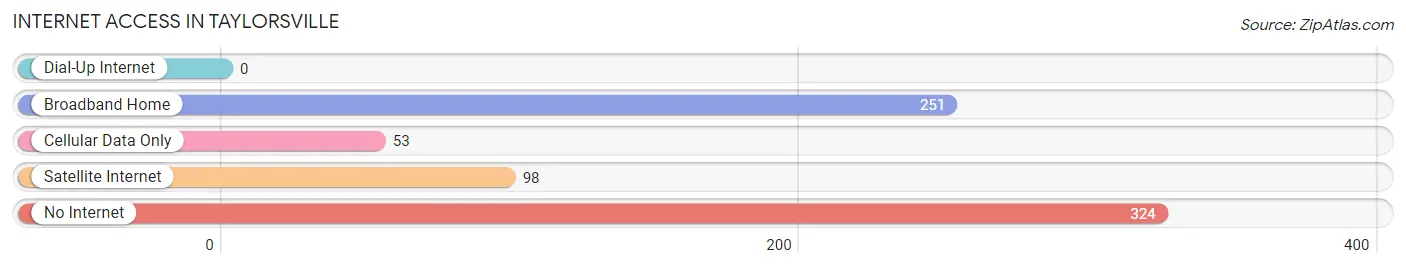
| Internet Type | # Households | % Households |
| Dial-Up Internet | 0 | 0.0% |
| Broadband Home | 251 | 38.2% |
| Cellular Data Only | 53 | 8.1% |
| Satellite Internet | 98 | 14.9% |
| No Internet | 324 | 49.3% |
| Total | 657 | 100.0% |
Taylorsville Summary
Taylorsville is a small town located in Smith County, Mississippi. It is situated in the northeast corner of the state, approximately 30 miles from the state capital of Jackson. The town has a population of approximately 1,000 people and is part of the larger Smith County area.
History
Taylorsville was founded in 1837 by William Taylor, a local landowner. The town was named after him and was originally known as Taylor’s Crossroads. The town was incorporated in 1845 and was the first town in Smith County. The town was a major stop on the stagecoach route between Jackson and Meridian.
In the late 19th century, the town was a major center for the timber industry. The town was also home to several sawmills and a cotton gin. The town was also home to a number of stores and businesses, including a hotel, a bank, and a post office.
In the early 20th century, the town was home to a number of churches, including the First Baptist Church, the Methodist Church, and the Presbyterian Church. The town also had a number of schools, including the Taylorsville High School, which was established in 1910.
Geography
Taylorsville is located in the northeast corner of Smith County, Mississippi. The town is situated on the banks of the Pearl River, which is a major tributary of the Mississippi River. The town is located approximately 30 miles from the state capital of Jackson.
The town is located in a rural area and is surrounded by forests and farmland. The town is located in a hilly area and is surrounded by rolling hills and valleys. The town is located in a humid subtropical climate zone and experiences hot, humid summers and mild winters.
Economy
The economy of Taylorsville is largely based on agriculture and forestry. The town is home to several farms and ranches, which produce a variety of crops, including corn, soybeans, cotton, and hay. The town is also home to several timber companies, which harvest timber from the surrounding forests.
The town is also home to several small businesses, including restaurants, stores, and service providers. The town is also home to a number of manufacturing companies, which produce a variety of products, including furniture, clothing, and electronics.
Demographics
As of the 2010 census, the population of Taylorsville was 1,000 people. The town is predominantly white, with approximately 95% of the population being white. The town is also home to a small African American population, with approximately 4% of the population being African American. The town is also home to a small Hispanic population, with approximately 1% of the population being Hispanic.
The median household income in Taylorsville is approximately $35,000, which is slightly lower than the state average. The town has a poverty rate of approximately 15%, which is slightly higher than the state average. The town also has a high unemployment rate, with approximately 10% of the population being unemployed.
Common Questions
What is Per Capita Income in Taylorsville?
Per Capita income in Taylorsville is $24,522.
What is the Median Family Income in Taylorsville?
Median Family Income in Taylorsville is $67,321.
What is the Median Household income in Taylorsville?
Median Household Income in Taylorsville is $40,060.
What is Income or Wage Gap in Taylorsville?
Income or Wage Gap in Taylorsville is 1.1%.
Women in Taylorsville earn 98.9 cents for every dollar earned by a man.
What is Inequality or Gini Index in Taylorsville?
Inequality or Gini Index in Taylorsville is 0.49.
What is the Total Population of Taylorsville?
Total Population of Taylorsville is 1,915.
What is the Total Male Population of Taylorsville?
Total Male Population of Taylorsville is 849.
What is the Total Female Population of Taylorsville?
Total Female Population of Taylorsville is 1,066.
What is the Ratio of Males per 100 Females in Taylorsville?
There are 79.64 Males per 100 Females in Taylorsville.
What is the Ratio of Females per 100 Males in Taylorsville?
There are 125.56 Females per 100 Males in Taylorsville.
What is the Median Population Age in Taylorsville?
Median Population Age in Taylorsville is 28.4 Years.
What is the Average Family Size in Taylorsville
Average Family Size in Taylorsville is 3.5 People.
What is the Average Household Size in Taylorsville
Average Household Size in Taylorsville is 2.9 People.
How Large is the Labor Force in Taylorsville?
There are 754 People in the Labor Forcein in Taylorsville.
What is the Percentage of People in the Labor Force in Taylorsville?
47.7% of People are in the Labor Force in Taylorsville.