Fairmont, MN Map & Demographics
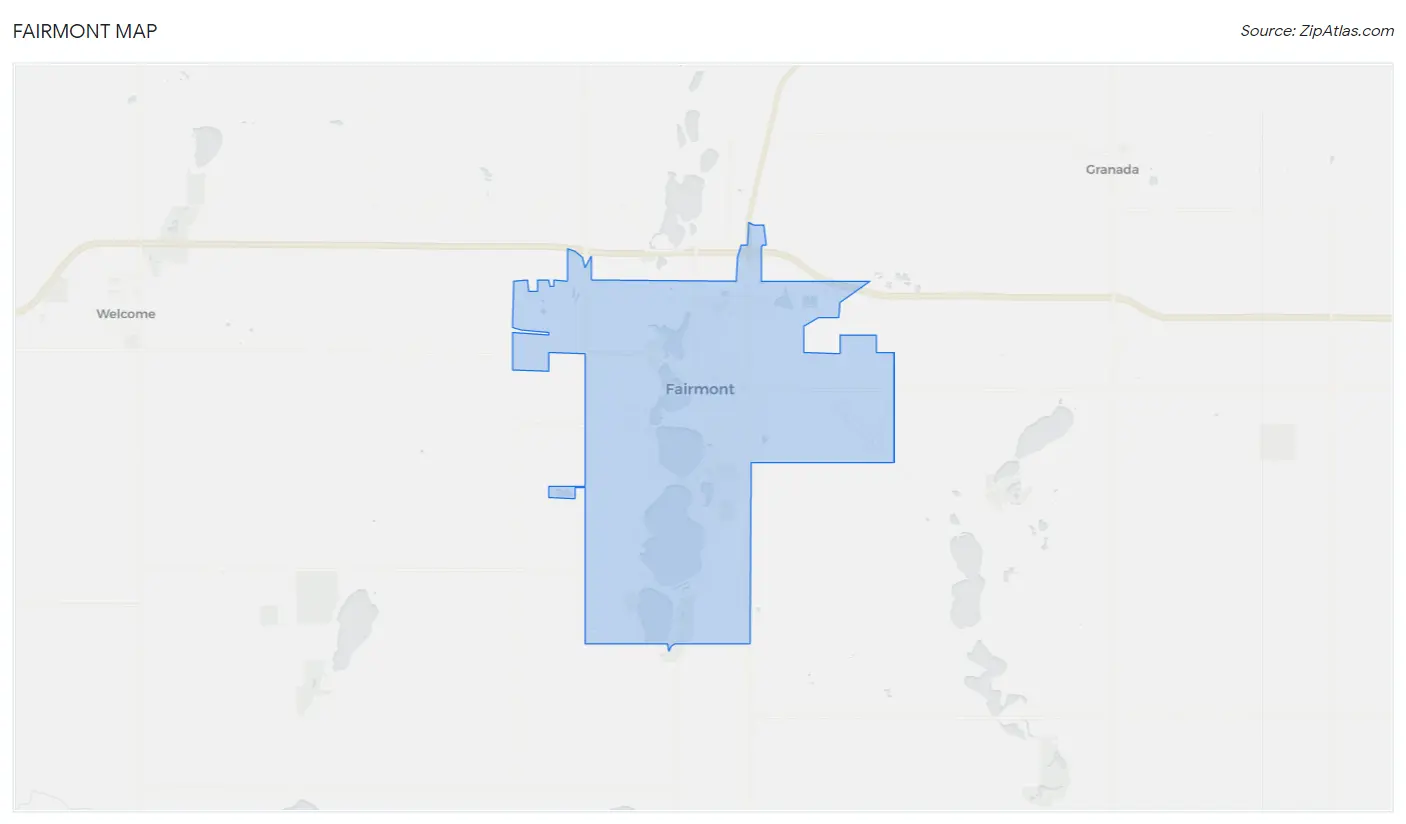
Fairmont Map
Fairmont Overview
$35,114
PER CAPITA INCOME
$83,900
AVG FAMILY INCOME
$56,744
AVG HOUSEHOLD INCOME
21.3%
WAGE / INCOME GAP [ % ]
78.7¢/ $1
WAGE / INCOME GAP [ $ ]
0.43
INEQUALITY / GINI INDEX
10,411
TOTAL POPULATION
5,225
MALE POPULATION
5,186
FEMALE POPULATION
100.75
MALES / 100 FEMALES
99.25
FEMALES / 100 MALES
46.0
MEDIAN AGE
2.8
AVG FAMILY SIZE
2.1
AVG HOUSEHOLD SIZE
5,455
LABOR FORCE [ PEOPLE ]
65.4%
PERCENT IN LABOR FORCE
5.3%
UNEMPLOYMENT RATE
Fairmont Zip Codes
Fairmont Area Codes
Income in Fairmont
Income Overview in Fairmont
Per Capita Income in Fairmont is $35,114, while median incomes of families and households are $83,900 and $56,744 respectively.
| Characteristic | Number | Measure |
| Per Capita Income | 10,411 | $35,114 |
| Median Family Income | 2,710 | $83,900 |
| Mean Family Income | 2,710 | $95,676 |
| Median Household Income | 4,750 | $56,744 |
| Mean Household Income | 4,750 | $75,831 |
| Income Deficit | 2,710 | $0 |
| Wage / Income Gap (%) | 10,411 | 21.28% |
| Wage / Income Gap ($) | 10,411 | 78.72¢ per $1 |
| Gini / Inequality Index | 10,411 | 0.43 |
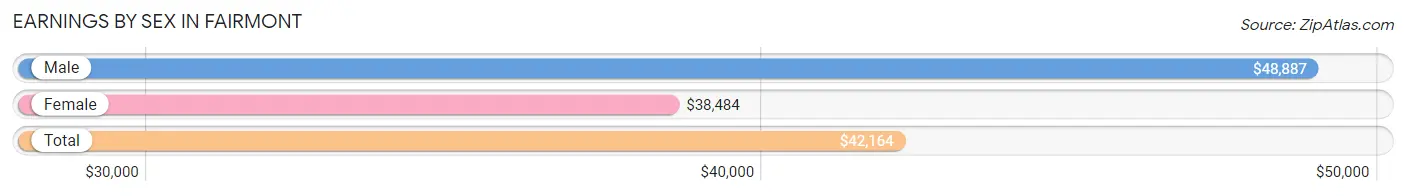
Earnings by Sex in Fairmont
Average Earnings in Fairmont are $42,164, $48,887 for men and $38,484 for women, a difference of 21.3%.
| Sex | Number | Average Earnings |
| Male | 2,924 (52.4%) | $48,887 |
| Female | 2,654 (47.6%) | $38,484 |
| Total | 5,578 (100.0%) | $42,164 |
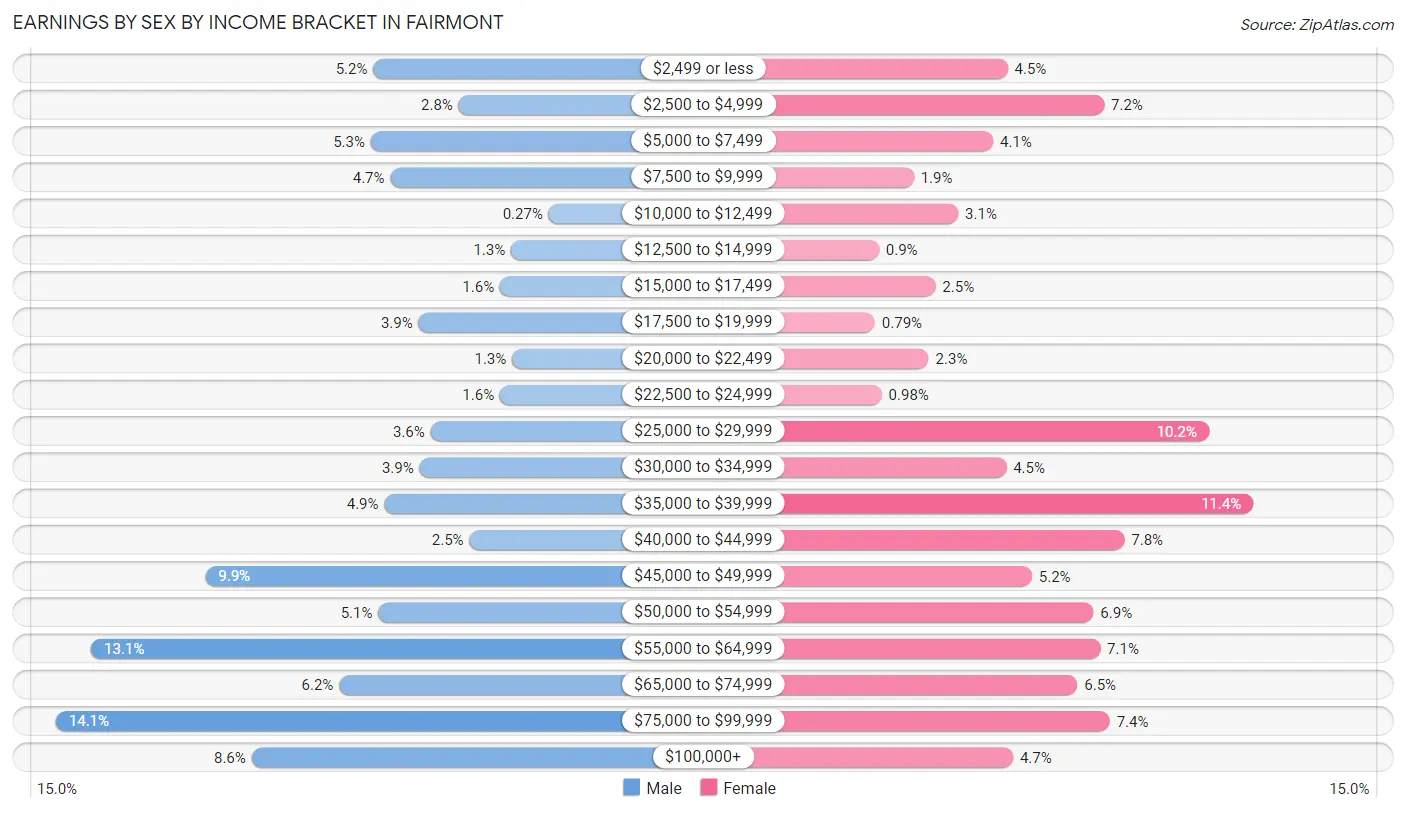
Earnings by Sex by Income Bracket in Fairmont
The most common earnings brackets in Fairmont are $75,000 to $99,999 for men (413 | 14.1%) and $35,000 to $39,999 for women (303 | 11.4%).
| Income | Male | Female |
| $2,499 or less | 152 (5.2%) | 120 (4.5%) |
| $2,500 to $4,999 | 82 (2.8%) | 192 (7.2%) |
| $5,000 to $7,499 | 154 (5.3%) | 109 (4.1%) |
| $7,500 to $9,999 | 138 (4.7%) | 50 (1.9%) |
| $10,000 to $12,499 | 8 (0.3%) | 83 (3.1%) |
| $12,500 to $14,999 | 39 (1.3%) | 24 (0.9%) |
| $15,000 to $17,499 | 48 (1.6%) | 66 (2.5%) |
| $17,500 to $19,999 | 115 (3.9%) | 21 (0.8%) |
| $20,000 to $22,499 | 38 (1.3%) | 61 (2.3%) |
| $22,500 to $24,999 | 48 (1.6%) | 26 (1.0%) |
| $25,000 to $29,999 | 105 (3.6%) | 270 (10.2%) |
| $30,000 to $34,999 | 114 (3.9%) | 119 (4.5%) |
| $35,000 to $39,999 | 143 (4.9%) | 303 (11.4%) |
| $40,000 to $44,999 | 73 (2.5%) | 207 (7.8%) |
| $45,000 to $49,999 | 290 (9.9%) | 138 (5.2%) |
| $50,000 to $54,999 | 148 (5.1%) | 184 (6.9%) |
| $55,000 to $64,999 | 384 (13.1%) | 189 (7.1%) |
| $65,000 to $74,999 | 180 (6.2%) | 172 (6.5%) |
| $75,000 to $99,999 | 413 (14.1%) | 196 (7.4%) |
| $100,000+ | 252 (8.6%) | 124 (4.7%) |
| Total | 2,924 (100.0%) | 2,654 (100.0%) |
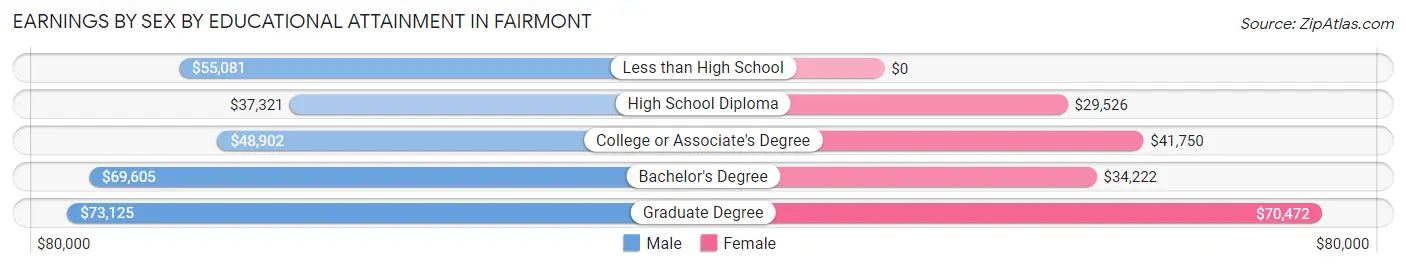
Earnings by Sex by Educational Attainment in Fairmont
Average earnings in Fairmont are $50,702 for men and $39,586 for women, a difference of 21.9%. Men with an educational attainment of graduate degree enjoy the highest average annual earnings of $73,125, while those with high school diploma education earn the least with $37,321. Women with an educational attainment of graduate degree earn the most with the average annual earnings of $70,472, while those with high school diploma education have the smallest earnings of $29,526.
| Educational Attainment | Male Income | Female Income |
| Less than High School | $55,081 | $0 |
| High School Diploma | $37,321 | $29,526 |
| College or Associate's Degree | $48,902 | $41,750 |
| Bachelor's Degree | $69,605 | $34,222 |
| Graduate Degree | $73,125 | $70,472 |
| Total | $50,702 | $39,586 |
Family Income in Fairmont
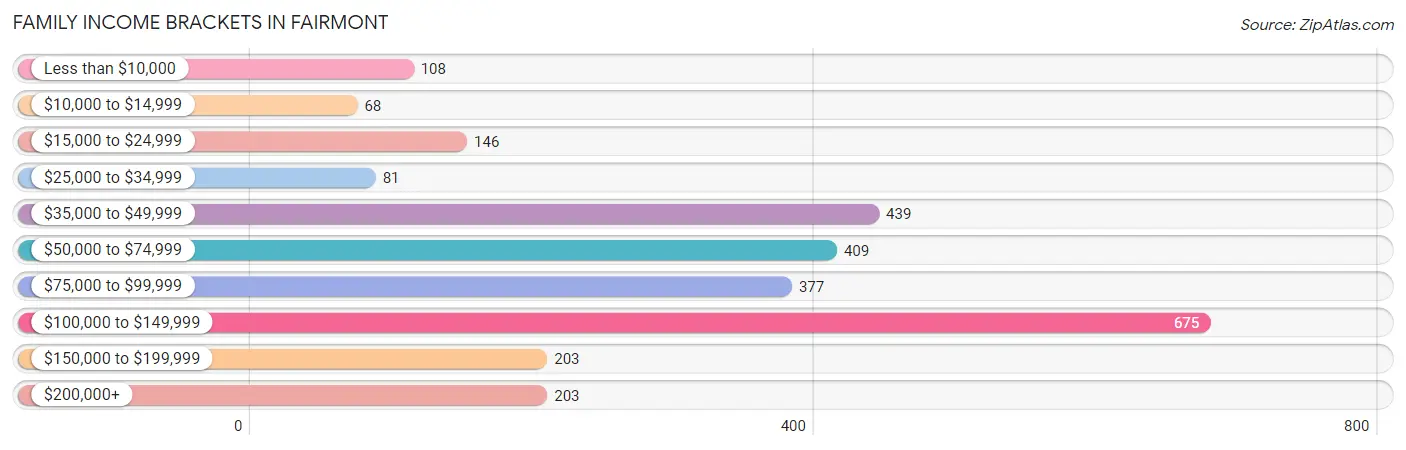
Family Income Brackets in Fairmont
According to the Fairmont family income data, there are 675 families falling into the $100,000 to $149,999 income range, which is the most common income bracket and makes up 24.9% of all families. Conversely, the $10,000 to $14,999 income bracket is the least frequent group with only 68 families (2.5%) belonging to this category.
| Income Bracket | # Families | % Families |
| Less than $10,000 | 108 | 4.0% |
| $10,000 to $14,999 | 68 | 2.5% |
| $15,000 to $24,999 | 146 | 5.4% |
| $25,000 to $34,999 | 81 | 3.0% |
| $35,000 to $49,999 | 439 | 16.2% |
| $50,000 to $74,999 | 409 | 15.1% |
| $75,000 to $99,999 | 377 | 13.9% |
| $100,000 to $149,999 | 675 | 24.9% |
| $150,000 to $199,999 | 203 | 7.5% |
| $200,000+ | 203 | 7.5% |
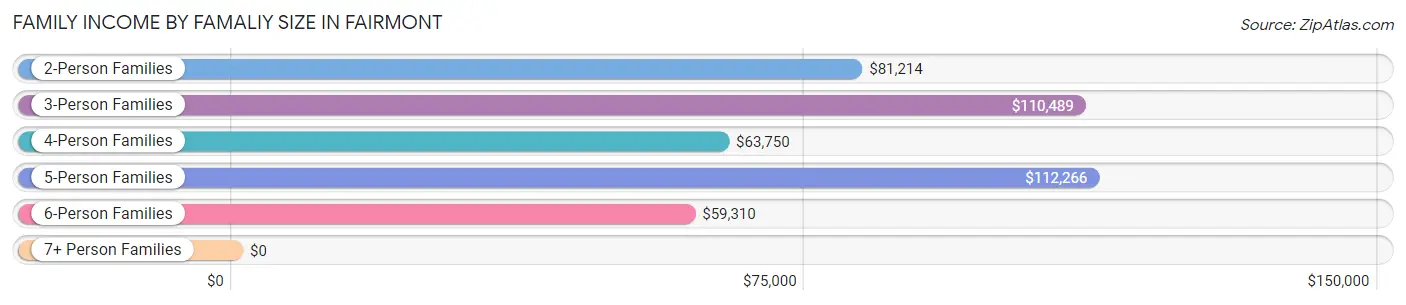
Family Income by Famaliy Size in Fairmont
5-person families (159 | 5.9%) account for the highest median family income in Fairmont with $112,266 per family, while 2-person families (1,524 | 56.2%) have the highest median income of $40,607 per family member.
| Income Bracket | # Families | Median Income |
| 2-Person Families | 1,524 (56.2%) | $81,214 |
| 3-Person Families | 409 (15.1%) | $110,489 |
| 4-Person Families | 482 (17.8%) | $63,750 |
| 5-Person Families | 159 (5.9%) | $112,266 |
| 6-Person Families | 74 (2.7%) | $59,310 |
| 7+ Person Families | 62 (2.3%) | $0 |
| Total | 2,710 (100.0%) | $83,900 |
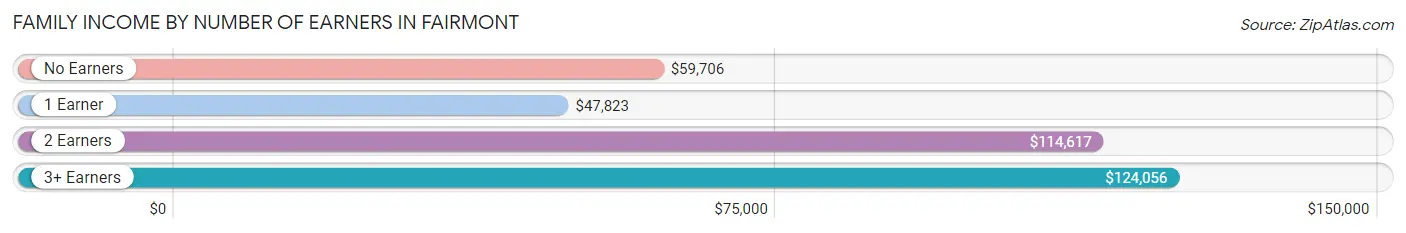
Family Income by Number of Earners in Fairmont
The median family income in Fairmont is $83,900, with families comprising 3+ earners (251) having the highest median family income of $124,056, while families with 1 earner (834) have the lowest median family income of $47,823, accounting for 9.3% and 30.8% of families, respectively.
| Number of Earners | # Families | Median Income |
| No Earners | 398 (14.7%) | $59,706 |
| 1 Earner | 834 (30.8%) | $47,823 |
| 2 Earners | 1,227 (45.3%) | $114,617 |
| 3+ Earners | 251 (9.3%) | $124,056 |
| Total | 2,710 (100.0%) | $83,900 |
Household Income in Fairmont
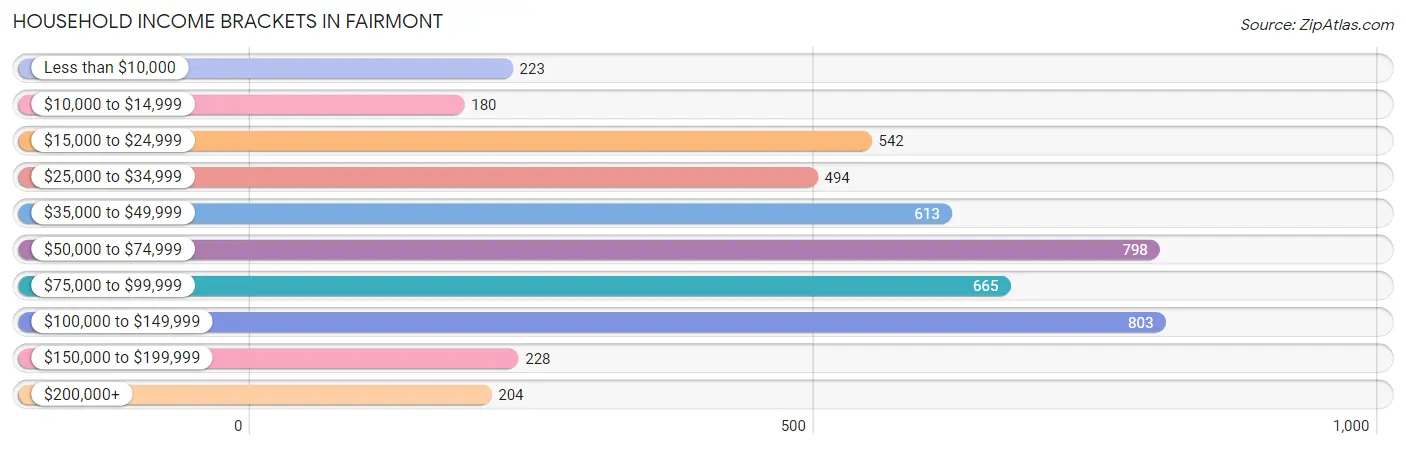
Household Income Brackets in Fairmont
With 803 households falling in the category, the $100,000 to $149,999 income range is the most frequent in Fairmont, accounting for 16.9% of all households. In contrast, only 180 households (3.8%) fall into the $10,000 to $14,999 income bracket, making it the least populous group.
| Income Bracket | # Households | % Households |
| Less than $10,000 | 223 | 4.7% |
| $10,000 to $14,999 | 180 | 3.8% |
| $15,000 to $24,999 | 542 | 11.4% |
| $25,000 to $34,999 | 494 | 10.4% |
| $35,000 to $49,999 | 613 | 12.9% |
| $50,000 to $74,999 | 798 | 16.8% |
| $75,000 to $99,999 | 665 | 14.0% |
| $100,000 to $149,999 | 803 | 16.9% |
| $150,000 to $199,999 | 228 | 4.8% |
| $200,000+ | 204 | 4.3% |
Household Income by Householder Age in Fairmont
The median household income in Fairmont is $56,744, with the highest median household income of $86,339 found in the 45 to 64 years age bracket for the primary householder. A total of 1,701 households (35.8%) fall into this category. Meanwhile, the 15 to 24 years age bracket for the primary householder has the lowest median household income of $0, with 178 households (3.7%) in this group.
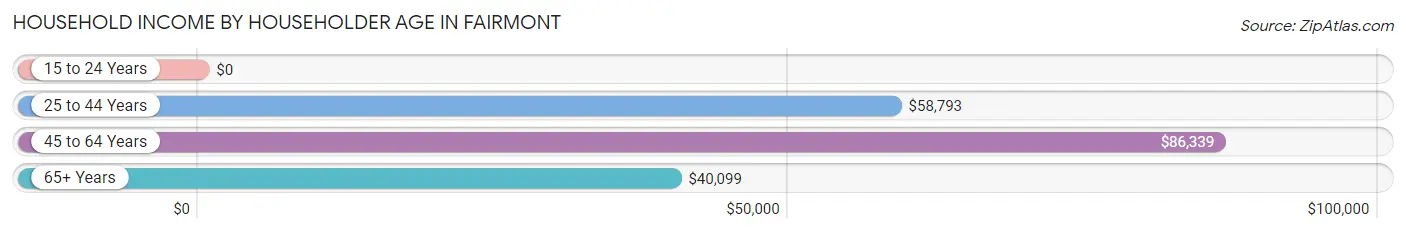
| Income Bracket | # Households | Median Income |
| 15 to 24 Years | 178 (3.7%) | $0 |
| 25 to 44 Years | 1,346 (28.3%) | $58,793 |
| 45 to 64 Years | 1,701 (35.8%) | $86,339 |
| 65+ Years | 1,525 (32.1%) | $40,099 |
| Total | 4,750 (100.0%) | $56,744 |
Poverty in Fairmont
Income Below Poverty by Sex and Age in Fairmont
With 14.4% poverty level for males and 13.5% for females among the residents of Fairmont, 6 to 11 year old males and 5 year old females are the most vulnerable to poverty, with 135 males (39.9%) and 37 females (38.5%) in their respective age groups living below the poverty level.
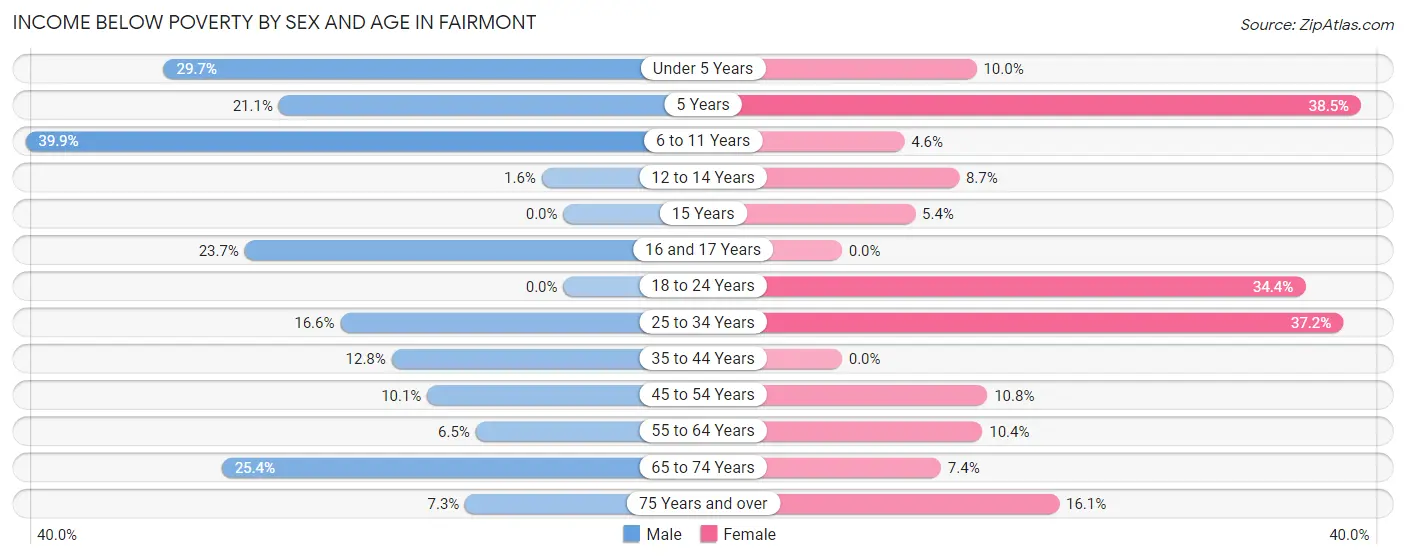
| Age Bracket | Male | Female |
| Under 5 Years | 92 (29.7%) | 25 (10.0%) |
| 5 Years | 15 (21.1%) | 37 (38.5%) |
| 6 to 11 Years | 135 (39.9%) | 16 (4.6%) |
| 12 to 14 Years | 4 (1.6%) | 14 (8.7%) |
| 15 Years | 0 (0.0%) | 8 (5.4%) |
| 16 and 17 Years | 31 (23.7%) | 0 (0.0%) |
| 18 to 24 Years | 0 (0.0%) | 87 (34.4%) |
| 25 to 34 Years | 101 (16.6%) | 192 (37.2%) |
| 35 to 44 Years | 70 (12.8%) | 0 (0.0%) |
| 45 to 54 Years | 66 (10.1%) | 61 (10.8%) |
| 55 to 64 Years | 56 (6.5%) | 97 (10.4%) |
| 65 to 74 Years | 139 (25.4%) | 37 (7.4%) |
| 75 Years and over | 36 (7.3%) | 111 (16.1%) |
| Total | 745 (14.4%) | 685 (13.5%) |
Income Above Poverty by Sex and Age in Fairmont
According to the poverty statistics in Fairmont, males aged 15 years and females aged 16 and 17 years are the age groups that are most secure financially, with 100.0% of males and 100.0% of females in these age groups living above the poverty line.
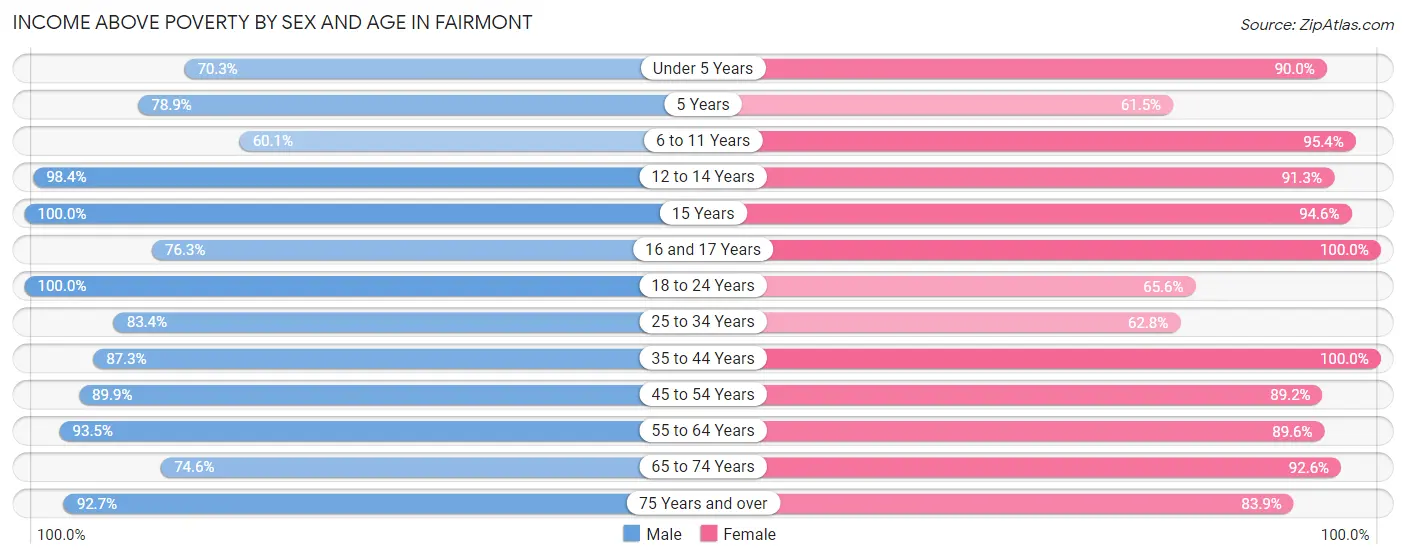
| Age Bracket | Male | Female |
| Under 5 Years | 218 (70.3%) | 225 (90.0%) |
| 5 Years | 56 (78.9%) | 59 (61.5%) |
| 6 to 11 Years | 203 (60.1%) | 329 (95.4%) |
| 12 to 14 Years | 244 (98.4%) | 147 (91.3%) |
| 15 Years | 71 (100.0%) | 139 (94.6%) |
| 16 and 17 Years | 100 (76.3%) | 20 (100.0%) |
| 18 to 24 Years | 297 (100.0%) | 166 (65.6%) |
| 25 to 34 Years | 509 (83.4%) | 324 (62.8%) |
| 35 to 44 Years | 479 (87.3%) | 612 (100.0%) |
| 45 to 54 Years | 587 (89.9%) | 504 (89.2%) |
| 55 to 64 Years | 804 (93.5%) | 833 (89.6%) |
| 65 to 74 Years | 409 (74.6%) | 466 (92.6%) |
| 75 Years and over | 458 (92.7%) | 577 (83.9%) |
| Total | 4,435 (85.6%) | 4,401 (86.5%) |
Income Below Poverty Among Married-Couple Families in Fairmont
The poverty statistics for married-couple families in Fairmont show that 6.8% or 150 of the total 2,202 families live below the poverty line. Families with 3 or 4 children have the highest poverty rate of 20.6%, comprising of 48 families. On the other hand, families with 5 or more children have the lowest poverty rate of 0.0%, which includes 0 families.
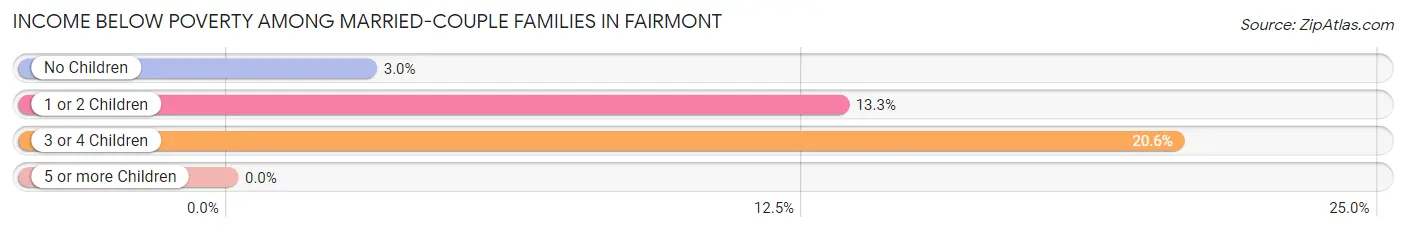
| Children | Above Poverty | Below Poverty |
| No Children | 1,445 (97.0%) | 45 (3.0%) |
| 1 or 2 Children | 372 (86.7%) | 57 (13.3%) |
| 3 or 4 Children | 185 (79.4%) | 48 (20.6%) |
| 5 or more Children | 50 (100.0%) | 0 (0.0%) |
| Total | 2,052 (93.2%) | 150 (6.8%) |
Income Below Poverty Among Single-Parent Households in Fairmont
According to the poverty data in Fairmont, 15.7% or 26 single-father households and 41.2% or 141 single-mother households are living below the poverty line. Among single-father households, those with no children have the highest poverty rate, with 26 households (55.3%) experiencing poverty. Likewise, among single-mother households, those with 5 or more children have the highest poverty rate, with 12 households (100.0%) falling below the poverty line.
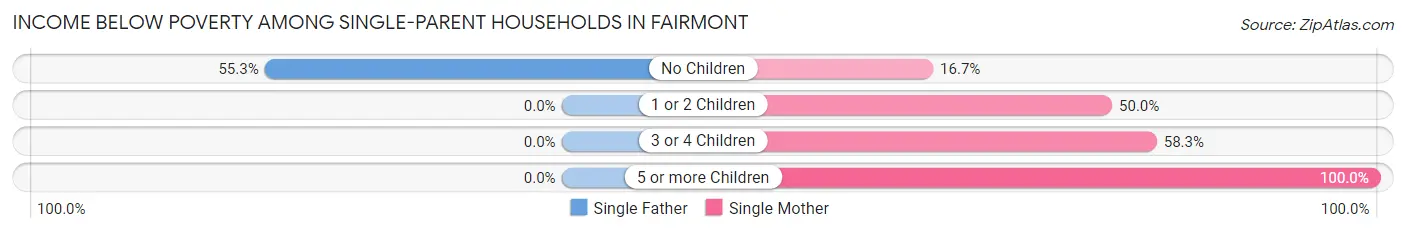
| Children | Single Father | Single Mother |
| No Children | 26 (55.3%) | 21 (16.7%) |
| 1 or 2 Children | 0 (0.0%) | 66 (50.0%) |
| 3 or 4 Children | 0 (0.0%) | 42 (58.3%) |
| 5 or more Children | 0 (0.0%) | 12 (100.0%) |
| Total | 26 (15.7%) | 141 (41.2%) |
Income Below Poverty Among Married-Couple vs Single-Parent Households in Fairmont
The poverty data for Fairmont shows that 150 of the married-couple family households (6.8%) and 167 of the single-parent households (32.9%) are living below the poverty level. Within the married-couple family households, those with 3 or 4 children have the highest poverty rate, with 48 households (20.6%) falling below the poverty line. Among the single-parent households, those with 5 or more children have the highest poverty rate, with 12 household (100.0%) living below poverty.
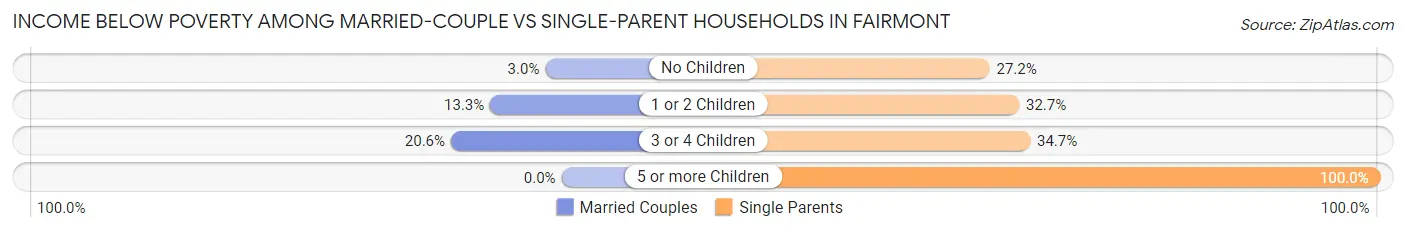
| Children | Married-Couple Families | Single-Parent Households |
| No Children | 45 (3.0%) | 47 (27.2%) |
| 1 or 2 Children | 57 (13.3%) | 66 (32.7%) |
| 3 or 4 Children | 48 (20.6%) | 42 (34.7%) |
| 5 or more Children | 0 (0.0%) | 12 (100.0%) |
| Total | 150 (6.8%) | 167 (32.9%) |
Race in Fairmont
The most populous races in Fairmont are White / Caucasian (9,710 | 93.3%), Hispanic or Latino (936 | 9.0%), and Two or more Races (288 | 2.8%).
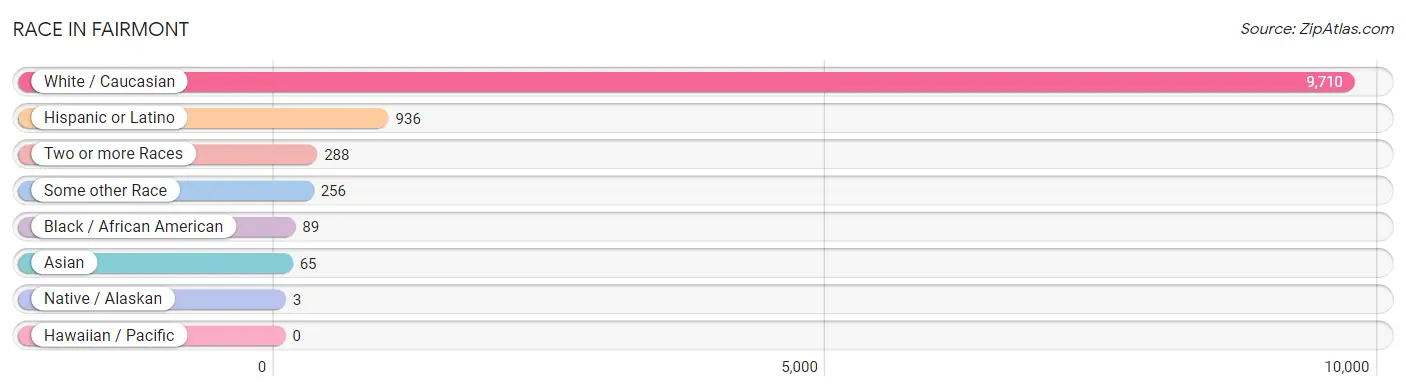
| Race | # Population | % Population |
| Asian | 65 | 0.6% |
| Black / African American | 89 | 0.9% |
| Hawaiian / Pacific | 0 | 0.0% |
| Hispanic or Latino | 936 | 9.0% |
| Native / Alaskan | 3 | 0.0% |
| White / Caucasian | 9,710 | 93.3% |
| Two or more Races | 288 | 2.8% |
| Some other Race | 256 | 2.5% |
| Total | 10,411 | 100.0% |
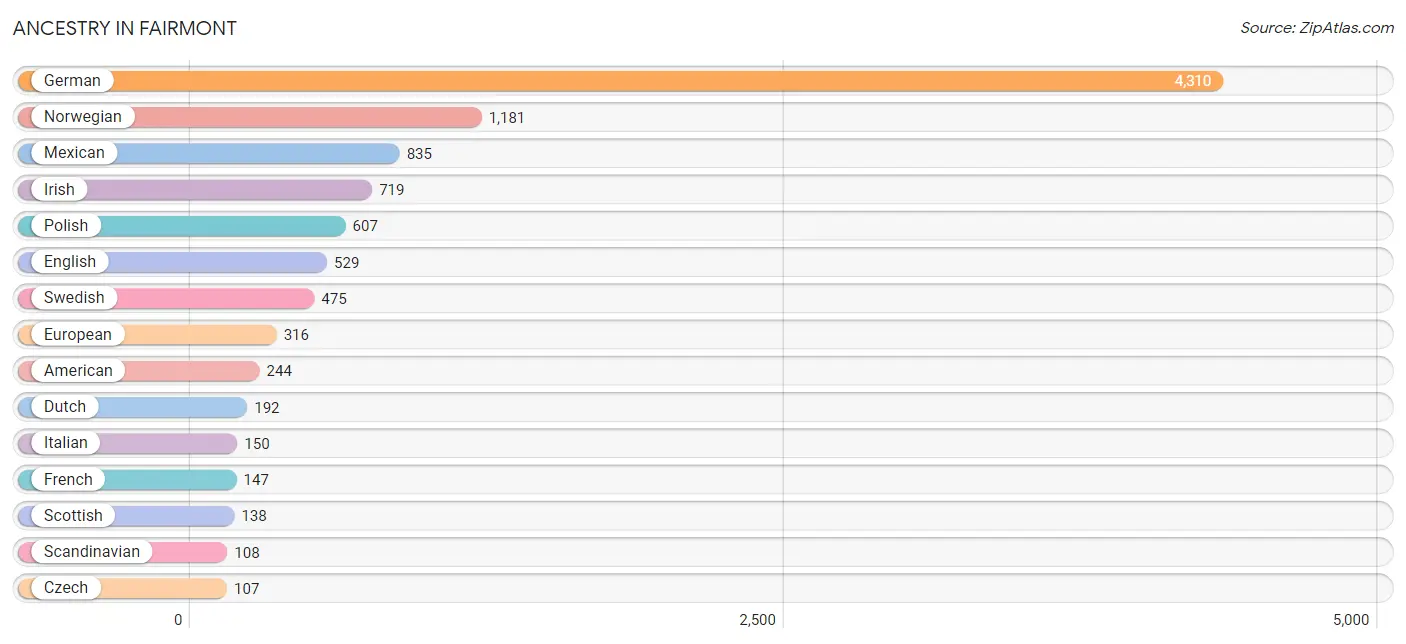
Ancestry in Fairmont
The most populous ancestries reported in Fairmont are German (4,310 | 41.4%), Norwegian (1,181 | 11.3%), Mexican (835 | 8.0%), Irish (719 | 6.9%), and Polish (607 | 5.8%), together accounting for 73.5% of all Fairmont residents.
| Ancestry | # Population | % Population |
| American | 244 | 2.3% |
| Basque | 13 | 0.1% |
| Belgian | 46 | 0.4% |
| Brazilian | 42 | 0.4% |
| Burmese | 17 | 0.2% |
| Central American | 17 | 0.2% |
| Cherokee | 34 | 0.3% |
| Croatian | 17 | 0.2% |
| Czech | 107 | 1.0% |
| Danish | 84 | 0.8% |
| Dutch | 192 | 1.8% |
| English | 529 | 5.1% |
| European | 316 | 3.0% |
| Finnish | 20 | 0.2% |
| French | 147 | 1.4% |
| French Canadian | 62 | 0.6% |
| German | 4,310 | 41.4% |
| Greek | 15 | 0.1% |
| Indian (Asian) | 51 | 0.5% |
| Irish | 719 | 6.9% |
| Italian | 150 | 1.4% |
| Korean | 30 | 0.3% |
| Latvian | 16 | 0.2% |
| Mexican | 835 | 8.0% |
| Native Hawaiian | 34 | 0.3% |
| Nigerian | 45 | 0.4% |
| Norwegian | 1,181 | 11.3% |
| Polish | 607 | 5.8% |
| Portuguese | 11 | 0.1% |
| Russian | 12 | 0.1% |
| Salvadoran | 17 | 0.2% |
| Scandinavian | 108 | 1.0% |
| Scotch-Irish | 44 | 0.4% |
| Scottish | 138 | 1.3% |
| Sioux | 11 | 0.1% |
| Slovak | 6 | 0.1% |
| Somali | 3 | 0.0% |
| Spanish | 40 | 0.4% |
| Subsaharan African | 48 | 0.5% |
| Swedish | 475 | 4.6% |
| Ukrainian | 17 | 0.2% |
| Welsh | 27 | 0.3% | View All 42 Rows |
Immigrants in Fairmont
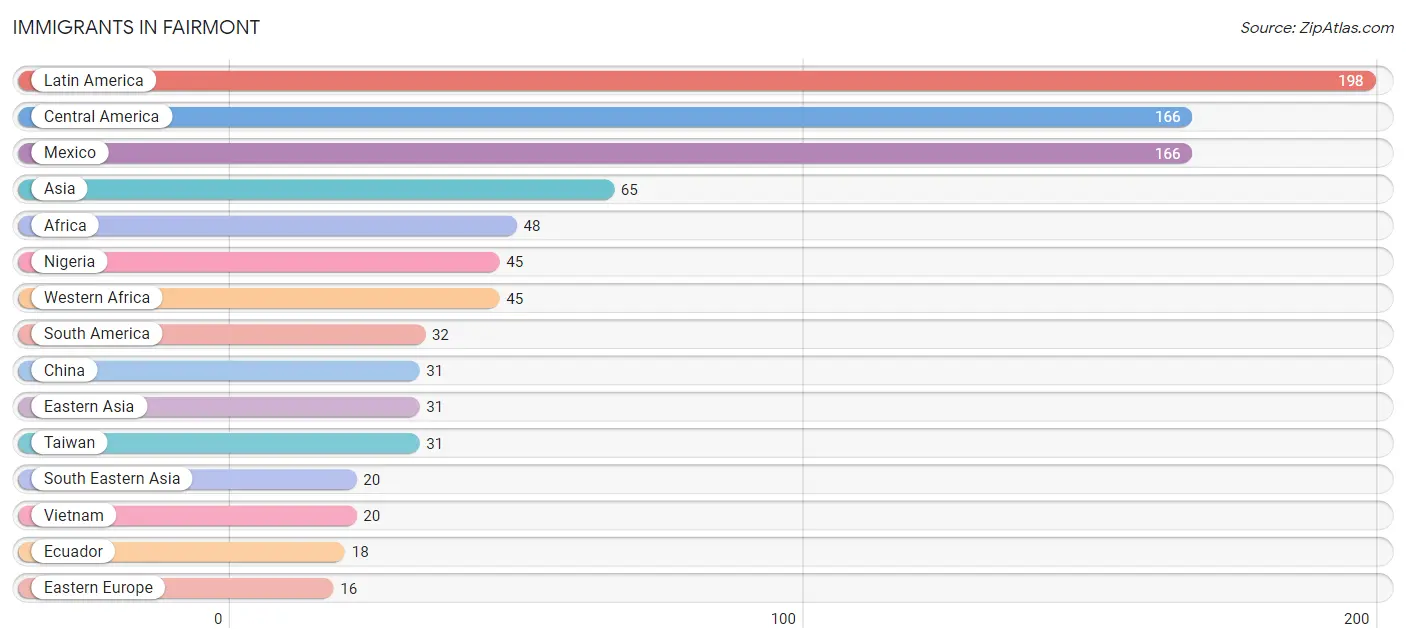
The most numerous immigrant groups reported in Fairmont came from Latin America (198 | 1.9%), Central America (166 | 1.6%), Mexico (166 | 1.6%), Asia (65 | 0.6%), and Africa (48 | 0.5%), together accounting for 6.2% of all Fairmont residents.
| Immigration Origin | # Population | % Population |
| Africa | 48 | 0.5% |
| Asia | 65 | 0.6% |
| Brazil | 14 | 0.1% |
| Central America | 166 | 1.6% |
| China | 31 | 0.3% |
| Eastern Africa | 3 | 0.0% |
| Eastern Asia | 31 | 0.3% |
| Eastern Europe | 16 | 0.2% |
| Ecuador | 18 | 0.2% |
| Europe | 16 | 0.2% |
| India | 14 | 0.1% |
| Latin America | 198 | 1.9% |
| Latvia | 16 | 0.2% |
| Mexico | 166 | 1.6% |
| Nigeria | 45 | 0.4% |
| Somalia | 3 | 0.0% |
| South America | 32 | 0.3% |
| South Central Asia | 14 | 0.1% |
| South Eastern Asia | 20 | 0.2% |
| Taiwan | 31 | 0.3% |
| Vietnam | 20 | 0.2% |
| Western Africa | 45 | 0.4% | View All 22 Rows |
Sex and Age in Fairmont
Sex and Age in Fairmont
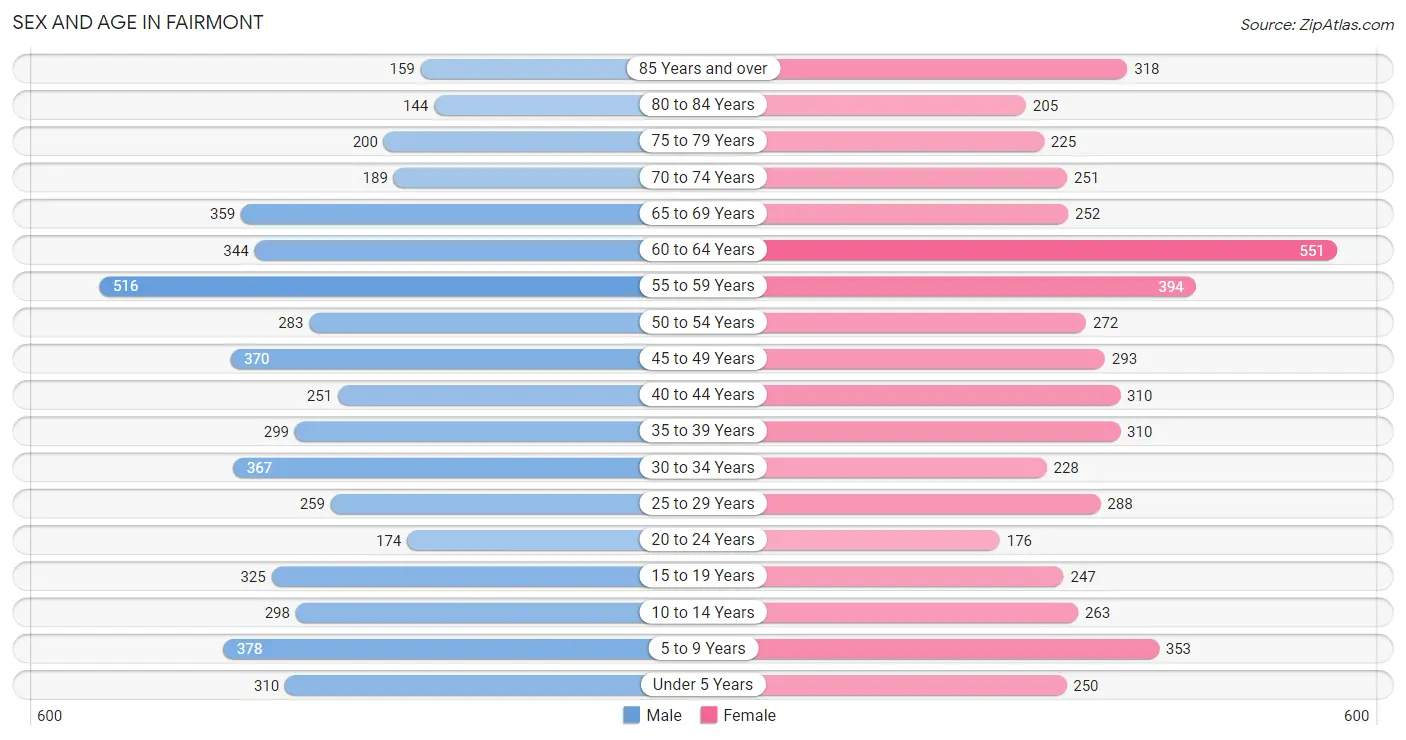
The most populous age groups in Fairmont are 55 to 59 Years (516 | 9.9%) for men and 60 to 64 Years (551 | 10.6%) for women.
| Age Bracket | Male | Female |
| Under 5 Years | 310 (5.9%) | 250 (4.8%) |
| 5 to 9 Years | 378 (7.2%) | 353 (6.8%) |
| 10 to 14 Years | 298 (5.7%) | 263 (5.1%) |
| 15 to 19 Years | 325 (6.2%) | 247 (4.8%) |
| 20 to 24 Years | 174 (3.3%) | 176 (3.4%) |
| 25 to 29 Years | 259 (5.0%) | 288 (5.6%) |
| 30 to 34 Years | 367 (7.0%) | 228 (4.4%) |
| 35 to 39 Years | 299 (5.7%) | 310 (6.0%) |
| 40 to 44 Years | 251 (4.8%) | 310 (6.0%) |
| 45 to 49 Years | 370 (7.1%) | 293 (5.7%) |
| 50 to 54 Years | 283 (5.4%) | 272 (5.2%) |
| 55 to 59 Years | 516 (9.9%) | 394 (7.6%) |
| 60 to 64 Years | 344 (6.6%) | 551 (10.6%) |
| 65 to 69 Years | 359 (6.9%) | 252 (4.9%) |
| 70 to 74 Years | 189 (3.6%) | 251 (4.8%) |
| 75 to 79 Years | 200 (3.8%) | 225 (4.3%) |
| 80 to 84 Years | 144 (2.8%) | 205 (4.0%) |
| 85 Years and over | 159 (3.0%) | 318 (6.1%) |
| Total | 5,225 (100.0%) | 5,186 (100.0%) |
Families and Households in Fairmont
Median Family Size in Fairmont
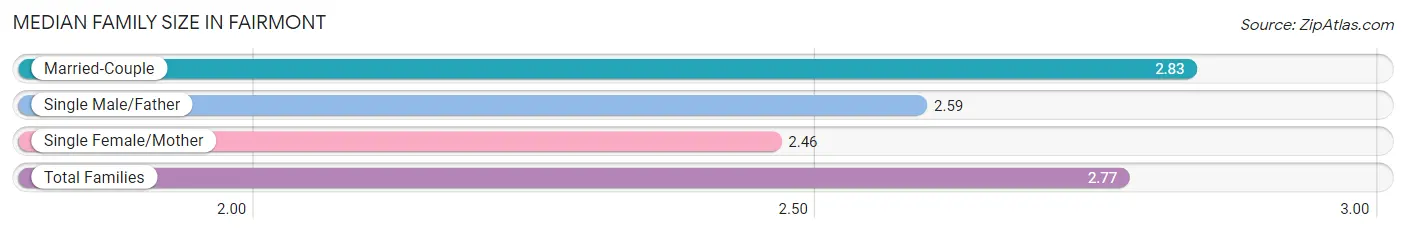
The median family size in Fairmont is 2.77 persons per family, with married-couple families (2,202 | 81.2%) accounting for the largest median family size of 2.83 persons per family. On the other hand, single female/mother families (342 | 12.6%) represent the smallest median family size with 2.46 persons per family.
| Family Type | # Families | Family Size |
| Married-Couple | 2,202 (81.2%) | 2.83 |
| Single Male/Father | 166 (6.1%) | 2.59 |
| Single Female/Mother | 342 (12.6%) | 2.46 |
| Total Families | 2,710 (100.0%) | 2.77 |
Median Household Size in Fairmont
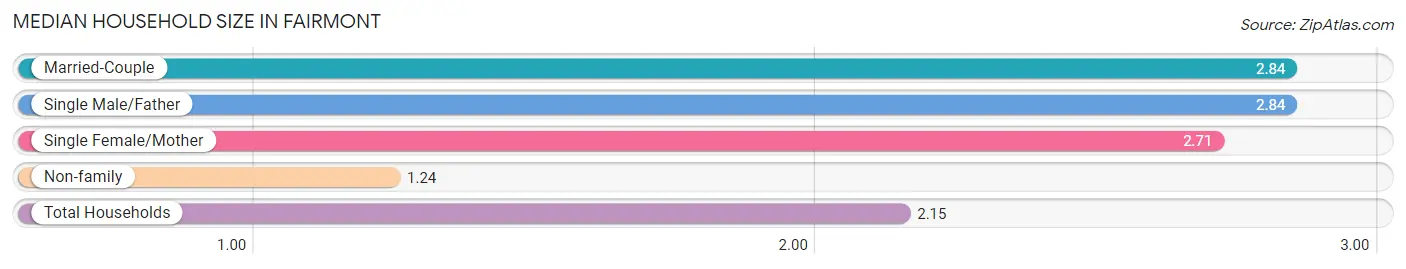
The median household size in Fairmont is 2.15 persons per household, with married-couple households (2,202 | 46.4%) accounting for the largest median household size of 2.84 persons per household. non-family households (2,040 | 42.9%) represent the smallest median household size with 1.24 persons per household.
| Household Type | # Households | Household Size |
| Married-Couple | 2,202 (46.4%) | 2.84 |
| Single Male/Father | 166 (3.5%) | 2.84 |
| Single Female/Mother | 342 (7.2%) | 2.71 |
| Non-family | 2,040 (42.9%) | 1.24 |
| Total Households | 4,750 (100.0%) | 2.15 |
Household Size by Marriage Status in Fairmont
Out of a total of 4,750 households in Fairmont, 2,710 (57.1%) are family households, while 2,040 (42.9%) are nonfamily households. The most numerous type of family households are 2-person households, comprising 1,431, and the most common type of nonfamily households are 1-person households, comprising 1,476.
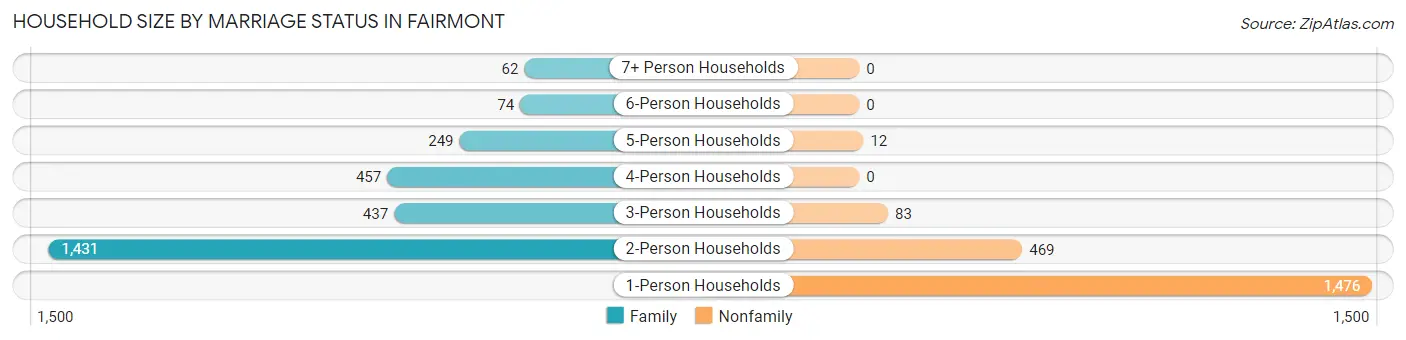
| Household Size | Family Households | Nonfamily Households |
| 1-Person Households | - | 1,476 (31.1%) |
| 2-Person Households | 1,431 (30.1%) | 469 (9.9%) |
| 3-Person Households | 437 (9.2%) | 83 (1.8%) |
| 4-Person Households | 457 (9.6%) | 0 (0.0%) |
| 5-Person Households | 249 (5.2%) | 12 (0.3%) |
| 6-Person Households | 74 (1.6%) | 0 (0.0%) |
| 7+ Person Households | 62 (1.3%) | 0 (0.0%) |
| Total | 2,710 (57.1%) | 2,040 (42.9%) |
Female Fertility in Fairmont
Fertility by Age in Fairmont
Average fertility rate in Fairmont is 58.0 births per 1,000 women. Women in the age bracket of 20 to 34 years have the highest fertility rate with 166.0 births per 1,000 women. Women in the age bracket of 20 to 34 years acount for 100.0% of all women with births.
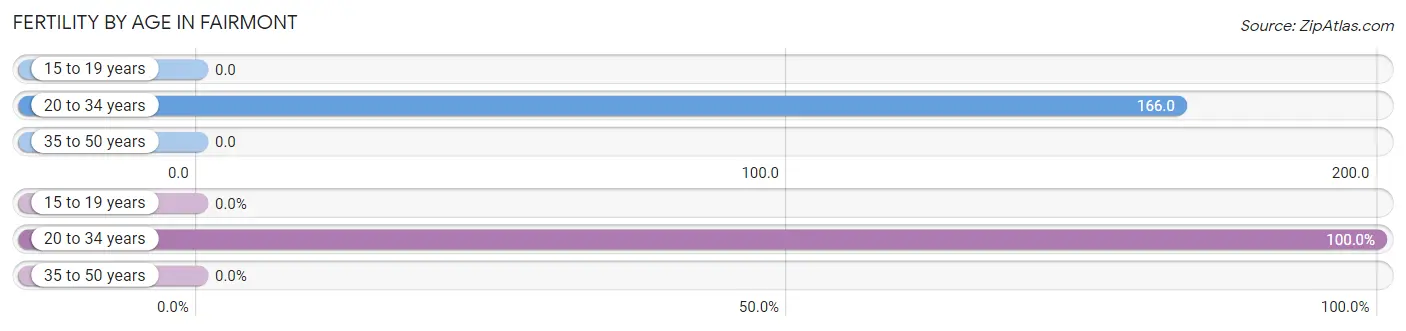
| Age Bracket | Women with Births | Births / 1,000 Women |
| 15 to 19 years | 0 (0.0%) | 0.0 |
| 20 to 34 years | 115 (100.0%) | 166.0 |
| 35 to 50 years | 0 (0.0%) | 0.0 |
| Total | 115 (100.0%) | 58.0 |
Fertility by Age by Marriage Status in Fairmont
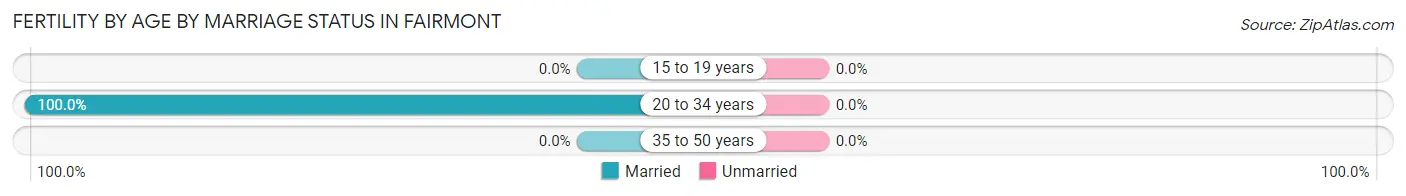
| Age Bracket | Married | Unmarried |
| 15 to 19 years | 0 (0.0%) | 0 (0.0%) |
| 20 to 34 years | 115 (100.0%) | 0 (0.0%) |
| 35 to 50 years | 0 (0.0%) | 0 (0.0%) |
| Total | 115 (100.0%) | 0 (0.0%) |
Fertility by Education in Fairmont
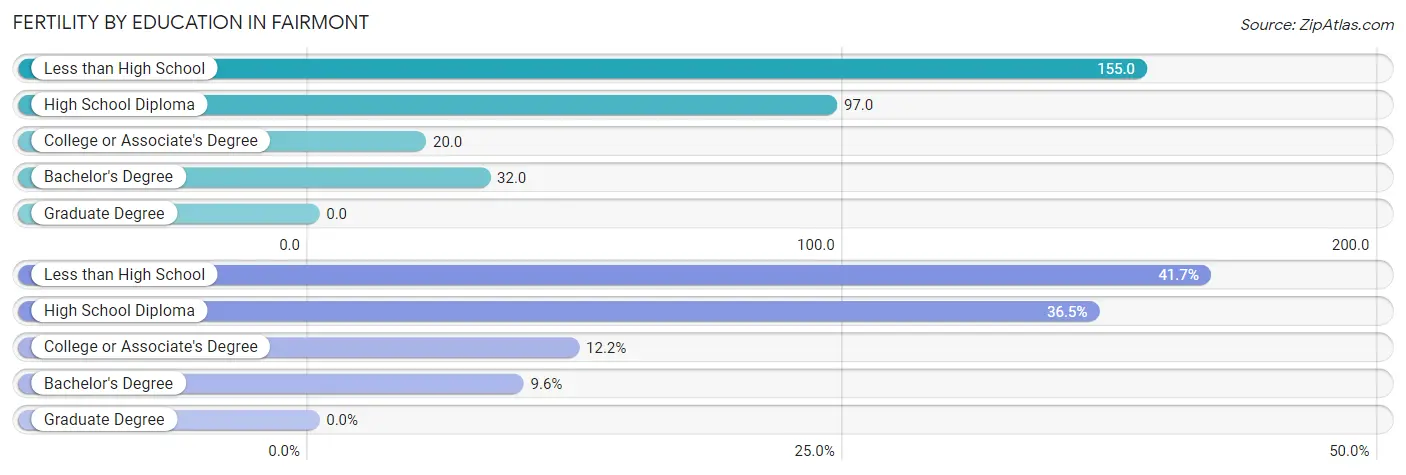
| Educational Attainment | Women with Births | Births / 1,000 Women |
| Less than High School | 48 (41.7%) | 155.0 |
| High School Diploma | 42 (36.5%) | 97.0 |
| College or Associate's Degree | 14 (12.2%) | 20.0 |
| Bachelor's Degree | 11 (9.6%) | 32.0 |
| Graduate Degree | 0 (0.0%) | 0.0 |
| Total | 115 (100.0%) | 58.0 |
Fertility by Education by Marriage Status in Fairmont
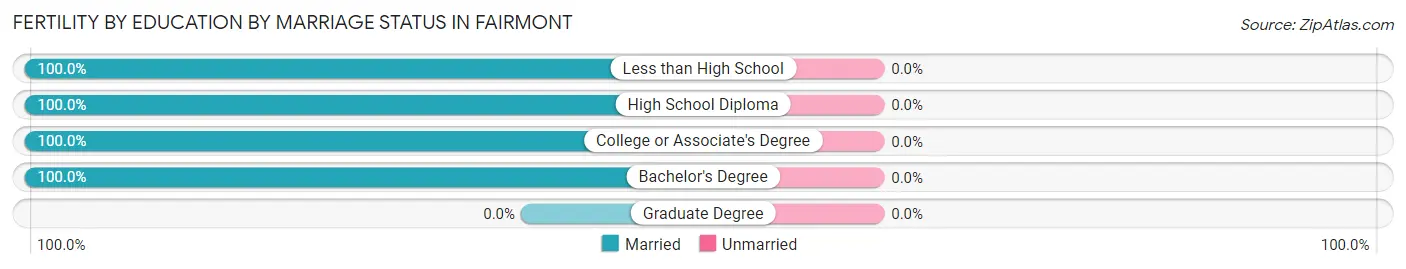
| Educational Attainment | Married | Unmarried |
| Less than High School | 48 (100.0%) | 0 (0.0%) |
| High School Diploma | 42 (100.0%) | 0 (0.0%) |
| College or Associate's Degree | 14 (100.0%) | 0 (0.0%) |
| Bachelor's Degree | 11 (100.0%) | 0 (0.0%) |
| Graduate Degree | 0 (0.0%) | 0 (0.0%) |
| Total | 115 (100.0%) | 0 (0.0%) |
Employment Characteristics in Fairmont
Employment by Class of Employer in Fairmont
Among the 5,004 employed individuals in Fairmont, private company employees (3,389 | 67.7%), not-for-profit organizations (672 | 13.4%), and local government employees (460 | 9.2%) make up the most common classes of employment.
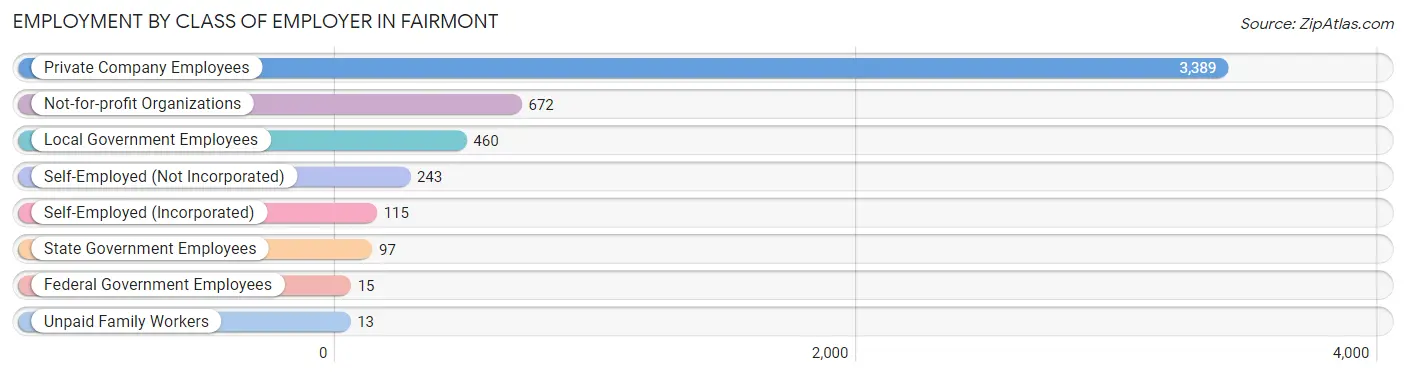
| Employer Class | # Employees | % Employees |
| Private Company Employees | 3,389 | 67.7% |
| Self-Employed (Incorporated) | 115 | 2.3% |
| Self-Employed (Not Incorporated) | 243 | 4.9% |
| Not-for-profit Organizations | 672 | 13.4% |
| Local Government Employees | 460 | 9.2% |
| State Government Employees | 97 | 1.9% |
| Federal Government Employees | 15 | 0.3% |
| Unpaid Family Workers | 13 | 0.3% |
| Total | 5,004 | 100.0% |
Employment Status by Age in Fairmont
According to the labor force statistics for Fairmont, out of the total population over 16 years of age (8,341), 65.4% or 5,455 individuals are in the labor force, with 5.3% or 289 of them unemployed. The age group with the highest labor force participation rate is 25 to 29 years, with 97.4% or 533 individuals in the labor force. Within the labor force, the 30 to 34 years age range has the highest percentage of unemployed individuals, with 12.1% or 65 of them being unemployed.
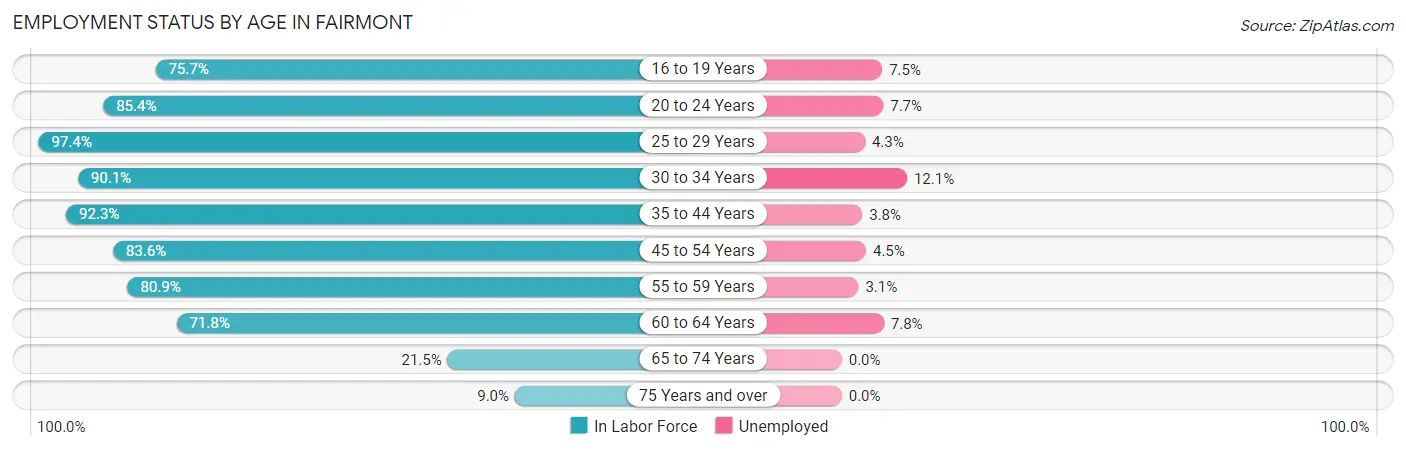
| Age Bracket | In Labor Force | Unemployed |
| 16 to 19 Years | 268 (75.7%) | 20 (7.5%) |
| 20 to 24 Years | 299 (85.4%) | 23 (7.7%) |
| 25 to 29 Years | 533 (97.4%) | 23 (4.3%) |
| 30 to 34 Years | 536 (90.1%) | 65 (12.1%) |
| 35 to 44 Years | 1,080 (92.3%) | 41 (3.8%) |
| 45 to 54 Years | 1,018 (83.6%) | 46 (4.5%) |
| 55 to 59 Years | 736 (80.9%) | 23 (3.1%) |
| 60 to 64 Years | 643 (71.8%) | 50 (7.8%) |
| 65 to 74 Years | 226 (21.5%) | 0 (0.0%) |
| 75 Years and over | 113 (9.0%) | 0 (0.0%) |
| Total | 5,455 (65.4%) | 289 (5.3%) |
Employment Status by Educational Attainment in Fairmont
According to labor force statistics for Fairmont, 85.2% of individuals (4,545) out of the total population between 25 and 64 years of age (5,335) are in the labor force, with 5.5% or 250 of them being unemployed. The group with the highest labor force participation rate are those with the educational attainment of bachelor's degree or higher, with 93.9% or 1,232 individuals in the labor force. Within the labor force, individuals with high school diploma education have the highest percentage of unemployment, with 12.3% or 161 of them being unemployed.
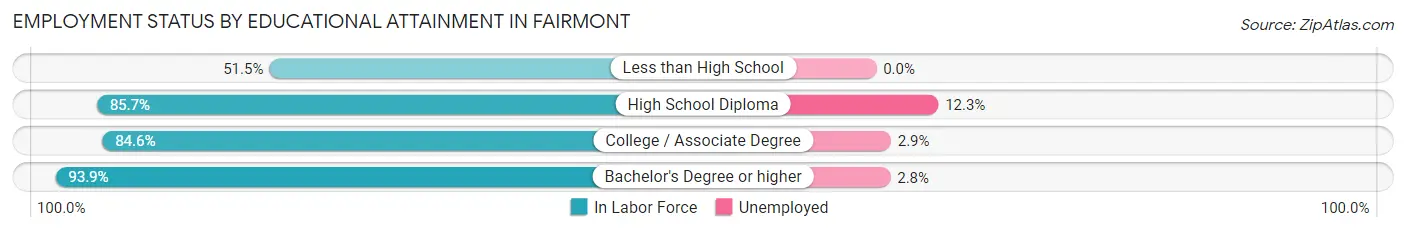
| Educational Attainment | In Labor Force | Unemployed |
| Less than High School | 167 (51.5%) | 0 (0.0%) |
| High School Diploma | 1,313 (85.7%) | 188 (12.3%) |
| College / Associate Degree | 1,833 (84.6%) | 63 (2.9%) |
| Bachelor's Degree or higher | 1,232 (93.9%) | 37 (2.8%) |
| Total | 4,545 (85.2%) | 293 (5.5%) |
Employment Occupations by Sex in Fairmont
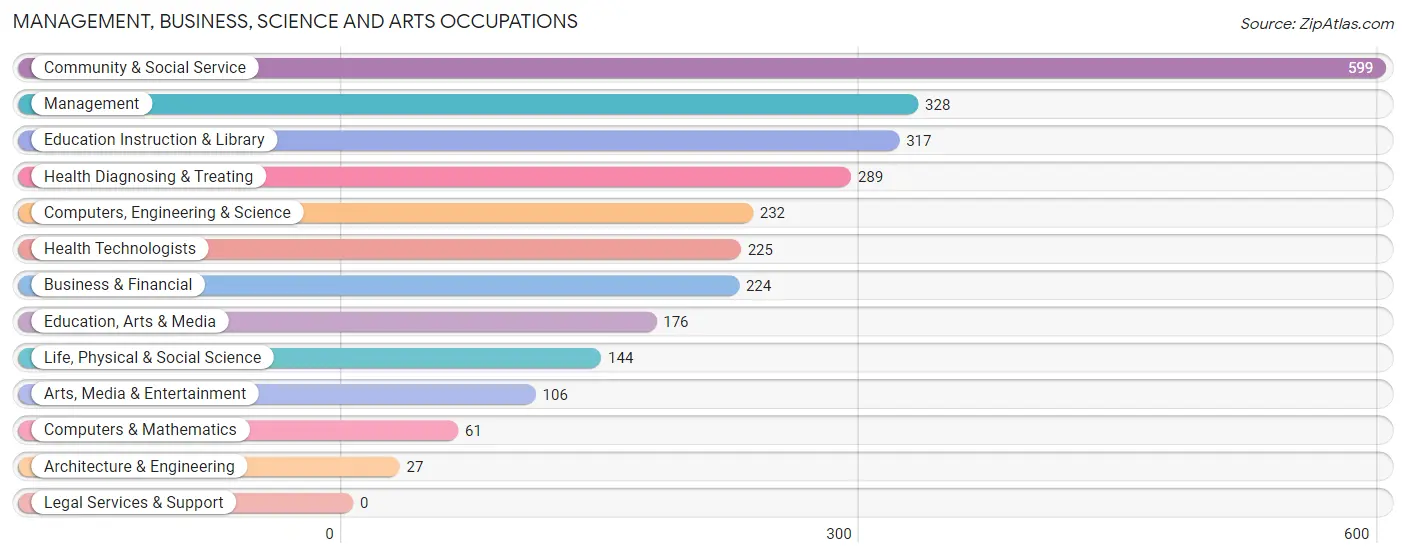
Management, Business, Science and Arts Occupations
The most common Management, Business, Science and Arts occupations in Fairmont are Community & Social Service (599 | 11.6%), Management (328 | 6.4%), Education Instruction & Library (317 | 6.1%), Health Diagnosing & Treating (289 | 5.6%), and Computers, Engineering & Science (232 | 4.5%).
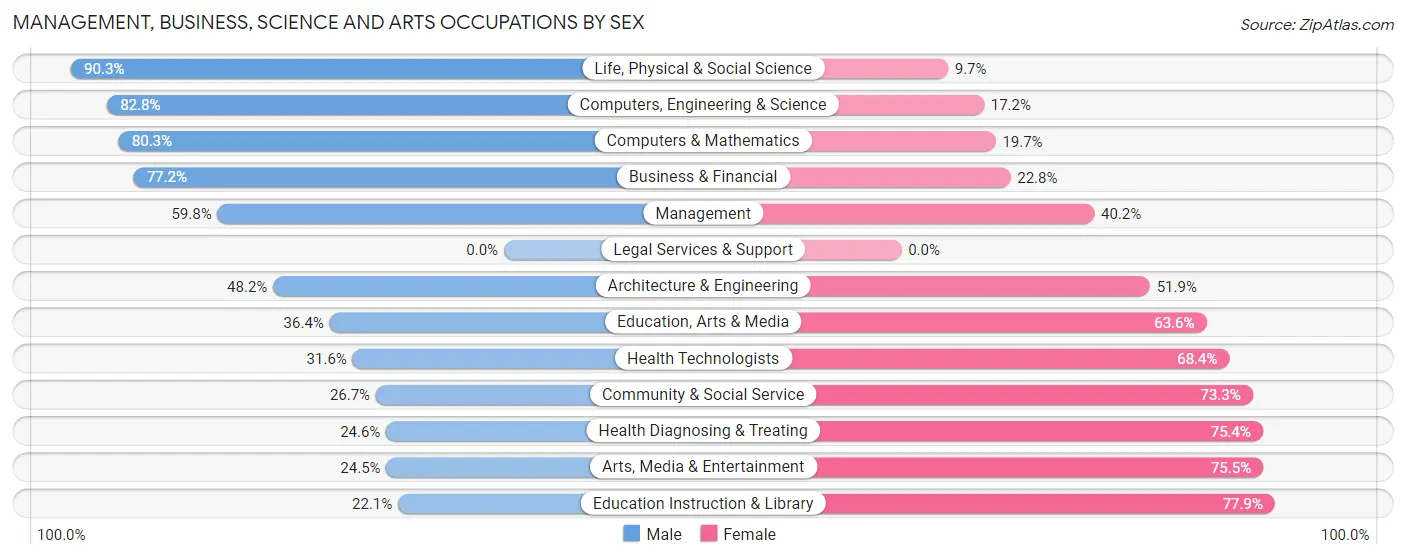
Management, Business, Science and Arts Occupations by Sex
Within the Management, Business, Science and Arts occupations in Fairmont, the most male-oriented occupations are Life, Physical & Social Science (90.3%), Computers, Engineering & Science (82.8%), and Computers & Mathematics (80.3%), while the most female-oriented occupations are Education Instruction & Library (77.9%), Arts, Media & Entertainment (75.5%), and Health Diagnosing & Treating (75.4%).
| Occupation | Male | Female |
| Management | 196 (59.8%) | 132 (40.2%) |
| Business & Financial | 173 (77.2%) | 51 (22.8%) |
| Computers, Engineering & Science | 192 (82.8%) | 40 (17.2%) |
| Computers & Mathematics | 49 (80.3%) | 12 (19.7%) |
| Architecture & Engineering | 13 (48.1%) | 14 (51.8%) |
| Life, Physical & Social Science | 130 (90.3%) | 14 (9.7%) |
| Community & Social Service | 160 (26.7%) | 439 (73.3%) |
| Education, Arts & Media | 64 (36.4%) | 112 (63.6%) |
| Legal Services & Support | 0 (0.0%) | 0 (0.0%) |
| Education Instruction & Library | 70 (22.1%) | 247 (77.9%) |
| Arts, Media & Entertainment | 26 (24.5%) | 80 (75.5%) |
| Health Diagnosing & Treating | 71 (24.6%) | 218 (75.4%) |
| Health Technologists | 71 (31.6%) | 154 (68.4%) |
| Total (Category) | 792 (47.4%) | 880 (52.6%) |
| Total (Overall) | 2,603 (50.4%) | 2,558 (49.6%) |
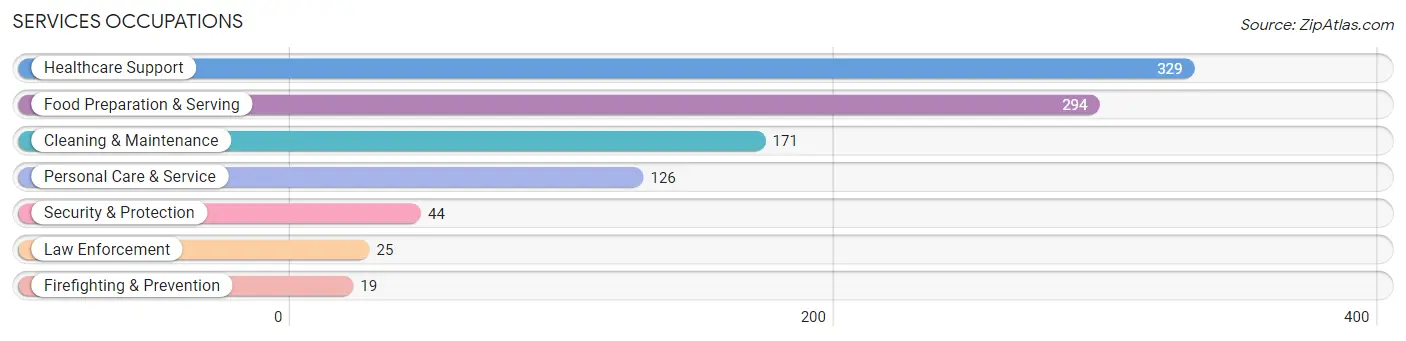
Services Occupations
The most common Services occupations in Fairmont are Healthcare Support (329 | 6.4%), Food Preparation & Serving (294 | 5.7%), Cleaning & Maintenance (171 | 3.3%), Personal Care & Service (126 | 2.4%), and Security & Protection (44 | 0.9%).
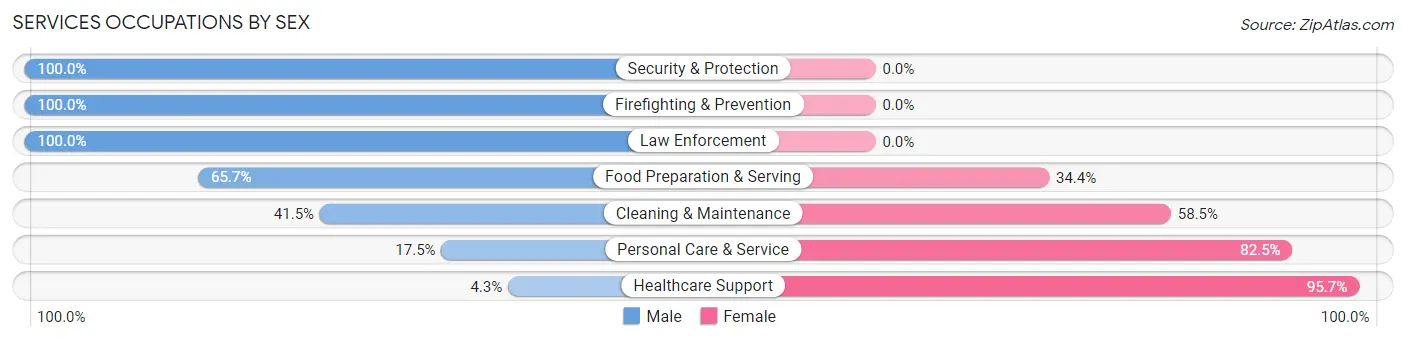
Services Occupations by Sex
Within the Services occupations in Fairmont, the most male-oriented occupations are Security & Protection (100.0%), Firefighting & Prevention (100.0%), and Law Enforcement (100.0%), while the most female-oriented occupations are Healthcare Support (95.7%), Personal Care & Service (82.5%), and Cleaning & Maintenance (58.5%).
| Occupation | Male | Female |
| Healthcare Support | 14 (4.3%) | 315 (95.7%) |
| Security & Protection | 44 (100.0%) | 0 (0.0%) |
| Firefighting & Prevention | 19 (100.0%) | 0 (0.0%) |
| Law Enforcement | 25 (100.0%) | 0 (0.0%) |
| Food Preparation & Serving | 193 (65.6%) | 101 (34.4%) |
| Cleaning & Maintenance | 71 (41.5%) | 100 (58.5%) |
| Personal Care & Service | 22 (17.5%) | 104 (82.5%) |
| Total (Category) | 344 (35.7%) | 620 (64.3%) |
| Total (Overall) | 2,603 (50.4%) | 2,558 (49.6%) |
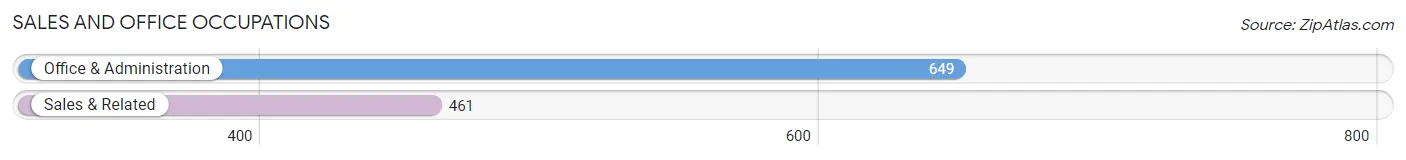
Sales and Office Occupations
The most common Sales and Office occupations in Fairmont are Office & Administration (649 | 12.6%), and Sales & Related (461 | 8.9%).
Sales and Office Occupations by Sex
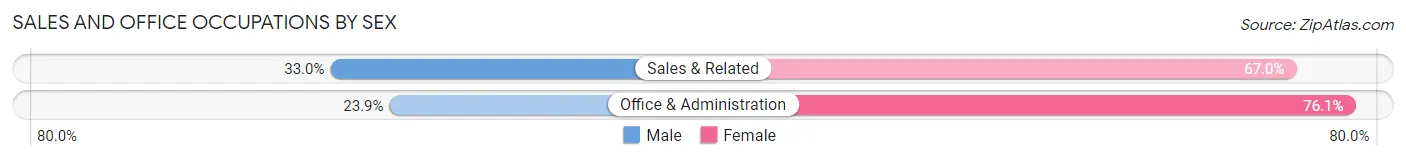
| Occupation | Male | Female |
| Sales & Related | 152 (33.0%) | 309 (67.0%) |
| Office & Administration | 155 (23.9%) | 494 (76.1%) |
| Total (Category) | 307 (27.7%) | 803 (72.3%) |
| Total (Overall) | 2,603 (50.4%) | 2,558 (49.6%) |
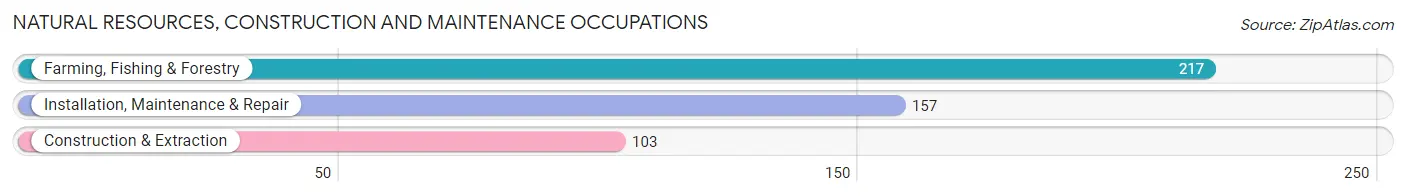
Natural Resources, Construction and Maintenance Occupations
The most common Natural Resources, Construction and Maintenance occupations in Fairmont are Farming, Fishing & Forestry (217 | 4.2%), Installation, Maintenance & Repair (157 | 3.0%), and Construction & Extraction (103 | 2.0%).
Natural Resources, Construction and Maintenance Occupations by Sex
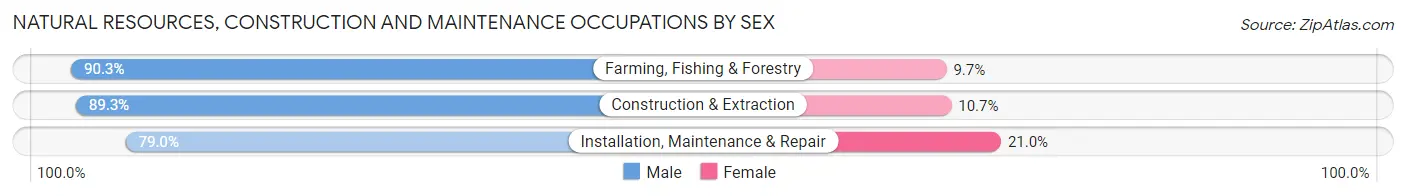
| Occupation | Male | Female |
| Farming, Fishing & Forestry | 196 (90.3%) | 21 (9.7%) |
| Construction & Extraction | 92 (89.3%) | 11 (10.7%) |
| Installation, Maintenance & Repair | 124 (79.0%) | 33 (21.0%) |
| Total (Category) | 412 (86.4%) | 65 (13.6%) |
| Total (Overall) | 2,603 (50.4%) | 2,558 (49.6%) |
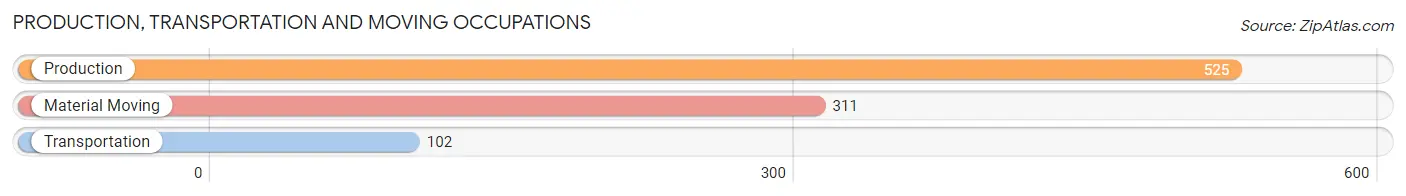
Production, Transportation and Moving Occupations
The most common Production, Transportation and Moving occupations in Fairmont are Production (525 | 10.2%), Material Moving (311 | 6.0%), and Transportation (102 | 2.0%).
Production, Transportation and Moving Occupations by Sex
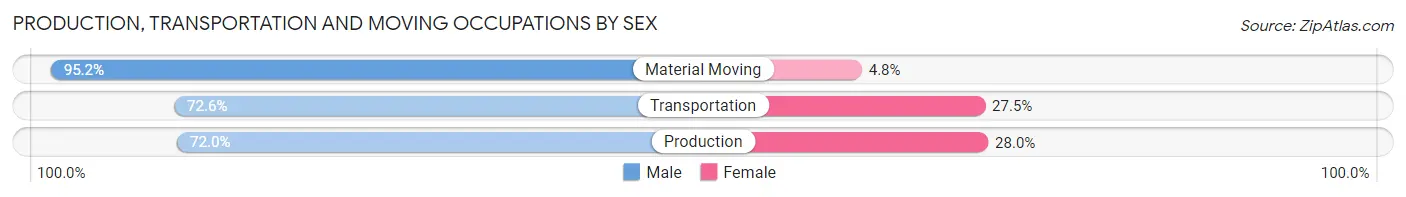
| Occupation | Male | Female |
| Production | 378 (72.0%) | 147 (28.0%) |
| Transportation | 74 (72.6%) | 28 (27.5%) |
| Material Moving | 296 (95.2%) | 15 (4.8%) |
| Total (Category) | 748 (79.7%) | 190 (20.3%) |
| Total (Overall) | 2,603 (50.4%) | 2,558 (49.6%) |
Employment Industries by Sex in Fairmont
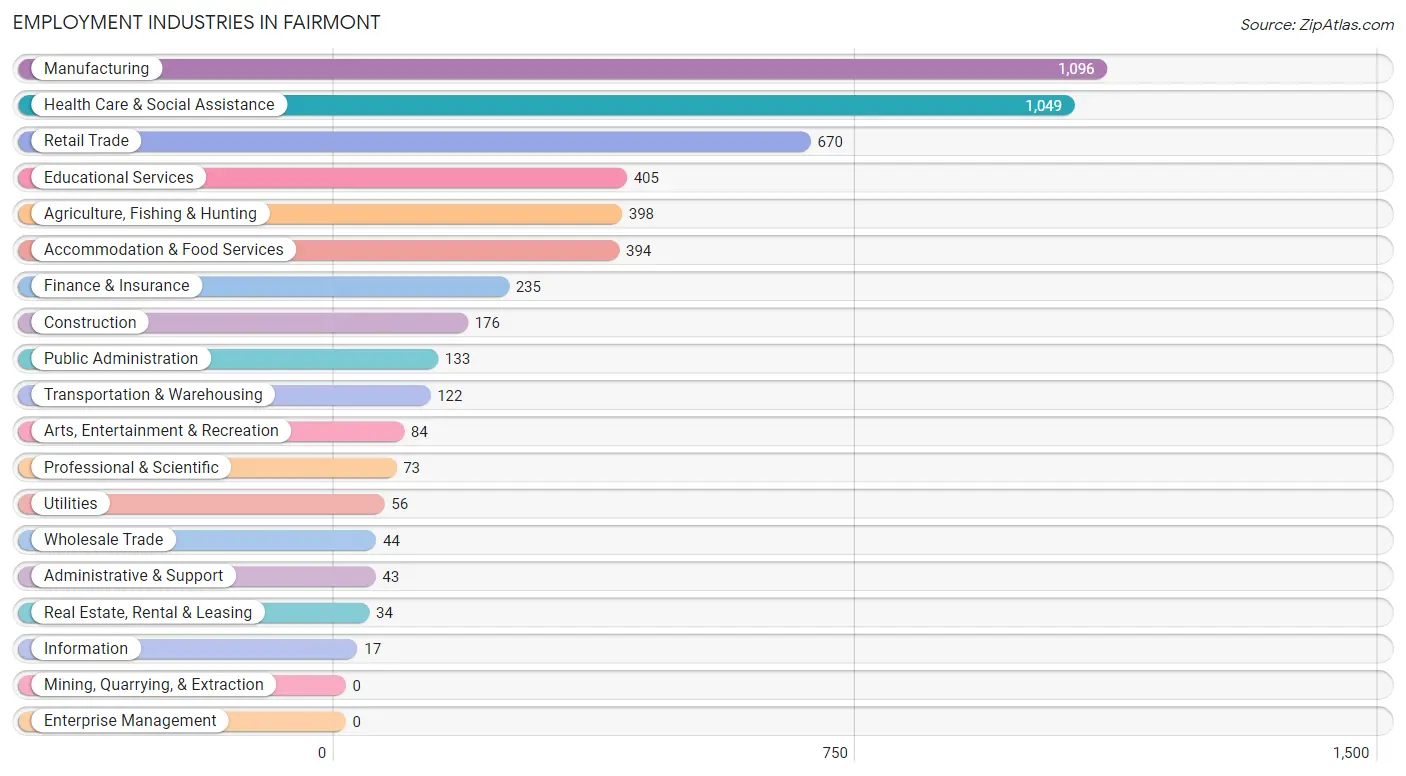
Employment Industries in Fairmont
The major employment industries in Fairmont include Manufacturing (1,096 | 21.2%), Health Care & Social Assistance (1,049 | 20.3%), Retail Trade (670 | 13.0%), Educational Services (405 | 7.9%), and Agriculture, Fishing & Hunting (398 | 7.7%).
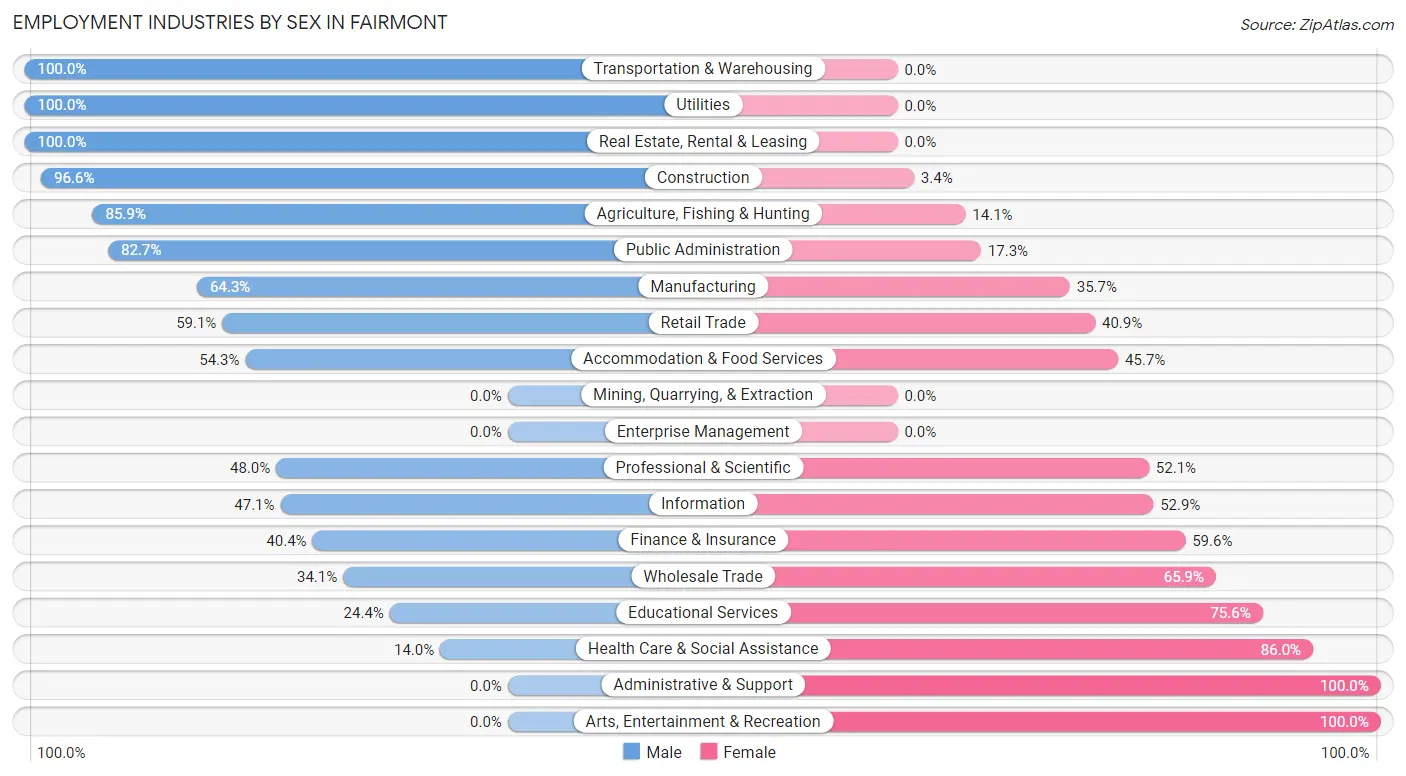
Employment Industries by Sex in Fairmont
The Fairmont industries that see more men than women are Transportation & Warehousing (100.0%), Utilities (100.0%), and Real Estate, Rental & Leasing (100.0%), whereas the industries that tend to have a higher number of women are Administrative & Support (100.0%), Arts, Entertainment & Recreation (100.0%), and Health Care & Social Assistance (86.0%).
| Industry | Male | Female |
| Agriculture, Fishing & Hunting | 342 (85.9%) | 56 (14.1%) |
| Mining, Quarrying, & Extraction | 0 (0.0%) | 0 (0.0%) |
| Construction | 170 (96.6%) | 6 (3.4%) |
| Manufacturing | 705 (64.3%) | 391 (35.7%) |
| Wholesale Trade | 15 (34.1%) | 29 (65.9%) |
| Retail Trade | 396 (59.1%) | 274 (40.9%) |
| Transportation & Warehousing | 122 (100.0%) | 0 (0.0%) |
| Utilities | 56 (100.0%) | 0 (0.0%) |
| Information | 8 (47.1%) | 9 (52.9%) |
| Finance & Insurance | 95 (40.4%) | 140 (59.6%) |
| Real Estate, Rental & Leasing | 34 (100.0%) | 0 (0.0%) |
| Professional & Scientific | 35 (47.9%) | 38 (52.0%) |
| Enterprise Management | 0 (0.0%) | 0 (0.0%) |
| Administrative & Support | 0 (0.0%) | 43 (100.0%) |
| Educational Services | 99 (24.4%) | 306 (75.6%) |
| Health Care & Social Assistance | 147 (14.0%) | 902 (86.0%) |
| Arts, Entertainment & Recreation | 0 (0.0%) | 84 (100.0%) |
| Accommodation & Food Services | 214 (54.3%) | 180 (45.7%) |
| Public Administration | 110 (82.7%) | 23 (17.3%) |
| Total | 2,603 (50.4%) | 2,558 (49.6%) |
Education in Fairmont
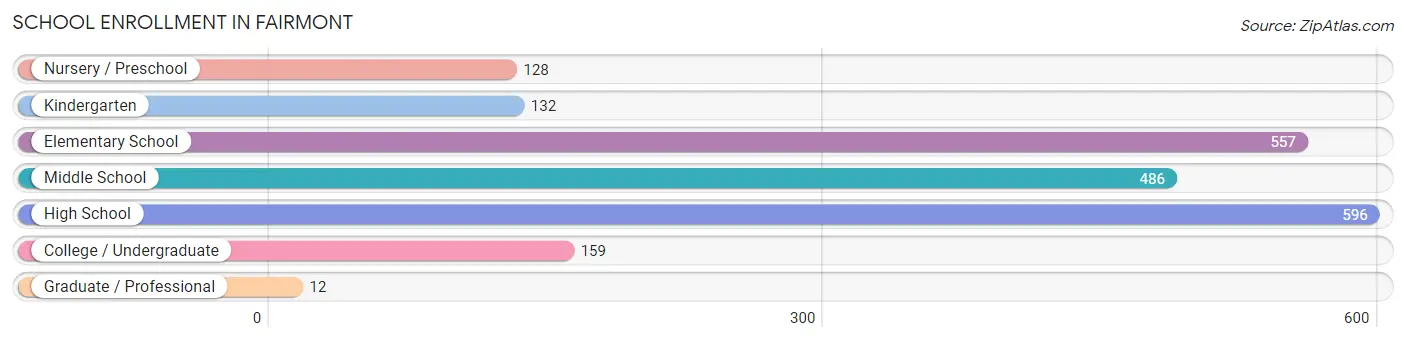
School Enrollment in Fairmont
The most common levels of schooling among the 2,070 students in Fairmont are high school (596 | 28.8%), elementary school (557 | 26.9%), and middle school (486 | 23.5%).
| School Level | # Students | % Students |
| Nursery / Preschool | 128 | 6.2% |
| Kindergarten | 132 | 6.4% |
| Elementary School | 557 | 26.9% |
| Middle School | 486 | 23.5% |
| High School | 596 | 28.8% |
| College / Undergraduate | 159 | 7.7% |
| Graduate / Professional | 12 | 0.6% |
| Total | 2,070 | 100.0% |
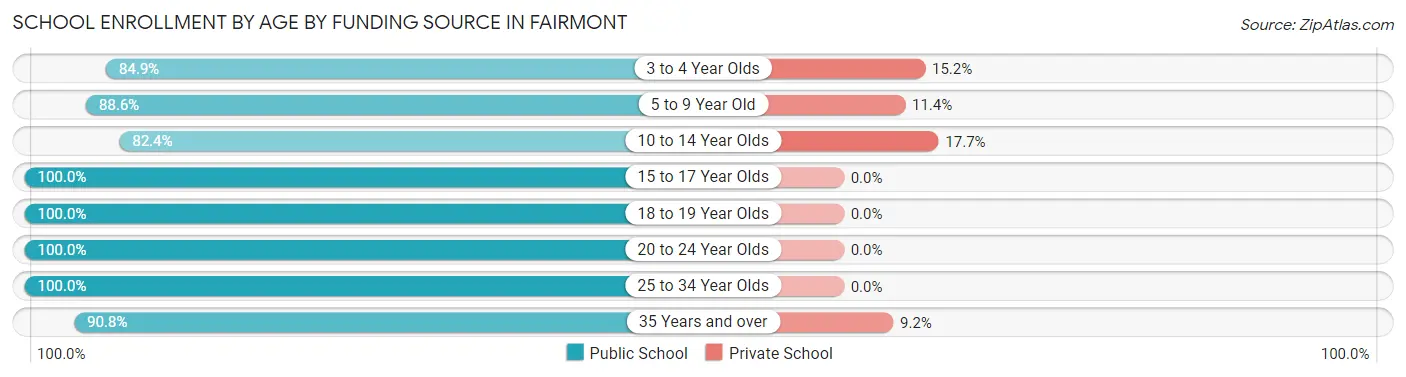
School Enrollment by Age by Funding Source in Fairmont
Out of a total of 2,070 students who are enrolled in schools in Fairmont, 201 (9.7%) attend a private institution, while the remaining 1,869 (90.3%) are enrolled in public schools. The age group of 10 to 14 year olds has the highest likelihood of being enrolled in private schools, with 99 (17.6% in the age bracket) enrolled. Conversely, the age group of 15 to 17 year olds has the lowest likelihood of being enrolled in a private school, with 369 (100.0% in the age bracket) attending a public institution.
| Age Bracket | Public School | Private School |
| 3 to 4 Year Olds | 28 (84.9%) | 5 (15.1%) |
| 5 to 9 Year Old | 643 (88.6%) | 83 (11.4%) |
| 10 to 14 Year Olds | 462 (82.4%) | 99 (17.6%) |
| 15 to 17 Year Olds | 369 (100.0%) | 0 (0.0%) |
| 18 to 19 Year Olds | 179 (100.0%) | 0 (0.0%) |
| 20 to 24 Year Olds | 38 (100.0%) | 0 (0.0%) |
| 25 to 34 Year Olds | 12 (100.0%) | 0 (0.0%) |
| 35 Years and over | 138 (90.8%) | 14 (9.2%) |
| Total | 1,869 (90.3%) | 201 (9.7%) |
Educational Attainment by Field of Study in Fairmont
Education (565 | 26.7%), arts & humanities (278 | 13.1%), bio, nature & agricultural (252 | 11.9%), business (228 | 10.8%), and liberal arts & history (176 | 8.3%) are the most common fields of study among 2,119 individuals in Fairmont who have obtained a bachelor's degree or higher.
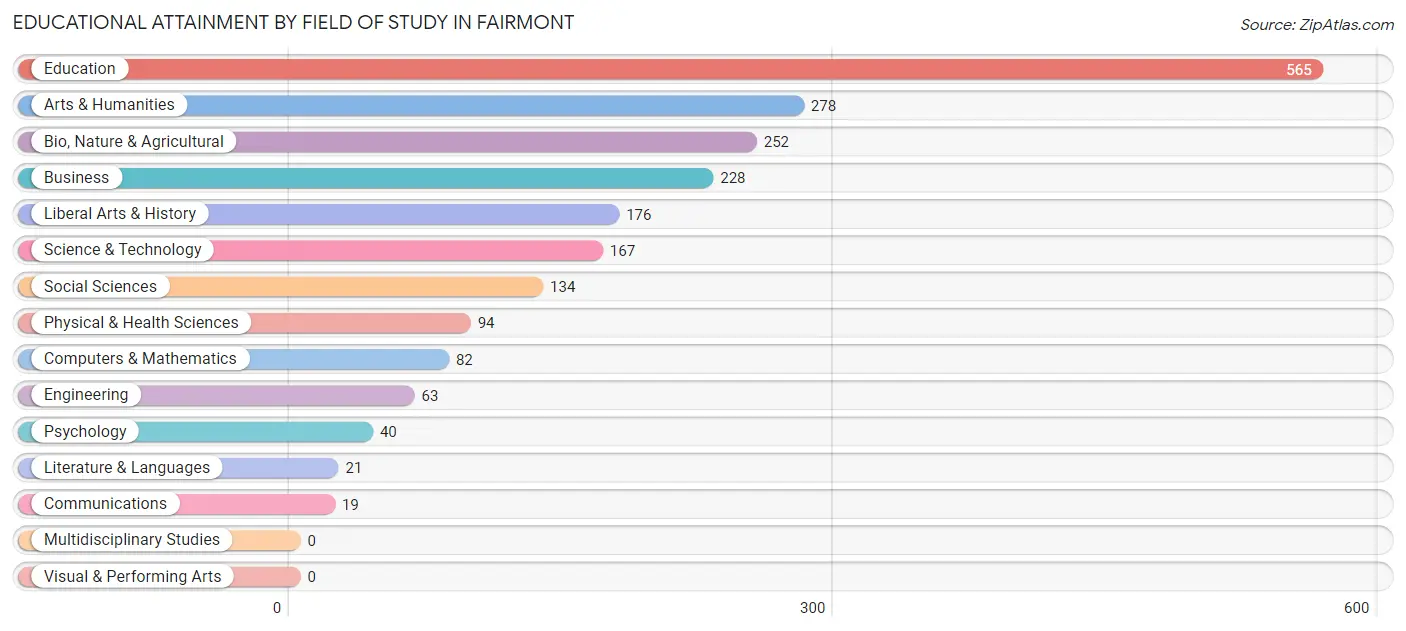
| Field of Study | # Graduates | % Graduates |
| Computers & Mathematics | 82 | 3.9% |
| Bio, Nature & Agricultural | 252 | 11.9% |
| Physical & Health Sciences | 94 | 4.4% |
| Psychology | 40 | 1.9% |
| Social Sciences | 134 | 6.3% |
| Engineering | 63 | 3.0% |
| Multidisciplinary Studies | 0 | 0.0% |
| Science & Technology | 167 | 7.9% |
| Business | 228 | 10.8% |
| Education | 565 | 26.7% |
| Literature & Languages | 21 | 1.0% |
| Liberal Arts & History | 176 | 8.3% |
| Visual & Performing Arts | 0 | 0.0% |
| Communications | 19 | 0.9% |
| Arts & Humanities | 278 | 13.1% |
| Total | 2,119 | 100.0% |
Transportation & Commute in Fairmont
Vehicle Availability by Sex in Fairmont
The most prevalent vehicle ownership categories in Fairmont are males with 2 vehicles (951, accounting for 38.3%) and females with 2 vehicles (1,130, making up 38.0%).
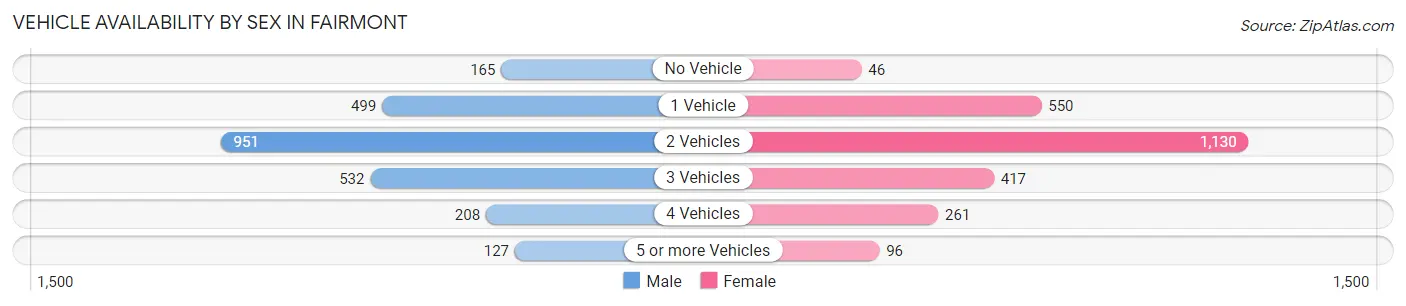
| Vehicles Available | Male | Female |
| No Vehicle | 165 (6.7%) | 46 (1.8%) |
| 1 Vehicle | 499 (20.1%) | 550 (22.0%) |
| 2 Vehicles | 951 (38.3%) | 1,130 (45.2%) |
| 3 Vehicles | 532 (21.4%) | 417 (16.7%) |
| 4 Vehicles | 208 (8.4%) | 261 (10.4%) |
| 5 or more Vehicles | 127 (5.1%) | 96 (3.8%) |
| Total | 2,482 (100.0%) | 2,500 (100.0%) |
Commute Time in Fairmont
The most frequently occuring commute durations in Fairmont are 5 to 9 minutes (1,986 commuters, 42.8%), 10 to 14 minutes (985 commuters, 21.2%), and 15 to 19 minutes (351 commuters, 7.6%).
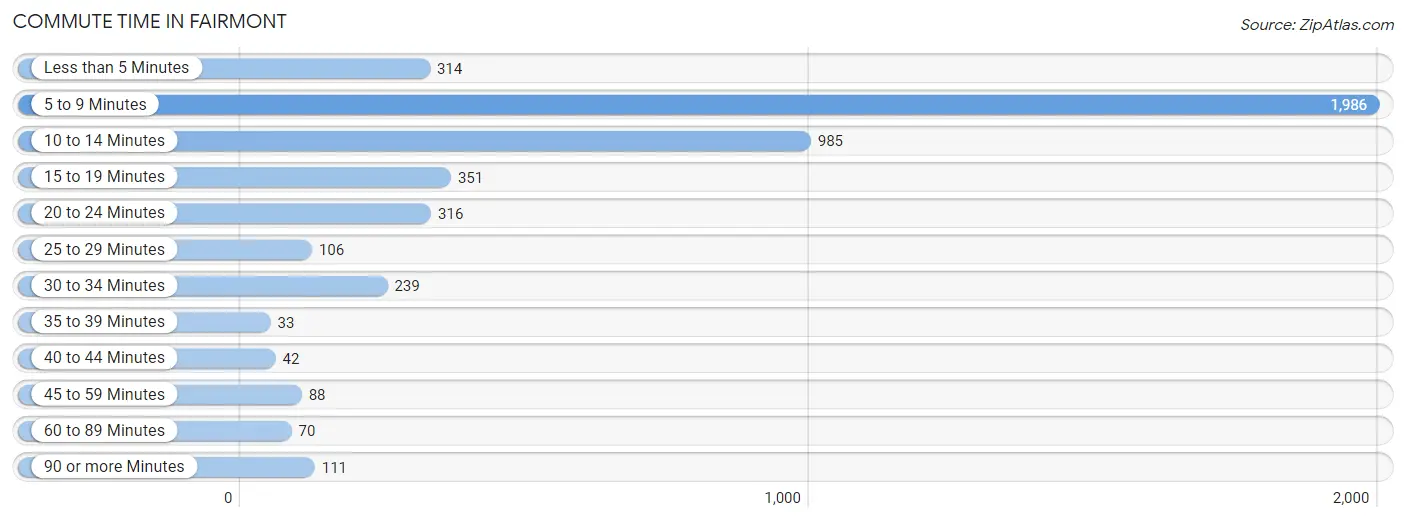
| Commute Time | # Commuters | % Commuters |
| Less than 5 Minutes | 314 | 6.8% |
| 5 to 9 Minutes | 1,986 | 42.8% |
| 10 to 14 Minutes | 985 | 21.2% |
| 15 to 19 Minutes | 351 | 7.6% |
| 20 to 24 Minutes | 316 | 6.8% |
| 25 to 29 Minutes | 106 | 2.3% |
| 30 to 34 Minutes | 239 | 5.1% |
| 35 to 39 Minutes | 33 | 0.7% |
| 40 to 44 Minutes | 42 | 0.9% |
| 45 to 59 Minutes | 88 | 1.9% |
| 60 to 89 Minutes | 70 | 1.5% |
| 90 or more Minutes | 111 | 2.4% |
Commute Time by Sex in Fairmont
The most common commute times in Fairmont are 5 to 9 minutes (905 commuters, 39.2%) for males and 5 to 9 minutes (1,081 commuters, 46.4%) for females.
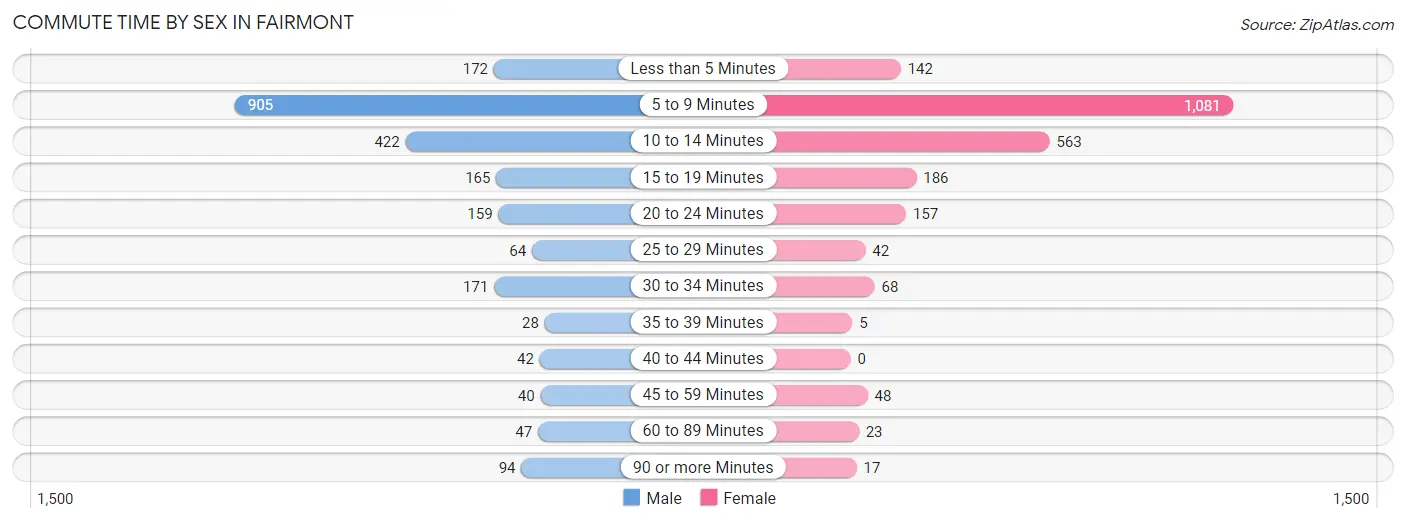
| Commute Time | Male | Female |
| Less than 5 Minutes | 172 (7.4%) | 142 (6.1%) |
| 5 to 9 Minutes | 905 (39.2%) | 1,081 (46.4%) |
| 10 to 14 Minutes | 422 (18.3%) | 563 (24.1%) |
| 15 to 19 Minutes | 165 (7.1%) | 186 (8.0%) |
| 20 to 24 Minutes | 159 (6.9%) | 157 (6.7%) |
| 25 to 29 Minutes | 64 (2.8%) | 42 (1.8%) |
| 30 to 34 Minutes | 171 (7.4%) | 68 (2.9%) |
| 35 to 39 Minutes | 28 (1.2%) | 5 (0.2%) |
| 40 to 44 Minutes | 42 (1.8%) | 0 (0.0%) |
| 45 to 59 Minutes | 40 (1.7%) | 48 (2.1%) |
| 60 to 89 Minutes | 47 (2.0%) | 23 (1.0%) |
| 90 or more Minutes | 94 (4.1%) | 17 (0.7%) |
Time of Departure to Work by Sex in Fairmont
The most frequent times of departure to work in Fairmont are 6:30 AM to 6:59 AM (423, 18.3%) for males and 7:30 AM to 7:59 AM (571, 24.5%) for females.
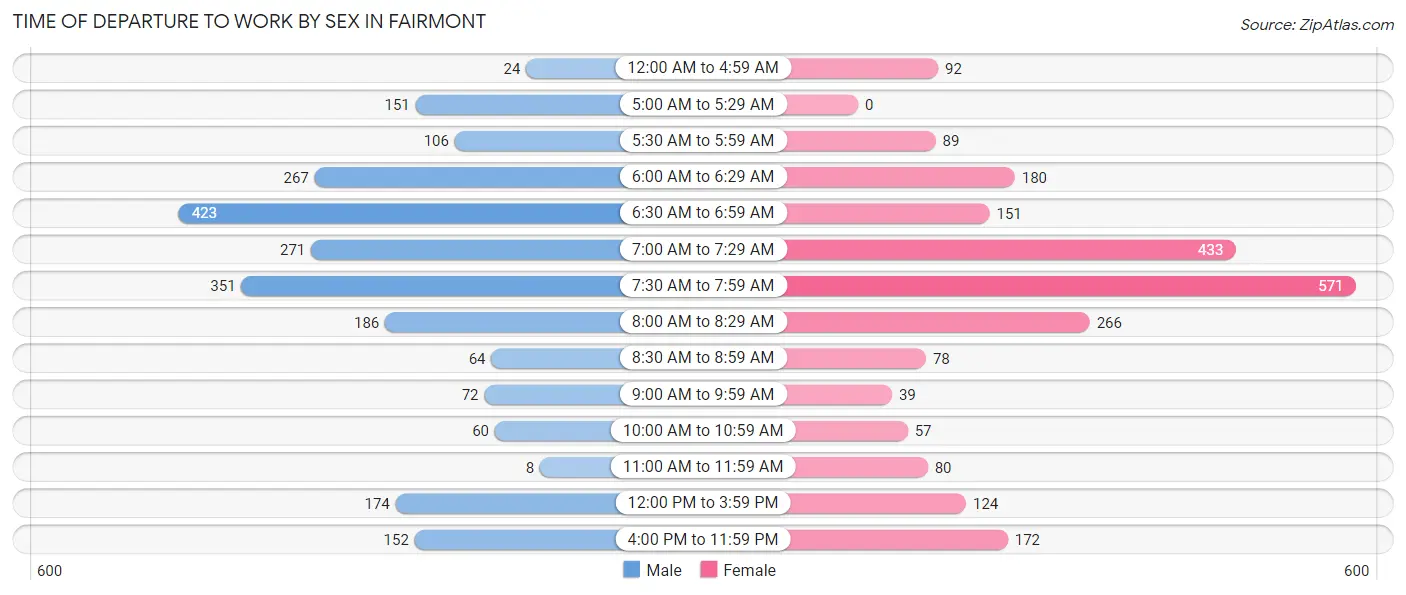
| Time of Departure | Male | Female |
| 12:00 AM to 4:59 AM | 24 (1.0%) | 92 (4.0%) |
| 5:00 AM to 5:29 AM | 151 (6.5%) | 0 (0.0%) |
| 5:30 AM to 5:59 AM | 106 (4.6%) | 89 (3.8%) |
| 6:00 AM to 6:29 AM | 267 (11.6%) | 180 (7.7%) |
| 6:30 AM to 6:59 AM | 423 (18.3%) | 151 (6.5%) |
| 7:00 AM to 7:29 AM | 271 (11.7%) | 433 (18.6%) |
| 7:30 AM to 7:59 AM | 351 (15.2%) | 571 (24.5%) |
| 8:00 AM to 8:29 AM | 186 (8.1%) | 266 (11.4%) |
| 8:30 AM to 8:59 AM | 64 (2.8%) | 78 (3.3%) |
| 9:00 AM to 9:59 AM | 72 (3.1%) | 39 (1.7%) |
| 10:00 AM to 10:59 AM | 60 (2.6%) | 57 (2.4%) |
| 11:00 AM to 11:59 AM | 8 (0.4%) | 80 (3.4%) |
| 12:00 PM to 3:59 PM | 174 (7.5%) | 124 (5.3%) |
| 4:00 PM to 11:59 PM | 152 (6.6%) | 172 (7.4%) |
| Total | 2,309 (100.0%) | 2,332 (100.0%) |
Housing Occupancy in Fairmont
Occupancy by Ownership in Fairmont
Of the total 4,750 dwellings in Fairmont, owner-occupied units account for 3,128 (65.8%), while renter-occupied units make up 1,622 (34.2%).
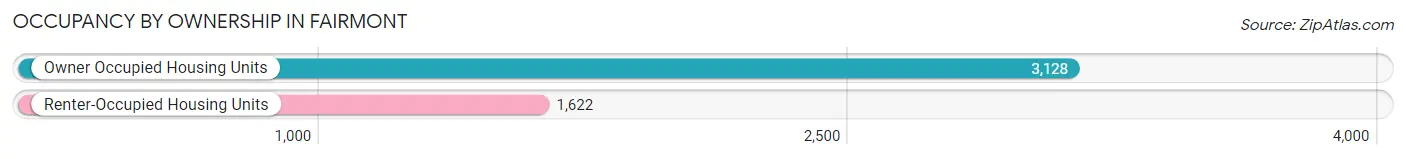
| Occupancy | # Housing Units | % Housing Units |
| Owner Occupied Housing Units | 3,128 | 65.8% |
| Renter-Occupied Housing Units | 1,622 | 34.2% |
| Total Occupied Housing Units | 4,750 | 100.0% |
Occupancy by Household Size in Fairmont
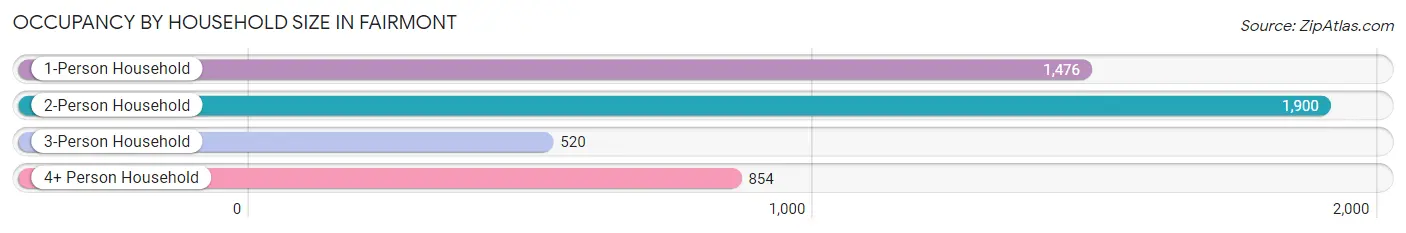
| Household Size | # Housing Units | % Housing Units |
| 1-Person Household | 1,476 | 31.1% |
| 2-Person Household | 1,900 | 40.0% |
| 3-Person Household | 520 | 11.0% |
| 4+ Person Household | 854 | 18.0% |
| Total Housing Units | 4,750 | 100.0% |
Occupancy by Ownership by Household Size in Fairmont
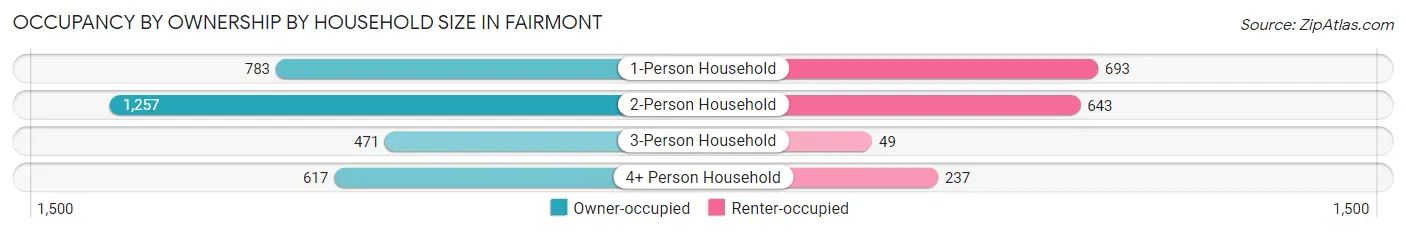
| Household Size | Owner-occupied | Renter-occupied |
| 1-Person Household | 783 (53.0%) | 693 (46.9%) |
| 2-Person Household | 1,257 (66.2%) | 643 (33.8%) |
| 3-Person Household | 471 (90.6%) | 49 (9.4%) |
| 4+ Person Household | 617 (72.3%) | 237 (27.8%) |
| Total Housing Units | 3,128 (65.8%) | 1,622 (34.2%) |
Occupancy by Educational Attainment in Fairmont
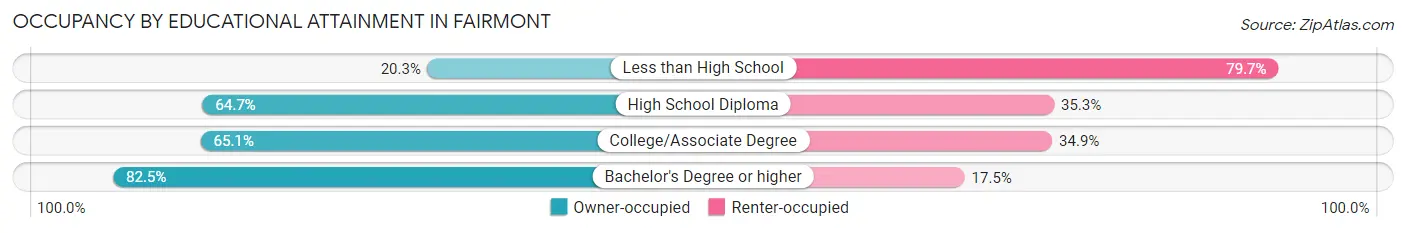
| Household Size | Owner-occupied | Renter-occupied |
| Less than High School | 74 (20.3%) | 291 (79.7%) |
| High School Diploma | 995 (64.7%) | 542 (35.3%) |
| College/Associate Degree | 1,086 (65.1%) | 582 (34.9%) |
| Bachelor's Degree or higher | 973 (82.5%) | 207 (17.5%) |
Occupancy by Age of Householder in Fairmont
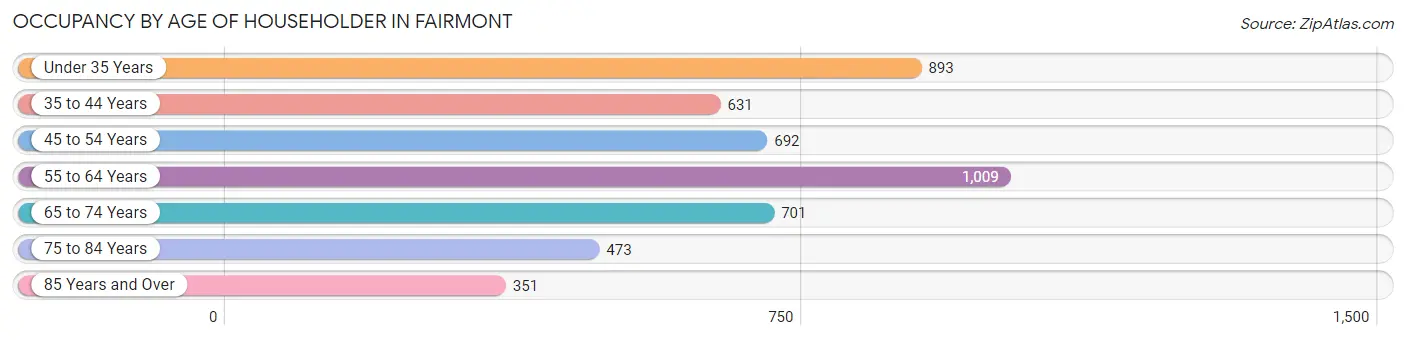
| Age Bracket | # Households | % Households |
| Under 35 Years | 893 | 18.8% |
| 35 to 44 Years | 631 | 13.3% |
| 45 to 54 Years | 692 | 14.6% |
| 55 to 64 Years | 1,009 | 21.2% |
| 65 to 74 Years | 701 | 14.8% |
| 75 to 84 Years | 473 | 10.0% |
| 85 Years and Over | 351 | 7.4% |
| Total | 4,750 | 100.0% |
Housing Finances in Fairmont
Median Income by Occupancy in Fairmont
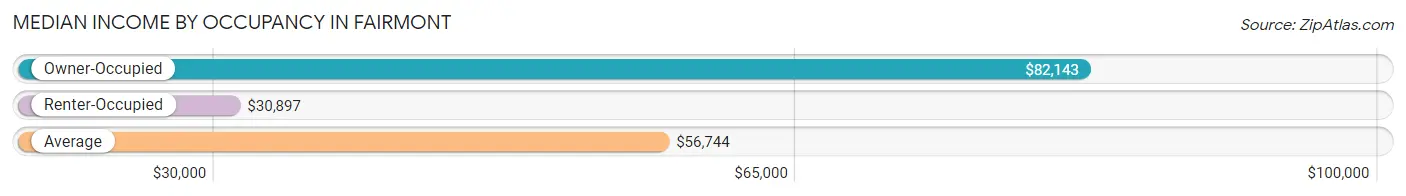
| Occupancy Type | # Households | Median Income |
| Owner-Occupied | 3,128 (65.8%) | $82,143 |
| Renter-Occupied | 1,622 (34.2%) | $30,897 |
| Average | 4,750 (100.0%) | $56,744 |
Occupancy by Householder Income Bracket in Fairmont
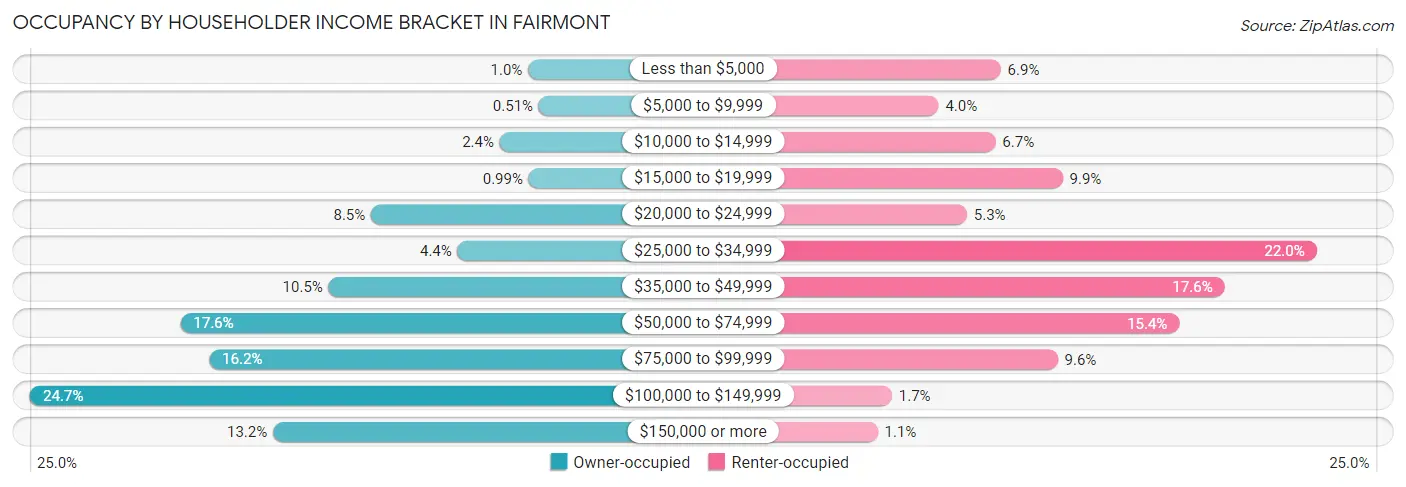
| Income Bracket | Owner-occupied | Renter-occupied |
| Less than $5,000 | 32 (1.0%) | 112 (6.9%) |
| $5,000 to $9,999 | 16 (0.5%) | 64 (4.0%) |
| $10,000 to $14,999 | 74 (2.4%) | 108 (6.7%) |
| $15,000 to $19,999 | 31 (1.0%) | 160 (9.9%) |
| $20,000 to $24,999 | 266 (8.5%) | 86 (5.3%) |
| $25,000 to $34,999 | 137 (4.4%) | 356 (22.0%) |
| $35,000 to $49,999 | 329 (10.5%) | 285 (17.6%) |
| $50,000 to $74,999 | 550 (17.6%) | 250 (15.4%) |
| $75,000 to $99,999 | 507 (16.2%) | 156 (9.6%) |
| $100,000 to $149,999 | 774 (24.7%) | 28 (1.7%) |
| $150,000 or more | 412 (13.2%) | 17 (1.1%) |
| Total | 3,128 (100.0%) | 1,622 (100.0%) |
Monthly Housing Cost Tiers in Fairmont
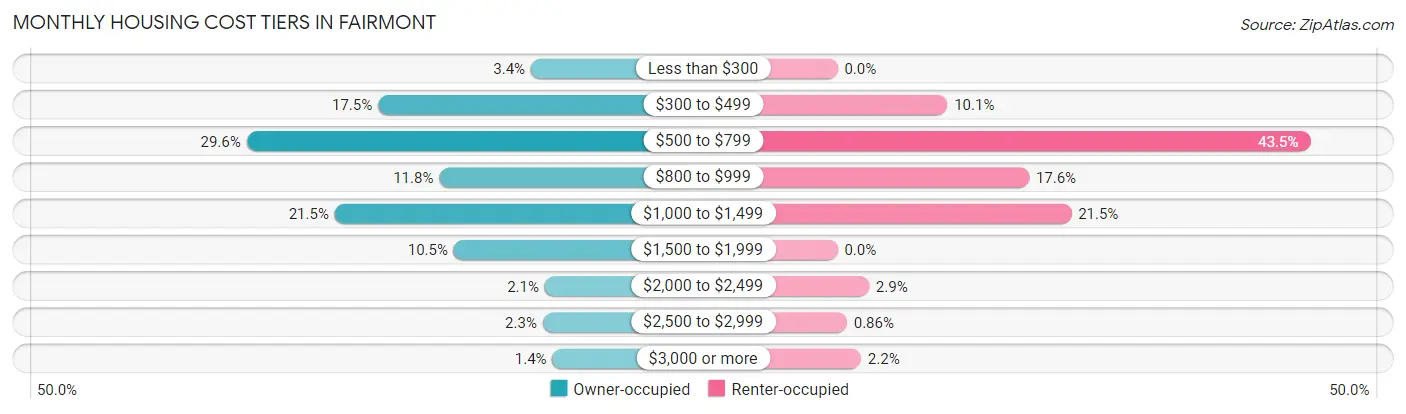
| Monthly Cost | Owner-occupied | Renter-occupied |
| Less than $300 | 106 (3.4%) | 0 (0.0%) |
| $300 to $499 | 546 (17.5%) | 164 (10.1%) |
| $500 to $799 | 925 (29.6%) | 706 (43.5%) |
| $800 to $999 | 370 (11.8%) | 286 (17.6%) |
| $1,000 to $1,499 | 671 (21.4%) | 349 (21.5%) |
| $1,500 to $1,999 | 328 (10.5%) | 0 (0.0%) |
| $2,000 to $2,499 | 66 (2.1%) | 47 (2.9%) |
| $2,500 to $2,999 | 72 (2.3%) | 14 (0.9%) |
| $3,000 or more | 44 (1.4%) | 35 (2.2%) |
| Total | 3,128 (100.0%) | 1,622 (100.0%) |
Physical Housing Characteristics in Fairmont
Housing Structures in Fairmont
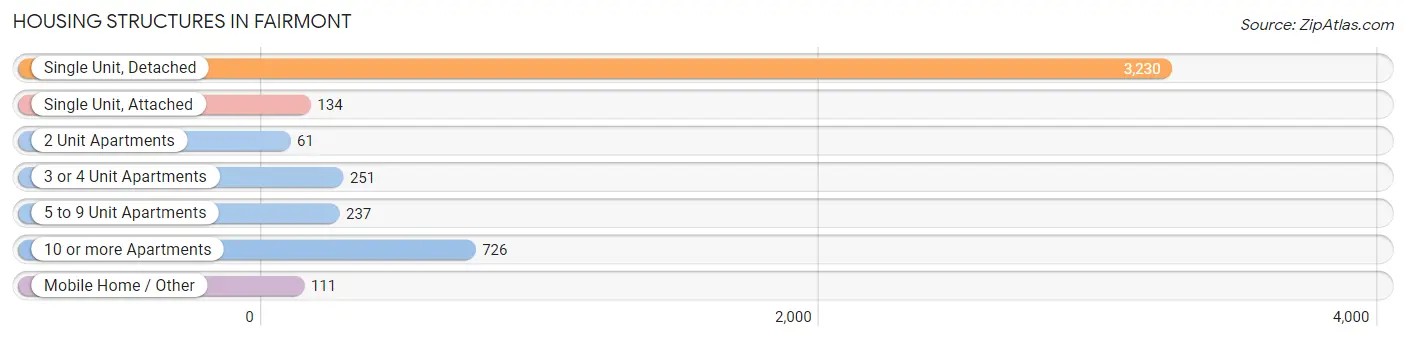
| Structure Type | # Housing Units | % Housing Units |
| Single Unit, Detached | 3,230 | 68.0% |
| Single Unit, Attached | 134 | 2.8% |
| 2 Unit Apartments | 61 | 1.3% |
| 3 or 4 Unit Apartments | 251 | 5.3% |
| 5 to 9 Unit Apartments | 237 | 5.0% |
| 10 or more Apartments | 726 | 15.3% |
| Mobile Home / Other | 111 | 2.3% |
| Total | 4,750 | 100.0% |
Housing Structures by Occupancy in Fairmont
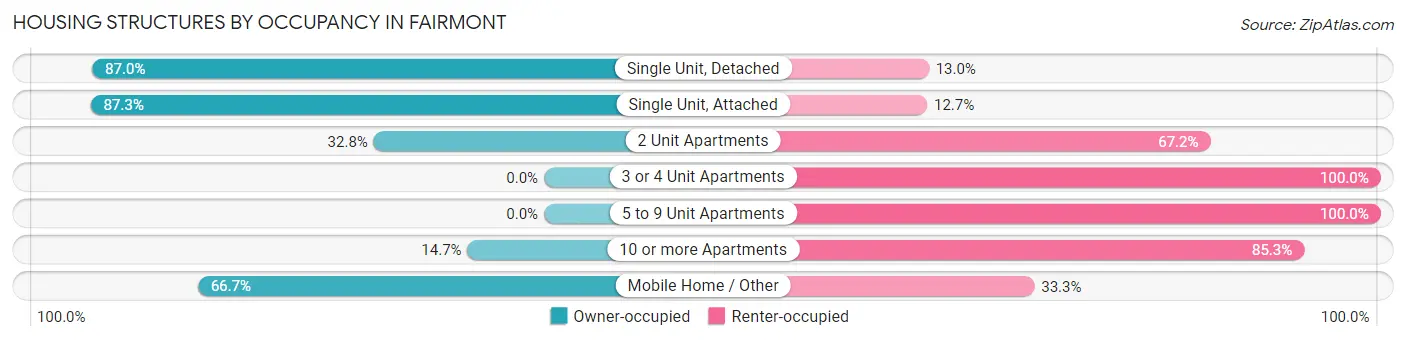
| Structure Type | Owner-occupied | Renter-occupied |
| Single Unit, Detached | 2,810 (87.0%) | 420 (13.0%) |
| Single Unit, Attached | 117 (87.3%) | 17 (12.7%) |
| 2 Unit Apartments | 20 (32.8%) | 41 (67.2%) |
| 3 or 4 Unit Apartments | 0 (0.0%) | 251 (100.0%) |
| 5 to 9 Unit Apartments | 0 (0.0%) | 237 (100.0%) |
| 10 or more Apartments | 107 (14.7%) | 619 (85.3%) |
| Mobile Home / Other | 74 (66.7%) | 37 (33.3%) |
| Total | 3,128 (65.8%) | 1,622 (34.2%) |
Housing Structures by Number of Rooms in Fairmont
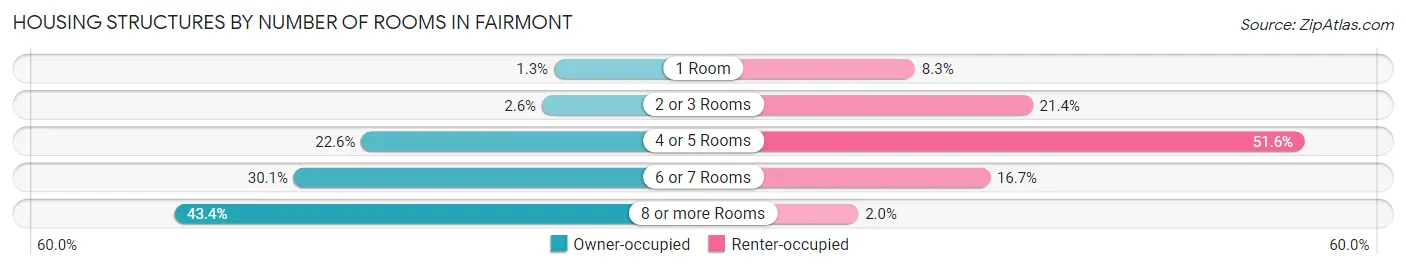
| Number of Rooms | Owner-occupied | Renter-occupied |
| 1 Room | 39 (1.3%) | 135 (8.3%) |
| 2 or 3 Rooms | 81 (2.6%) | 347 (21.4%) |
| 4 or 5 Rooms | 708 (22.6%) | 837 (51.6%) |
| 6 or 7 Rooms | 942 (30.1%) | 270 (16.7%) |
| 8 or more Rooms | 1,358 (43.4%) | 33 (2.0%) |
| Total | 3,128 (100.0%) | 1,622 (100.0%) |
Housing Structure by Heating Type in Fairmont
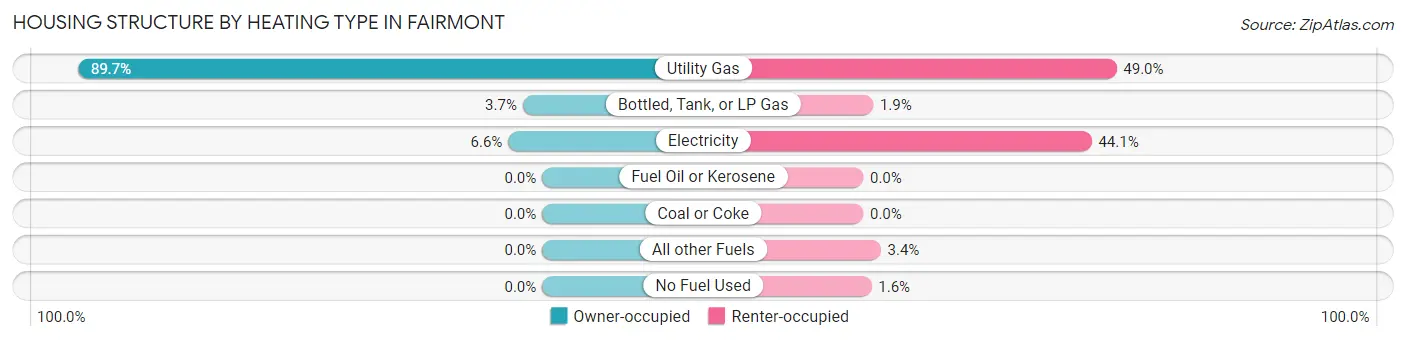
| Heating Type | Owner-occupied | Renter-occupied |
| Utility Gas | 2,806 (89.7%) | 794 (48.9%) |
| Bottled, Tank, or LP Gas | 117 (3.7%) | 31 (1.9%) |
| Electricity | 205 (6.6%) | 716 (44.1%) |
| Fuel Oil or Kerosene | 0 (0.0%) | 0 (0.0%) |
| Coal or Coke | 0 (0.0%) | 0 (0.0%) |
| All other Fuels | 0 (0.0%) | 55 (3.4%) |
| No Fuel Used | 0 (0.0%) | 26 (1.6%) |
| Total | 3,128 (100.0%) | 1,622 (100.0%) |
Household Vehicle Usage in Fairmont
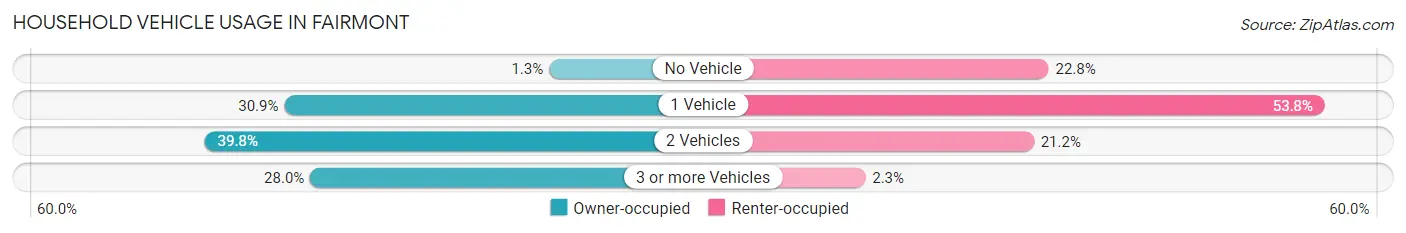
| Vehicles per Household | Owner-occupied | Renter-occupied |
| No Vehicle | 39 (1.3%) | 370 (22.8%) |
| 1 Vehicle | 967 (30.9%) | 872 (53.8%) |
| 2 Vehicles | 1,246 (39.8%) | 343 (21.1%) |
| 3 or more Vehicles | 876 (28.0%) | 37 (2.3%) |
| Total | 3,128 (100.0%) | 1,622 (100.0%) |
Real Estate & Mortgages in Fairmont
Real Estate and Mortgage Overview in Fairmont
| Characteristic | Without Mortgage | With Mortgage |
| Housing Units | 1,375 | 1,753 |
| Median Property Value | $153,500 | $158,600 |
| Median Household Income | $60,625 | $244 |
| Monthly Housing Costs | $510 | $44 |
| Real Estate Taxes | $1,450 | $13 |
Property Value by Mortgage Status in Fairmont
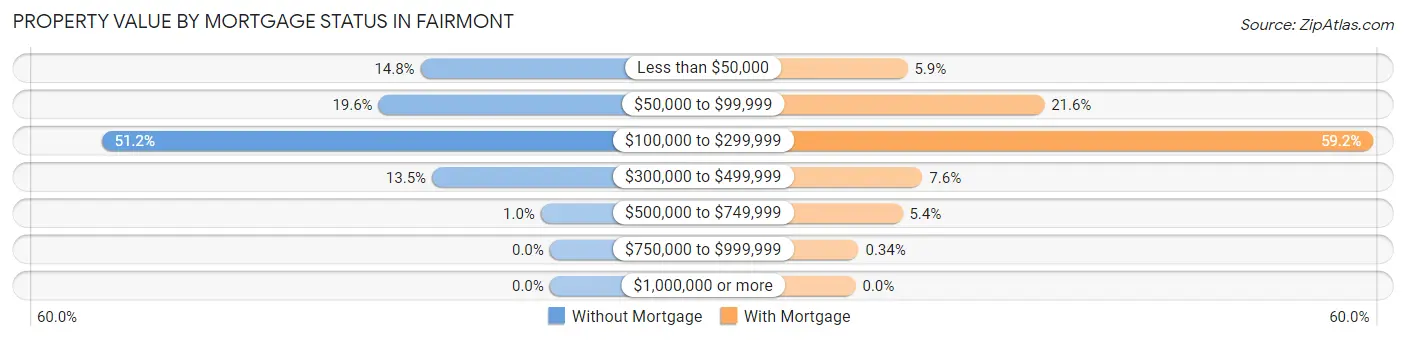
| Property Value | Without Mortgage | With Mortgage |
| Less than $50,000 | 203 (14.8%) | 104 (5.9%) |
| $50,000 to $99,999 | 269 (19.6%) | 378 (21.6%) |
| $100,000 to $299,999 | 704 (51.2%) | 1,037 (59.2%) |
| $300,000 to $499,999 | 185 (13.5%) | 134 (7.6%) |
| $500,000 to $749,999 | 14 (1.0%) | 94 (5.4%) |
| $750,000 to $999,999 | 0 (0.0%) | 6 (0.3%) |
| $1,000,000 or more | 0 (0.0%) | 0 (0.0%) |
| Total | 1,375 (100.0%) | 1,753 (100.0%) |
Household Income by Mortgage Status in Fairmont
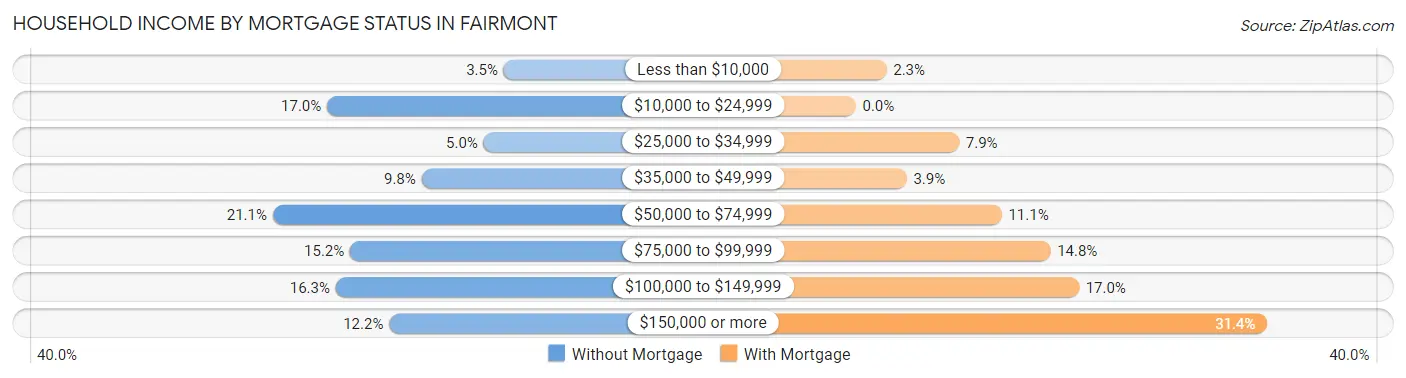
| Household Income | Without Mortgage | With Mortgage |
| Less than $10,000 | 48 (3.5%) | 41 (2.3%) |
| $10,000 to $24,999 | 233 (17.0%) | 0 (0.0%) |
| $25,000 to $34,999 | 69 (5.0%) | 138 (7.9%) |
| $35,000 to $49,999 | 134 (9.8%) | 68 (3.9%) |
| $50,000 to $74,999 | 290 (21.1%) | 195 (11.1%) |
| $75,000 to $99,999 | 209 (15.2%) | 260 (14.8%) |
| $100,000 to $149,999 | 224 (16.3%) | 298 (17.0%) |
| $150,000 or more | 168 (12.2%) | 550 (31.4%) |
| Total | 1,375 (100.0%) | 1,753 (100.0%) |
Property Value to Household Income Ratio in Fairmont
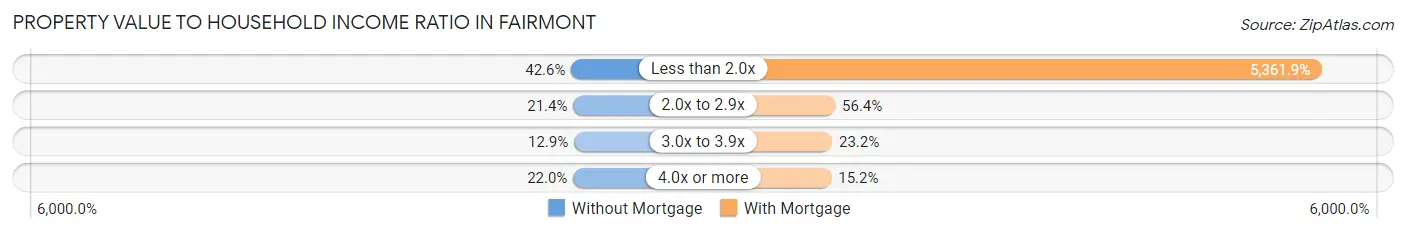
| Value-to-Income Ratio | Without Mortgage | With Mortgage |
| Less than 2.0x | 586 (42.6%) | 93,994 (5,361.9%) |
| 2.0x to 2.9x | 294 (21.4%) | 988 (56.4%) |
| 3.0x to 3.9x | 177 (12.9%) | 406 (23.2%) |
| 4.0x or more | 302 (22.0%) | 266 (15.2%) |
| Total | 1,375 (100.0%) | 1,753 (100.0%) |
Real Estate Taxes by Mortgage Status in Fairmont
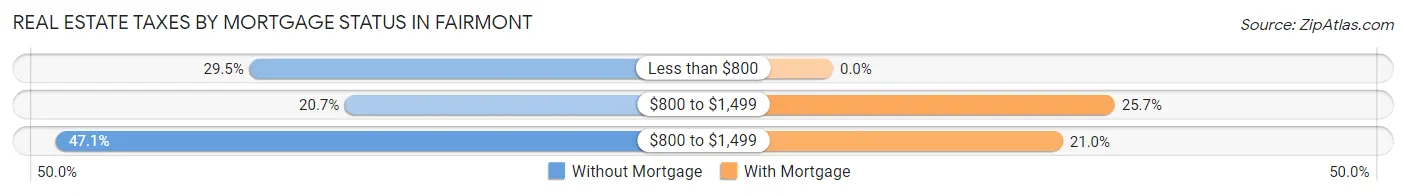
| Property Taxes | Without Mortgage | With Mortgage |
| Less than $800 | 405 (29.4%) | 0 (0.0%) |
| $800 to $1,499 | 285 (20.7%) | 451 (25.7%) |
| $800 to $1,499 | 648 (47.1%) | 368 (21.0%) |
| Total | 1,375 (100.0%) | 1,753 (100.0%) |
Health & Disability in Fairmont
Health Insurance Coverage by Age in Fairmont
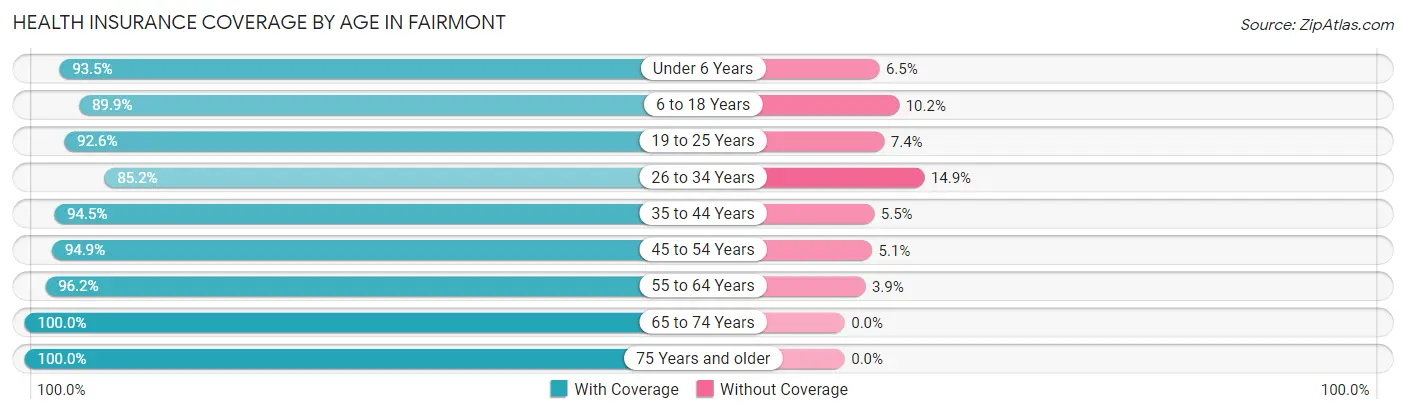
| Age Bracket | With Coverage | Without Coverage |
| Under 6 Years | 680 (93.5%) | 47 (6.5%) |
| 6 to 18 Years | 1,514 (89.8%) | 171 (10.2%) |
| 19 to 25 Years | 440 (92.6%) | 35 (7.4%) |
| 26 to 34 Years | 860 (85.2%) | 150 (14.8%) |
| 35 to 44 Years | 1,097 (94.5%) | 64 (5.5%) |
| 45 to 54 Years | 1,156 (94.9%) | 62 (5.1%) |
| 55 to 64 Years | 1,721 (96.2%) | 69 (3.8%) |
| 65 to 74 Years | 1,051 (100.0%) | 0 (0.0%) |
| 75 Years and older | 1,182 (100.0%) | 0 (0.0%) |
| Total | 9,701 (94.2%) | 598 (5.8%) |
Health Insurance Coverage by Citizenship Status in Fairmont
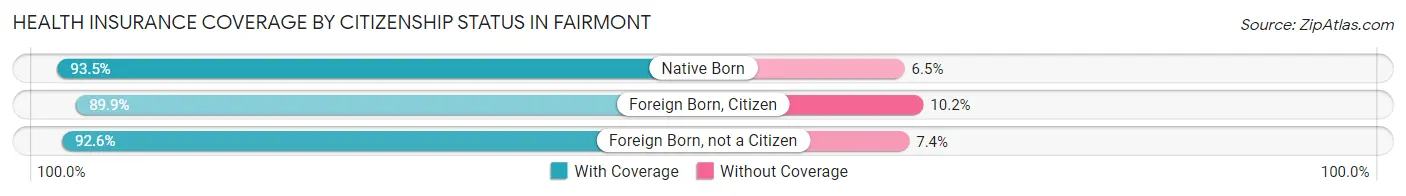
| Citizenship Status | With Coverage | Without Coverage |
| Native Born | 680 (93.5%) | 47 (6.5%) |
| Foreign Born, Citizen | 1,514 (89.8%) | 171 (10.2%) |
| Foreign Born, not a Citizen | 440 (92.6%) | 35 (7.4%) |
Health Insurance Coverage by Household Income in Fairmont
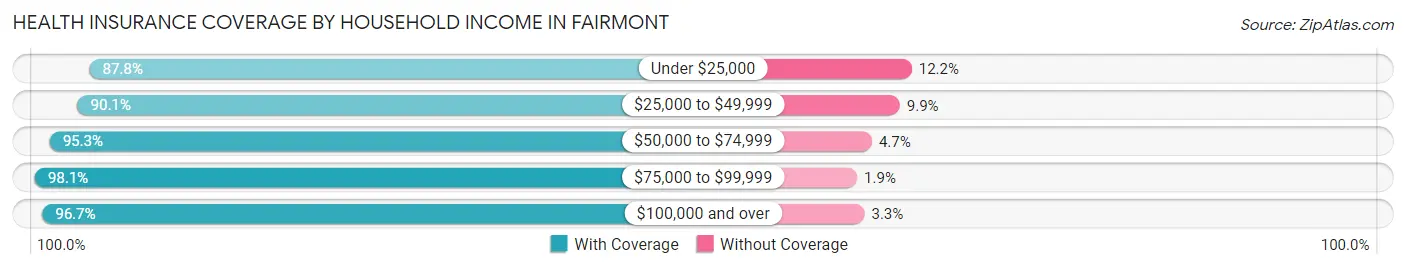
| Household Income | With Coverage | Without Coverage |
| Under $25,000 | 1,219 (87.8%) | 169 (12.2%) |
| $25,000 to $49,999 | 1,813 (90.1%) | 200 (9.9%) |
| $50,000 to $74,999 | 1,681 (95.3%) | 83 (4.7%) |
| $75,000 to $99,999 | 1,469 (98.1%) | 29 (1.9%) |
| $100,000 and over | 3,412 (96.7%) | 117 (3.3%) |
Public vs Private Health Insurance Coverage by Age in Fairmont
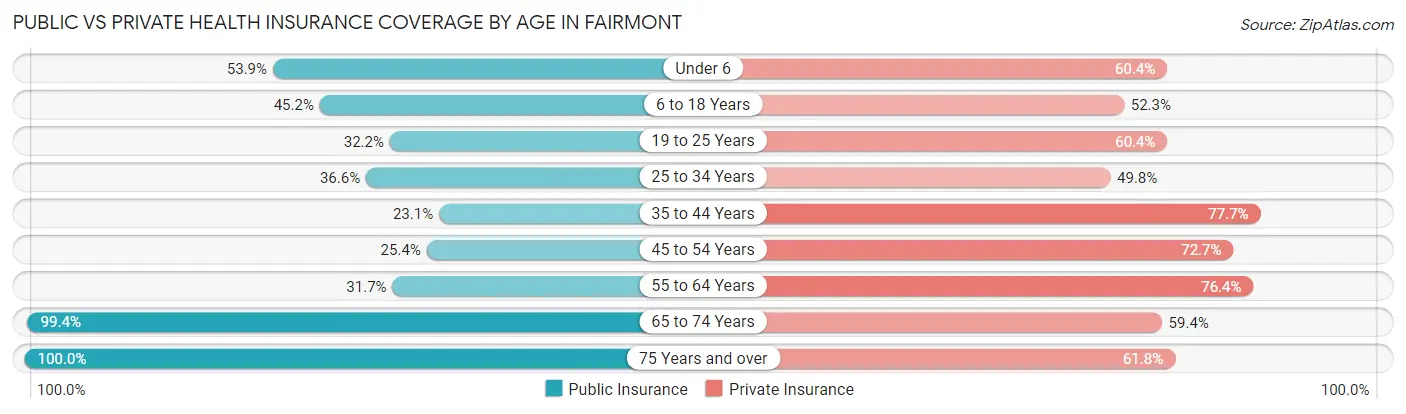
| Age Bracket | Public Insurance | Private Insurance |
| Under 6 | 392 (53.9%) | 439 (60.4%) |
| 6 to 18 Years | 762 (45.2%) | 882 (52.3%) |
| 19 to 25 Years | 153 (32.2%) | 287 (60.4%) |
| 25 to 34 Years | 370 (36.6%) | 503 (49.8%) |
| 35 to 44 Years | 268 (23.1%) | 902 (77.7%) |
| 45 to 54 Years | 309 (25.4%) | 885 (72.7%) |
| 55 to 64 Years | 568 (31.7%) | 1,367 (76.4%) |
| 65 to 74 Years | 1,045 (99.4%) | 624 (59.4%) |
| 75 Years and over | 1,182 (100.0%) | 731 (61.8%) |
| Total | 5,049 (49.0%) | 6,620 (64.3%) |
Disability Status by Sex by Age in Fairmont
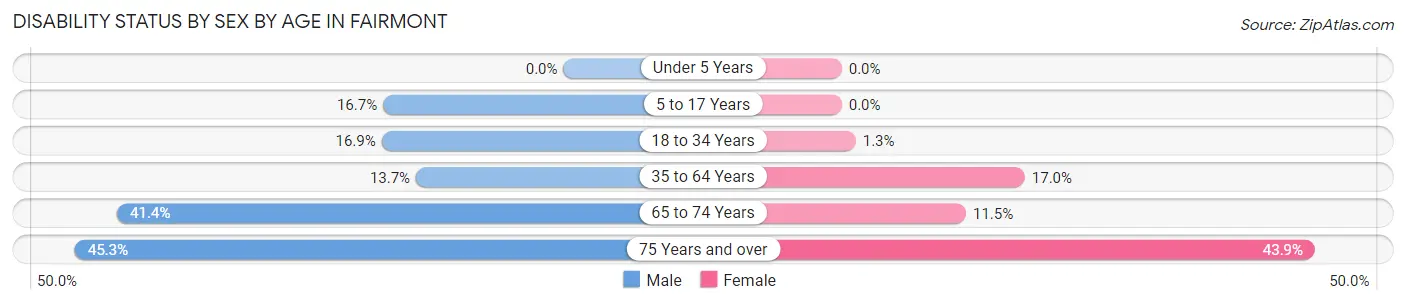
| Age Bracket | Male | Female |
| Under 5 Years | 0 (0.0%) | 0 (0.0%) |
| 5 to 17 Years | 147 (16.7%) | 0 (0.0%) |
| 18 to 34 Years | 153 (16.9%) | 10 (1.3%) |
| 35 to 64 Years | 282 (13.7%) | 358 (17.0%) |
| 65 to 74 Years | 227 (41.4%) | 58 (11.5%) |
| 75 Years and over | 224 (45.3%) | 302 (43.9%) |
Disability Class by Sex by Age in Fairmont
Disability Class: Hearing Difficulty
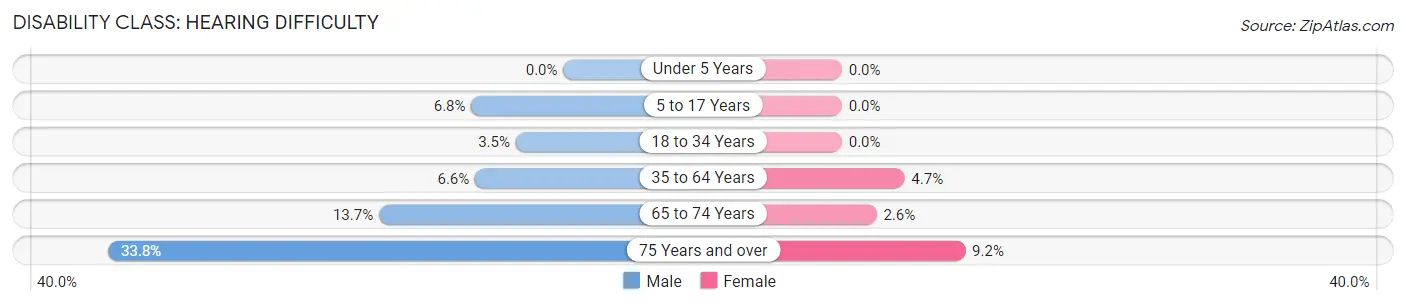
| Age Bracket | Male | Female |
| Under 5 Years | 0 (0.0%) | 0 (0.0%) |
| 5 to 17 Years | 60 (6.8%) | 0 (0.0%) |
| 18 to 34 Years | 32 (3.5%) | 0 (0.0%) |
| 35 to 64 Years | 135 (6.6%) | 98 (4.6%) |
| 65 to 74 Years | 75 (13.7%) | 13 (2.6%) |
| 75 Years and over | 167 (33.8%) | 63 (9.2%) |
Disability Class: Vision Difficulty
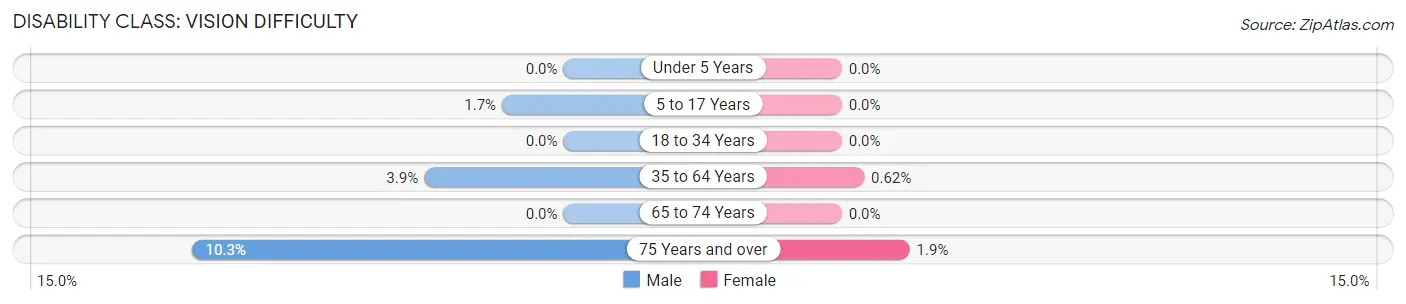
| Age Bracket | Male | Female |
| Under 5 Years | 0 (0.0%) | 0 (0.0%) |
| 5 to 17 Years | 15 (1.7%) | 0 (0.0%) |
| 18 to 34 Years | 0 (0.0%) | 0 (0.0%) |
| 35 to 64 Years | 80 (3.9%) | 13 (0.6%) |
| 65 to 74 Years | 0 (0.0%) | 0 (0.0%) |
| 75 Years and over | 51 (10.3%) | 13 (1.9%) |
Disability Class: Cognitive Difficulty
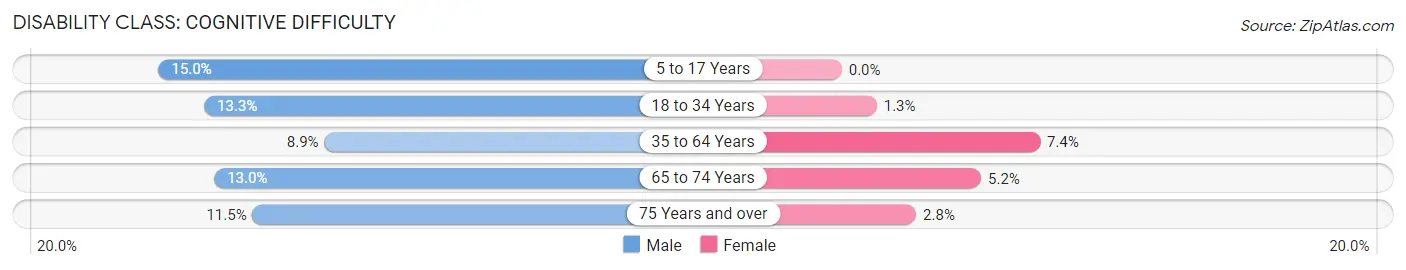
| Age Bracket | Male | Female |
| 5 to 17 Years | 132 (15.0%) | 0 (0.0%) |
| 18 to 34 Years | 121 (13.3%) | 10 (1.3%) |
| 35 to 64 Years | 183 (8.9%) | 155 (7.4%) |
| 65 to 74 Years | 71 (13.0%) | 26 (5.2%) |
| 75 Years and over | 57 (11.5%) | 19 (2.8%) |
Disability Class: Ambulatory Difficulty
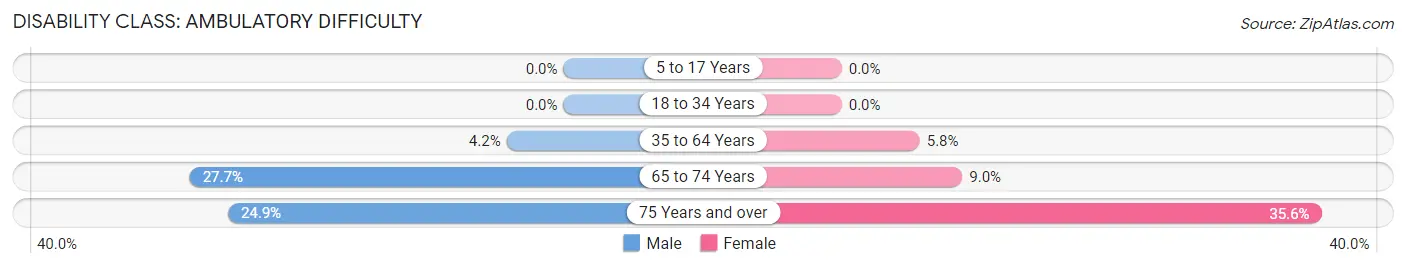
| Age Bracket | Male | Female |
| 5 to 17 Years | 0 (0.0%) | 0 (0.0%) |
| 18 to 34 Years | 0 (0.0%) | 0 (0.0%) |
| 35 to 64 Years | 87 (4.2%) | 122 (5.8%) |
| 65 to 74 Years | 152 (27.7%) | 45 (8.9%) |
| 75 Years and over | 123 (24.9%) | 245 (35.6%) |
Disability Class: Self-Care Difficulty
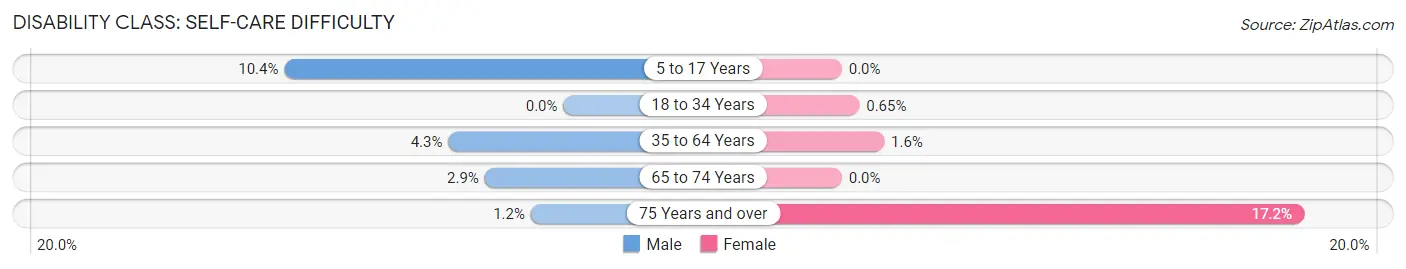
| Age Bracket | Male | Female |
| 5 to 17 Years | 91 (10.4%) | 0 (0.0%) |
| 18 to 34 Years | 0 (0.0%) | 5 (0.6%) |
| 35 to 64 Years | 88 (4.3%) | 33 (1.6%) |
| 65 to 74 Years | 16 (2.9%) | 0 (0.0%) |
| 75 Years and over | 6 (1.2%) | 118 (17.2%) |
Technology Access in Fairmont
Computing Device Access in Fairmont
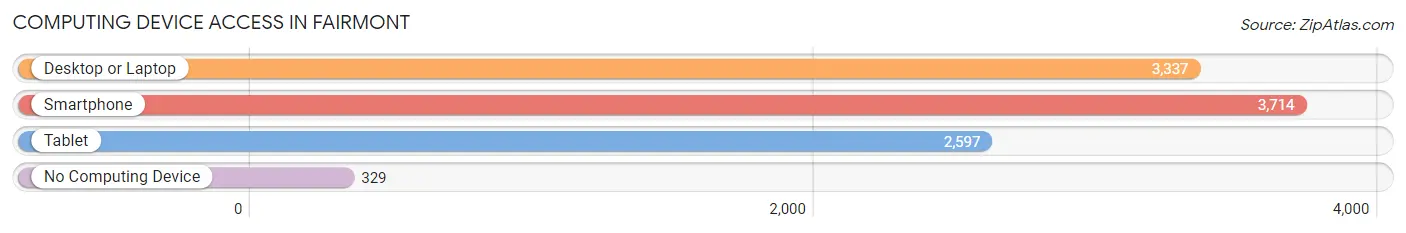
| Device Type | # Households | % Households |
| Desktop or Laptop | 3,337 | 70.3% |
| Smartphone | 3,714 | 78.2% |
| Tablet | 2,597 | 54.7% |
| No Computing Device | 329 | 6.9% |
| Total | 4,750 | 100.0% |
Internet Access in Fairmont
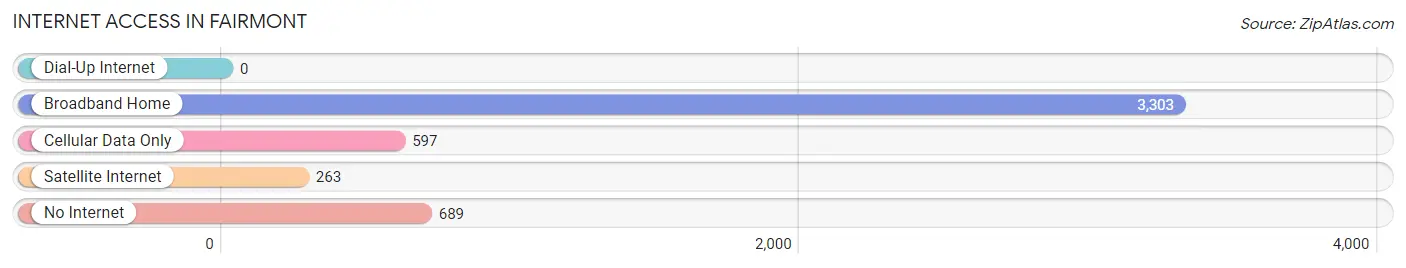
| Internet Type | # Households | % Households |
| Dial-Up Internet | 0 | 0.0% |
| Broadband Home | 3,303 | 69.5% |
| Cellular Data Only | 597 | 12.6% |
| Satellite Internet | 263 | 5.5% |
| No Internet | 689 | 14.5% |
| Total | 4,750 | 100.0% |
Fairmont Summary
History
The city of Fairmont, Minnesota is located in the south-central part of the state, in Martin County. It is situated on the shores of Hall Lake and is the county seat. The city was founded in 1857 and was originally known as Lake Sallie. The name was changed to Fairmont in 1876, after the Fairmont Coal Company, which had been established in the area.
The city was originally a small farming community, but it began to grow in the late 19th century when the railroad arrived. This allowed for the development of the coal industry, which was the main source of employment for the city. The coal industry also led to the development of other industries, such as brick making and lumbering.
The city continued to grow throughout the 20th century, and by the 1950s, it had become a major industrial center. The city was home to several large factories, including a sugar beet processing plant, a canning factory, and a flour mill. The city also had a thriving retail sector, with several department stores and other businesses.
Geography
Fairmont is located in south-central Minnesota, in Martin County. It is situated on the shores of Hall Lake, which is part of the Des Moines River watershed. The city is located at the intersection of Interstate 90 and U.S. Highway 15.
The city has a total area of 8.3 square miles, of which 8.2 square miles is land and 0.1 square miles is water. The terrain is mostly flat, with some rolling hills in the northern part of the city. The climate is humid continental, with cold winters and hot, humid summers.
Economy
Fairmont’s economy is largely based on manufacturing and agriculture. The city is home to several large factories, including a sugar beet processing plant, a canning factory, and a flour mill. The city also has a thriving retail sector, with several department stores and other businesses.
Agriculture is also an important part of the local economy. The city is located in an area known as the “Corn Belt,” and corn is the main crop grown in the area. Other crops grown in the area include soybeans, wheat, and hay.
Demographics
As of the 2010 census, the population of Fairmont was 10,666. The racial makeup of the city was 92.3% White, 2.3% African American, 0.4% Native American, 0.7% Asian, 0.1% Pacific Islander, 2.7% from other races, and 1.5% from two or more races. Hispanic or Latino of any race were 5.2% of the population.
The median household income in Fairmont was $45,945, and the median family income was $54,945. The per capita income was $22,845. About 8.3% of families and 11.2% of the population were below the poverty line, including 15.2% of those under age 18 and 8.2% of those age 65 or over.
Common Questions
What is Per Capita Income in Fairmont?
Per Capita income in Fairmont is $35,114.
What is the Median Family Income in Fairmont?
Median Family Income in Fairmont is $83,900.
What is the Median Household income in Fairmont?
Median Household Income in Fairmont is $56,744.
What is Income or Wage Gap in Fairmont?
Income or Wage Gap in Fairmont is 21.3%.
Women in Fairmont earn 78.7 cents for every dollar earned by a man.
What is Inequality or Gini Index in Fairmont?
Inequality or Gini Index in Fairmont is 0.43.
What is the Total Population of Fairmont?
Total Population of Fairmont is 10,411.
What is the Total Male Population of Fairmont?
Total Male Population of Fairmont is 5,225.
What is the Total Female Population of Fairmont?
Total Female Population of Fairmont is 5,186.
What is the Ratio of Males per 100 Females in Fairmont?
There are 100.75 Males per 100 Females in Fairmont.
What is the Ratio of Females per 100 Males in Fairmont?
There are 99.25 Females per 100 Males in Fairmont.
What is the Median Population Age in Fairmont?
Median Population Age in Fairmont is 46.0 Years.
What is the Average Family Size in Fairmont
Average Family Size in Fairmont is 2.8 People.
What is the Average Household Size in Fairmont
Average Household Size in Fairmont is 2.1 People.
How Large is the Labor Force in Fairmont?
There are 5,455 People in the Labor Forcein in Fairmont.
What is the Percentage of People in the Labor Force in Fairmont?
65.4% of People are in the Labor Force in Fairmont.
What is the Unemployment Rate in Fairmont?
Unemployment Rate in Fairmont is 5.3%.