West Concord, MN Map & Demographics
West Concord Map
West Concord Overview
$32,190
PER CAPITA INCOME
$83,750
AVG FAMILY INCOME
$75,625
AVG HOUSEHOLD INCOME
30.0%
WAGE / INCOME GAP [ % ]
70.0¢/ $1
WAGE / INCOME GAP [ $ ]
0.38
INEQUALITY / GINI INDEX
873
TOTAL POPULATION
458
MALE POPULATION
415
FEMALE POPULATION
110.36
MALES / 100 FEMALES
90.61
FEMALES / 100 MALES
32.9
MEDIAN AGE
3.4
AVG FAMILY SIZE
2.6
AVG HOUSEHOLD SIZE
393
LABOR FORCE [ PEOPLE ]
58.6%
PERCENT IN LABOR FORCE
4.8%
UNEMPLOYMENT RATE
West Concord Zip Codes
West Concord Area Codes
Income in West Concord
Income Overview in West Concord
Per Capita Income in West Concord is $32,190, while median incomes of families and households are $83,750 and $75,625 respectively.
| Characteristic | Number | Measure |
| Per Capita Income | 873 | $32,190 |
| Median Family Income | 188 | $83,750 |
| Mean Family Income | 188 | $86,614 |
| Median Household Income | 327 | $75,625 |
| Mean Household Income | 327 | $84,574 |
| Income Deficit | 188 | $0 |
| Wage / Income Gap (%) | 873 | 30.00% |
| Wage / Income Gap ($) | 873 | 70.00¢ per $1 |
| Gini / Inequality Index | 873 | 0.38 |
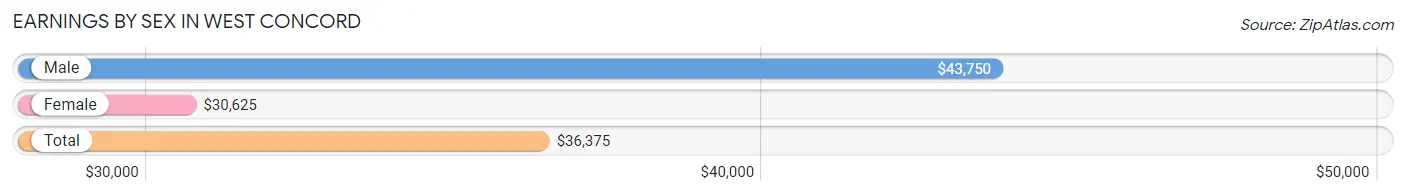
Earnings by Sex in West Concord
Average Earnings in West Concord are $36,375, $43,750 for men and $30,625 for women, a difference of 30.0%.
| Sex | Number | Average Earnings |
| Male | 289 (61.8%) | $43,750 |
| Female | 179 (38.3%) | $30,625 |
| Total | 468 (100.0%) | $36,375 |
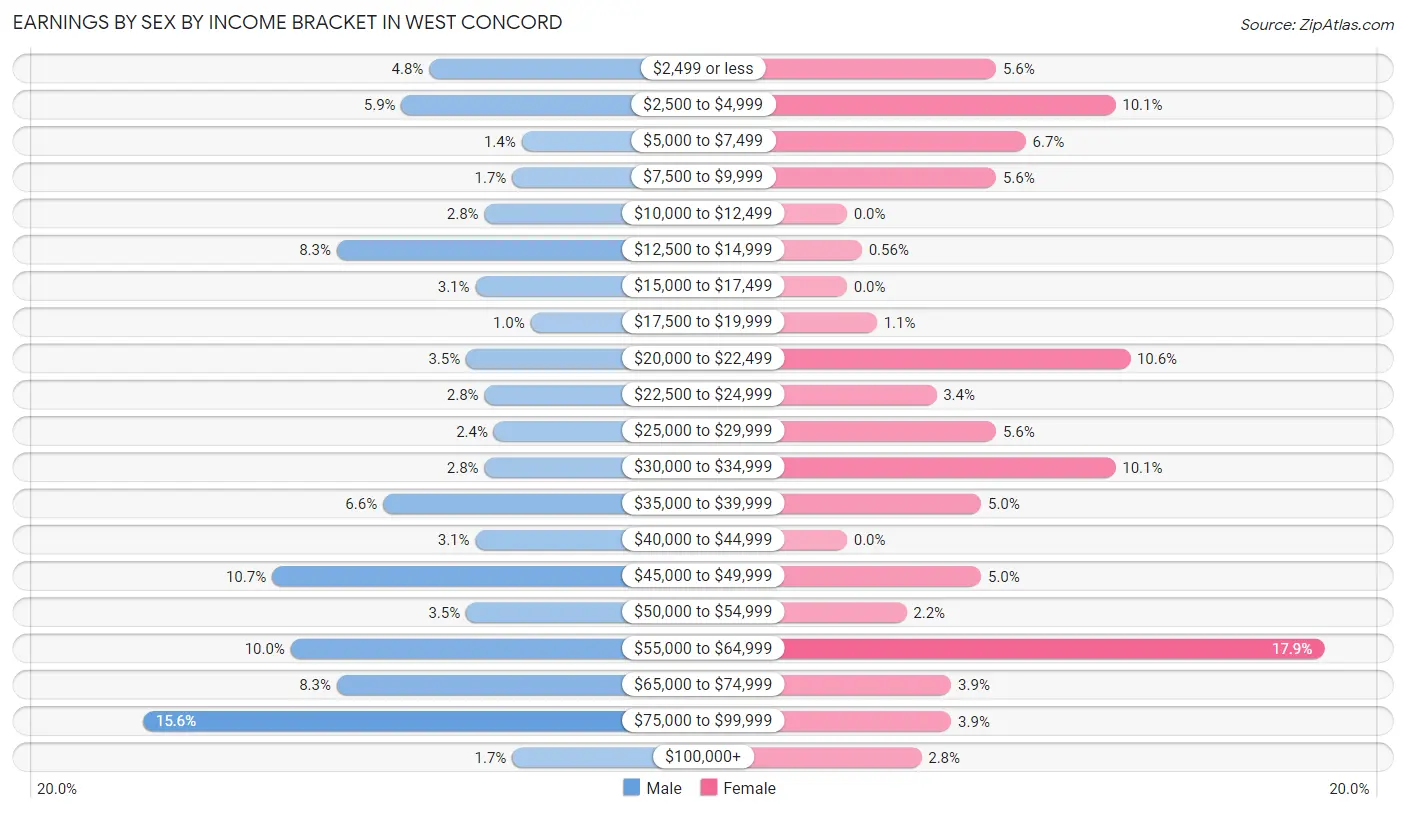
Earnings by Sex by Income Bracket in West Concord
The most common earnings brackets in West Concord are $75,000 to $99,999 for men (45 | 15.6%) and $55,000 to $64,999 for women (32 | 17.9%).
| Income | Male | Female |
| $2,499 or less | 14 (4.8%) | 10 (5.6%) |
| $2,500 to $4,999 | 17 (5.9%) | 18 (10.1%) |
| $5,000 to $7,499 | 4 (1.4%) | 12 (6.7%) |
| $7,500 to $9,999 | 5 (1.7%) | 10 (5.6%) |
| $10,000 to $12,499 | 8 (2.8%) | 0 (0.0%) |
| $12,500 to $14,999 | 24 (8.3%) | 1 (0.6%) |
| $15,000 to $17,499 | 9 (3.1%) | 0 (0.0%) |
| $17,500 to $19,999 | 3 (1.0%) | 2 (1.1%) |
| $20,000 to $22,499 | 10 (3.5%) | 19 (10.6%) |
| $22,500 to $24,999 | 8 (2.8%) | 6 (3.4%) |
| $25,000 to $29,999 | 7 (2.4%) | 10 (5.6%) |
| $30,000 to $34,999 | 8 (2.8%) | 18 (10.1%) |
| $35,000 to $39,999 | 19 (6.6%) | 9 (5.0%) |
| $40,000 to $44,999 | 9 (3.1%) | 0 (0.0%) |
| $45,000 to $49,999 | 31 (10.7%) | 9 (5.0%) |
| $50,000 to $54,999 | 10 (3.5%) | 4 (2.2%) |
| $55,000 to $64,999 | 29 (10.0%) | 32 (17.9%) |
| $65,000 to $74,999 | 24 (8.3%) | 7 (3.9%) |
| $75,000 to $99,999 | 45 (15.6%) | 7 (3.9%) |
| $100,000+ | 5 (1.7%) | 5 (2.8%) |
| Total | 289 (100.0%) | 179 (100.0%) |
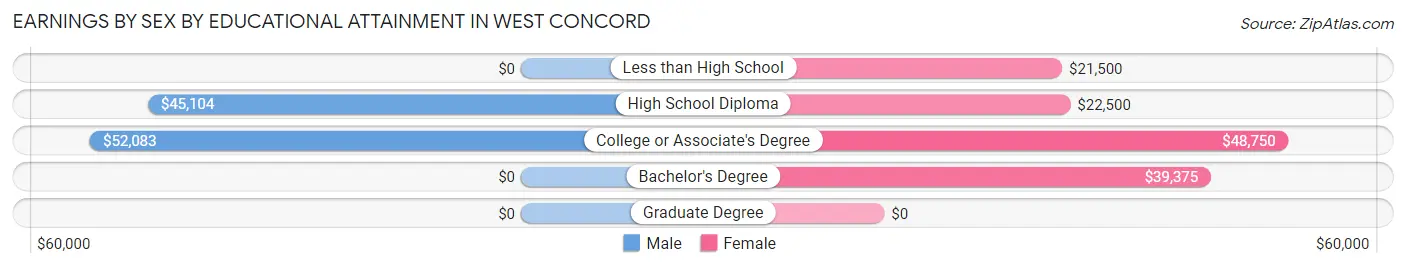
Earnings by Sex by Educational Attainment in West Concord
Average earnings in West Concord are $46,719 for men and $33,854 for women, a difference of 27.5%. Men with an educational attainment of college or associate's degree enjoy the highest average annual earnings of $52,083, while those with high school diploma education earn the least with $45,104. Women with an educational attainment of college or associate's degree earn the most with the average annual earnings of $48,750, while those with less than high school education have the smallest earnings of $21,500.
| Educational Attainment | Male Income | Female Income |
| Less than High School | - | - |
| High School Diploma | $45,104 | $22,500 |
| College or Associate's Degree | $52,083 | $48,750 |
| Bachelor's Degree | - | - |
| Graduate Degree | - | - |
| Total | $46,719 | $33,854 |
Family Income in West Concord
Family Income Brackets in West Concord
According to the West Concord family income data, there are 54 families falling into the $100,000 to $149,999 income range, which is the most common income bracket and makes up 28.7% of all families.
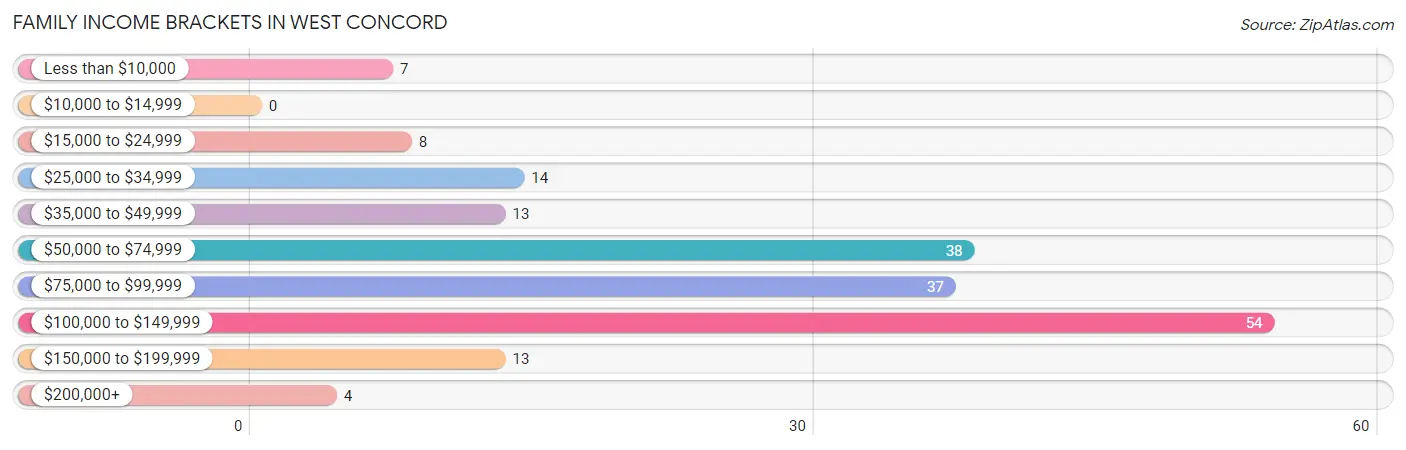
| Income Bracket | # Families | % Families |
| Less than $10,000 | 7 | 3.7% |
| $10,000 to $14,999 | 0 | 0.0% |
| $15,000 to $24,999 | 8 | 4.3% |
| $25,000 to $34,999 | 14 | 7.4% |
| $35,000 to $49,999 | 13 | 6.9% |
| $50,000 to $74,999 | 38 | 20.2% |
| $75,000 to $99,999 | 37 | 19.7% |
| $100,000 to $149,999 | 54 | 28.7% |
| $150,000 to $199,999 | 13 | 6.9% |
| $200,000+ | 4 | 2.1% |
Family Income by Famaliy Size in West Concord
2-person families (89 | 47.3%) account for the highest median family income in West Concord with $100,375 per family, while 2-person families (89 | 47.3%) have the highest median income of $50,188 per family member.
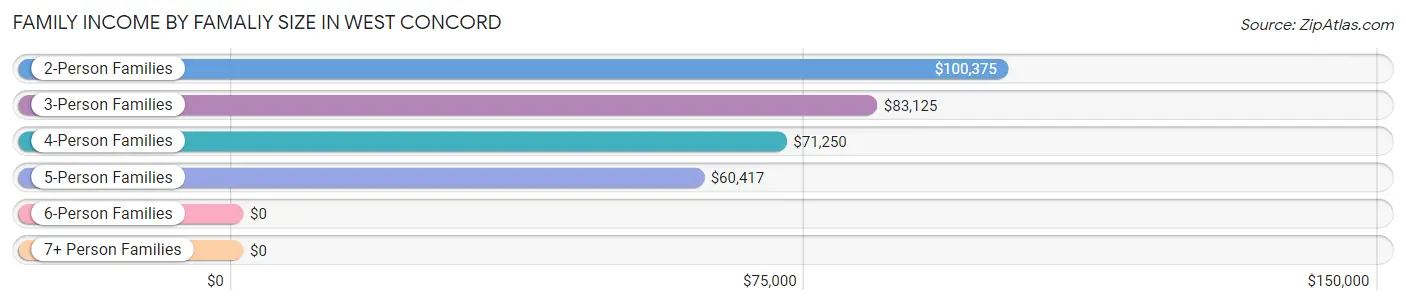
| Income Bracket | # Families | Median Income |
| 2-Person Families | 89 (47.3%) | $100,375 |
| 3-Person Families | 31 (16.5%) | $83,125 |
| 4-Person Families | 26 (13.8%) | $71,250 |
| 5-Person Families | 29 (15.4%) | $60,417 |
| 6-Person Families | 10 (5.3%) | $0 |
| 7+ Person Families | 3 (1.6%) | $0 |
| Total | 188 (100.0%) | $83,750 |
Family Income by Number of Earners in West Concord
The median family income in West Concord is $83,750, with families comprising 3+ earners (16) having the highest median family income of $151,250, while families with 1 earner (69) have the lowest median family income of $58,472, accounting for 8.5% and 36.7% of families, respectively.
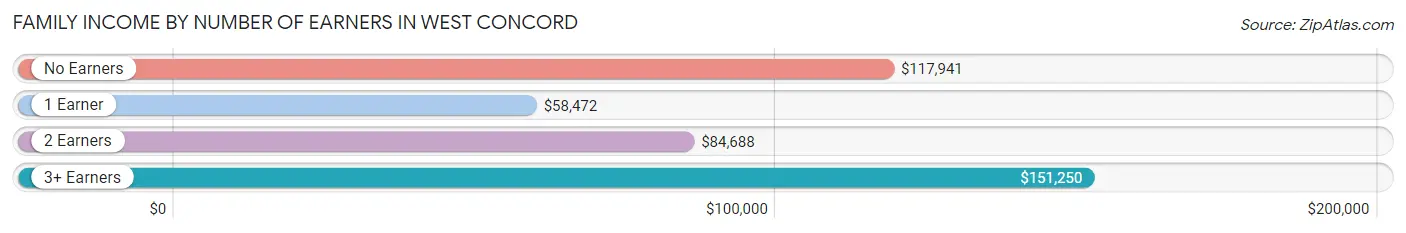
| Number of Earners | # Families | Median Income |
| No Earners | 28 (14.9%) | $117,941 |
| 1 Earner | 69 (36.7%) | $58,472 |
| 2 Earners | 75 (39.9%) | $84,688 |
| 3+ Earners | 16 (8.5%) | $151,250 |
| Total | 188 (100.0%) | $83,750 |
Household Income in West Concord
Household Income Brackets in West Concord
With 77 households falling in the category, the $75,000 to $99,999 income range is the most frequent in West Concord, accounting for 23.5% of all households. In contrast, only 8 households (2.5%) fall into the $10,000 to $14,999 income bracket, making it the least populous group.
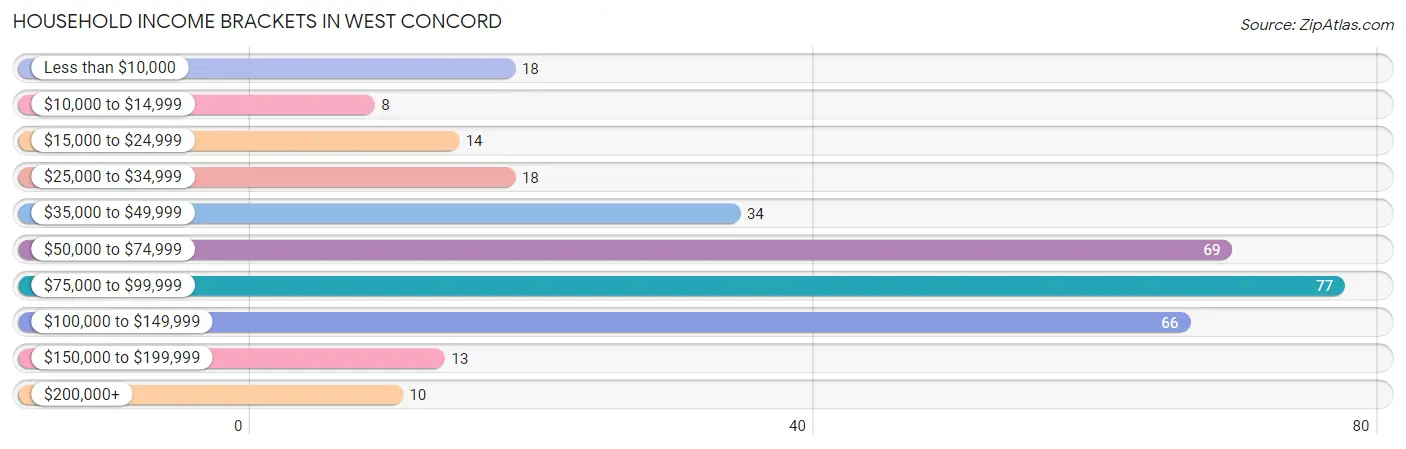
| Income Bracket | # Households | % Households |
| Less than $10,000 | 18 | 5.5% |
| $10,000 to $14,999 | 8 | 2.4% |
| $15,000 to $24,999 | 14 | 4.3% |
| $25,000 to $34,999 | 18 | 5.5% |
| $35,000 to $49,999 | 34 | 10.4% |
| $50,000 to $74,999 | 69 | 21.1% |
| $75,000 to $99,999 | 77 | 23.5% |
| $100,000 to $149,999 | 66 | 20.2% |
| $150,000 to $199,999 | 13 | 4.0% |
| $200,000+ | 10 | 3.1% |
Household Income by Householder Age in West Concord
The median household income in West Concord is $75,625, with the highest median household income of $83,125 found in the 45 to 64 years age bracket for the primary householder. A total of 107 households (32.7%) fall into this category. Meanwhile, the 15 to 24 years age bracket for the primary householder has the lowest median household income of $0, with 5 households (1.5%) in this group.
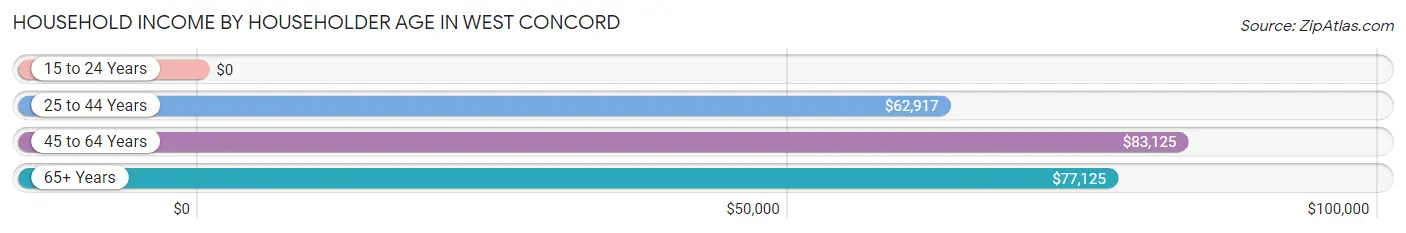
| Income Bracket | # Households | Median Income |
| 15 to 24 Years | 5 (1.5%) | $0 |
| 25 to 44 Years | 142 (43.4%) | $62,917 |
| 45 to 64 Years | 107 (32.7%) | $83,125 |
| 65+ Years | 73 (22.3%) | $77,125 |
| Total | 327 (100.0%) | $75,625 |
Poverty in West Concord
Income Below Poverty by Sex and Age in West Concord
With 18.8% poverty level for males and 8.2% for females among the residents of West Concord, 6 to 11 year old males and under 5 year old females are the most vulnerable to poverty, with 16 males (34.8%) and 6 females (27.3%) in their respective age groups living below the poverty level.
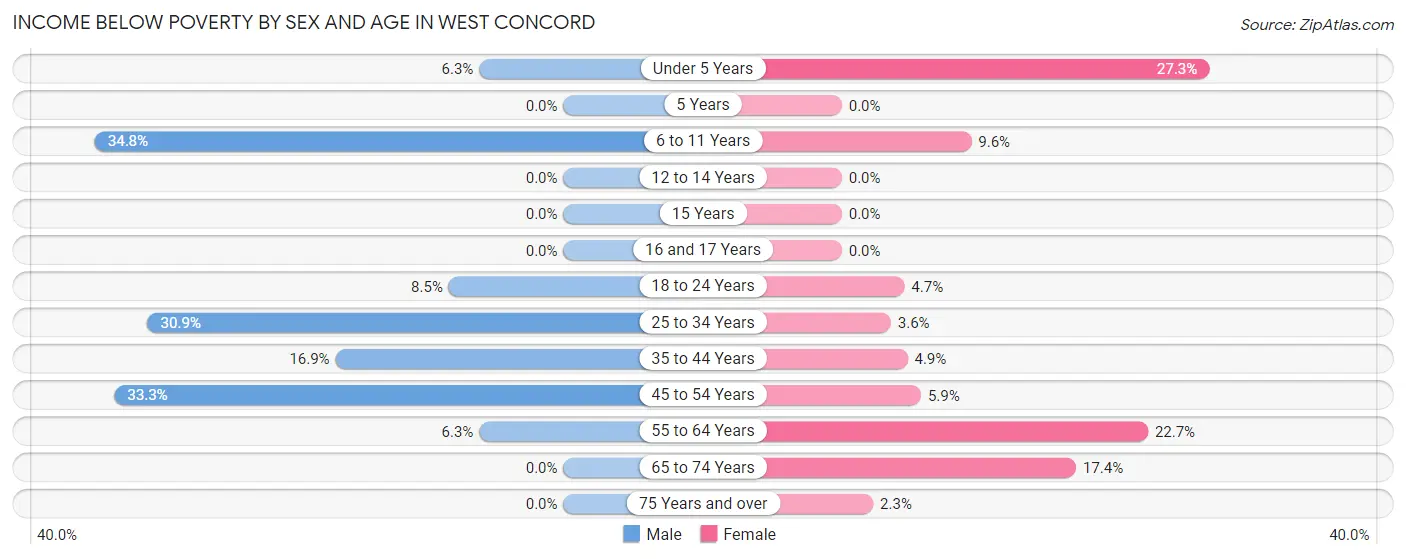
| Age Bracket | Male | Female |
| Under 5 Years | 1 (6.2%) | 6 (27.3%) |
| 5 Years | 0 (0.0%) | 0 (0.0%) |
| 6 to 11 Years | 16 (34.8%) | 5 (9.6%) |
| 12 to 14 Years | 0 (0.0%) | 0 (0.0%) |
| 15 Years | 0 (0.0%) | 0 (0.0%) |
| 16 and 17 Years | 0 (0.0%) | 0 (0.0%) |
| 18 to 24 Years | 4 (8.5%) | 2 (4.6%) |
| 25 to 34 Years | 25 (30.9%) | 2 (3.6%) |
| 35 to 44 Years | 11 (16.9%) | 2 (4.9%) |
| 45 to 54 Years | 27 (33.3%) | 2 (5.9%) |
| 55 to 64 Years | 2 (6.2%) | 10 (22.7%) |
| 65 to 74 Years | 0 (0.0%) | 4 (17.4%) |
| 75 Years and over | 0 (0.0%) | 1 (2.3%) |
| Total | 86 (18.8%) | 34 (8.2%) |
Income Above Poverty by Sex and Age in West Concord
According to the poverty statistics in West Concord, males aged 5 years and females aged 5 years are the age groups that are most secure financially, with 100.0% of males and 100.0% of females in these age groups living above the poverty line.
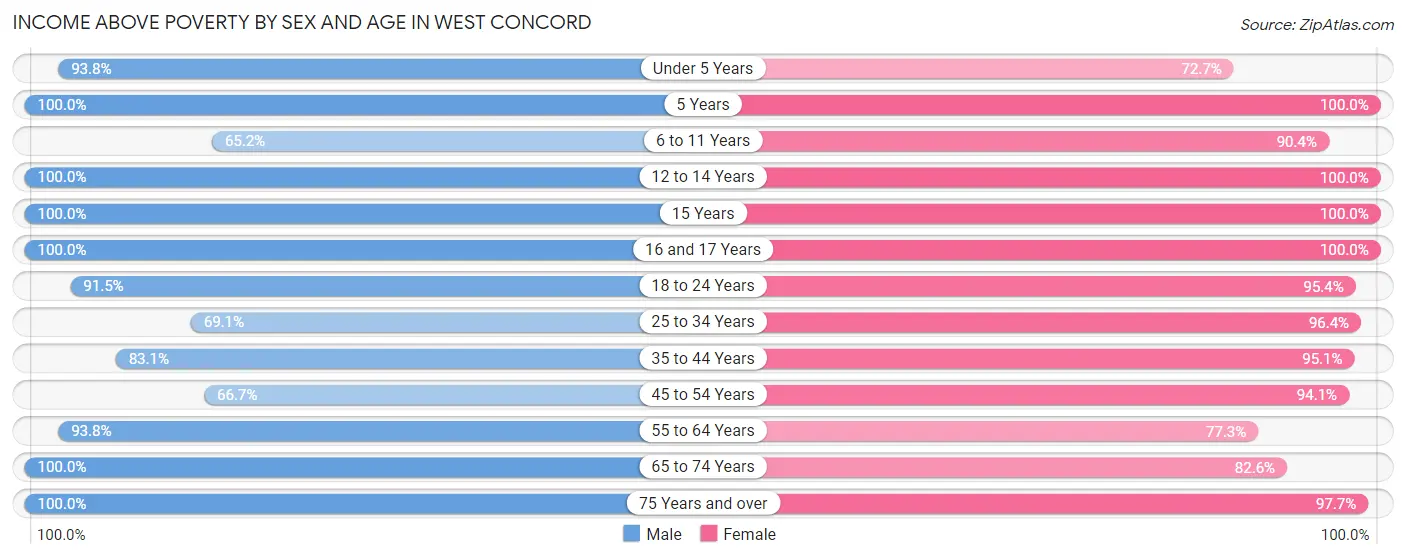
| Age Bracket | Male | Female |
| Under 5 Years | 15 (93.8%) | 16 (72.7%) |
| 5 Years | 9 (100.0%) | 5 (100.0%) |
| 6 to 11 Years | 30 (65.2%) | 47 (90.4%) |
| 12 to 14 Years | 11 (100.0%) | 27 (100.0%) |
| 15 Years | 2 (100.0%) | 10 (100.0%) |
| 16 and 17 Years | 21 (100.0%) | 14 (100.0%) |
| 18 to 24 Years | 43 (91.5%) | 41 (95.4%) |
| 25 to 34 Years | 56 (69.1%) | 53 (96.4%) |
| 35 to 44 Years | 54 (83.1%) | 39 (95.1%) |
| 45 to 54 Years | 54 (66.7%) | 32 (94.1%) |
| 55 to 64 Years | 30 (93.8%) | 34 (77.3%) |
| 65 to 74 Years | 21 (100.0%) | 19 (82.6%) |
| 75 Years and over | 26 (100.0%) | 42 (97.7%) |
| Total | 372 (81.2%) | 379 (91.8%) |
Income Below Poverty Among Married-Couple Families in West Concord
The poverty statistics for married-couple families in West Concord show that 4.9% or 7 of the total 144 families live below the poverty line. Families with 1 or 2 children have the highest poverty rate of 18.9%, comprising of 7 families. On the other hand, families with no children have the lowest poverty rate of 0.0%, which includes 0 families.
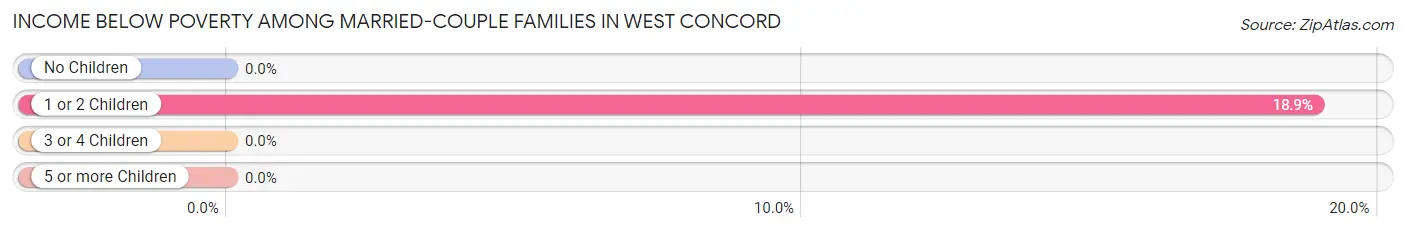
| Children | Above Poverty | Below Poverty |
| No Children | 87 (100.0%) | 0 (0.0%) |
| 1 or 2 Children | 30 (81.1%) | 7 (18.9%) |
| 3 or 4 Children | 17 (100.0%) | 0 (0.0%) |
| 5 or more Children | 3 (100.0%) | 0 (0.0%) |
| Total | 137 (95.1%) | 7 (4.9%) |
Income Below Poverty Among Single-Parent Households in West Concord
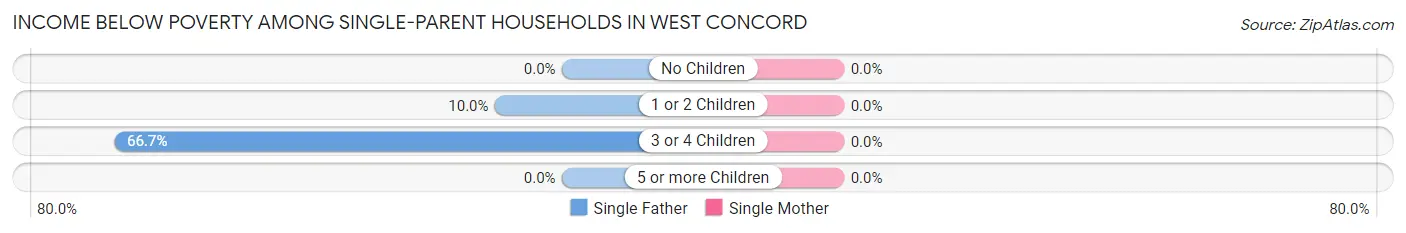
| Children | Single Father | Single Mother |
| No Children | 0 (0.0%) | 0 (0.0%) |
| 1 or 2 Children | 1 (10.0%) | 0 (0.0%) |
| 3 or 4 Children | 6 (66.7%) | 0 (0.0%) |
| 5 or more Children | 0 (0.0%) | 0 (0.0%) |
| Total | 7 (28.0%) | 0 (0.0%) |
Income Below Poverty Among Married-Couple vs Single-Parent Households in West Concord
The poverty data for West Concord shows that 7 of the married-couple family households (4.9%) and 7 of the single-parent households (15.9%) are living below the poverty level. Within the married-couple family households, those with 1 or 2 children have the highest poverty rate, with 7 households (18.9%) falling below the poverty line. Among the single-parent households, those with 3 or 4 children have the highest poverty rate, with 6 household (66.7%) living below poverty.
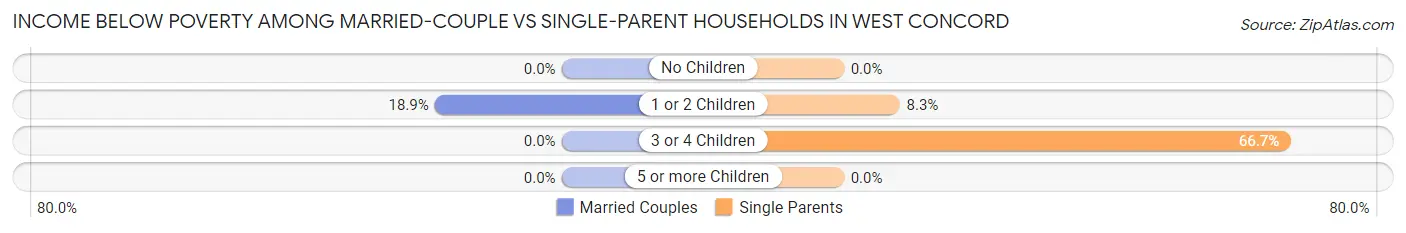
| Children | Married-Couple Families | Single-Parent Households |
| No Children | 0 (0.0%) | 0 (0.0%) |
| 1 or 2 Children | 7 (18.9%) | 1 (8.3%) |
| 3 or 4 Children | 0 (0.0%) | 6 (66.7%) |
| 5 or more Children | 0 (0.0%) | 0 (0.0%) |
| Total | 7 (4.9%) | 7 (15.9%) |
Race in West Concord
The most populous races in West Concord are White / Caucasian (739 | 84.7%), Hispanic or Latino (83 | 9.5%), and Some other Race (70 | 8.0%).
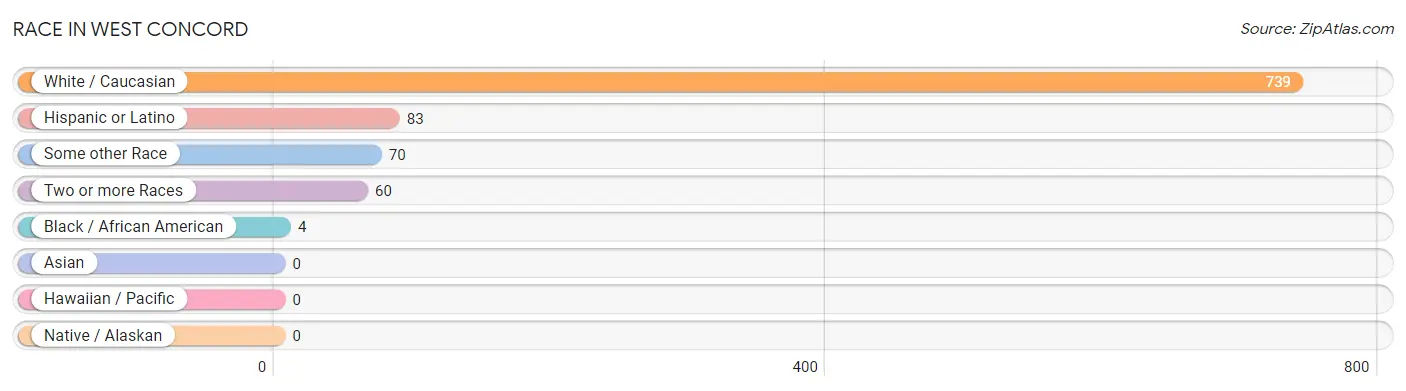
| Race | # Population | % Population |
| Asian | 0 | 0.0% |
| Black / African American | 4 | 0.5% |
| Hawaiian / Pacific | 0 | 0.0% |
| Hispanic or Latino | 83 | 9.5% |
| Native / Alaskan | 0 | 0.0% |
| White / Caucasian | 739 | 84.7% |
| Two or more Races | 60 | 6.9% |
| Some other Race | 70 | 8.0% |
| Total | 873 | 100.0% |
Ancestry in West Concord
The most populous ancestries reported in West Concord are German (292 | 33.5%), Norwegian (117 | 13.4%), English (78 | 8.9%), Irish (69 | 7.9%), and Mexican (63 | 7.2%), together accounting for 70.9% of all West Concord residents.
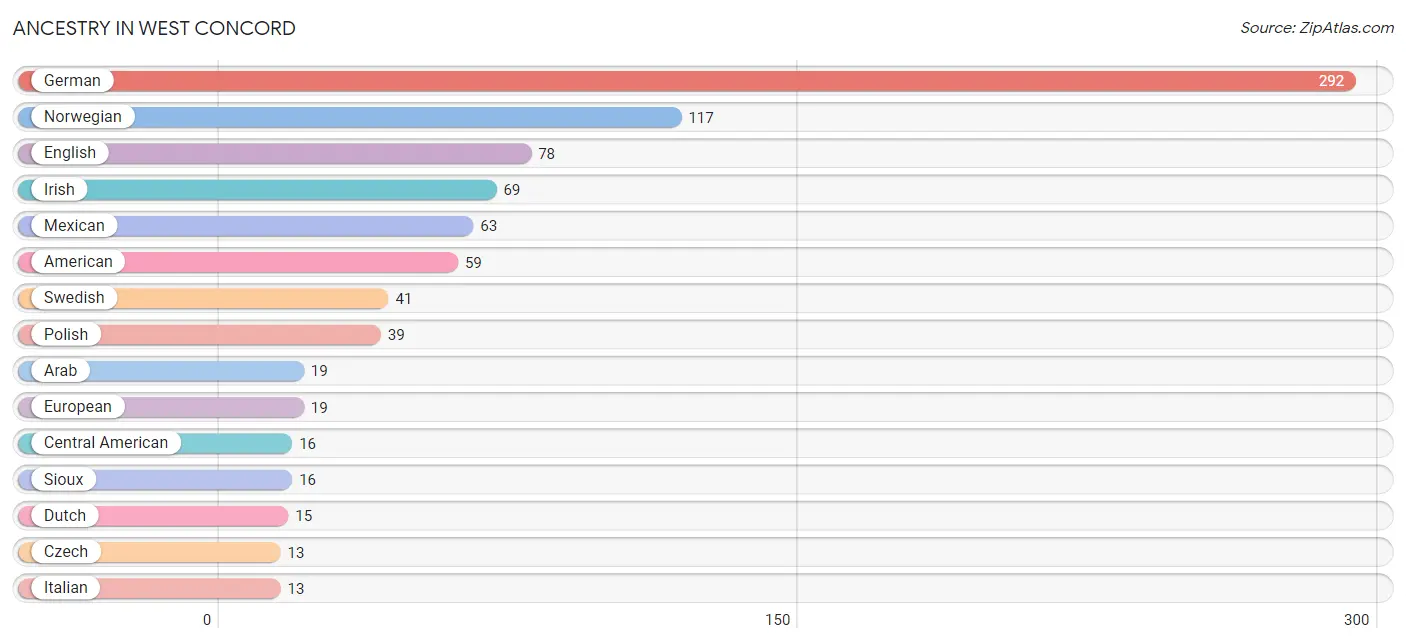
| Ancestry | # Population | % Population |
| American | 59 | 6.8% |
| Arab | 19 | 2.2% |
| Central American | 16 | 1.8% |
| Cherokee | 10 | 1.1% |
| Chippewa | 5 | 0.6% |
| Cuban | 1 | 0.1% |
| Czech | 13 | 1.5% |
| Danish | 6 | 0.7% |
| Dutch | 15 | 1.7% |
| Eastern European | 7 | 0.8% |
| English | 78 | 8.9% |
| European | 19 | 2.2% |
| French | 3 | 0.3% |
| French Canadian | 5 | 0.6% |
| German | 292 | 33.5% |
| Guatemalan | 7 | 0.8% |
| Irish | 69 | 7.9% |
| Italian | 13 | 1.5% |
| Lithuanian | 3 | 0.3% |
| Mexican | 63 | 7.2% |
| Norwegian | 117 | 13.4% |
| Polish | 39 | 4.5% |
| Puerto Rican | 2 | 0.2% |
| Salvadoran | 9 | 1.0% |
| Scandinavian | 6 | 0.7% |
| Scottish | 4 | 0.5% |
| Sioux | 16 | 1.8% |
| South African | 3 | 0.3% |
| Subsaharan African | 3 | 0.3% |
| Swedish | 41 | 4.7% |
| Swiss | 4 | 0.5% |
| Ukrainian | 10 | 1.1% | View All 32 Rows |
Immigrants in West Concord
The most numerous immigrant groups reported in West Concord came from Central America (35 | 4.0%), Latin America (35 | 4.0%), Mexico (19 | 2.2%), El Salvador (9 | 1.0%), and Guatemala (7 | 0.8%), together accounting for 12.0% of all West Concord residents.
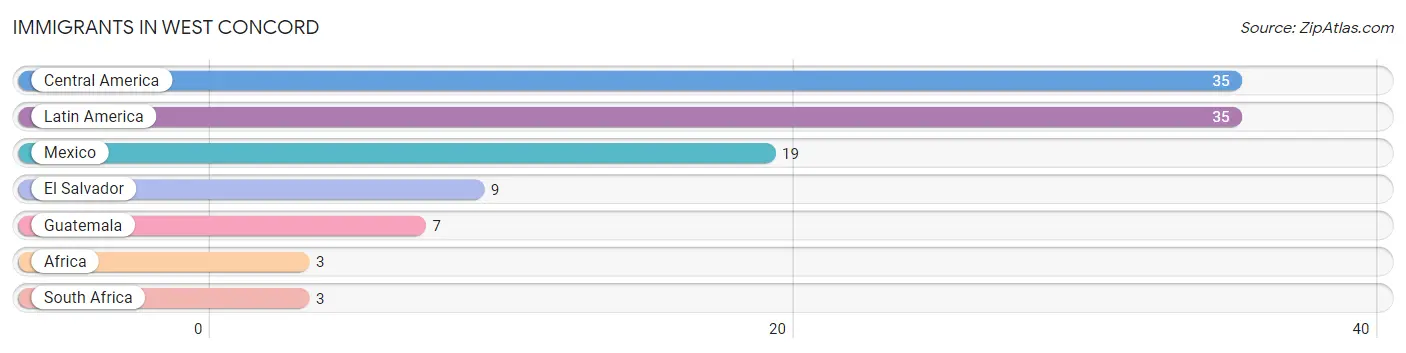
| Immigration Origin | # Population | % Population |
| Africa | 3 | 0.3% |
| Central America | 35 | 4.0% |
| El Salvador | 9 | 1.0% |
| Guatemala | 7 | 0.8% |
| Latin America | 35 | 4.0% |
| Mexico | 19 | 2.2% |
| South Africa | 3 | 0.3% | View All 7 Rows |
Sex and Age in West Concord
Sex and Age in West Concord
The most populous age groups in West Concord are 50 to 54 Years (74 | 16.2%) for men and 5 to 9 Years (43 | 10.4%) for women.
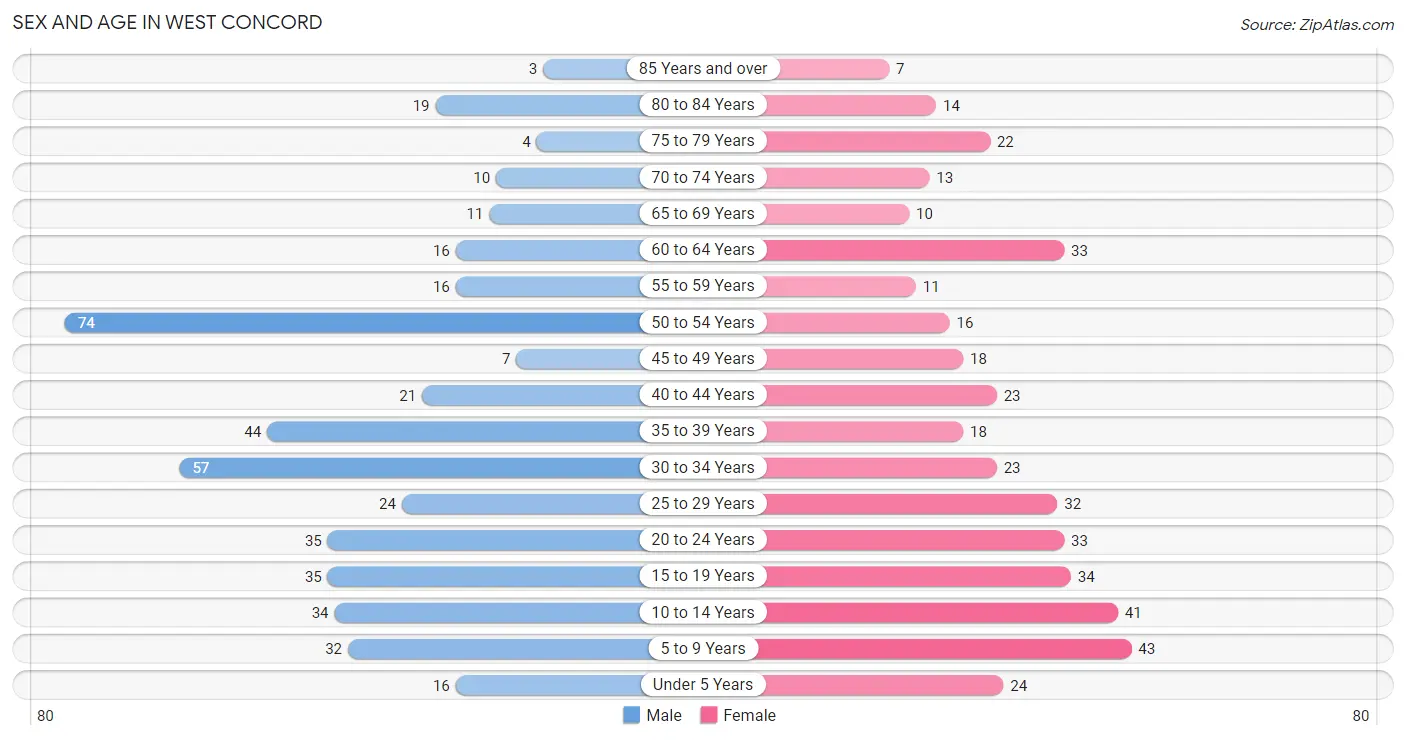
| Age Bracket | Male | Female |
| Under 5 Years | 16 (3.5%) | 24 (5.8%) |
| 5 to 9 Years | 32 (7.0%) | 43 (10.4%) |
| 10 to 14 Years | 34 (7.4%) | 41 (9.9%) |
| 15 to 19 Years | 35 (7.6%) | 34 (8.2%) |
| 20 to 24 Years | 35 (7.6%) | 33 (8.0%) |
| 25 to 29 Years | 24 (5.2%) | 32 (7.7%) |
| 30 to 34 Years | 57 (12.4%) | 23 (5.5%) |
| 35 to 39 Years | 44 (9.6%) | 18 (4.3%) |
| 40 to 44 Years | 21 (4.6%) | 23 (5.5%) |
| 45 to 49 Years | 7 (1.5%) | 18 (4.3%) |
| 50 to 54 Years | 74 (16.2%) | 16 (3.9%) |
| 55 to 59 Years | 16 (3.5%) | 11 (2.6%) |
| 60 to 64 Years | 16 (3.5%) | 33 (8.0%) |
| 65 to 69 Years | 11 (2.4%) | 10 (2.4%) |
| 70 to 74 Years | 10 (2.2%) | 13 (3.1%) |
| 75 to 79 Years | 4 (0.9%) | 22 (5.3%) |
| 80 to 84 Years | 19 (4.2%) | 14 (3.4%) |
| 85 Years and over | 3 (0.7%) | 7 (1.7%) |
| Total | 458 (100.0%) | 415 (100.0%) |
Families and Households in West Concord
Median Family Size in West Concord
The median family size in West Concord is 3.35 persons per family, with single male/father families (25 | 13.3%) accounting for the largest median family size of 4.28 persons per family. On the other hand, married-couple families (144 | 76.6%) represent the smallest median family size with 3.09 persons per family.
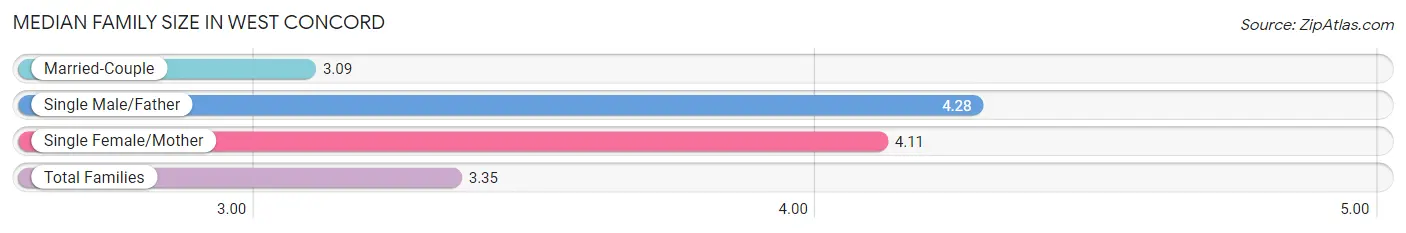
| Family Type | # Families | Family Size |
| Married-Couple | 144 (76.6%) | 3.09 |
| Single Male/Father | 25 (13.3%) | 4.28 |
| Single Female/Mother | 19 (10.1%) | 4.11 |
| Total Families | 188 (100.0%) | 3.35 |
Median Household Size in West Concord
The median household size in West Concord is 2.64 persons per household, with single male/father households (25 | 7.6%) accounting for the largest median household size of 4.96 persons per household. non-family households (139 | 42.5%) represent the smallest median household size with 1.53 persons per household.
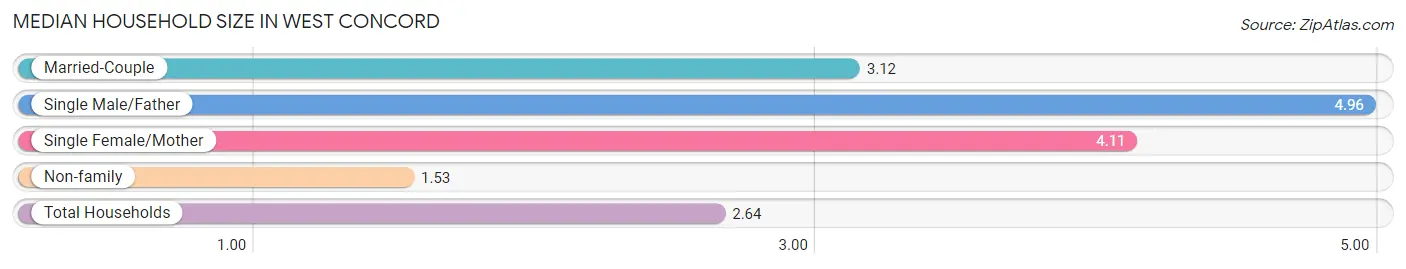
| Household Type | # Households | Household Size |
| Married-Couple | 144 (44.0%) | 3.12 |
| Single Male/Father | 25 (7.6%) | 4.96 |
| Single Female/Mother | 19 (5.8%) | 4.11 |
| Non-family | 139 (42.5%) | 1.53 |
| Total Households | 327 (100.0%) | 2.64 |
Household Size by Marriage Status in West Concord
Out of a total of 327 households in West Concord, 188 (57.5%) are family households, while 139 (42.5%) are nonfamily households. The most numerous type of family households are 2-person households, comprising 85, and the most common type of nonfamily households are 1-person households, comprising 112.
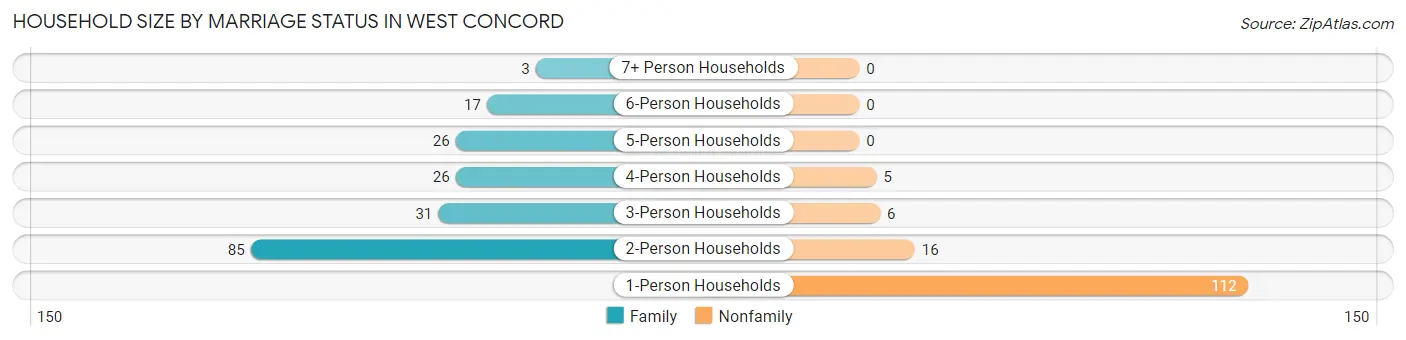
| Household Size | Family Households | Nonfamily Households |
| 1-Person Households | - | 112 (34.3%) |
| 2-Person Households | 85 (26.0%) | 16 (4.9%) |
| 3-Person Households | 31 (9.5%) | 6 (1.8%) |
| 4-Person Households | 26 (8.0%) | 5 (1.5%) |
| 5-Person Households | 26 (8.0%) | 0 (0.0%) |
| 6-Person Households | 17 (5.2%) | 0 (0.0%) |
| 7+ Person Households | 3 (0.9%) | 0 (0.0%) |
| Total | 188 (57.5%) | 139 (42.5%) |
Female Fertility in West Concord
Fertility by Age in West Concord
Average fertility rate in West Concord is 44.0 births per 1,000 women. Women in the age bracket of 20 to 34 years have the highest fertility rate with 91.0 births per 1,000 women. Women in the age bracket of 20 to 34 years acount for 100.0% of all women with births.
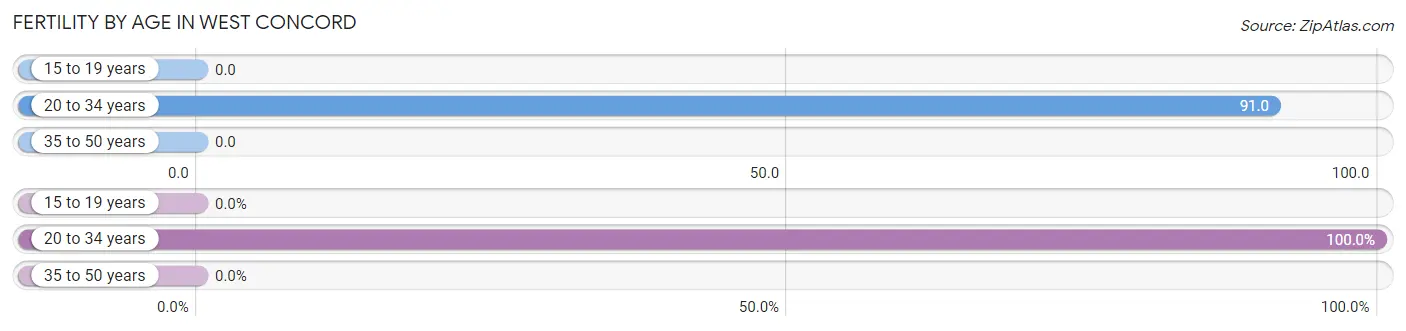
| Age Bracket | Women with Births | Births / 1,000 Women |
| 15 to 19 years | 0 (0.0%) | 0.0 |
| 20 to 34 years | 8 (100.0%) | 91.0 |
| 35 to 50 years | 0 (0.0%) | 0.0 |
| Total | 8 (100.0%) | 44.0 |
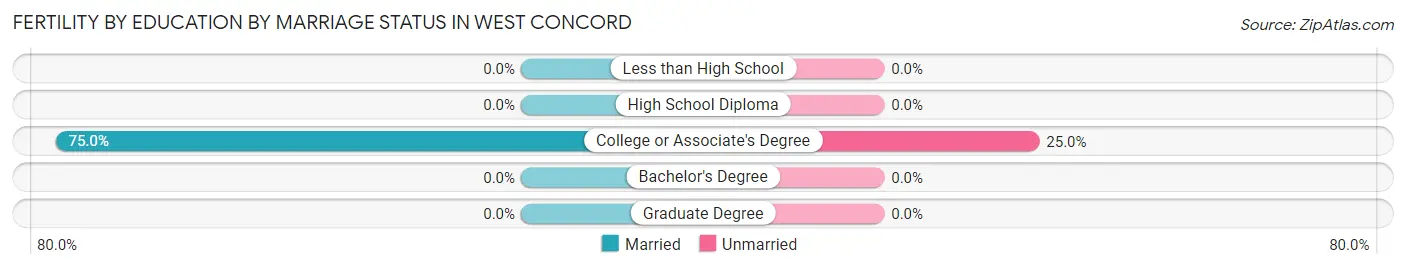
Fertility by Age by Marriage Status in West Concord
75.0% of women with births (8) in West Concord are married. The highest percentage of unmarried women with births falls into 20 to 34 years age bracket with 25.0% of them unmarried at the time of birth, while the lowest percentage of unmarried women with births belong to 20 to 34 years age bracket with 25.0% of them unmarried.
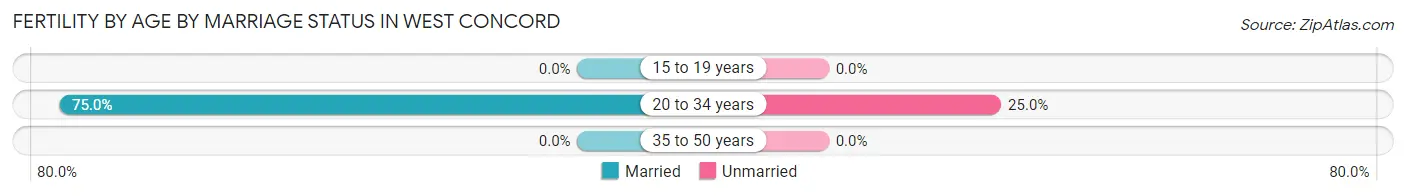
| Age Bracket | Married | Unmarried |
| 15 to 19 years | 0 (0.0%) | 0 (0.0%) |
| 20 to 34 years | 6 (75.0%) | 2 (25.0%) |
| 35 to 50 years | 0 (0.0%) | 0 (0.0%) |
| Total | 6 (75.0%) | 2 (25.0%) |
Fertility by Education in West Concord
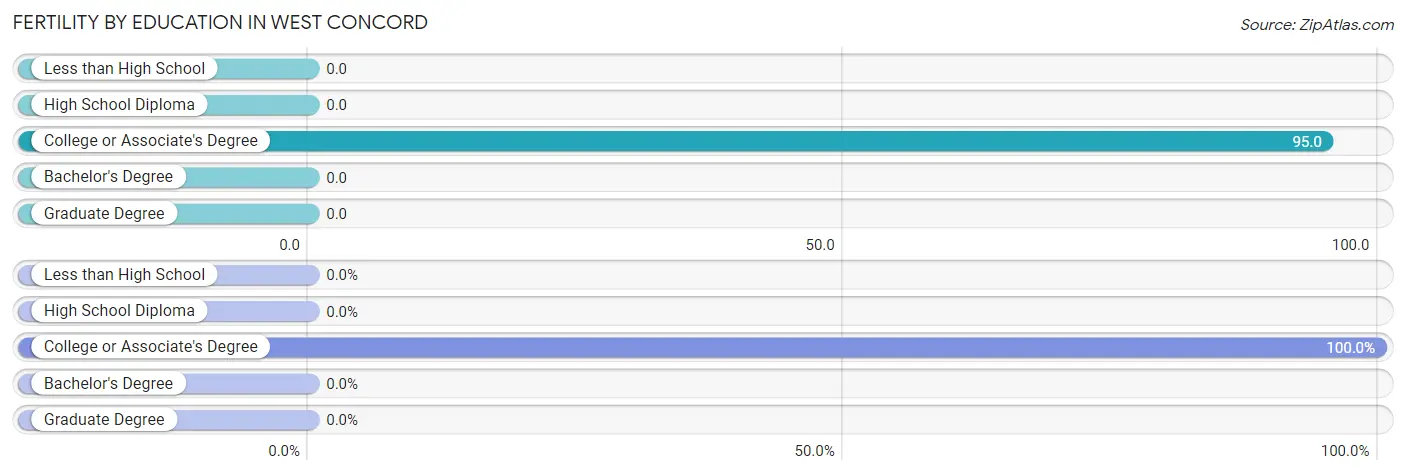
| Educational Attainment | Women with Births | Births / 1,000 Women |
| Less than High School | 0 (0.0%) | 0.0 |
| High School Diploma | 0 (0.0%) | 0.0 |
| College or Associate's Degree | 8 (100.0%) | 95.0 |
| Bachelor's Degree | 0 (0.0%) | 0.0 |
| Graduate Degree | 0 (0.0%) | 0.0 |
| Total | 8 (100.0%) | 44.0 |
Fertility by Education by Marriage Status in West Concord
25.0% of women with births in West Concord are unmarried. Women with the educational attainment of college or associate's degree are most likely to be married with 75.0% of them married at childbirth, while women with the educational attainment of college or associate's degree are least likely to be married with 25.0% of them unmarried at childbirth.
| Educational Attainment | Married | Unmarried |
| Less than High School | 0 (0.0%) | 0 (0.0%) |
| High School Diploma | 0 (0.0%) | 0 (0.0%) |
| College or Associate's Degree | 6 (75.0%) | 2 (25.0%) |
| Bachelor's Degree | 0 (0.0%) | 0 (0.0%) |
| Graduate Degree | 0 (0.0%) | 0 (0.0%) |
| Total | 6 (75.0%) | 2 (25.0%) |
Employment Characteristics in West Concord
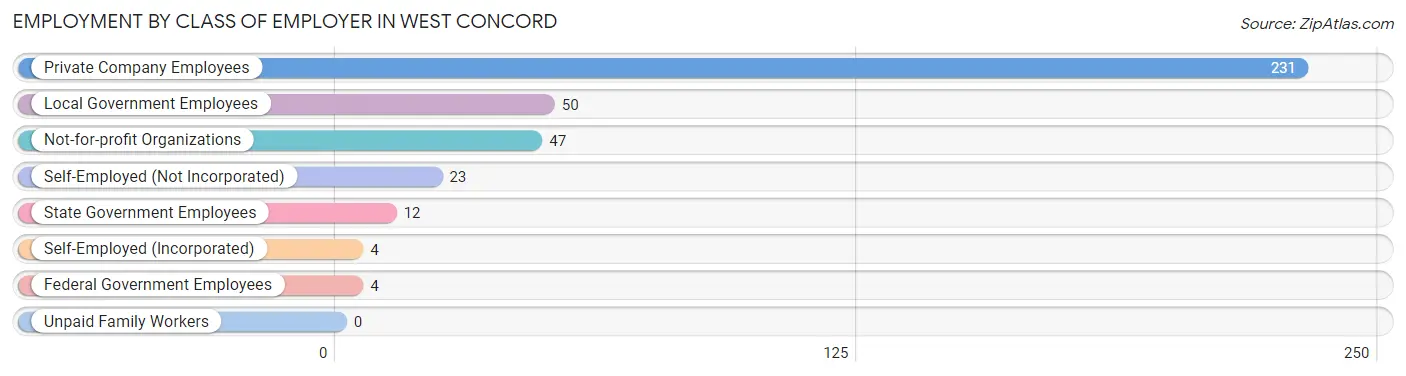
Employment by Class of Employer in West Concord
Among the 371 employed individuals in West Concord, private company employees (231 | 62.3%), local government employees (50 | 13.5%), and not-for-profit organizations (47 | 12.7%) make up the most common classes of employment.
| Employer Class | # Employees | % Employees |
| Private Company Employees | 231 | 62.3% |
| Self-Employed (Incorporated) | 4 | 1.1% |
| Self-Employed (Not Incorporated) | 23 | 6.2% |
| Not-for-profit Organizations | 47 | 12.7% |
| Local Government Employees | 50 | 13.5% |
| State Government Employees | 12 | 3.2% |
| Federal Government Employees | 4 | 1.1% |
| Unpaid Family Workers | 0 | 0.0% |
| Total | 371 | 100.0% |
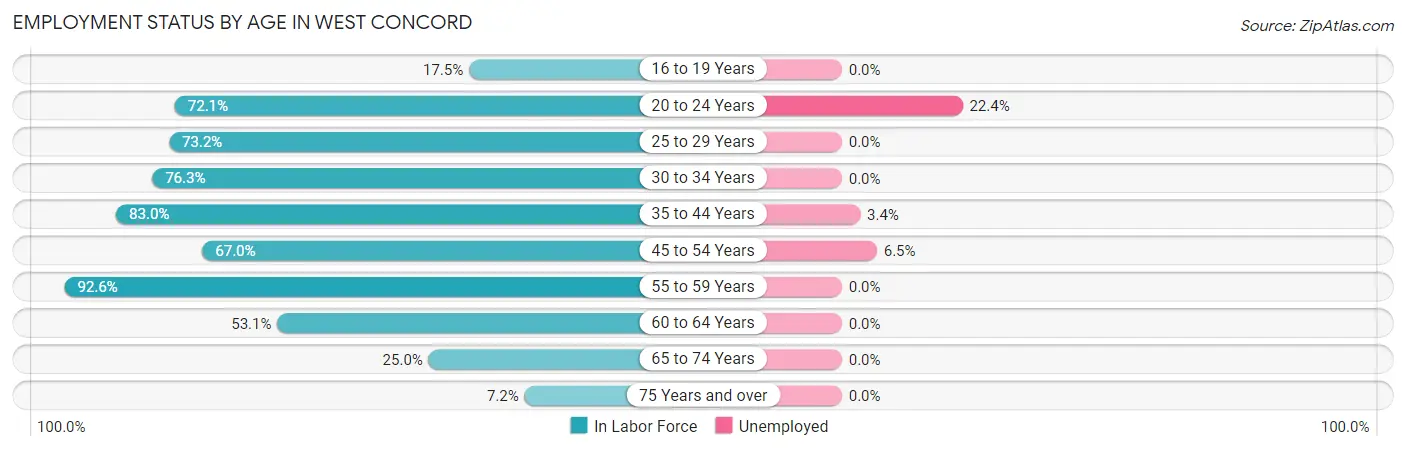
Employment Status by Age in West Concord
According to the labor force statistics for West Concord, out of the total population over 16 years of age (671), 58.6% or 393 individuals are in the labor force, with 4.8% or 19 of them unemployed. The age group with the highest labor force participation rate is 55 to 59 years, with 92.6% or 25 individuals in the labor force. Within the labor force, the 20 to 24 years age range has the highest percentage of unemployed individuals, with 22.4% or 11 of them being unemployed.
| Age Bracket | In Labor Force | Unemployed |
| 16 to 19 Years | 10 (17.5%) | 0 (0.0%) |
| 20 to 24 Years | 49 (72.1%) | 11 (22.4%) |
| 25 to 29 Years | 41 (73.2%) | 0 (0.0%) |
| 30 to 34 Years | 61 (76.3%) | 0 (0.0%) |
| 35 to 44 Years | 88 (83.0%) | 3 (3.4%) |
| 45 to 54 Years | 77 (67.0%) | 5 (6.5%) |
| 55 to 59 Years | 25 (92.6%) | 0 (0.0%) |
| 60 to 64 Years | 26 (53.1%) | 0 (0.0%) |
| 65 to 74 Years | 11 (25.0%) | 0 (0.0%) |
| 75 Years and over | 5 (7.2%) | 0 (0.0%) |
| Total | 393 (58.6%) | 19 (4.8%) |
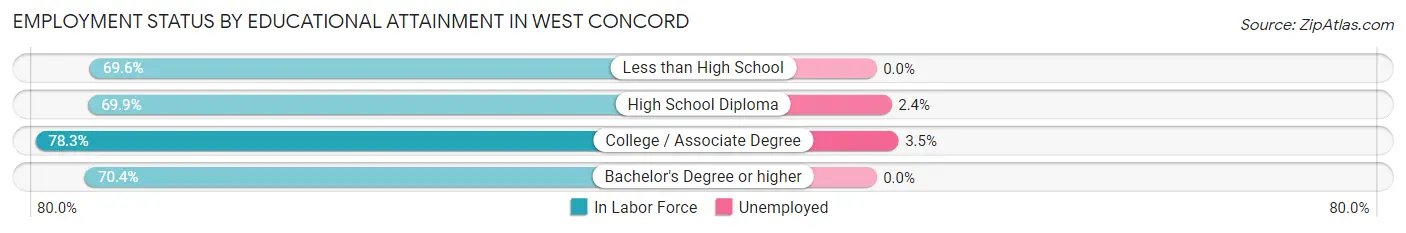
Employment Status by Educational Attainment in West Concord
According to labor force statistics for West Concord, 73.4% of individuals (318) out of the total population between 25 and 64 years of age (433) are in the labor force, with 2.5% or 8 of them being unemployed. The group with the highest labor force participation rate are those with the educational attainment of college / associate degree, with 78.3% or 141 individuals in the labor force. Within the labor force, individuals with college / associate degree education have the highest percentage of unemployment, with 3.5% or 5 of them being unemployed.
| Educational Attainment | In Labor Force | Unemployed |
| Less than High School | 16 (69.6%) | 0 (0.0%) |
| High School Diploma | 123 (69.9%) | 4 (2.4%) |
| College / Associate Degree | 141 (78.3%) | 6 (3.5%) |
| Bachelor's Degree or higher | 38 (70.4%) | 0 (0.0%) |
| Total | 318 (73.4%) | 11 (2.5%) |
Employment Occupations by Sex in West Concord
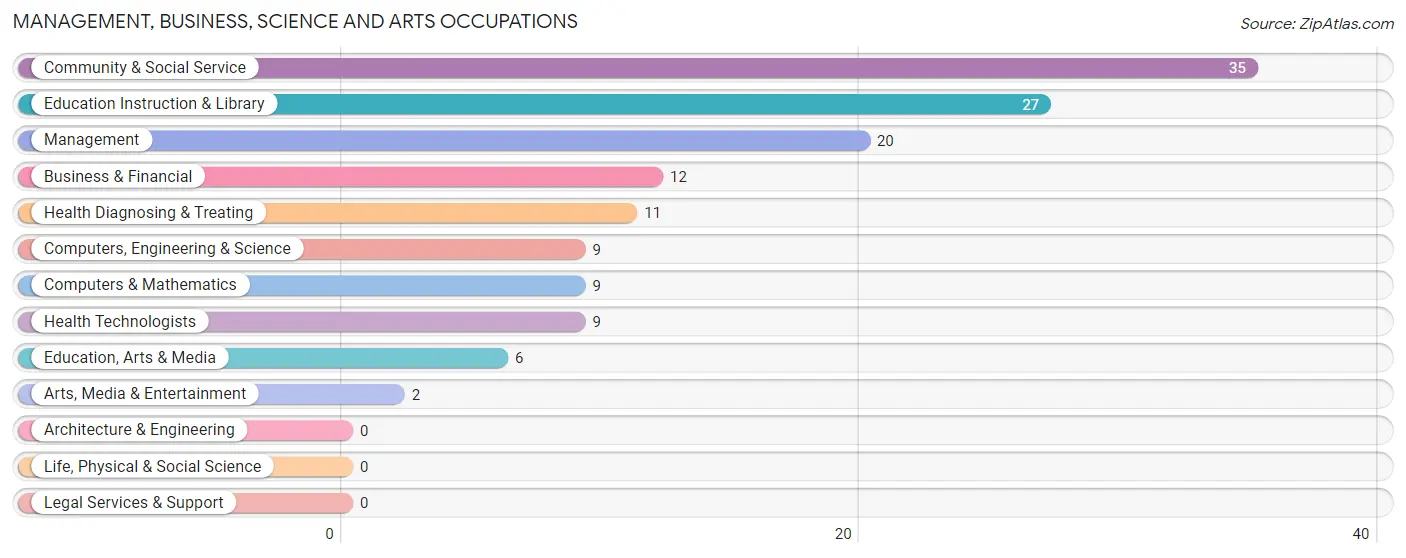
Management, Business, Science and Arts Occupations
The most common Management, Business, Science and Arts occupations in West Concord are Community & Social Service (35 | 9.4%), Education Instruction & Library (27 | 7.2%), Management (20 | 5.3%), Business & Financial (12 | 3.2%), and Health Diagnosing & Treating (11 | 2.9%).
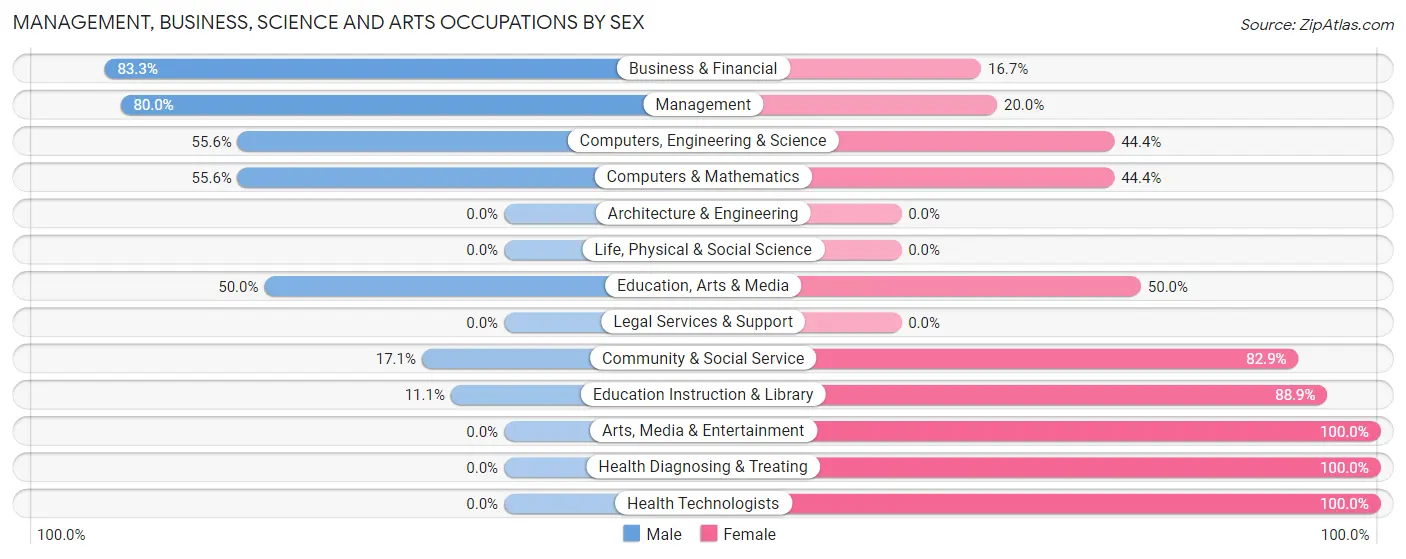
Management, Business, Science and Arts Occupations by Sex
Within the Management, Business, Science and Arts occupations in West Concord, the most male-oriented occupations are Business & Financial (83.3%), Management (80.0%), and Computers, Engineering & Science (55.6%), while the most female-oriented occupations are Arts, Media & Entertainment (100.0%), Health Diagnosing & Treating (100.0%), and Health Technologists (100.0%).
| Occupation | Male | Female |
| Management | 16 (80.0%) | 4 (20.0%) |
| Business & Financial | 10 (83.3%) | 2 (16.7%) |
| Computers, Engineering & Science | 5 (55.6%) | 4 (44.4%) |
| Computers & Mathematics | 5 (55.6%) | 4 (44.4%) |
| Architecture & Engineering | 0 (0.0%) | 0 (0.0%) |
| Life, Physical & Social Science | 0 (0.0%) | 0 (0.0%) |
| Community & Social Service | 6 (17.1%) | 29 (82.9%) |
| Education, Arts & Media | 3 (50.0%) | 3 (50.0%) |
| Legal Services & Support | 0 (0.0%) | 0 (0.0%) |
| Education Instruction & Library | 3 (11.1%) | 24 (88.9%) |
| Arts, Media & Entertainment | 0 (0.0%) | 2 (100.0%) |
| Health Diagnosing & Treating | 0 (0.0%) | 11 (100.0%) |
| Health Technologists | 0 (0.0%) | 9 (100.0%) |
| Total (Category) | 37 (42.5%) | 50 (57.5%) |
| Total (Overall) | 214 (57.2%) | 160 (42.8%) |
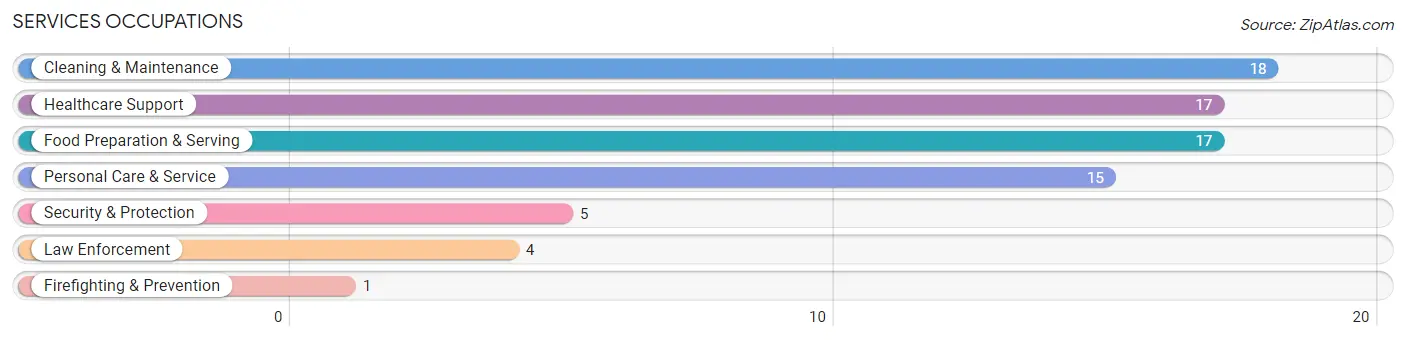
Services Occupations
The most common Services occupations in West Concord are Cleaning & Maintenance (18 | 4.8%), Healthcare Support (17 | 4.5%), Food Preparation & Serving (17 | 4.5%), Personal Care & Service (15 | 4.0%), and Security & Protection (5 | 1.3%).
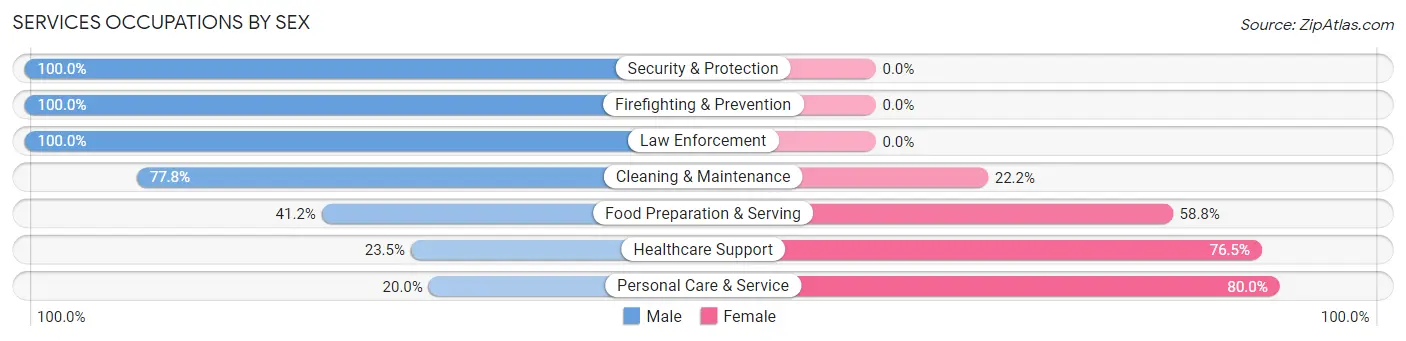
Services Occupations by Sex
Within the Services occupations in West Concord, the most male-oriented occupations are Security & Protection (100.0%), Firefighting & Prevention (100.0%), and Law Enforcement (100.0%), while the most female-oriented occupations are Personal Care & Service (80.0%), Healthcare Support (76.5%), and Food Preparation & Serving (58.8%).
| Occupation | Male | Female |
| Healthcare Support | 4 (23.5%) | 13 (76.5%) |
| Security & Protection | 5 (100.0%) | 0 (0.0%) |
| Firefighting & Prevention | 1 (100.0%) | 0 (0.0%) |
| Law Enforcement | 4 (100.0%) | 0 (0.0%) |
| Food Preparation & Serving | 7 (41.2%) | 10 (58.8%) |
| Cleaning & Maintenance | 14 (77.8%) | 4 (22.2%) |
| Personal Care & Service | 3 (20.0%) | 12 (80.0%) |
| Total (Category) | 33 (45.8%) | 39 (54.2%) |
| Total (Overall) | 214 (57.2%) | 160 (42.8%) |
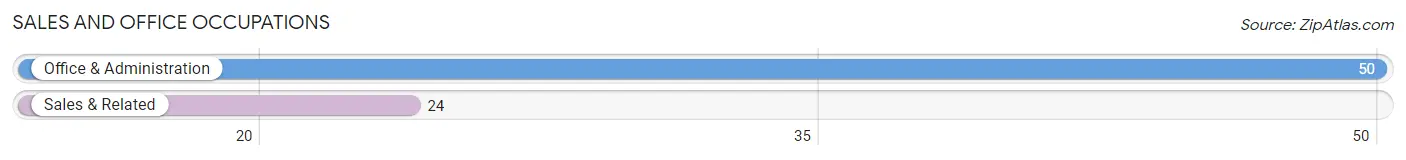
Sales and Office Occupations
The most common Sales and Office occupations in West Concord are Office & Administration (50 | 13.4%), and Sales & Related (24 | 6.4%).
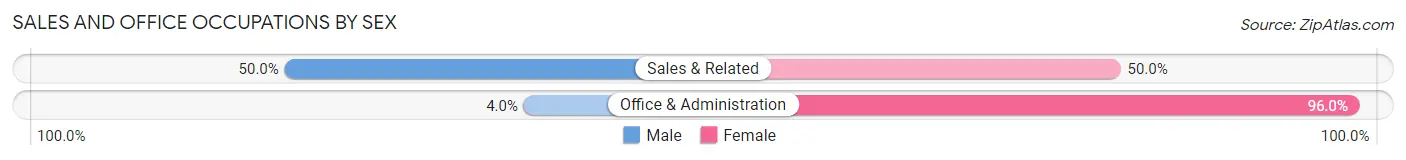
Sales and Office Occupations by Sex
| Occupation | Male | Female |
| Sales & Related | 12 (50.0%) | 12 (50.0%) |
| Office & Administration | 2 (4.0%) | 48 (96.0%) |
| Total (Category) | 14 (18.9%) | 60 (81.1%) |
| Total (Overall) | 214 (57.2%) | 160 (42.8%) |
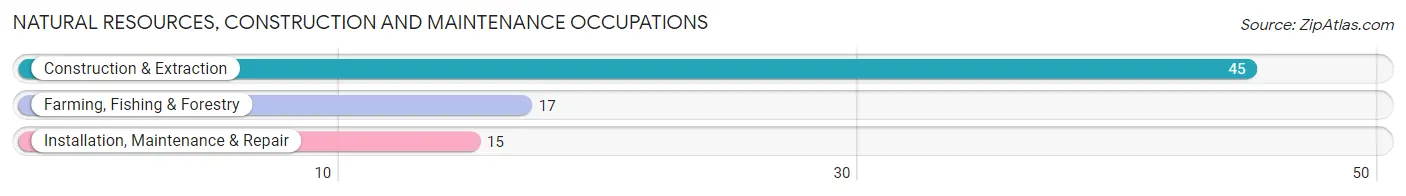
Natural Resources, Construction and Maintenance Occupations
The most common Natural Resources, Construction and Maintenance occupations in West Concord are Construction & Extraction (45 | 12.0%), Farming, Fishing & Forestry (17 | 4.5%), and Installation, Maintenance & Repair (15 | 4.0%).
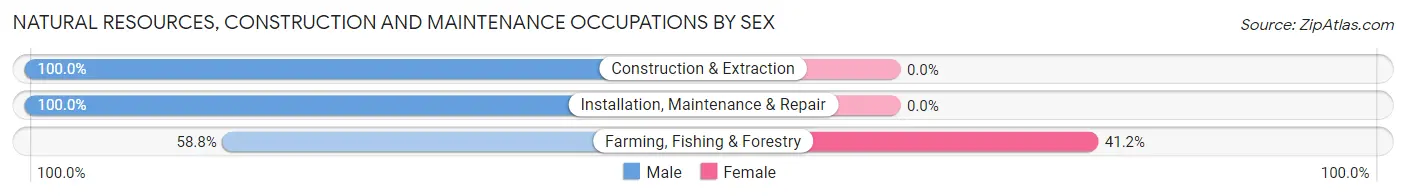
Natural Resources, Construction and Maintenance Occupations by Sex
| Occupation | Male | Female |
| Farming, Fishing & Forestry | 10 (58.8%) | 7 (41.2%) |
| Construction & Extraction | 45 (100.0%) | 0 (0.0%) |
| Installation, Maintenance & Repair | 15 (100.0%) | 0 (0.0%) |
| Total (Category) | 70 (90.9%) | 7 (9.1%) |
| Total (Overall) | 214 (57.2%) | 160 (42.8%) |
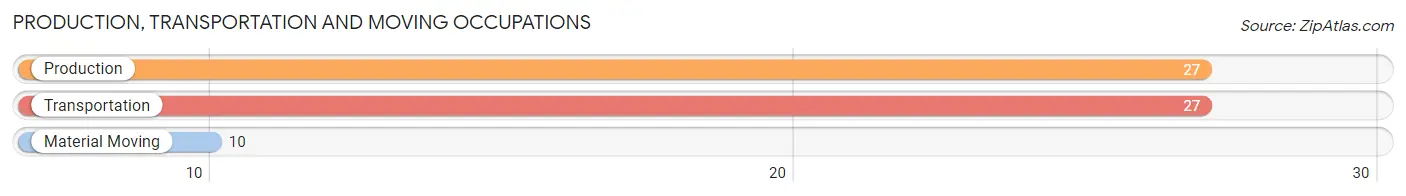
Production, Transportation and Moving Occupations
The most common Production, Transportation and Moving occupations in West Concord are Production (27 | 7.2%), Transportation (27 | 7.2%), and Material Moving (10 | 2.7%).
Production, Transportation and Moving Occupations by Sex
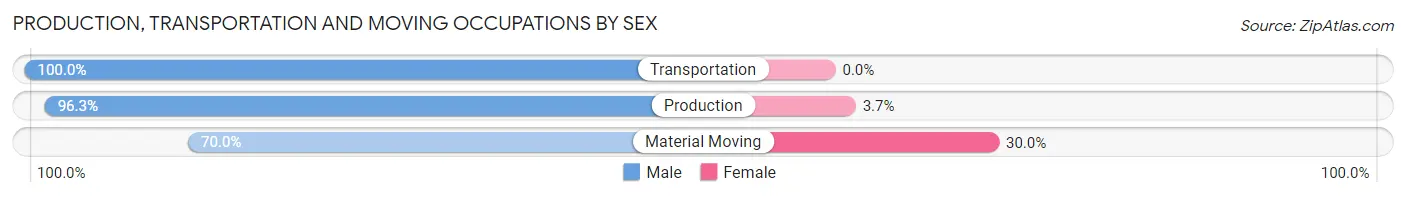
| Occupation | Male | Female |
| Production | 26 (96.3%) | 1 (3.7%) |
| Transportation | 27 (100.0%) | 0 (0.0%) |
| Material Moving | 7 (70.0%) | 3 (30.0%) |
| Total (Category) | 60 (93.8%) | 4 (6.2%) |
| Total (Overall) | 214 (57.2%) | 160 (42.8%) |
Employment Industries by Sex in West Concord
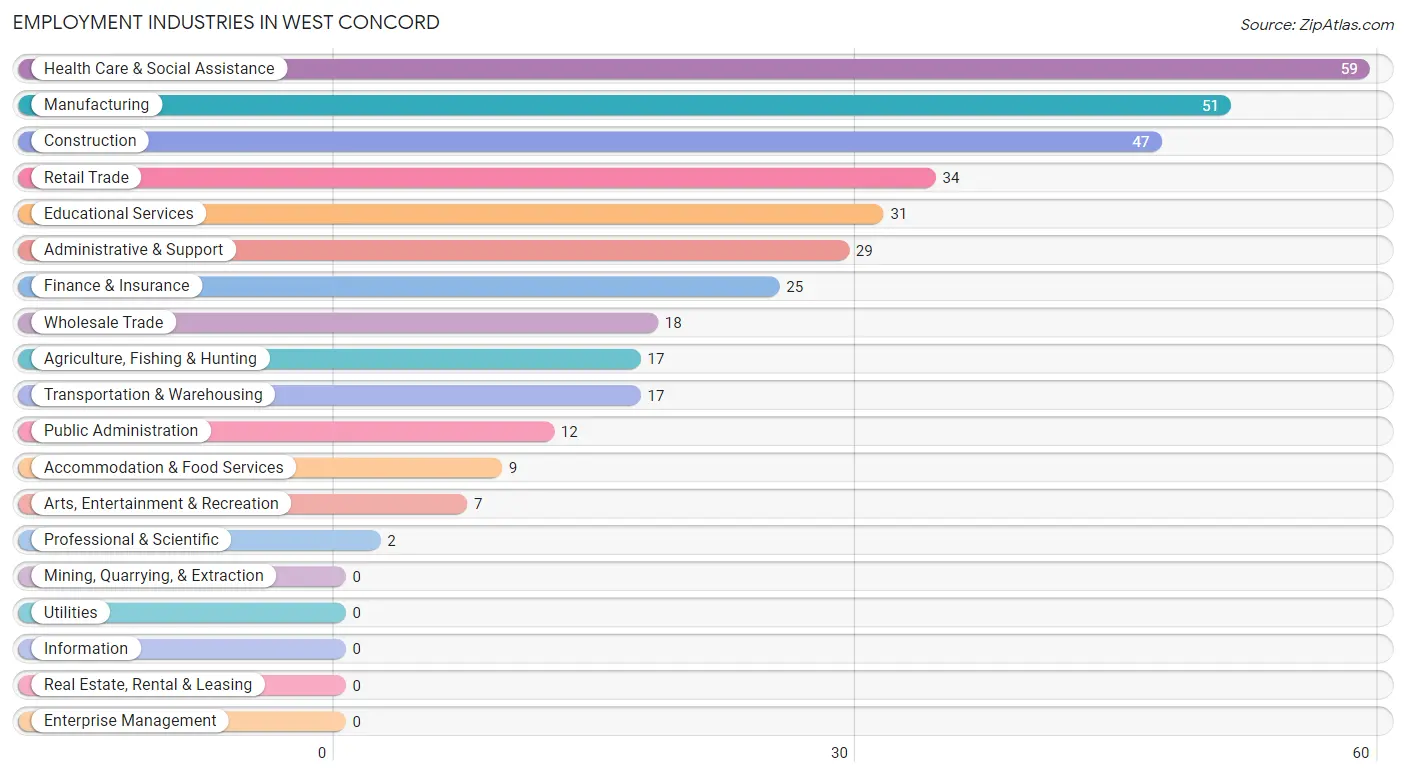
Employment Industries in West Concord
The major employment industries in West Concord include Health Care & Social Assistance (59 | 15.8%), Manufacturing (51 | 13.6%), Construction (47 | 12.6%), Retail Trade (34 | 9.1%), and Educational Services (31 | 8.3%).
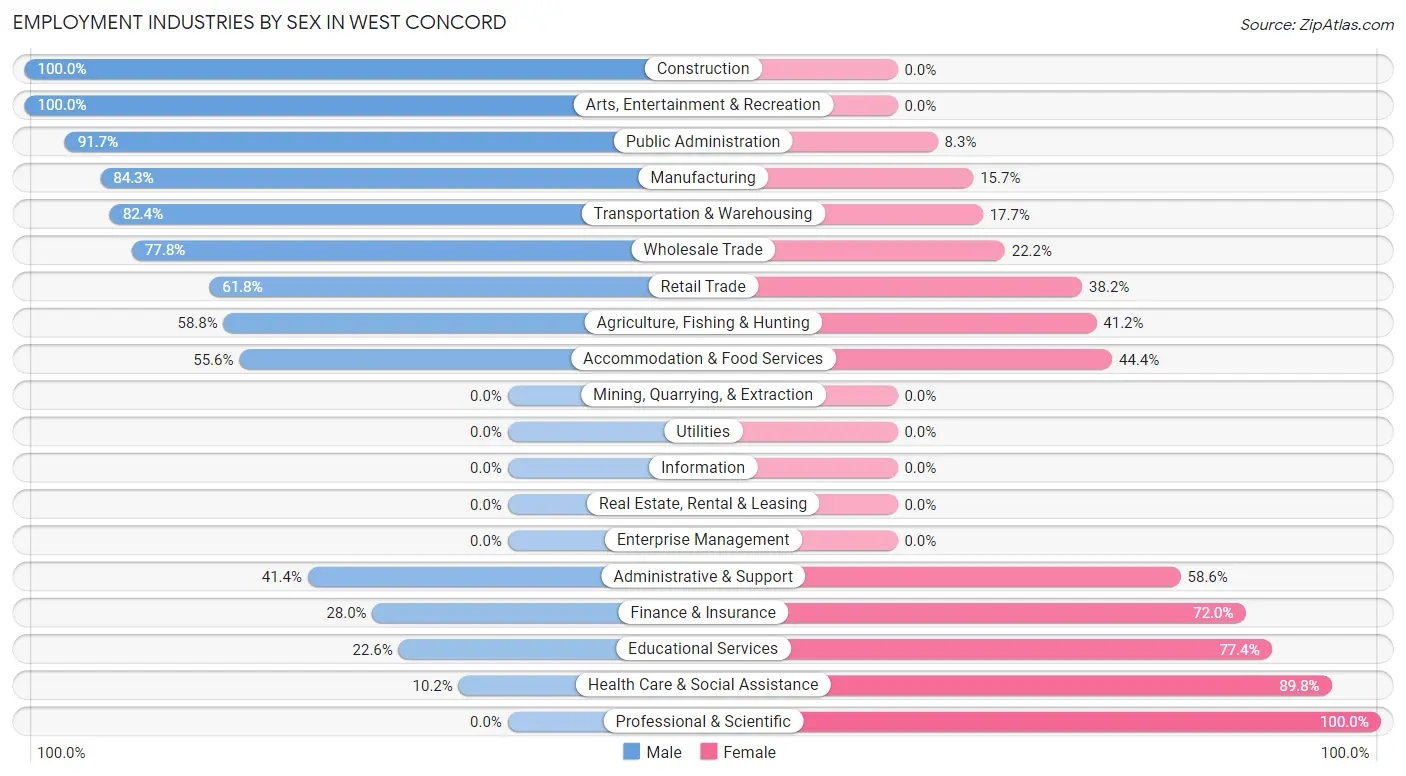
Employment Industries by Sex in West Concord
The West Concord industries that see more men than women are Construction (100.0%), Arts, Entertainment & Recreation (100.0%), and Public Administration (91.7%), whereas the industries that tend to have a higher number of women are Professional & Scientific (100.0%), Health Care & Social Assistance (89.8%), and Educational Services (77.4%).
| Industry | Male | Female |
| Agriculture, Fishing & Hunting | 10 (58.8%) | 7 (41.2%) |
| Mining, Quarrying, & Extraction | 0 (0.0%) | 0 (0.0%) |
| Construction | 47 (100.0%) | 0 (0.0%) |
| Manufacturing | 43 (84.3%) | 8 (15.7%) |
| Wholesale Trade | 14 (77.8%) | 4 (22.2%) |
| Retail Trade | 21 (61.8%) | 13 (38.2%) |
| Transportation & Warehousing | 14 (82.4%) | 3 (17.6%) |
| Utilities | 0 (0.0%) | 0 (0.0%) |
| Information | 0 (0.0%) | 0 (0.0%) |
| Finance & Insurance | 7 (28.0%) | 18 (72.0%) |
| Real Estate, Rental & Leasing | 0 (0.0%) | 0 (0.0%) |
| Professional & Scientific | 0 (0.0%) | 2 (100.0%) |
| Enterprise Management | 0 (0.0%) | 0 (0.0%) |
| Administrative & Support | 12 (41.4%) | 17 (58.6%) |
| Educational Services | 7 (22.6%) | 24 (77.4%) |
| Health Care & Social Assistance | 6 (10.2%) | 53 (89.8%) |
| Arts, Entertainment & Recreation | 7 (100.0%) | 0 (0.0%) |
| Accommodation & Food Services | 5 (55.6%) | 4 (44.4%) |
| Public Administration | 11 (91.7%) | 1 (8.3%) |
| Total | 214 (57.2%) | 160 (42.8%) |
Education in West Concord
School Enrollment in West Concord
The most common levels of schooling among the 253 students in West Concord are high school (68 | 26.9%), elementary school (67 | 26.5%), and middle school (50 | 19.8%).
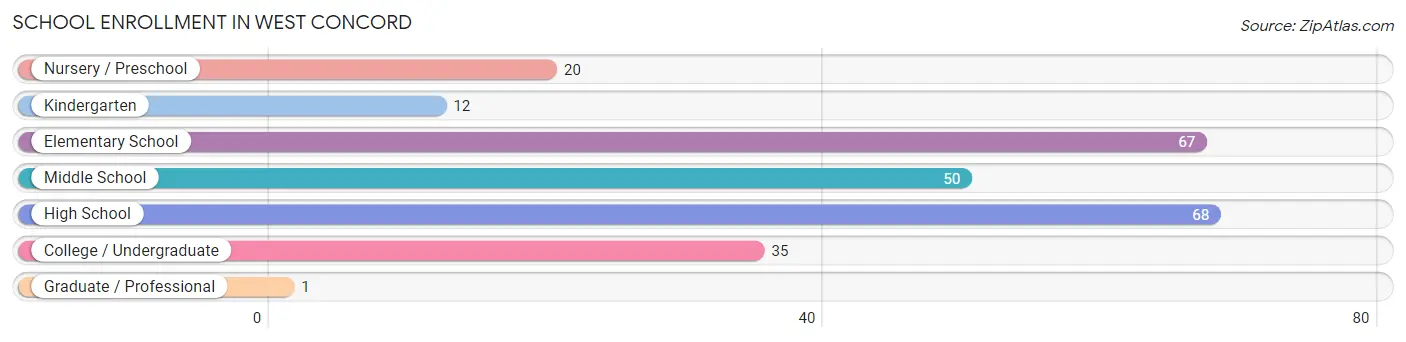
| School Level | # Students | % Students |
| Nursery / Preschool | 20 | 7.9% |
| Kindergarten | 12 | 4.7% |
| Elementary School | 67 | 26.5% |
| Middle School | 50 | 19.8% |
| High School | 68 | 26.9% |
| College / Undergraduate | 35 | 13.8% |
| Graduate / Professional | 1 | 0.4% |
| Total | 253 | 100.0% |
School Enrollment by Age by Funding Source in West Concord
Out of a total of 253 students who are enrolled in schools in West Concord, 7 (2.8%) attend a private institution, while the remaining 246 (97.2%) are enrolled in public schools. The age group of 20 to 24 year olds has the highest likelihood of being enrolled in private schools, with 2 (9.5% in the age bracket) enrolled. Conversely, the age group of 3 to 4 year olds has the lowest likelihood of being enrolled in a private school, with 12 (100.0% in the age bracket) attending a public institution.
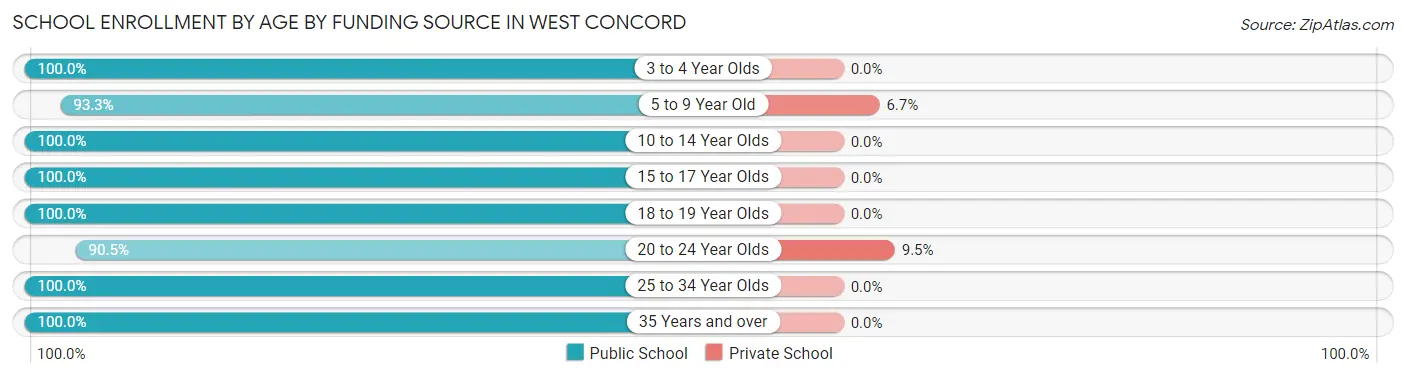
| Age Bracket | Public School | Private School |
| 3 to 4 Year Olds | 12 (100.0%) | 0 (0.0%) |
| 5 to 9 Year Old | 70 (93.3%) | 5 (6.7%) |
| 10 to 14 Year Olds | 75 (100.0%) | 0 (0.0%) |
| 15 to 17 Year Olds | 47 (100.0%) | 0 (0.0%) |
| 18 to 19 Year Olds | 14 (100.0%) | 0 (0.0%) |
| 20 to 24 Year Olds | 19 (90.5%) | 2 (9.5%) |
| 25 to 34 Year Olds | 3 (100.0%) | 0 (0.0%) |
| 35 Years and over | 6 (100.0%) | 0 (0.0%) |
| Total | 246 (97.2%) | 7 (2.8%) |
Educational Attainment by Field of Study in West Concord
Education (30 | 30.9%), business (27 | 27.8%), psychology (10 | 10.3%), social sciences (10 | 10.3%), and visual & performing arts (9 | 9.3%) are the most common fields of study among 97 individuals in West Concord who have obtained a bachelor's degree or higher.
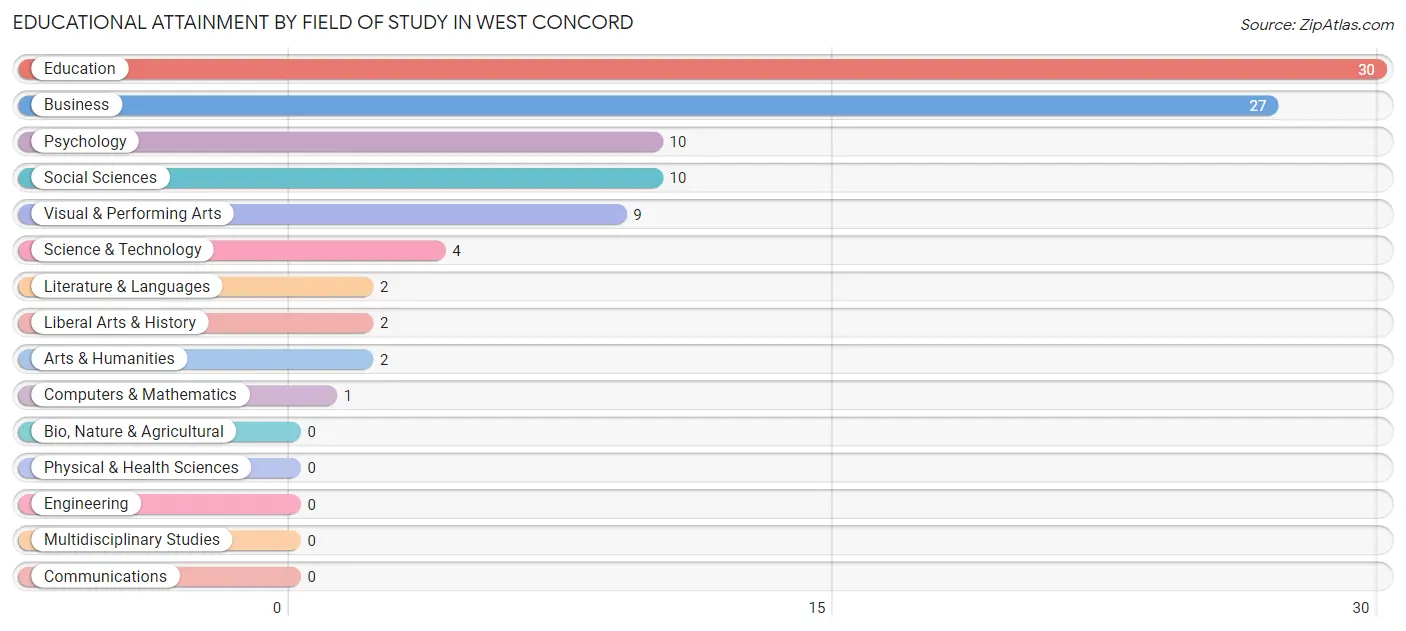
| Field of Study | # Graduates | % Graduates |
| Computers & Mathematics | 1 | 1.0% |
| Bio, Nature & Agricultural | 0 | 0.0% |
| Physical & Health Sciences | 0 | 0.0% |
| Psychology | 10 | 10.3% |
| Social Sciences | 10 | 10.3% |
| Engineering | 0 | 0.0% |
| Multidisciplinary Studies | 0 | 0.0% |
| Science & Technology | 4 | 4.1% |
| Business | 27 | 27.8% |
| Education | 30 | 30.9% |
| Literature & Languages | 2 | 2.1% |
| Liberal Arts & History | 2 | 2.1% |
| Visual & Performing Arts | 9 | 9.3% |
| Communications | 0 | 0.0% |
| Arts & Humanities | 2 | 2.1% |
| Total | 97 | 100.0% |
Transportation & Commute in West Concord
Vehicle Availability by Sex in West Concord
The most prevalent vehicle ownership categories in West Concord are males with 2 vehicles (110, accounting for 51.6%) and females with 2 vehicles (79, making up 71.4%).
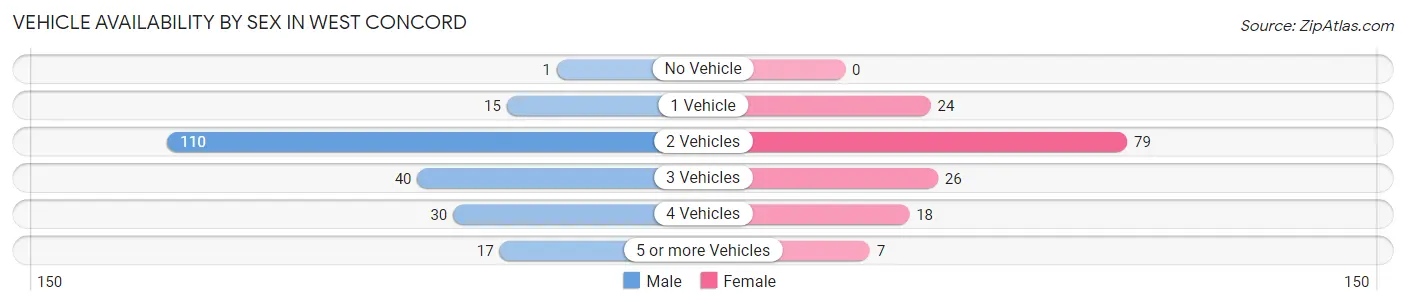
| Vehicles Available | Male | Female |
| No Vehicle | 1 (0.5%) | 0 (0.0%) |
| 1 Vehicle | 15 (7.0%) | 24 (15.6%) |
| 2 Vehicles | 110 (51.6%) | 79 (51.3%) |
| 3 Vehicles | 40 (18.8%) | 26 (16.9%) |
| 4 Vehicles | 30 (14.1%) | 18 (11.7%) |
| 5 or more Vehicles | 17 (8.0%) | 7 (4.5%) |
| Total | 213 (100.0%) | 154 (100.0%) |
Commute Time in West Concord
The most frequently occuring commute durations in West Concord are 30 to 34 minutes (62 commuters, 17.4%), 5 to 9 minutes (48 commuters, 13.5%), and 15 to 19 minutes (40 commuters, 11.2%).
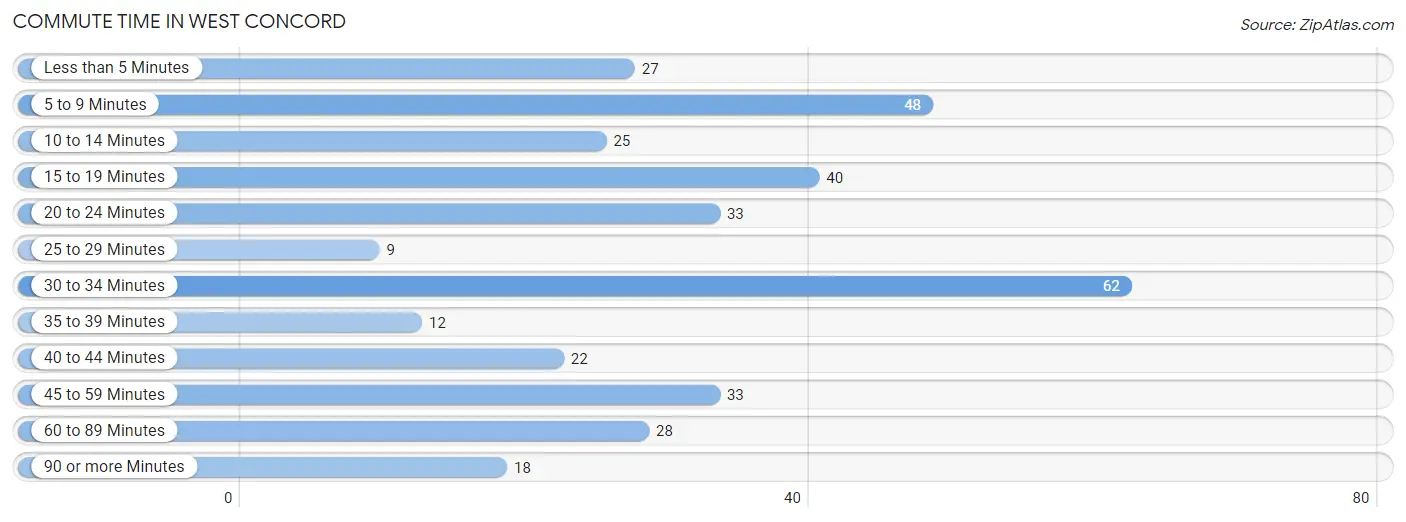
| Commute Time | # Commuters | % Commuters |
| Less than 5 Minutes | 27 | 7.6% |
| 5 to 9 Minutes | 48 | 13.5% |
| 10 to 14 Minutes | 25 | 7.0% |
| 15 to 19 Minutes | 40 | 11.2% |
| 20 to 24 Minutes | 33 | 9.2% |
| 25 to 29 Minutes | 9 | 2.5% |
| 30 to 34 Minutes | 62 | 17.4% |
| 35 to 39 Minutes | 12 | 3.4% |
| 40 to 44 Minutes | 22 | 6.2% |
| 45 to 59 Minutes | 33 | 9.2% |
| 60 to 89 Minutes | 28 | 7.8% |
| 90 or more Minutes | 18 | 5.0% |
Commute Time by Sex in West Concord
The most common commute times in West Concord are 5 to 9 minutes (29 commuters, 14.1%) for males and 30 to 34 minutes (34 commuters, 22.5%) for females.
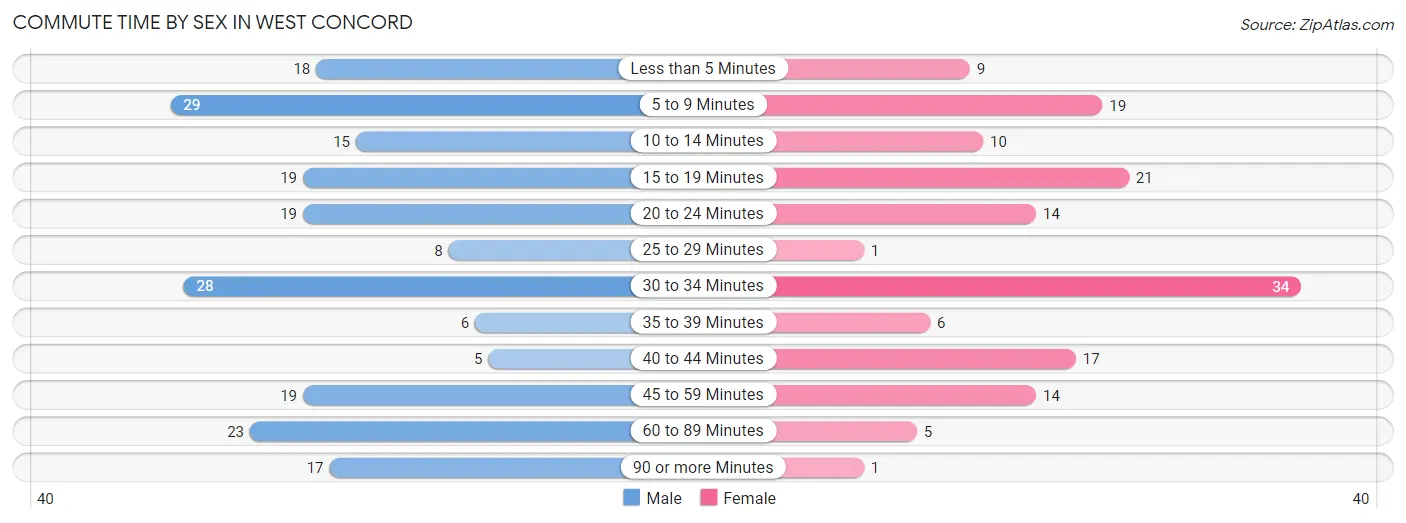
| Commute Time | Male | Female |
| Less than 5 Minutes | 18 (8.7%) | 9 (6.0%) |
| 5 to 9 Minutes | 29 (14.1%) | 19 (12.6%) |
| 10 to 14 Minutes | 15 (7.3%) | 10 (6.6%) |
| 15 to 19 Minutes | 19 (9.2%) | 21 (13.9%) |
| 20 to 24 Minutes | 19 (9.2%) | 14 (9.3%) |
| 25 to 29 Minutes | 8 (3.9%) | 1 (0.7%) |
| 30 to 34 Minutes | 28 (13.6%) | 34 (22.5%) |
| 35 to 39 Minutes | 6 (2.9%) | 6 (4.0%) |
| 40 to 44 Minutes | 5 (2.4%) | 17 (11.3%) |
| 45 to 59 Minutes | 19 (9.2%) | 14 (9.3%) |
| 60 to 89 Minutes | 23 (11.2%) | 5 (3.3%) |
| 90 or more Minutes | 17 (8.3%) | 1 (0.7%) |
Time of Departure to Work by Sex in West Concord
The most frequent times of departure to work in West Concord are 6:30 AM to 6:59 AM (47, 22.8%) for males and 6:30 AM to 6:59 AM (41, 27.2%) for females.
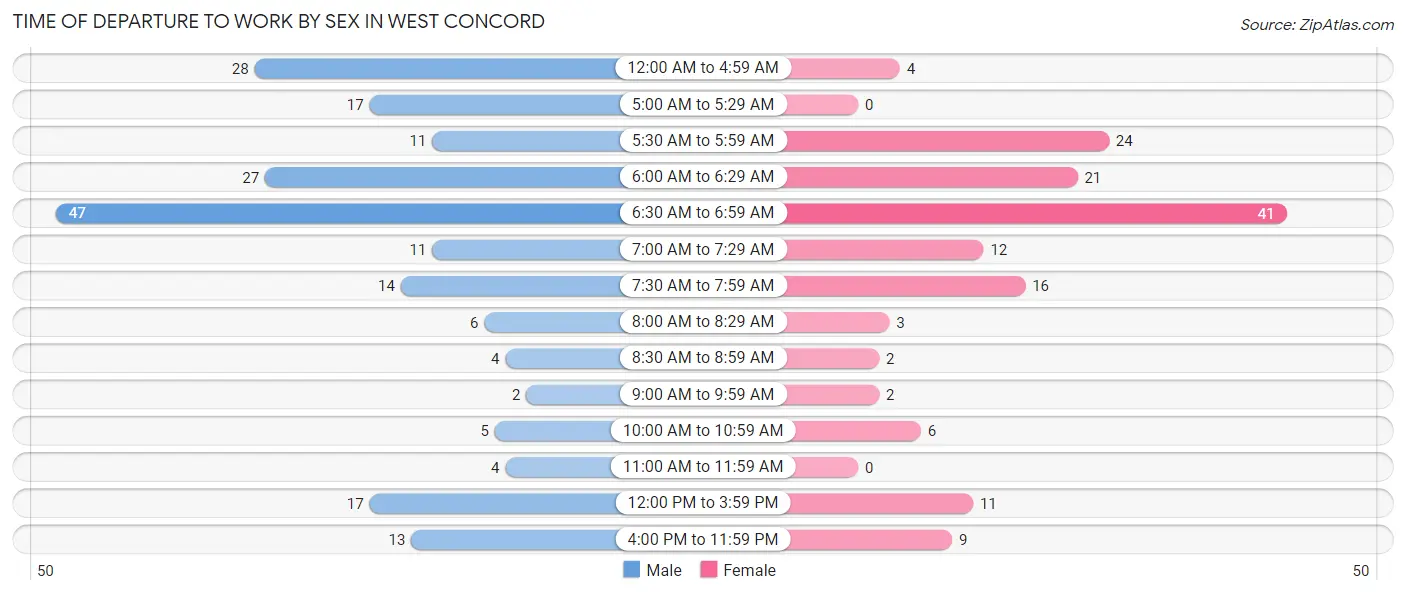
| Time of Departure | Male | Female |
| 12:00 AM to 4:59 AM | 28 (13.6%) | 4 (2.6%) |
| 5:00 AM to 5:29 AM | 17 (8.3%) | 0 (0.0%) |
| 5:30 AM to 5:59 AM | 11 (5.3%) | 24 (15.9%) |
| 6:00 AM to 6:29 AM | 27 (13.1%) | 21 (13.9%) |
| 6:30 AM to 6:59 AM | 47 (22.8%) | 41 (27.2%) |
| 7:00 AM to 7:29 AM | 11 (5.3%) | 12 (8.0%) |
| 7:30 AM to 7:59 AM | 14 (6.8%) | 16 (10.6%) |
| 8:00 AM to 8:29 AM | 6 (2.9%) | 3 (2.0%) |
| 8:30 AM to 8:59 AM | 4 (1.9%) | 2 (1.3%) |
| 9:00 AM to 9:59 AM | 2 (1.0%) | 2 (1.3%) |
| 10:00 AM to 10:59 AM | 5 (2.4%) | 6 (4.0%) |
| 11:00 AM to 11:59 AM | 4 (1.9%) | 0 (0.0%) |
| 12:00 PM to 3:59 PM | 17 (8.3%) | 11 (7.3%) |
| 4:00 PM to 11:59 PM | 13 (6.3%) | 9 (6.0%) |
| Total | 206 (100.0%) | 151 (100.0%) |
Housing Occupancy in West Concord
Occupancy by Ownership in West Concord
Of the total 327 dwellings in West Concord, owner-occupied units account for 251 (76.8%), while renter-occupied units make up 76 (23.2%).
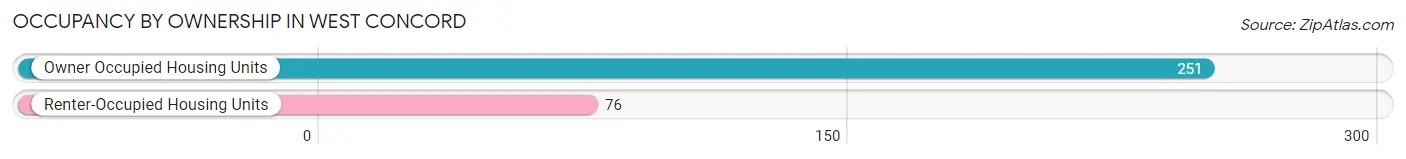
| Occupancy | # Housing Units | % Housing Units |
| Owner Occupied Housing Units | 251 | 76.8% |
| Renter-Occupied Housing Units | 76 | 23.2% |
| Total Occupied Housing Units | 327 | 100.0% |
Occupancy by Household Size in West Concord
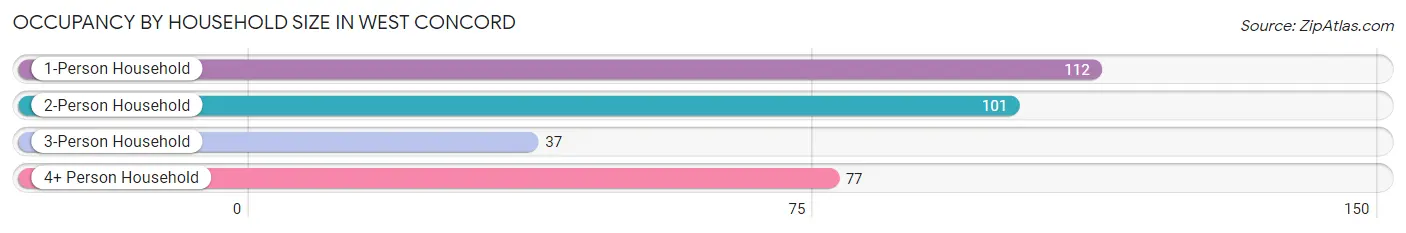
| Household Size | # Housing Units | % Housing Units |
| 1-Person Household | 112 | 34.3% |
| 2-Person Household | 101 | 30.9% |
| 3-Person Household | 37 | 11.3% |
| 4+ Person Household | 77 | 23.5% |
| Total Housing Units | 327 | 100.0% |
Occupancy by Ownership by Household Size in West Concord
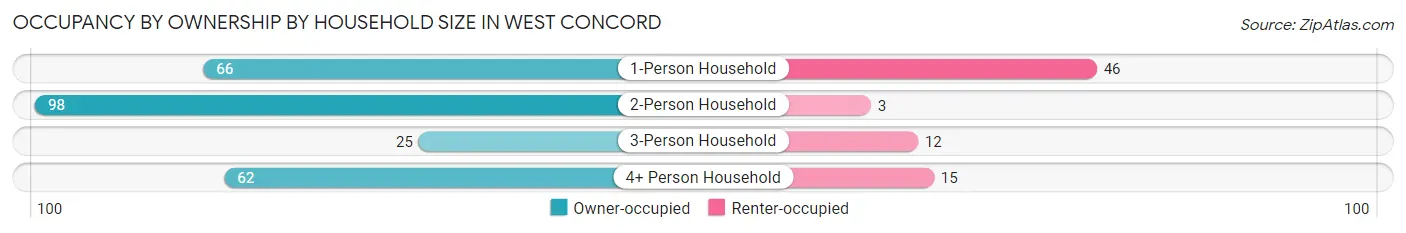
| Household Size | Owner-occupied | Renter-occupied |
| 1-Person Household | 66 (58.9%) | 46 (41.1%) |
| 2-Person Household | 98 (97.0%) | 3 (3.0%) |
| 3-Person Household | 25 (67.6%) | 12 (32.4%) |
| 4+ Person Household | 62 (80.5%) | 15 (19.5%) |
| Total Housing Units | 251 (76.8%) | 76 (23.2%) |
Occupancy by Educational Attainment in West Concord
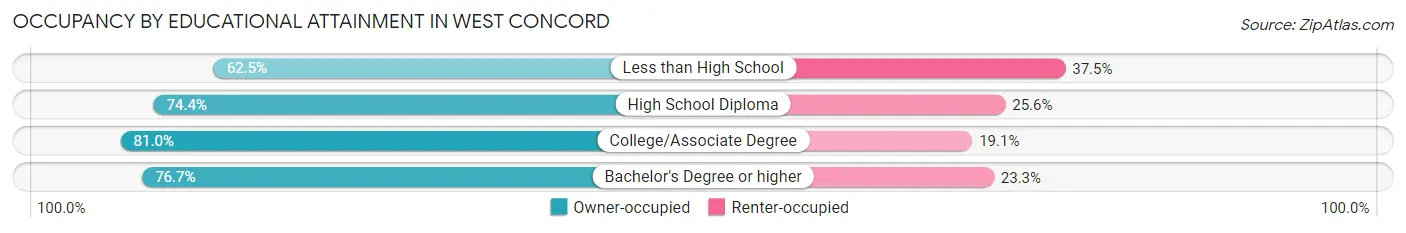
| Household Size | Owner-occupied | Renter-occupied |
| Less than High School | 10 (62.5%) | 6 (37.5%) |
| High School Diploma | 93 (74.4%) | 32 (25.6%) |
| College/Associate Degree | 102 (80.9%) | 24 (19.1%) |
| Bachelor's Degree or higher | 46 (76.7%) | 14 (23.3%) |
Occupancy by Age of Householder in West Concord
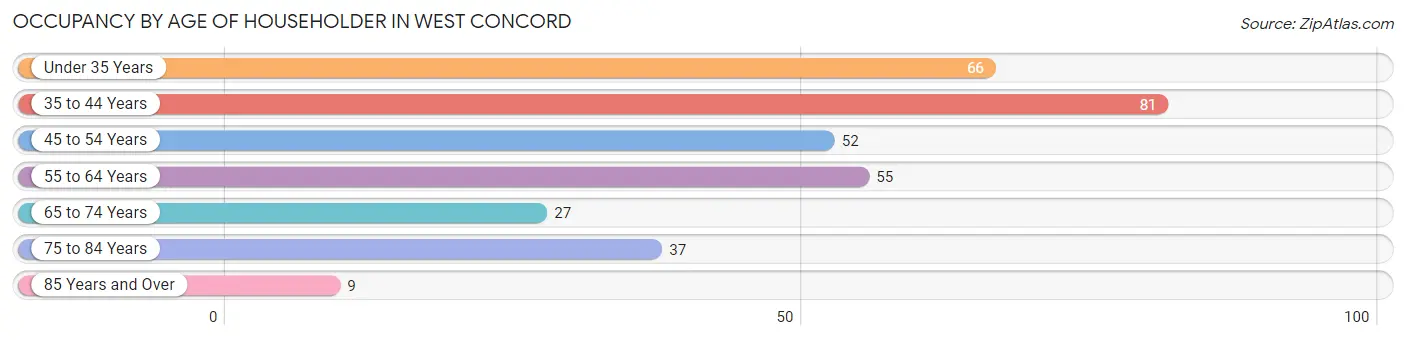
| Age Bracket | # Households | % Households |
| Under 35 Years | 66 | 20.2% |
| 35 to 44 Years | 81 | 24.8% |
| 45 to 54 Years | 52 | 15.9% |
| 55 to 64 Years | 55 | 16.8% |
| 65 to 74 Years | 27 | 8.3% |
| 75 to 84 Years | 37 | 11.3% |
| 85 Years and Over | 9 | 2.8% |
| Total | 327 | 100.0% |
Housing Finances in West Concord
Median Income by Occupancy in West Concord
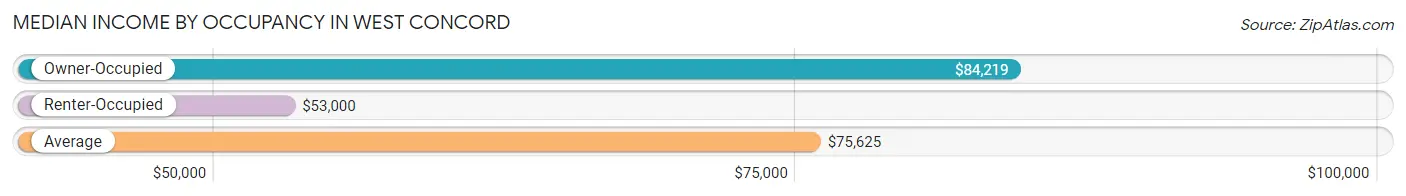
| Occupancy Type | # Households | Median Income |
| Owner-Occupied | 251 (76.8%) | $84,219 |
| Renter-Occupied | 76 (23.2%) | $53,000 |
| Average | 327 (100.0%) | $75,625 |
Occupancy by Householder Income Bracket in West Concord
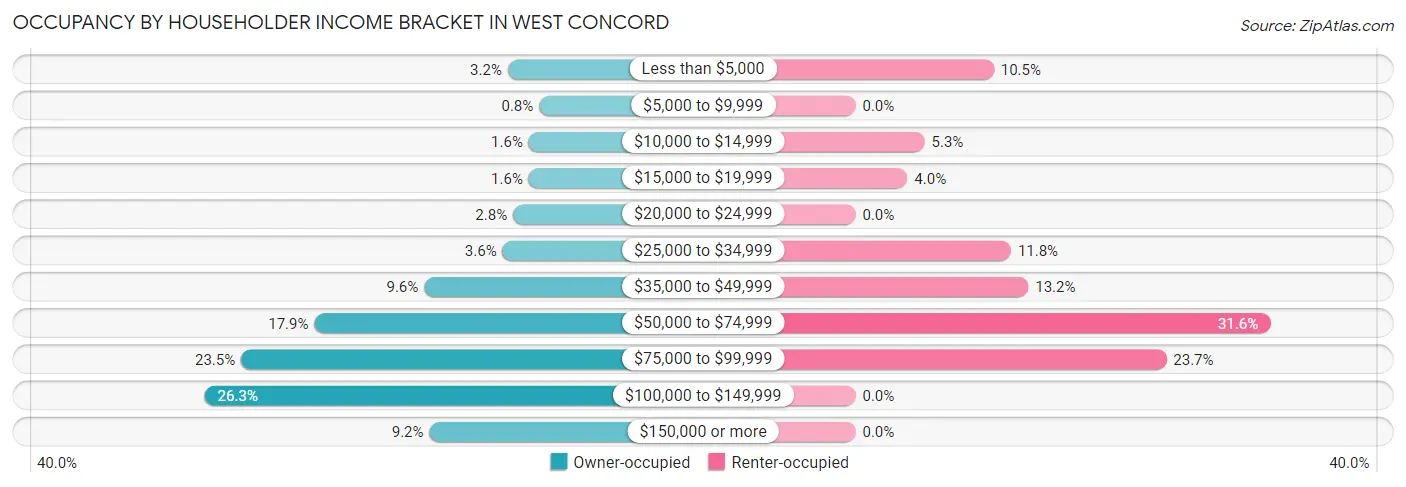
| Income Bracket | Owner-occupied | Renter-occupied |
| Less than $5,000 | 8 (3.2%) | 8 (10.5%) |
| $5,000 to $9,999 | 2 (0.8%) | 0 (0.0%) |
| $10,000 to $14,999 | 4 (1.6%) | 4 (5.3%) |
| $15,000 to $19,999 | 4 (1.6%) | 3 (4.0%) |
| $20,000 to $24,999 | 7 (2.8%) | 0 (0.0%) |
| $25,000 to $34,999 | 9 (3.6%) | 9 (11.8%) |
| $35,000 to $49,999 | 24 (9.6%) | 10 (13.2%) |
| $50,000 to $74,999 | 45 (17.9%) | 24 (31.6%) |
| $75,000 to $99,999 | 59 (23.5%) | 18 (23.7%) |
| $100,000 to $149,999 | 66 (26.3%) | 0 (0.0%) |
| $150,000 or more | 23 (9.2%) | 0 (0.0%) |
| Total | 251 (100.0%) | 76 (100.0%) |
Monthly Housing Cost Tiers in West Concord
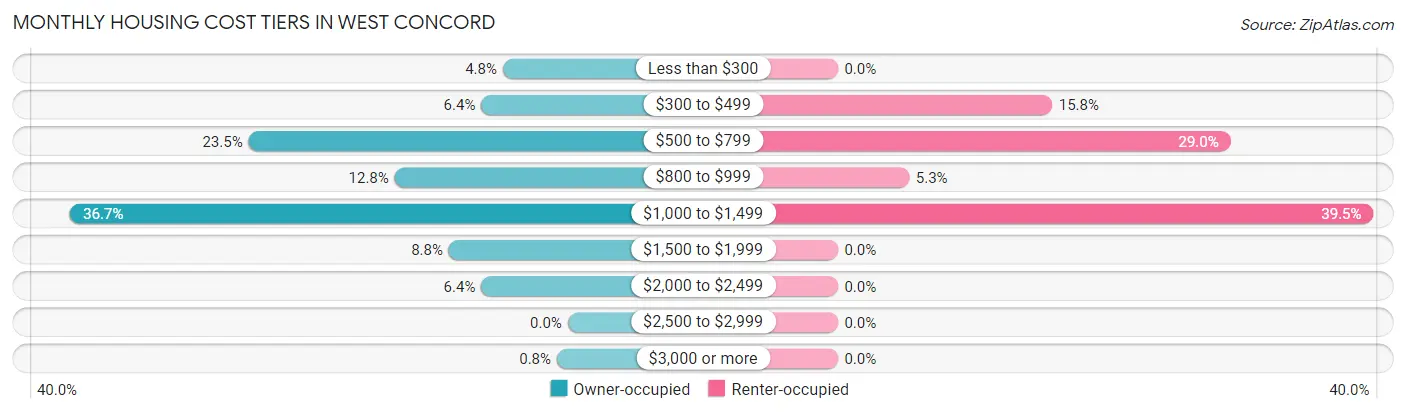
| Monthly Cost | Owner-occupied | Renter-occupied |
| Less than $300 | 12 (4.8%) | 0 (0.0%) |
| $300 to $499 | 16 (6.4%) | 12 (15.8%) |
| $500 to $799 | 59 (23.5%) | 22 (28.9%) |
| $800 to $999 | 32 (12.8%) | 4 (5.3%) |
| $1,000 to $1,499 | 92 (36.6%) | 30 (39.5%) |
| $1,500 to $1,999 | 22 (8.8%) | 0 (0.0%) |
| $2,000 to $2,499 | 16 (6.4%) | 0 (0.0%) |
| $2,500 to $2,999 | 0 (0.0%) | 0 (0.0%) |
| $3,000 or more | 2 (0.8%) | 0 (0.0%) |
| Total | 251 (100.0%) | 76 (100.0%) |
Physical Housing Characteristics in West Concord
Housing Structures in West Concord
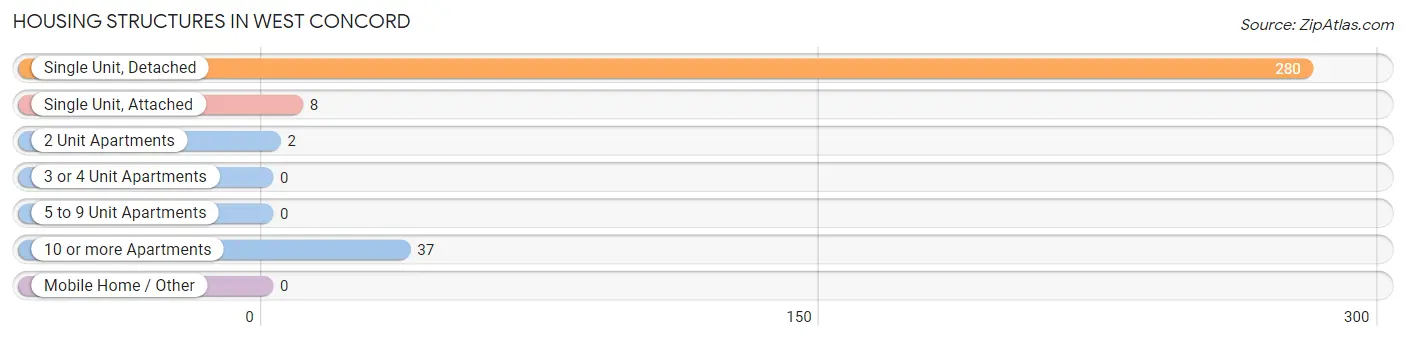
| Structure Type | # Housing Units | % Housing Units |
| Single Unit, Detached | 280 | 85.6% |
| Single Unit, Attached | 8 | 2.5% |
| 2 Unit Apartments | 2 | 0.6% |
| 3 or 4 Unit Apartments | 0 | 0.0% |
| 5 to 9 Unit Apartments | 0 | 0.0% |
| 10 or more Apartments | 37 | 11.3% |
| Mobile Home / Other | 0 | 0.0% |
| Total | 327 | 100.0% |
Housing Structures by Occupancy in West Concord
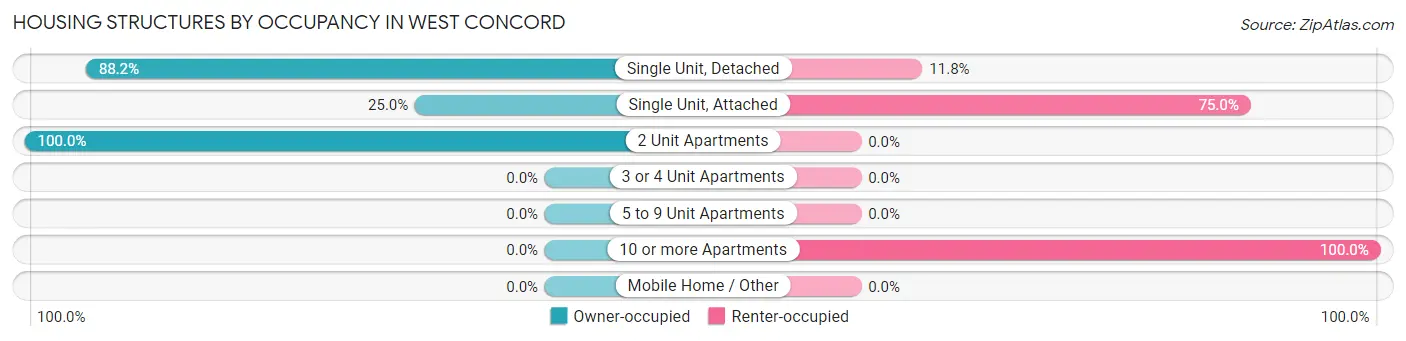
| Structure Type | Owner-occupied | Renter-occupied |
| Single Unit, Detached | 247 (88.2%) | 33 (11.8%) |
| Single Unit, Attached | 2 (25.0%) | 6 (75.0%) |
| 2 Unit Apartments | 2 (100.0%) | 0 (0.0%) |
| 3 or 4 Unit Apartments | 0 (0.0%) | 0 (0.0%) |
| 5 to 9 Unit Apartments | 0 (0.0%) | 0 (0.0%) |
| 10 or more Apartments | 0 (0.0%) | 37 (100.0%) |
| Mobile Home / Other | 0 (0.0%) | 0 (0.0%) |
| Total | 251 (76.8%) | 76 (23.2%) |
Housing Structures by Number of Rooms in West Concord
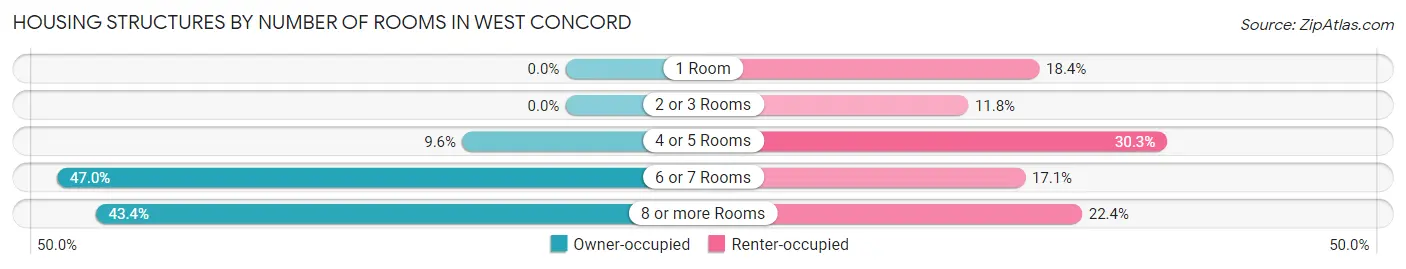
| Number of Rooms | Owner-occupied | Renter-occupied |
| 1 Room | 0 (0.0%) | 14 (18.4%) |
| 2 or 3 Rooms | 0 (0.0%) | 9 (11.8%) |
| 4 or 5 Rooms | 24 (9.6%) | 23 (30.3%) |
| 6 or 7 Rooms | 118 (47.0%) | 13 (17.1%) |
| 8 or more Rooms | 109 (43.4%) | 17 (22.4%) |
| Total | 251 (100.0%) | 76 (100.0%) |
Housing Structure by Heating Type in West Concord
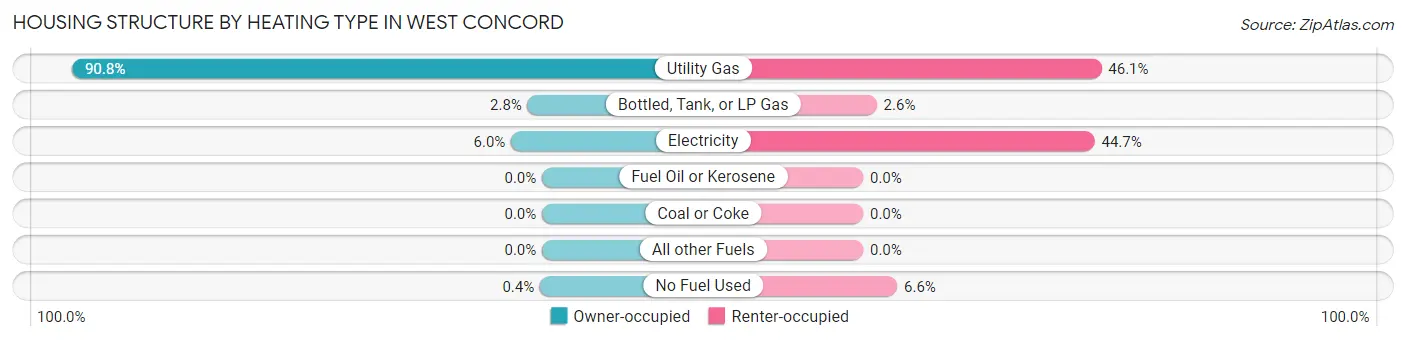
| Heating Type | Owner-occupied | Renter-occupied |
| Utility Gas | 228 (90.8%) | 35 (46.1%) |
| Bottled, Tank, or LP Gas | 7 (2.8%) | 2 (2.6%) |
| Electricity | 15 (6.0%) | 34 (44.7%) |
| Fuel Oil or Kerosene | 0 (0.0%) | 0 (0.0%) |
| Coal or Coke | 0 (0.0%) | 0 (0.0%) |
| All other Fuels | 0 (0.0%) | 0 (0.0%) |
| No Fuel Used | 1 (0.4%) | 5 (6.6%) |
| Total | 251 (100.0%) | 76 (100.0%) |
Household Vehicle Usage in West Concord
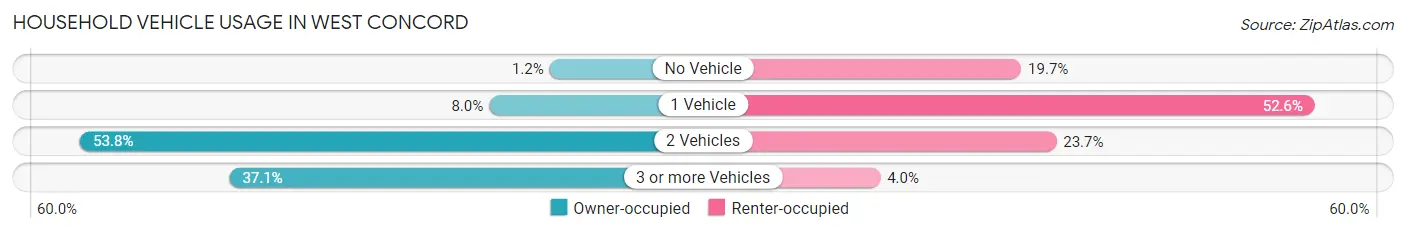
| Vehicles per Household | Owner-occupied | Renter-occupied |
| No Vehicle | 3 (1.2%) | 15 (19.7%) |
| 1 Vehicle | 20 (8.0%) | 40 (52.6%) |
| 2 Vehicles | 135 (53.8%) | 18 (23.7%) |
| 3 or more Vehicles | 93 (37.0%) | 3 (4.0%) |
| Total | 251 (100.0%) | 76 (100.0%) |
Real Estate & Mortgages in West Concord
Real Estate and Mortgage Overview in West Concord
| Characteristic | Without Mortgage | With Mortgage |
| Housing Units | 101 | 150 |
| Median Property Value | $106,900 | $154,600 |
| Median Household Income | $86,161 | $15 |
| Monthly Housing Costs | $598 | $2 |
| Real Estate Taxes | $2,048 | $0 |
Property Value by Mortgage Status in West Concord
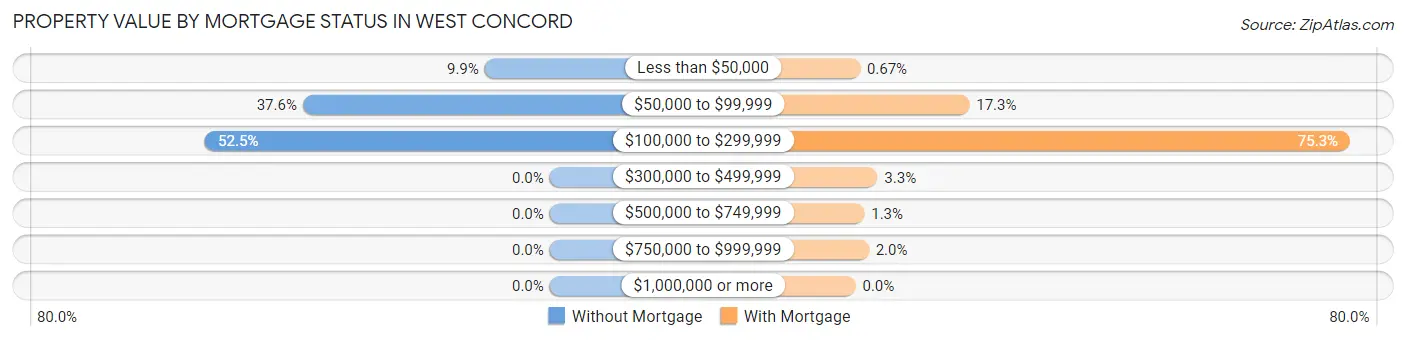
| Property Value | Without Mortgage | With Mortgage |
| Less than $50,000 | 10 (9.9%) | 1 (0.7%) |
| $50,000 to $99,999 | 38 (37.6%) | 26 (17.3%) |
| $100,000 to $299,999 | 53 (52.5%) | 113 (75.3%) |
| $300,000 to $499,999 | 0 (0.0%) | 5 (3.3%) |
| $500,000 to $749,999 | 0 (0.0%) | 2 (1.3%) |
| $750,000 to $999,999 | 0 (0.0%) | 3 (2.0%) |
| $1,000,000 or more | 0 (0.0%) | 0 (0.0%) |
| Total | 101 (100.0%) | 150 (100.0%) |
Household Income by Mortgage Status in West Concord
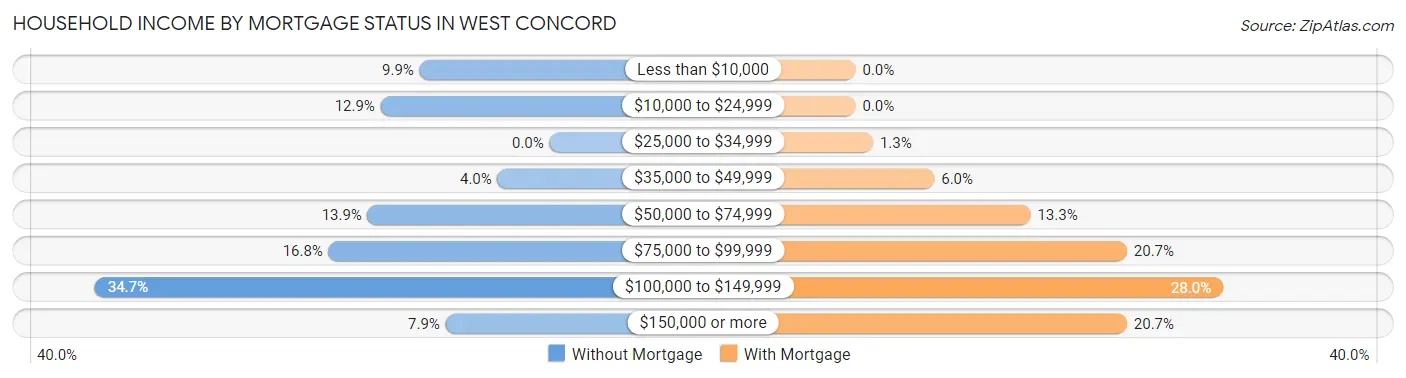
| Household Income | Without Mortgage | With Mortgage |
| Less than $10,000 | 10 (9.9%) | 0 (0.0%) |
| $10,000 to $24,999 | 13 (12.9%) | 0 (0.0%) |
| $25,000 to $34,999 | 0 (0.0%) | 2 (1.3%) |
| $35,000 to $49,999 | 4 (4.0%) | 9 (6.0%) |
| $50,000 to $74,999 | 14 (13.9%) | 20 (13.3%) |
| $75,000 to $99,999 | 17 (16.8%) | 31 (20.7%) |
| $100,000 to $149,999 | 35 (34.6%) | 42 (28.0%) |
| $150,000 or more | 8 (7.9%) | 31 (20.7%) |
| Total | 101 (100.0%) | 150 (100.0%) |
Property Value to Household Income Ratio in West Concord
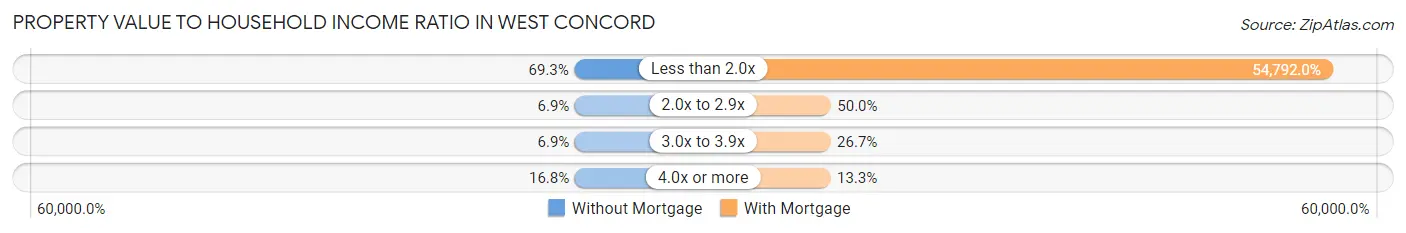
| Value-to-Income Ratio | Without Mortgage | With Mortgage |
| Less than 2.0x | 70 (69.3%) | 82,188 (54,792.0%) |
| 2.0x to 2.9x | 7 (6.9%) | 75 (50.0%) |
| 3.0x to 3.9x | 7 (6.9%) | 40 (26.7%) |
| 4.0x or more | 17 (16.8%) | 20 (13.3%) |
| Total | 101 (100.0%) | 150 (100.0%) |
Real Estate Taxes by Mortgage Status in West Concord
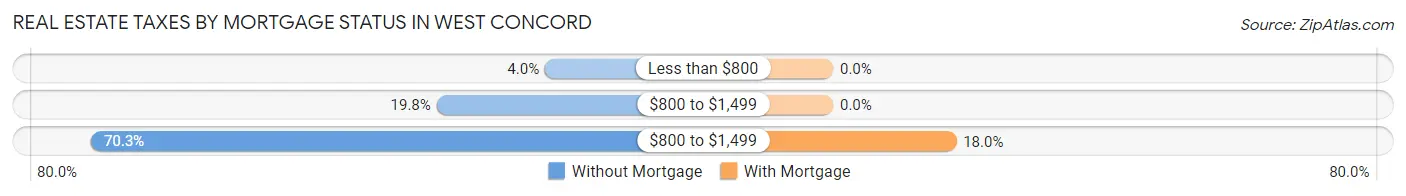
| Property Taxes | Without Mortgage | With Mortgage |
| Less than $800 | 4 (4.0%) | 0 (0.0%) |
| $800 to $1,499 | 20 (19.8%) | 0 (0.0%) |
| $800 to $1,499 | 71 (70.3%) | 27 (18.0%) |
| Total | 101 (100.0%) | 150 (100.0%) |
Health & Disability in West Concord
Health Insurance Coverage by Age in West Concord
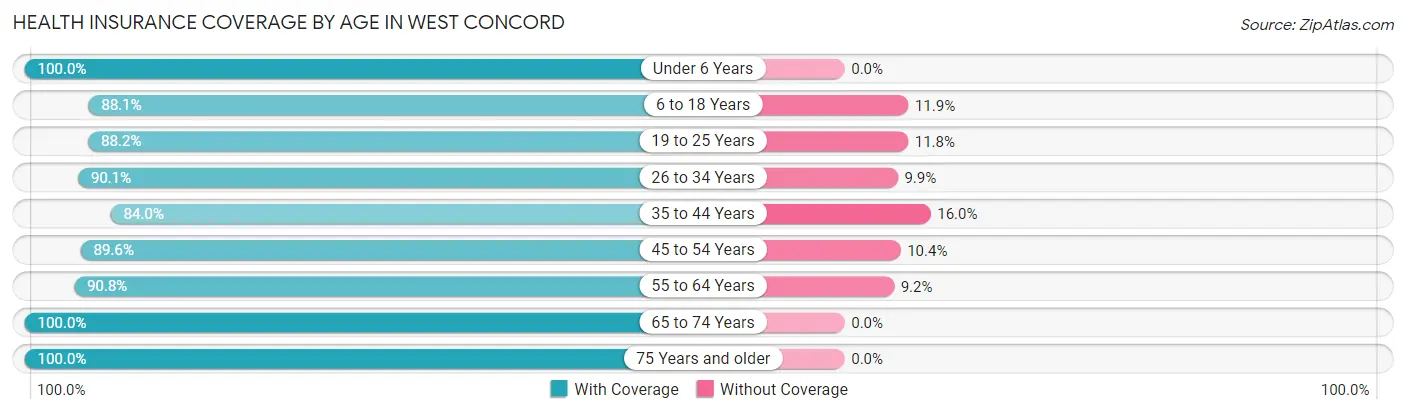
| Age Bracket | With Coverage | Without Coverage |
| Under 6 Years | 54 (100.0%) | 0 (0.0%) |
| 6 to 18 Years | 178 (88.1%) | 24 (11.9%) |
| 19 to 25 Years | 67 (88.2%) | 9 (11.8%) |
| 26 to 34 Years | 118 (90.1%) | 13 (9.9%) |
| 35 to 44 Years | 89 (84.0%) | 17 (16.0%) |
| 45 to 54 Years | 103 (89.6%) | 12 (10.4%) |
| 55 to 64 Years | 69 (90.8%) | 7 (9.2%) |
| 65 to 74 Years | 44 (100.0%) | 0 (0.0%) |
| 75 Years and older | 69 (100.0%) | 0 (0.0%) |
| Total | 791 (90.6%) | 82 (9.4%) |
Health Insurance Coverage by Citizenship Status in West Concord
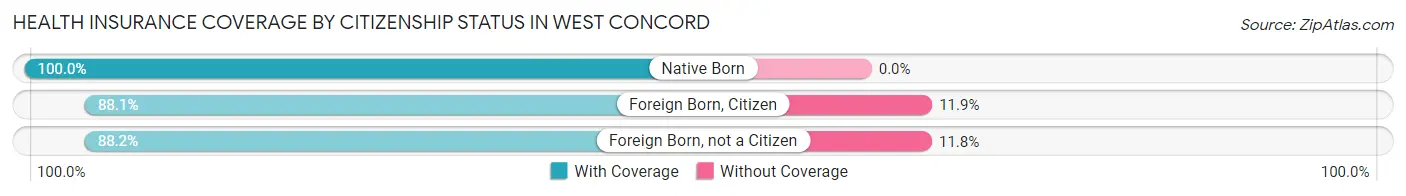
| Citizenship Status | With Coverage | Without Coverage |
| Native Born | 54 (100.0%) | 0 (0.0%) |
| Foreign Born, Citizen | 178 (88.1%) | 24 (11.9%) |
| Foreign Born, not a Citizen | 67 (88.2%) | 9 (11.8%) |
Health Insurance Coverage by Household Income in West Concord
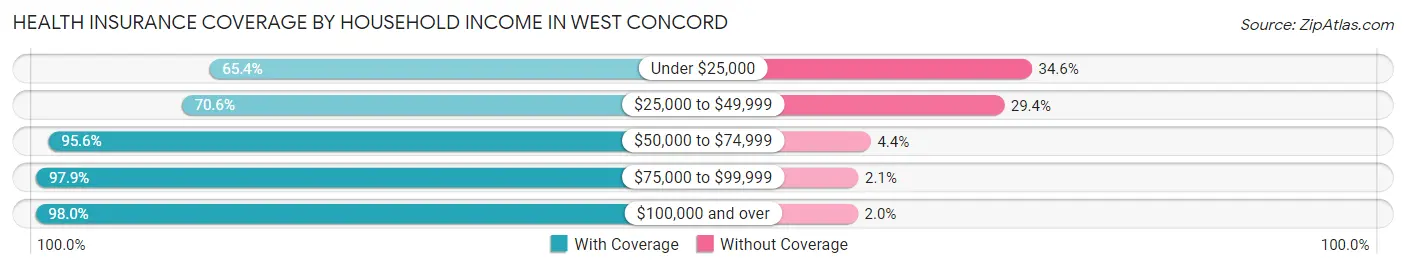
| Household Income | With Coverage | Without Coverage |
| Under $25,000 | 34 (65.4%) | 18 (34.6%) |
| $25,000 to $49,999 | 108 (70.6%) | 45 (29.4%) |
| $50,000 to $74,999 | 215 (95.6%) | 10 (4.4%) |
| $75,000 to $99,999 | 184 (97.9%) | 4 (2.1%) |
| $100,000 and over | 241 (98.0%) | 5 (2.0%) |
Public vs Private Health Insurance Coverage by Age in West Concord
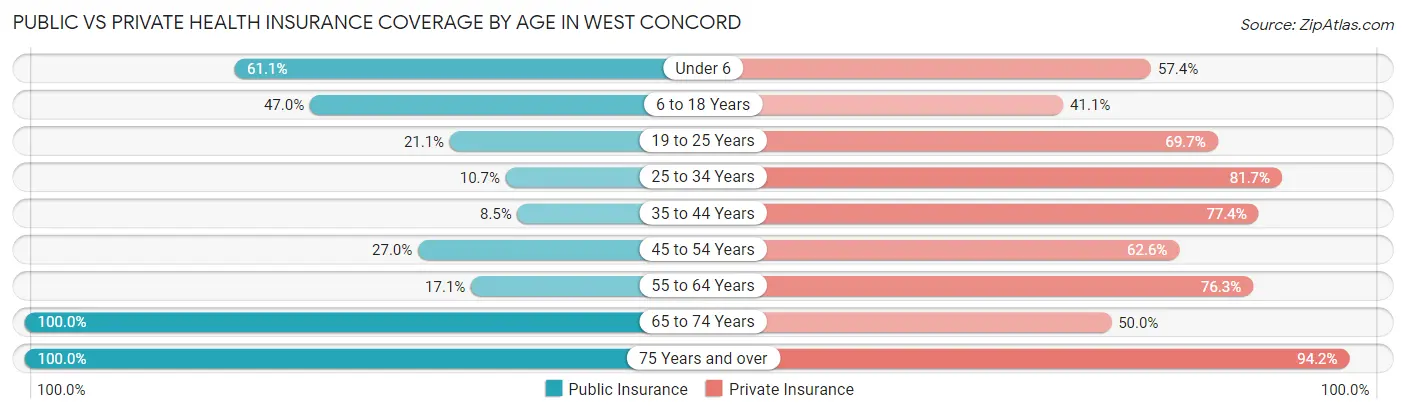
| Age Bracket | Public Insurance | Private Insurance |
| Under 6 | 33 (61.1%) | 31 (57.4%) |
| 6 to 18 Years | 95 (47.0%) | 83 (41.1%) |
| 19 to 25 Years | 16 (21.0%) | 53 (69.7%) |
| 25 to 34 Years | 14 (10.7%) | 107 (81.7%) |
| 35 to 44 Years | 9 (8.5%) | 82 (77.4%) |
| 45 to 54 Years | 31 (27.0%) | 72 (62.6%) |
| 55 to 64 Years | 13 (17.1%) | 58 (76.3%) |
| 65 to 74 Years | 44 (100.0%) | 22 (50.0%) |
| 75 Years and over | 69 (100.0%) | 65 (94.2%) |
| Total | 324 (37.1%) | 573 (65.6%) |
Disability Status by Sex by Age in West Concord
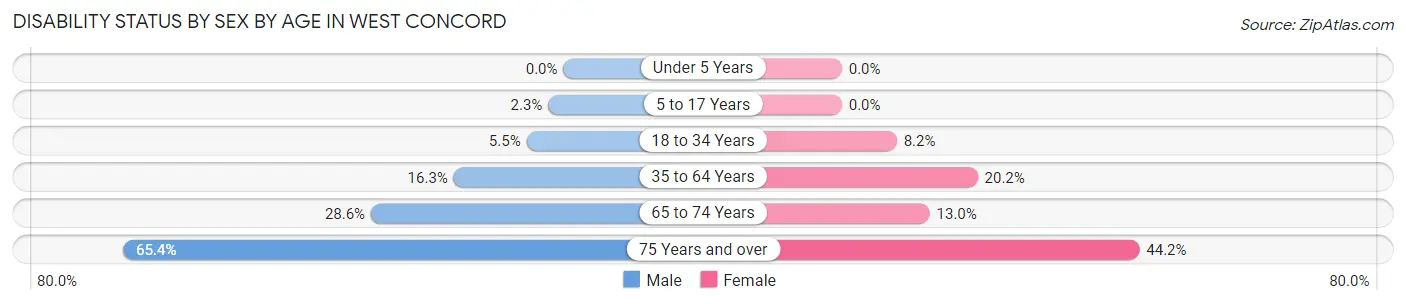
| Age Bracket | Male | Female |
| Under 5 Years | 0 (0.0%) | 0 (0.0%) |
| 5 to 17 Years | 2 (2.2%) | 0 (0.0%) |
| 18 to 34 Years | 7 (5.5%) | 8 (8.2%) |
| 35 to 64 Years | 29 (16.3%) | 24 (20.2%) |
| 65 to 74 Years | 6 (28.6%) | 3 (13.0%) |
| 75 Years and over | 17 (65.4%) | 19 (44.2%) |
Disability Class by Sex by Age in West Concord
Disability Class: Hearing Difficulty
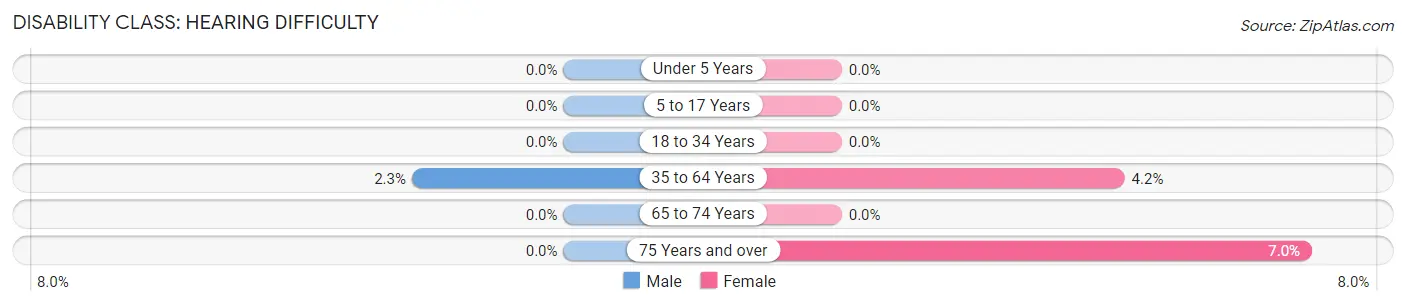
| Age Bracket | Male | Female |
| Under 5 Years | 0 (0.0%) | 0 (0.0%) |
| 5 to 17 Years | 0 (0.0%) | 0 (0.0%) |
| 18 to 34 Years | 0 (0.0%) | 0 (0.0%) |
| 35 to 64 Years | 4 (2.2%) | 5 (4.2%) |
| 65 to 74 Years | 0 (0.0%) | 0 (0.0%) |
| 75 Years and over | 0 (0.0%) | 3 (7.0%) |
Disability Class: Vision Difficulty
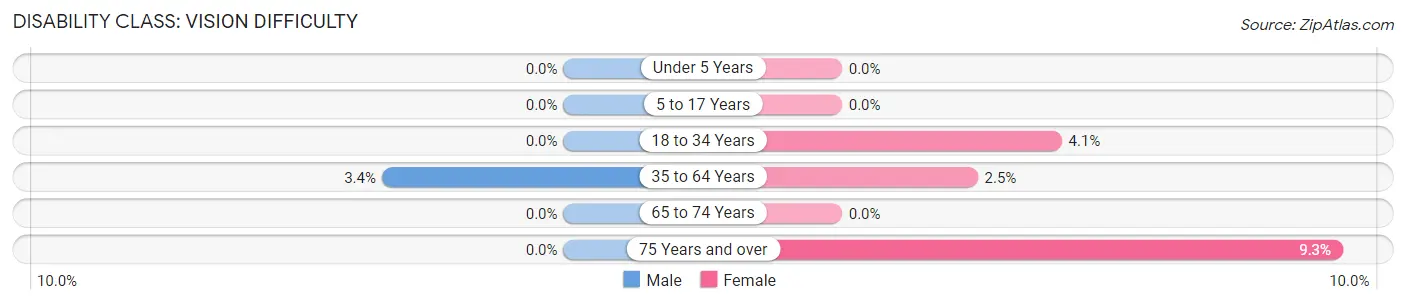
| Age Bracket | Male | Female |
| Under 5 Years | 0 (0.0%) | 0 (0.0%) |
| 5 to 17 Years | 0 (0.0%) | 0 (0.0%) |
| 18 to 34 Years | 0 (0.0%) | 4 (4.1%) |
| 35 to 64 Years | 6 (3.4%) | 3 (2.5%) |
| 65 to 74 Years | 0 (0.0%) | 0 (0.0%) |
| 75 Years and over | 0 (0.0%) | 4 (9.3%) |
Disability Class: Cognitive Difficulty
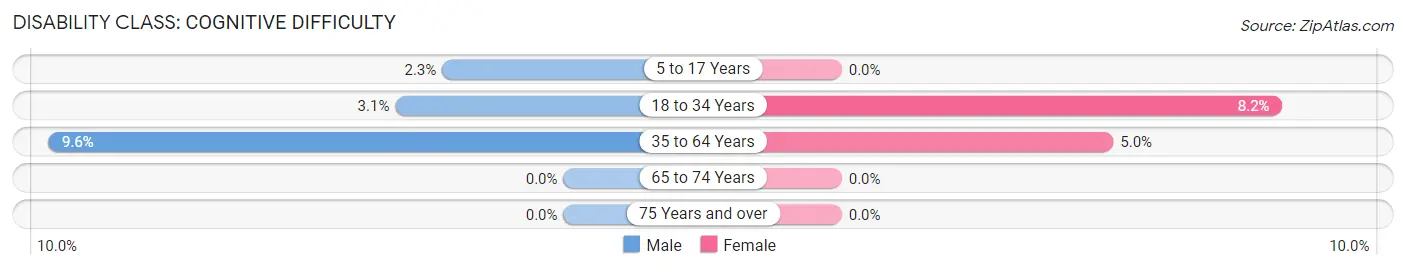
| Age Bracket | Male | Female |
| 5 to 17 Years | 2 (2.2%) | 0 (0.0%) |
| 18 to 34 Years | 4 (3.1%) | 8 (8.2%) |
| 35 to 64 Years | 17 (9.6%) | 6 (5.0%) |
| 65 to 74 Years | 0 (0.0%) | 0 (0.0%) |
| 75 Years and over | 0 (0.0%) | 0 (0.0%) |
Disability Class: Ambulatory Difficulty
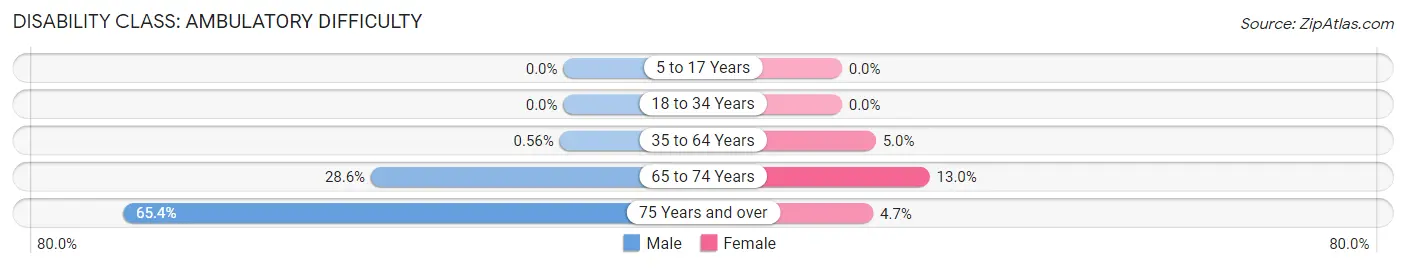
| Age Bracket | Male | Female |
| 5 to 17 Years | 0 (0.0%) | 0 (0.0%) |
| 18 to 34 Years | 0 (0.0%) | 0 (0.0%) |
| 35 to 64 Years | 1 (0.6%) | 6 (5.0%) |
| 65 to 74 Years | 6 (28.6%) | 3 (13.0%) |
| 75 Years and over | 17 (65.4%) | 2 (4.6%) |
Disability Class: Self-Care Difficulty
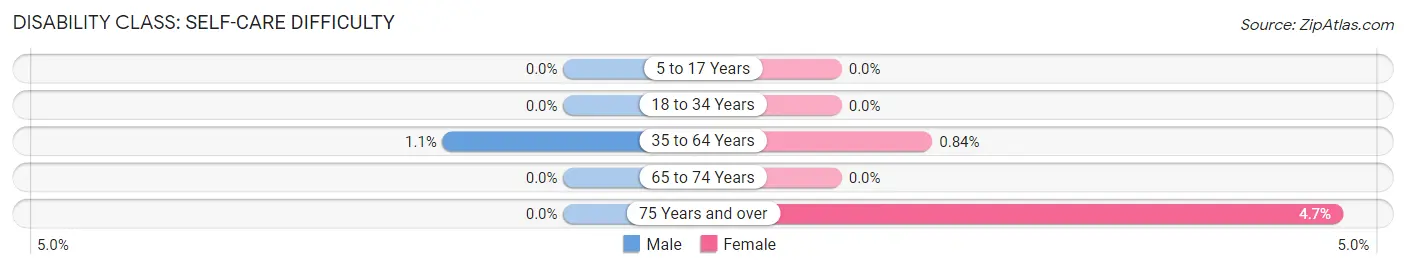
| Age Bracket | Male | Female |
| 5 to 17 Years | 0 (0.0%) | 0 (0.0%) |
| 18 to 34 Years | 0 (0.0%) | 0 (0.0%) |
| 35 to 64 Years | 2 (1.1%) | 1 (0.8%) |
| 65 to 74 Years | 0 (0.0%) | 0 (0.0%) |
| 75 Years and over | 0 (0.0%) | 2 (4.6%) |
Technology Access in West Concord
Computing Device Access in West Concord
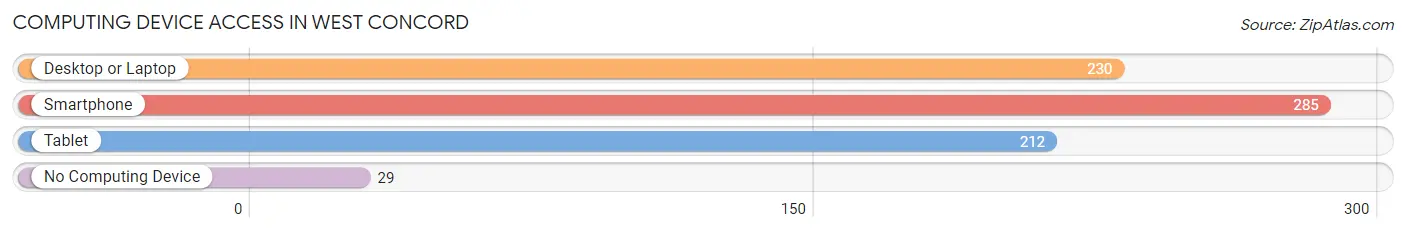
| Device Type | # Households | % Households |
| Desktop or Laptop | 230 | 70.3% |
| Smartphone | 285 | 87.2% |
| Tablet | 212 | 64.8% |
| No Computing Device | 29 | 8.9% |
| Total | 327 | 100.0% |
Internet Access in West Concord
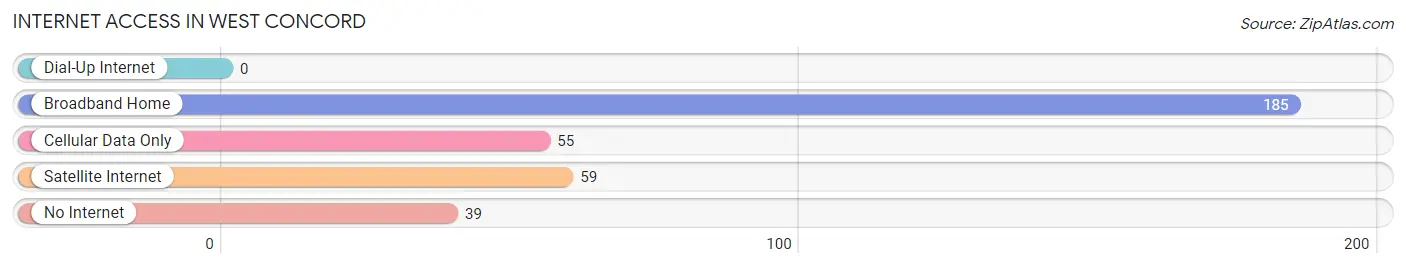
| Internet Type | # Households | % Households |
| Dial-Up Internet | 0 | 0.0% |
| Broadband Home | 185 | 56.6% |
| Cellular Data Only | 55 | 16.8% |
| Satellite Internet | 59 | 18.0% |
| No Internet | 39 | 11.9% |
| Total | 327 | 100.0% |
West Concord Summary
History
West Concord, Minnesota is a small city located in Dodge County, Minnesota. It is located about 30 miles south of the Twin Cities metropolitan area. The city was founded in 1856 by a group of settlers from New England. The city was originally known as West Concord Station, and was named after the nearby Concord Township. The city was incorporated in 1872.
The city was originally a farming community, and the main crops grown were wheat, corn, and oats. The city also had a number of small businesses, including a general store, a blacksmith shop, and a sawmill. The city was also home to a number of churches, including the First Congregational Church, which was founded in 1858.
In the late 19th century, the city began to grow and develop. The railroad arrived in 1881, and the city was connected to the Twin Cities by rail. This allowed for the growth of the city, and it soon became a popular destination for tourists. The city also became a popular destination for immigrants, and by the early 20th century, the city had a large population of German, Swedish, and Norwegian immigrants.
The city continued to grow and develop throughout the 20th century. In the 1950s, the city was home to a number of manufacturing plants, including a canning factory and a furniture factory. The city also had a number of small businesses, including a grocery store, a hardware store, and a drug store.
Geography
West Concord is located in Dodge County, Minnesota. It is located about 30 miles south of the Twin Cities metropolitan area. The city is situated on the banks of the Cannon River, and is surrounded by rolling hills and farmland. The city has a total area of 2.2 square miles, and has a population of 1,845 people, as of the 2010 census.
The city is located in a humid continental climate zone, and has four distinct seasons. Summers are warm and humid, with temperatures reaching into the 80s and 90s. Winters are cold and snowy, with temperatures dropping into the single digits. The city receives an average of 33 inches of precipitation per year, and has an average snowfall of 40 inches.
Economy
West Concord’s economy is largely based on agriculture and manufacturing. The city is home to a number of small businesses, including a grocery store, a hardware store, and a drug store. The city also has a number of manufacturing plants, including a canning factory and a furniture factory.
The city is also home to a number of tourist attractions, including the West Concord Historical Museum, the West Concord Arts Center, and the West Concord Public Library. The city also has a number of parks and recreational areas, including the West Concord Park and the West Concord Nature Center.
Demographics
As of the 2010 census, West Concord had a population of 1,845 people. The racial makeup of the city was 97.3% White, 0.7% African American, 0.3% Native American, 0.2% Asian, 0.1% Pacific Islander, 0.4% from other races, and 1.0% from two or more races. Hispanic or Latino of any race were 1.2% of the population.
The median household income in West Concord was $50,938, and the median family income was $60,938. The per capita income for the city was $25,938. About 8.3% of families and 10.2% of the population were below the poverty line, including 14.2% of those under age 18 and 6.2% of those age 65 or over.
Common Questions
What is Per Capita Income in West Concord?
Per Capita income in West Concord is $32,190.
What is the Median Family Income in West Concord?
Median Family Income in West Concord is $83,750.
What is the Median Household income in West Concord?
Median Household Income in West Concord is $75,625.
What is Income or Wage Gap in West Concord?
Income or Wage Gap in West Concord is 30.0%.
Women in West Concord earn 70.0 cents for every dollar earned by a man.
What is Inequality or Gini Index in West Concord?
Inequality or Gini Index in West Concord is 0.38.
What is the Total Population of West Concord?
Total Population of West Concord is 873.
What is the Total Male Population of West Concord?
Total Male Population of West Concord is 458.
What is the Total Female Population of West Concord?
Total Female Population of West Concord is 415.
What is the Ratio of Males per 100 Females in West Concord?
There are 110.36 Males per 100 Females in West Concord.
What is the Ratio of Females per 100 Males in West Concord?
There are 90.61 Females per 100 Males in West Concord.
What is the Median Population Age in West Concord?
Median Population Age in West Concord is 32.9 Years.
What is the Average Family Size in West Concord
Average Family Size in West Concord is 3.4 People.
What is the Average Household Size in West Concord
Average Household Size in West Concord is 2.6 People.
How Large is the Labor Force in West Concord?
There are 393 People in the Labor Forcein in West Concord.
What is the Percentage of People in the Labor Force in West Concord?
58.6% of People are in the Labor Force in West Concord.
What is the Unemployment Rate in West Concord?
Unemployment Rate in West Concord is 4.8%.